
Sample Category Title
Risk-On Sentiment Prevails in US, Mixed Trends in Asia, Sterling Eyes UK CPI
Robust risk-on sentiment was seen in the US markets overnight, with DOW extending its record-breaking run. S&P 500 is also approaching its historical peak, now just 50 points shy, and appears poised to challenge this high. The bullish momentum is underpinned by messages from Fed officials, suggesting that while an immediate rate cut is not anticipated, policy easing should be on the horizon for the second half of next year. This scenario hinges on the continued cooling of inflation as a trend as per current expectations.
In Asia, market responses are more varied. Nikkei in Japan is having over 1.5% rise, largely benefiting from BoJ's continued dovish stance, which also drags down 10-year JGB yield notably. However, this positive sentiment is not uniformly reflected across all Asian markets. Hong Kong stocks are seeing a rebound, while markets in China and Singapore are showing signs of weakness.
In the currency markets, New Zealand Dollar and the Australian Dollar are leading as the strongest currencies for the week, with Swiss Franc also showing strength. In contrast, Japanese Yen is the weakest performer, followed by Dollar and Canadian. Euro and British Sterling are positioned in the middle, with mixed performances. Sterling's next move, particularly against Euro and Swiss Franc, is likely to be influenced by today's UK CPI data.
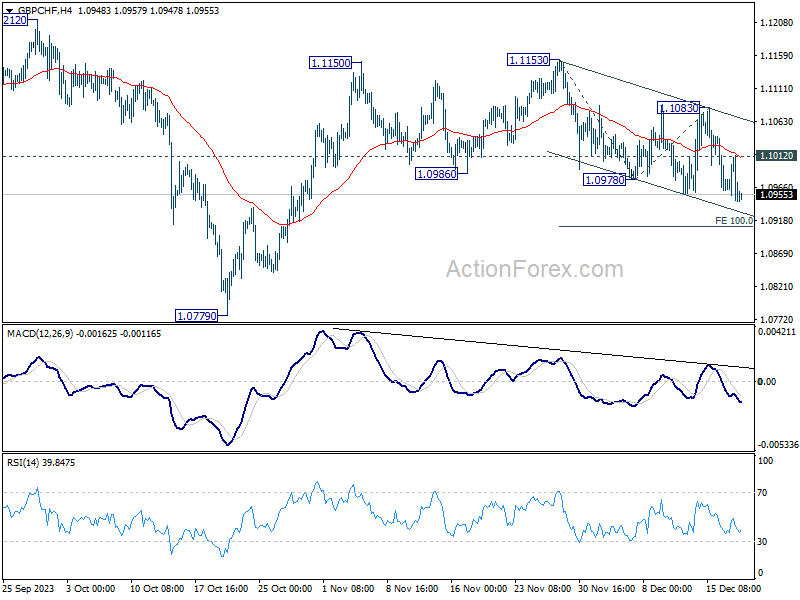
Technically, GBP/CHF's fall from 1.1153 is in still in progress. This decline is currently seen as a corrective move. Thus, downside should be contained by 100% projection of 1.1153 to 1.0978 from 1.1083 at 1.0910 to bring rebound. Break of 1.1012 minor resistance will bring stronger rise to 1.1083. However, decisive break of 1.0910 will argue that whole rise from 1.0779 has already completed and bring retest of this low instead.
In Asia, at the time of writing, Nikkei is up 1.60%. Hong Kong HSI is up 1.10%. China Shanghai SSE is down -0.42%. Singapore Strait Times is down -0.02%. Japan 10-year JGB yield is down -0.0745. Overnight, DOW rose 0.68%. S&P 500 rose 0.59%. NASDAQ rose 0.66%. 10-year yield fell -0.032 to 3.922.
Fed's Bostic: No rush to cut rates, eyes second half of 2024 for easing
Atlanta Fed President Raphael Bostic emphasized a lack of urgency in cutting interest rates, projecting potential rate reductions only in the second half of 2024.
In an event overnight, Bostic expressed his view that inflation is likely to decrease gradually over the next six months. This outlook underpins his stance that there is no immediate need to deviate from the current restrictive monetary policy.
"For me, I'm thinking inflation is going to come down relatively slowly in the next six months, which means there's not going to be urgency for us to pull off our restrictive stance," he stated.
Bostic anticipates that Fed might implement two rate cuts in the latter half of 2024. However, he clarified, "It is not like there has been an active discussion on this."
Highlighting the prevailing economic uncertainties, Bostic advocated for a "cautious but resolute" approach. This strategy involves a resistance to reacting hastily to individual data points and instead focuses on making sure "the trends are really trends."
Fed's Barkin seeks consistency and breath in disinflation for policy decisions
Richmond Fed President Thomas Barkin, in an interview with Yahoo Finance, acknowledged that the Fed is making "good progress" in its efforts to bring down inflation.
However, he pointed out that the economic data has been somewhat erratic, emphasizing his desire for "consistency" and "breadth" in the inflation metrics. He explained that he is looking for "consistency around our target and a broad-based disinflationary set of results."
On the topic of interest rate cuts, Barkin's stance was cautious and data-dependent. He suggested that a response from Fed would be appropriate if inflation trends downwards as hoped. However, he stressed the unpredictability of economic data
"If you're going to assume that inflation comes down nicely, then, of course, we'd respond appropriately. You know, I don't assume what the data is going to do. We'll see what happens," he said.
Fed's Goolsbee cautions against market euphoria on rate cuts
Chicago Fed President Austan Goolsbee, in an interview with Fox News overnight, said that investors might be "a little ahead of themselves" with their "euphoria" as stock markets surged to record highs following Fed's announcement last week.
Goolsbee did acknowledge that if inflation continues its downward trend towards target, Fed might reassess its restrictive stance. "If inflation continues to come down to target, then the Fed can reconsider how restrictive it wants to be," he stated.
However, Goolsbee was clear in emphasizing Fed's independence, asserting that the central bank will not be "bullied" by market pressures.
Japan's divergent export trend: 26 months of US growth, 12 months of China decline
Japan's trade statistics for November were marked by a slight decline in exports and a more significant drop in imports. Exports fell marginally by -0.2% yoy, totaling JPY 8829B, marking the first drop in three months.
A closer look at export destinations shows contrasting trends. Exports to US continued to grow, marking a 5.3% increase and extending the expansion streak to 26 months. In contrast, exports to China fell by -2.2%, continuing a downward trend for the 12th consecutive month. One of the most notable declines was in food shipments, which plummeted by -60.3%, significantly impacted by China's ban on Japanese seafood imports.
On the import side, Japan saw a more pronounced decline of -11.9% yoy, with total imports amounting to JPY 9597B. This reduction in imports contributed to a trade deficit of JPY -777B for the month.
When adjusted for seasonal variations, exports dropped by -1.8% mom to JPY 8567B, and imports decreased by -2.7% mom to JPY 8976B. Consequently, trade deficit narrowed from JPY -501B to JPY -409B.
Australia's Westpac leading index climbs to 0.3%, signaling stabilization, not an upturn
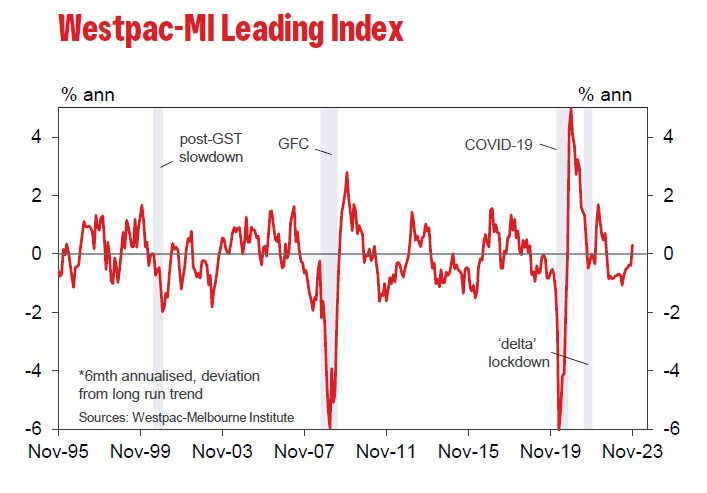
Westpac Leading Index in Australia showed an encouraging rise from -0.39% to 0.30% in November, marking the first positive, above-trend reading since mid-2022. However, Westpac cautioned that this uptick might be influenced by temporary factors. Also, the shift in underlying momentum, as RBA's tightening begins to slow, is seen more as a stabilization rather than the start of an upturn.
Further, Westpac highlighted weaker conditions in the domestic sphere, particularly impacting the household sector. This weakness is expected to continue into the first half of next year. Hence, Westpac anticipates that barring a "truly disastrous" December quarter CPI update, RBA is likely to maintain its current policy in the upcoming February meeting.
RBNZ's Orr highlights struggle with core inflation and migration impact
RBNZ Governor Adrian Orr, in his address to a parliament select committee today, emphasized there is "still a long way to go" to curb inflation. He added, "it's core inflation that's going to be our challenge ahead".
Orr also noted the complexity of this challenge, pointing out that much of the core inflation factors are entrenched within central and local government influences, including rates and taxes. He cautioned that tackling these elements in the "last five yards on the inflation battle is going to be tough."
Adding to the economic challenges, Orr highlighted the current record-high levels of net inward migration in New Zealand. This surge in migration has surpassed RBNZ's expectations and presents additional complexities for monetary policy, housing demand, asset prices, and the general inflation outlook.
Regarding the country's economic growth, Orr mentioned that GDP was "surprisingly subdued," with a contraction of -0.3% in Q3. He indicated that RBNZ is internalizing this complex situation and will provide more detailed insights in their monetary policy statement due in February.
AUD/USD Daily Report
Daily Pivots: (S1) 0.6718; (P) 0.6746; (R1) 0.6792; More...
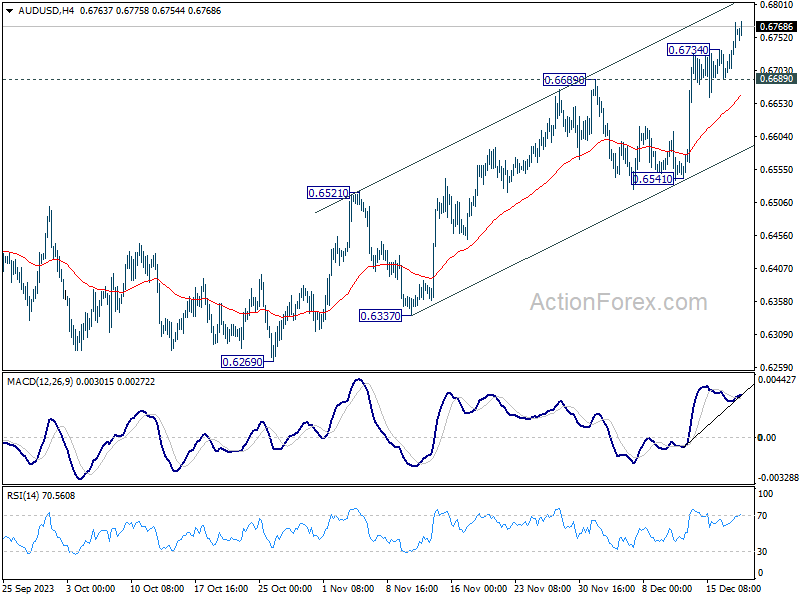
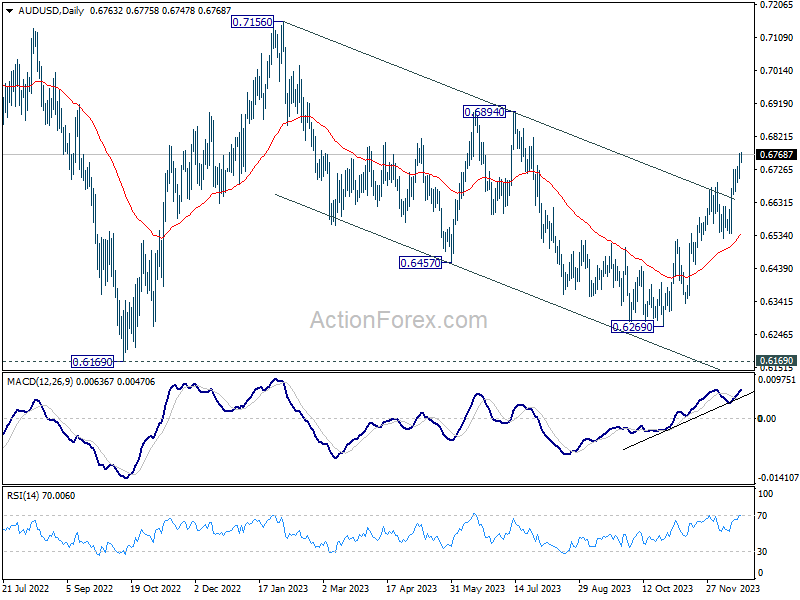
AUD/USD's rally resumed after brief retreat and intraday bias is back on the upside. As noted before, fall from 0.7156 could have completed with three waves down to 0.6269. Further rise should be seen to 0.6894 resistance first. Sustained break there will target 0.7156 next. On the downside, below 0.6689 minor support will turn intraday bias neutral for consolidations again. But outlook will remain mildly bullish as long as 0.6541 support holds, in case of retreat.
In the bigger picture, there is no confirmation that down trend from 0.8006 (2021 high) has completed. Price actions from 0.6169 (2022 low) could be just a medium term corrective pattern. Rise from 0.6269 is seen as the third leg of the pattern. For now, range trading should be seen between 0.6169 and 0.7156 (2023 high), until further developments.
Economic Indicators Update
| GMT | Ccy | Events | Actual | Forecast | Previous | Revised |
|---|---|---|---|---|---|---|
| 23:50 | JPY | Trade Balance (JPY) Nov | -0.41T | -0.75T | -0.46T | -0.50T |
| 00:00 | AUD | Westpac Leading Index M/M Nov | 0.10% | 0.00% | ||
| 07:00 | EUR | Germany Gfk Consumer Climate Jan | -27 | -27.8 | ||
| 07:00 | EUR | Germany PPI M/M Nov | -0.40% | -0.10% | ||
| 07:00 | EUR | Germany PPI Y/Y Nov | -7.50% | -11% | ||
| 07:00 | GBP | CPI M/M Nov | 0.20% | 0.00% | ||
| 07:00 | GBP | CPI Y/Y Nov | 4.30% | 4.60% | ||
| 07:00 | GBP | Core CPI Y/Y Nov | 5.50% | 5.70% | ||
| 07:00 | GBP | RPI M/M Nov | 0.30% | -0.20% | ||
| 07:00 | GBP | RPI Y/Y Nov | 5.80% | 6.10% | ||
| 07:00 | GBP | PPI Input M/M Nov | -0.60% | 0.40% | ||
| 07:00 | GBP | PPI Input Y/Y Nov | -3.30% | -2.60% | ||
| 07:00 | GBP | PPI Output M/M Nov | -0.10% | 0.10% | ||
| 07:00 | GBP | PPI Output Y/Y Nov | -0.50% | -0.60% | ||
| 07:00 | GBP | PPI Core Output M/M Nov | 0.10% | |||
| 07:00 | GBP | PPI Core Output Y/Y Nov | 0.20% | |||
| 09:00 | EUR | Eurozone Current Account (EUR) Oct | 27.0B | 31.2B | ||
| 13:30 | USD | Current Account (USD) Q3 | -197B | -212B | ||
| 15:00 | USD | Existing Home Sales Nov | 3.78M | 3.79M | ||
| 15:00 | USD | Consumer Confidence Dec | 103.9 | 102 | ||
| 15:00 | EUR | Eurozone Consumer Confidence Dec P | -16.5 | -16.9 | ||
| 15:30 | USD | Crude Oil Inventories | -4.3M | |||
| 18:30 | CAD | BoC Summary of Deliberations |
Nasdaq (NQ) Short Term Should Remain Supported
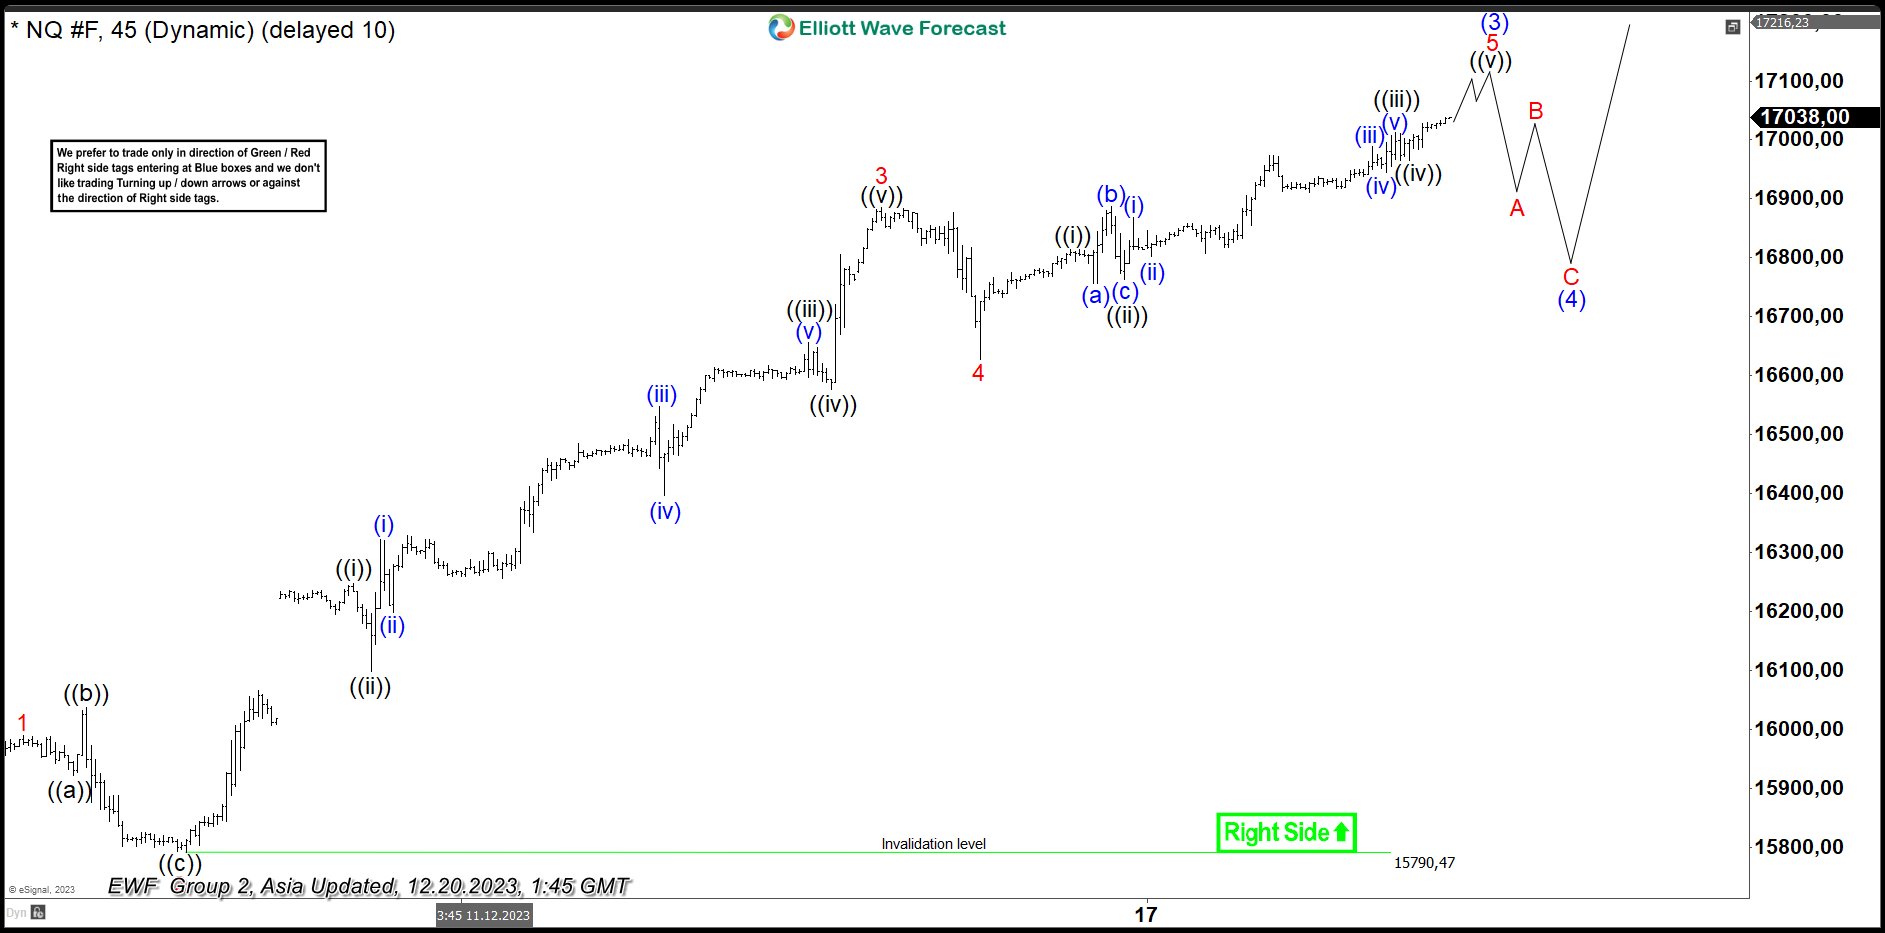
Short Term Elliott Wave View in Nasdaq (NQ) shows a bullish sequence from 10.26.2023 low favoring further upside. Up from 10.26.2023 low, wave (1) ended at 16208.5 and dips in wave (2) ended at 15721.25. Wave (3) is in progress as the 45 minutes chart below shows. Internal subdivision of wave (3) is unfolding as a 5 waves impulse Elliott Wave structure. Up from wave (2), wave 1 ended at 15989.75 and pullback in wave 2 ended at 15790.47. Index then resumes higher in wave 3.
Up from wave 2, wave ((i)) ended at 16247.50 and dips in wave ((ii)) ended at 16098. Index then resumed higher in wave ((iii)) towards 16657.25 and pullback in wave ((iv)) ended at 16576. Final leg wave ((v)) ended at 16885 which completed wave 3. Pullback in wave 4 ended at 16628. Wave 5 higher is in progress as an impulse in lesser degree. Up from wave 4, wave ((i)) ended at 16813.5 and pullback in wave ((ii)) ended at 16762.50. Index then resumed higher in wave ((iii)) towards 17012.5 and dips in wave ((iv)) ended at 16965.25. Expect the Index to extend higher in wave ((v)) which should complete wave 5 of (3). Afterwards, it should pullback in wave (4) to correct cycle from 12.4.2023 low in 3, 7, or 11 swing before the rally resumes. Near term, as far as pivot at 15790.47 low stays intact, expect the Index to extend higher.
Nasdaq (NQ) 60 Minutes Elliott Wave Chart
NQ Elliott Wave Video
https://www.youtube.com/watch?v=QARm_TgEY5s
Technical Outlook and Review
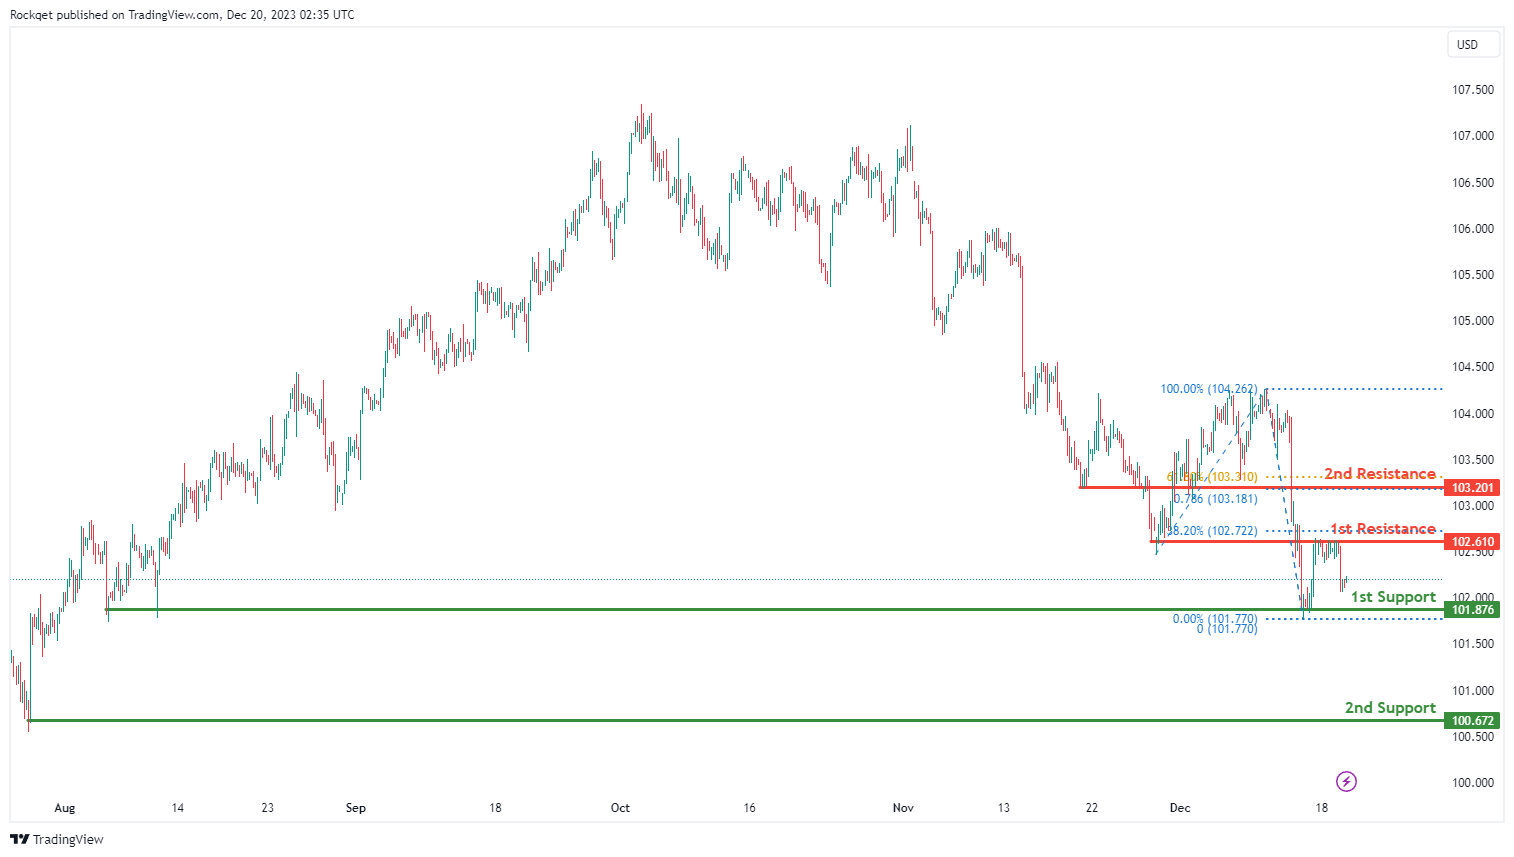
DXY:
The DXY (US Dollar Index) chart currently shows an overall bearish momentum, indicating a potential for price to make a bearish continuation towards the 1st support.
The 1st support level at 101.87 is identified as a multi-swing-low support. Further below, the 2nd support level at 100.67 is noted as a swing-low, further reinforcing its importance as a potential key support level.
To the upside, the 1st resistance level at 102.61 is identified as an overlap resistance that aligns close to the 38.20% Fibonacci retracement level. Higher up, the 2nd resistance level at 103.20 is also marked as an overlap resistance that aligns with a confluence of Fibonacci levels i.e. the 61.80% retracement and the 78.60% projection levels, suggesting a potential barrier for further upside movement.
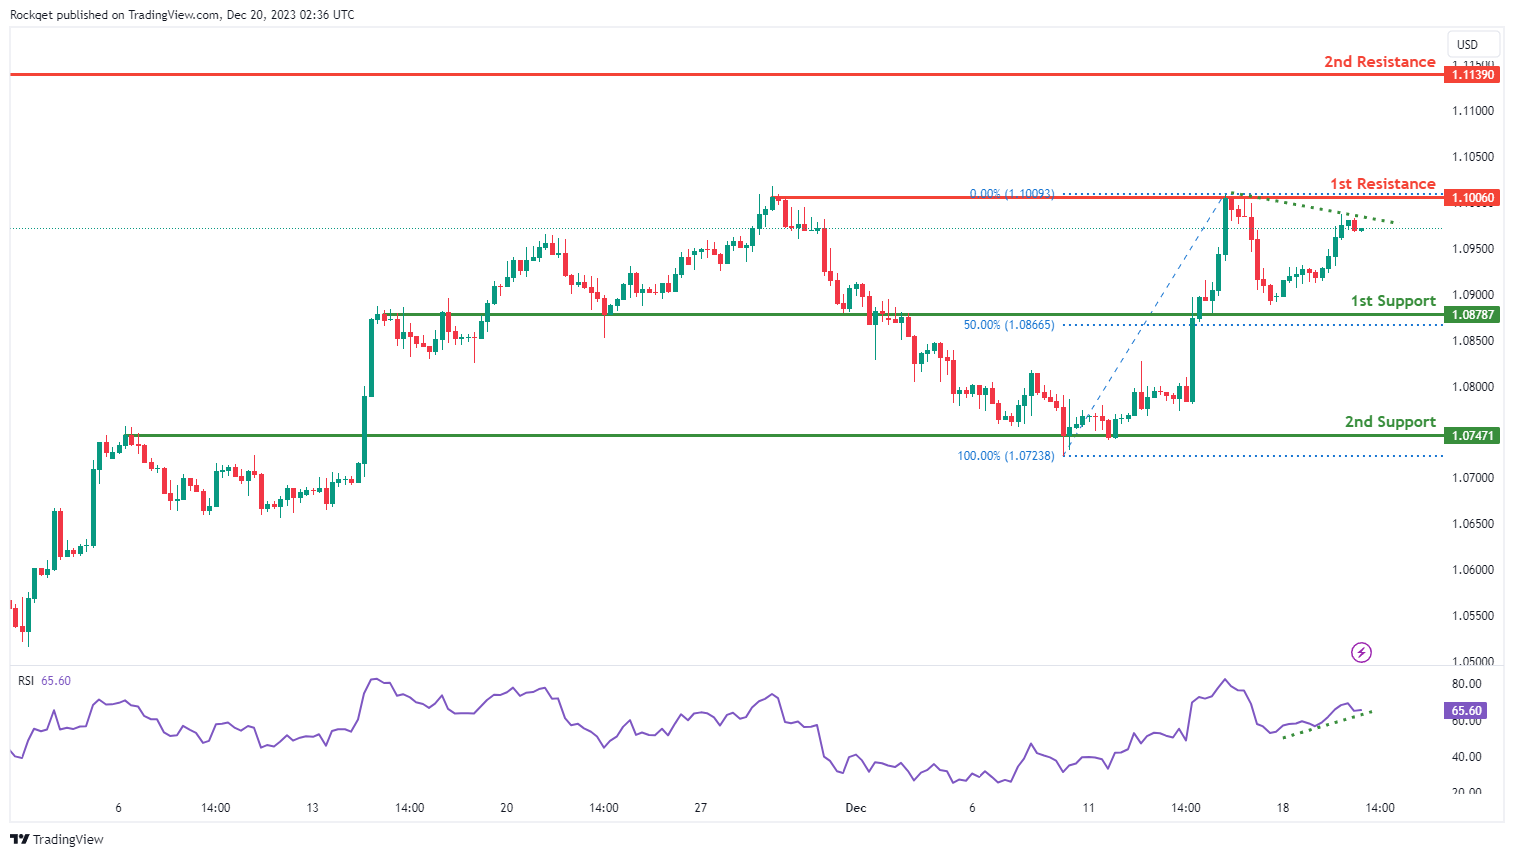
EUR/USD:
The EUR/USD chart currently exhibits an overall bullish momentum. In this context, there is a potential scenario for price to make a bullish continuation towards the 1st resistance. Additionally, the Relative Strength Indicator (RSI) is also demonstrating a bullish divergence versus price, suggesting a potential for a continued bullish momentum.
The 1st resistance level at 1.1006 is identified as a multi-swing-high resistance. Higher up, the 2nd resistance level at 1.1139 is noted as a swing-high resistance, suggesting a potential barrier for further upside movement.
To the downside, the 1st support level at 1.0878 is identified as an overlap support that aligns close to the 50.00% Fibonacci retracement level. Further below, the 2nd support level at 1.0747 is also marked as an overlap support, further reinforcing its importance as a potential key support level.
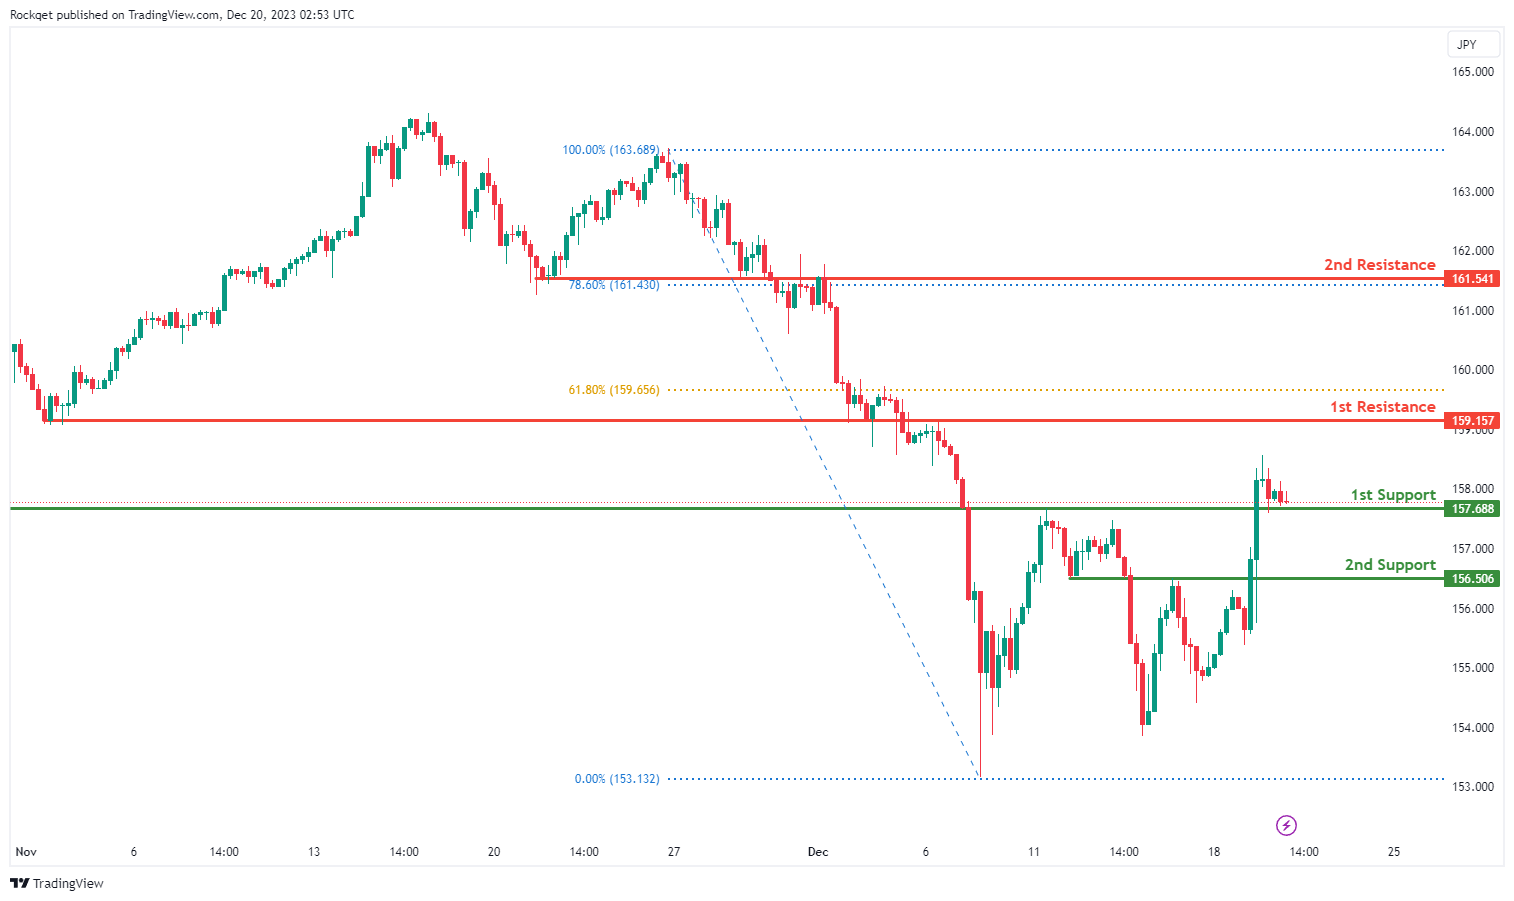
EUR/JPY:
The EUR/JPY chart currently exhibits a bullish overall momentum, suggesting a potential scenario for a short-term drop to the 1st support before bouncing and rising to the 1st resistance.
The 1st support at 157.69 is considered significant as it represents a pullback support. This level indicates a historical area where buying interest has been present, reinforcing its potential as a crucial support zone.
Similarly, the 2nd support at 156.51 is identified as another pullback support, providing an additional layer of potential support for the currency pair.
On the resistance side, the 1st resistance at 159.16 is associated with a pullback resistance and coincides with the 61.80% Fibonacci Retracement level. This level may act as a barrier where selling interest could intensify, potentially causing a temporary pause or reversal in the bullish trend.
Furthermore, the 2nd resistance at 161.54 is characterized as an overlap resistance and aligns with the 78.60% Fibonacci Retracement level, suggesting increased resistance in this area.
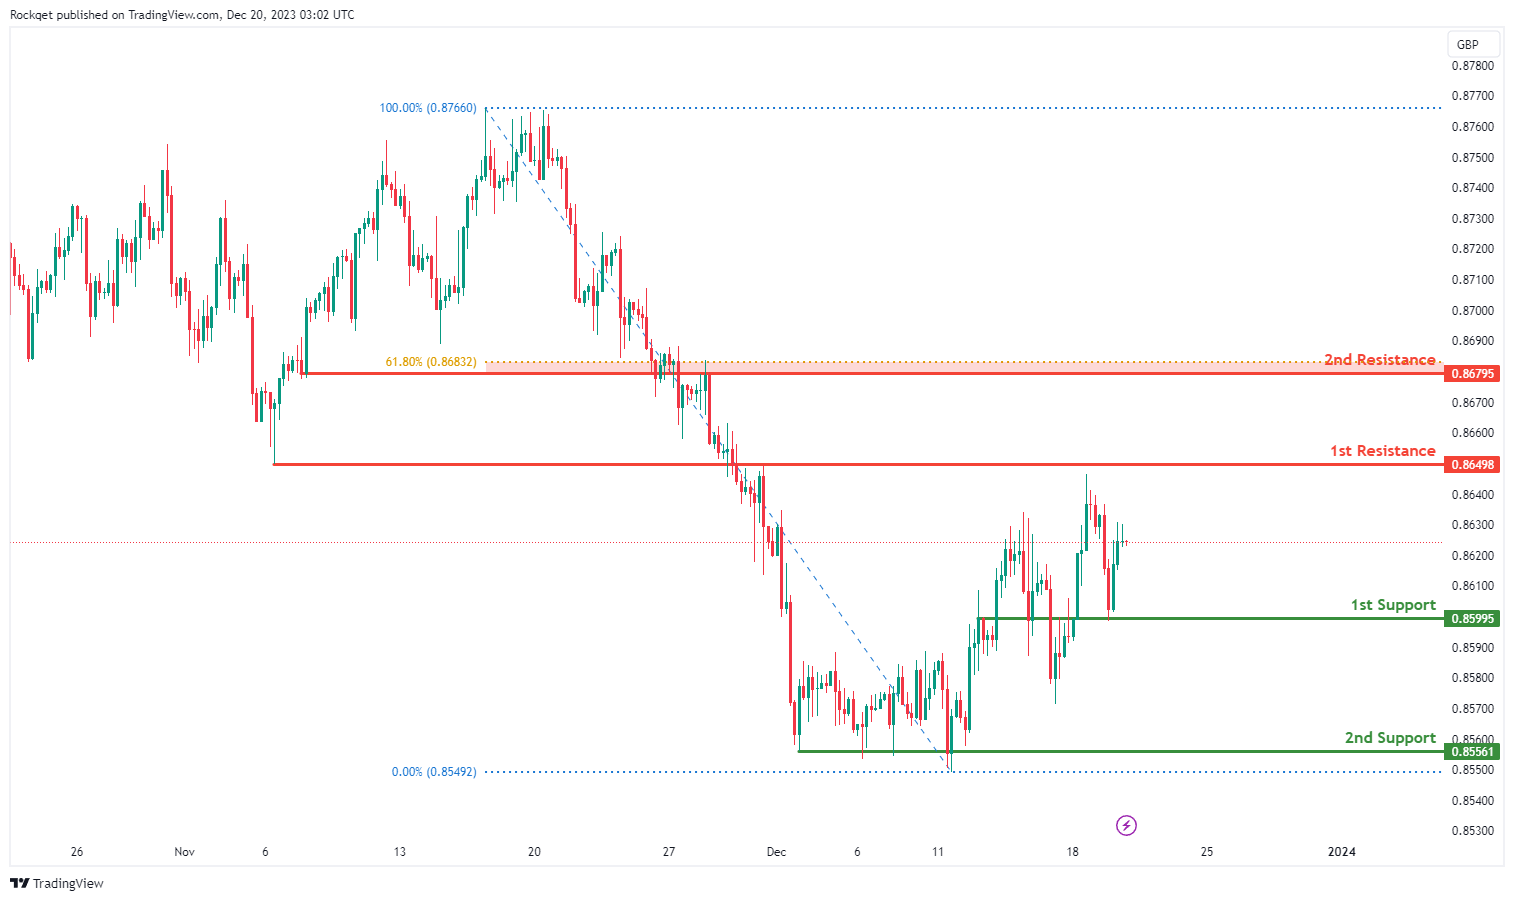
EUR/GBP:
The EUR/GBP chart currently has a bearish overall momentum, indicating a potential scenario for a bearish continuation towards the 1st support.
The 1st support at 0.8600 is considered significant as it represents an overlap support. This level indicates a historical area where buying interest has been present, reinforcing its potential as a crucial support zone.
Similarly, the 2nd support at 0.8556 is identified as a multi-swing low support, providing an additional layer of potential support for the currency pair.
On the resistance side, the 1st resistance at 0.8650 is associated with an overlap resistance, suggesting an area where selling interest could intensify, potentially causing a temporary pause or reversal in the bearish trend.
Additionally, the 2nd resistance at 0.8680 is characterized as an overlap resistance and aligns with the 61.80% Fibonacci Retracement level, suggesting increased resistance in this area.
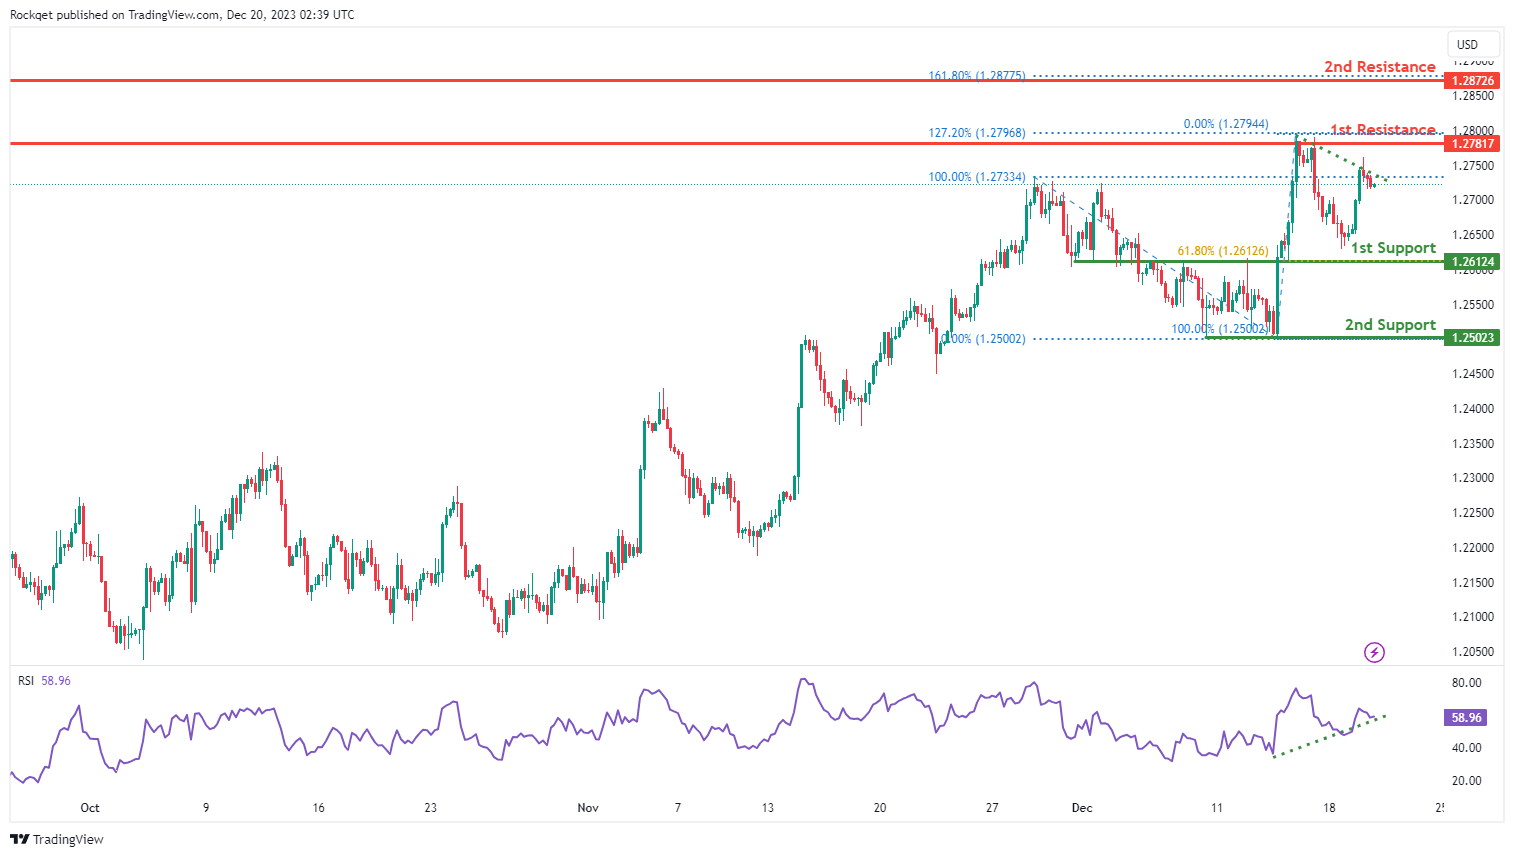
GBP/USD:
The GBP/USD chart currently exhibits an overall bullish momentum. In this context, there is a potential scenario for price to make a bullish continuation towards the 1st resistance. Additionally, the Relative Strength Indicator (RSI) is also demonstrating a bullish divergence versus price, suggesting a potential for a continued bullish momentum.
The 1st resistance level at 1.2781 is identified as a multi-swing-high resistance that aligns with the 127.20% Fibonacci extension level. Higher up, the 2nd resistance level at 1.2872 is noted as a pullback resistance that aligns with the 161.80% Fibonacci extension level, suggesting a potential barrier for further upside movement.
To the downside, the 1st support level at 1.2612 is identified as an overlap support that aligns with the 61.80% Fibonacci retracement level. Further below, the 2nd support level at 1.2502 is marked as a swing-low support, further reinforcing its importance as a potential key support level.
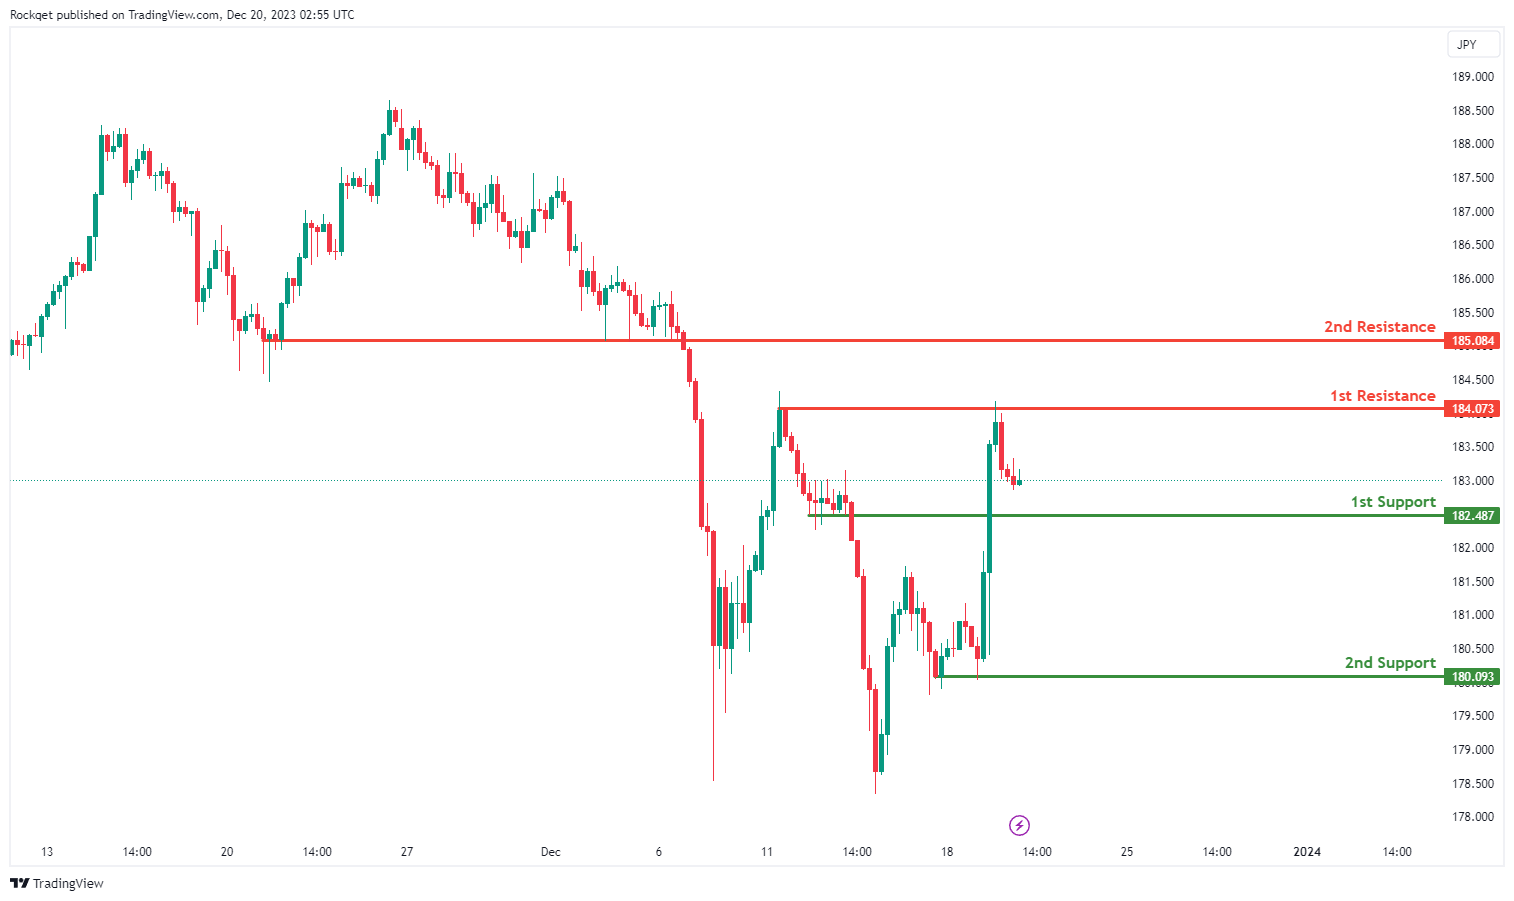
GBP/JPY:
The GBP/JPY chart currently exhibits a weak bearish overall momentum with low confidence, suggesting a potential scenario for a bearish continuation towards the 1st support.
The 1st support at 182.49 is considered significant as it represents a pullback support. This level indicates a historical area where buying interest has been present, reinforcing its potential as a crucial support zone.
Similarly, the 2nd support at 176.40 is identified as a pullback support, providing an additional layer of potential support for the currency pair.
On the resistance side, the 1st resistance at 184.07 is associated with a multi-swing high resistance, suggesting an area where selling interest could intensify, potentially causing a temporary pause or reversal in the bearish trend.
Additionally, the 2nd resistance at 185.08 is characterized as a pullback resistance, adding another layer of potential resistance in the vicinity.
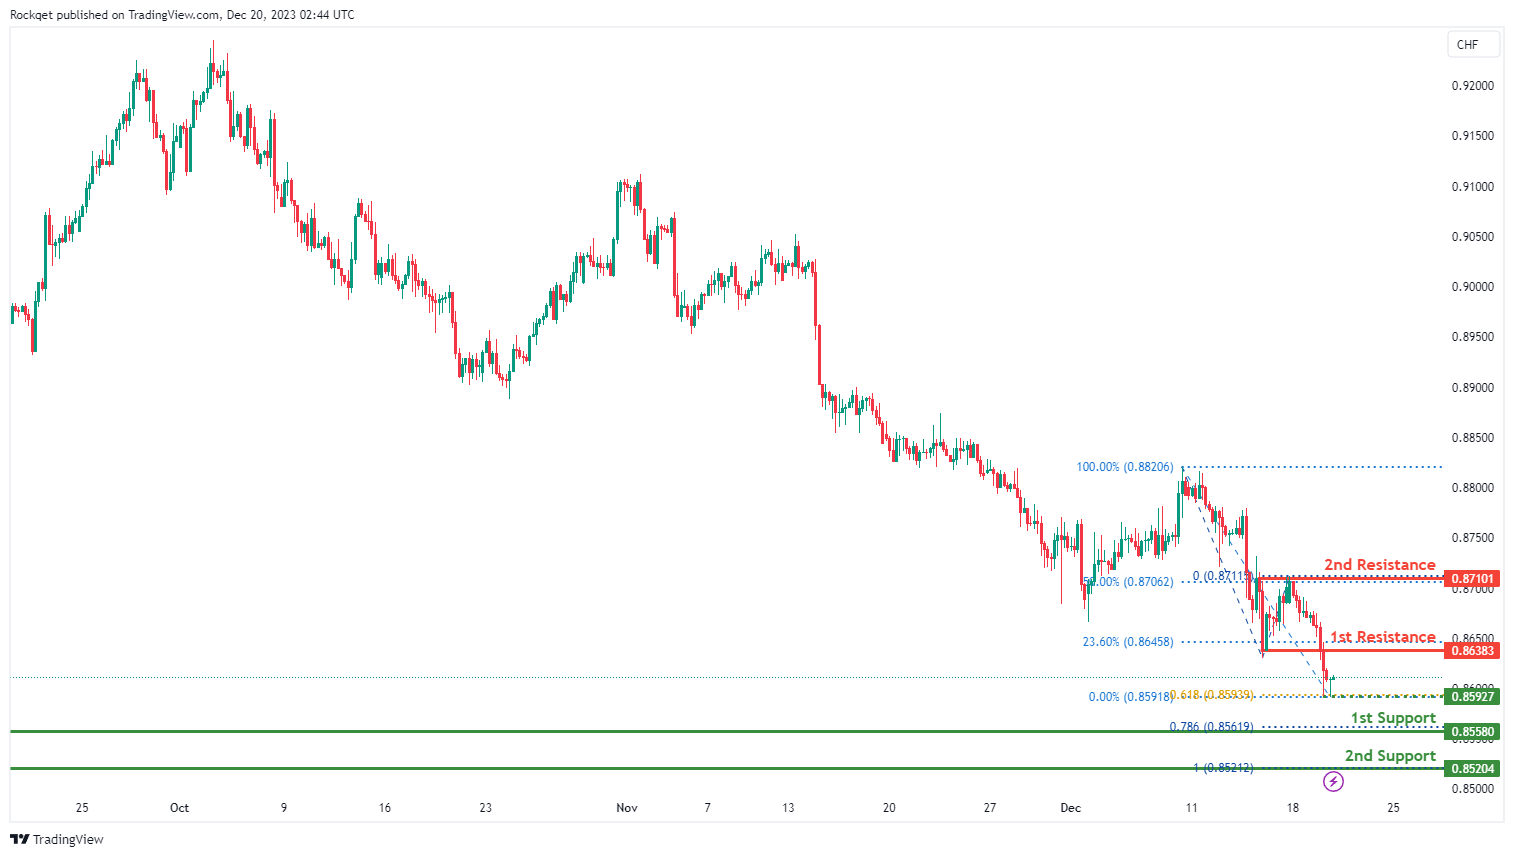
USD/CHF:
The USD/CHF chart currently exhibits an overall bearish momentum. In this context, there is a potential scenario for price to make a bearish continuation towards the 1st support.
The intermediate support level at 0.8592 is identified as a pullback support that aligns with the 61.80% Fibonacci projection level while the 1st support level at 0.8558 is marked as a multi-swing-low support that aligns with the 78.60% Fibonacci projection level. Further below, the 2nd support level at 0.8520 is noted as a swing-low support that aligns with the 100.00% Fibonacci projection level, further reinforcing its importance as a key support level.
To the upside, the 1st resistance level at 0.8638 is identified as a pullback resistance that aligns with the 23.60% Fibonacci retracement level. Higher up, the 2nd resistance level at 0.8710 is also marked as a pullback resistance that aligns with the 50.00% Fibonacci retracement level, suggesting a potential barrier for further upside movement.
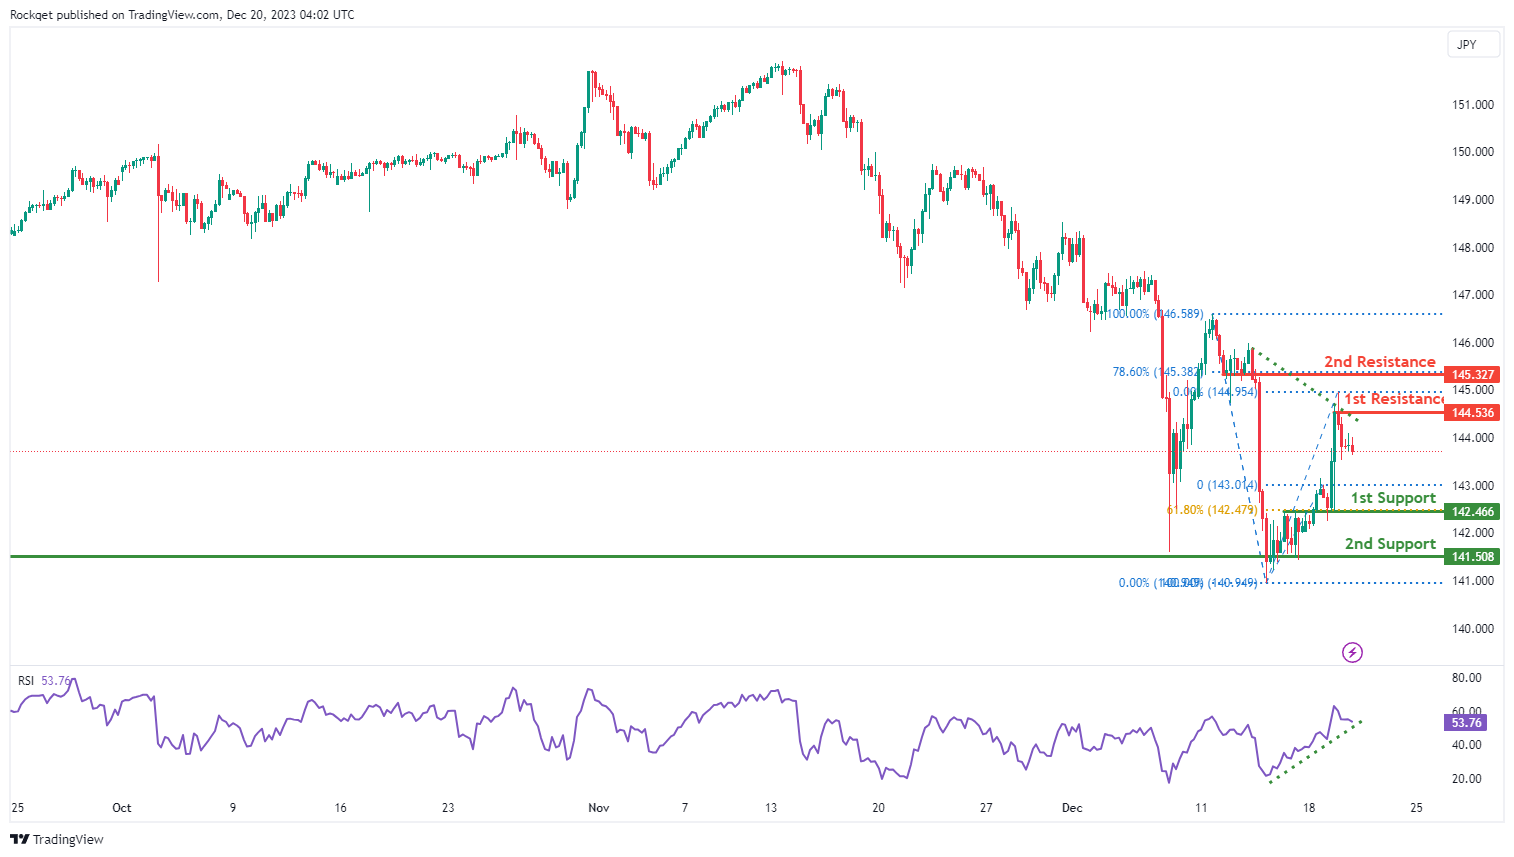
USD/JPY:
The USD/JPY chart currently exhibits an overall bullish momentum, indicating a potential for price to make a bullish continuation towards the 1st resistance. Additionally, the Relative Strength Indicator (RSI) is also demonstrating a bullish divergence versus price, suggesting a potential for a continued bullish momentum.
The 1st resistance level at 144.53 is identified as a pullback resistance. Higher up, the 2nd resistance level at 145.32 is also marked as a pullback resistance that aligns with the 78.60% Fibonacci retracement level, suggesting a potential barrier for further upside movement.
To the downside, the 1st support level at 142.46 is identified as an overlap support that aligns with the 61.80% Fibonacci retracement level. Further below, the 2nd support level at 141.50 is noted as a multi-swing-low support, further reinforcing its importance as a key support level.
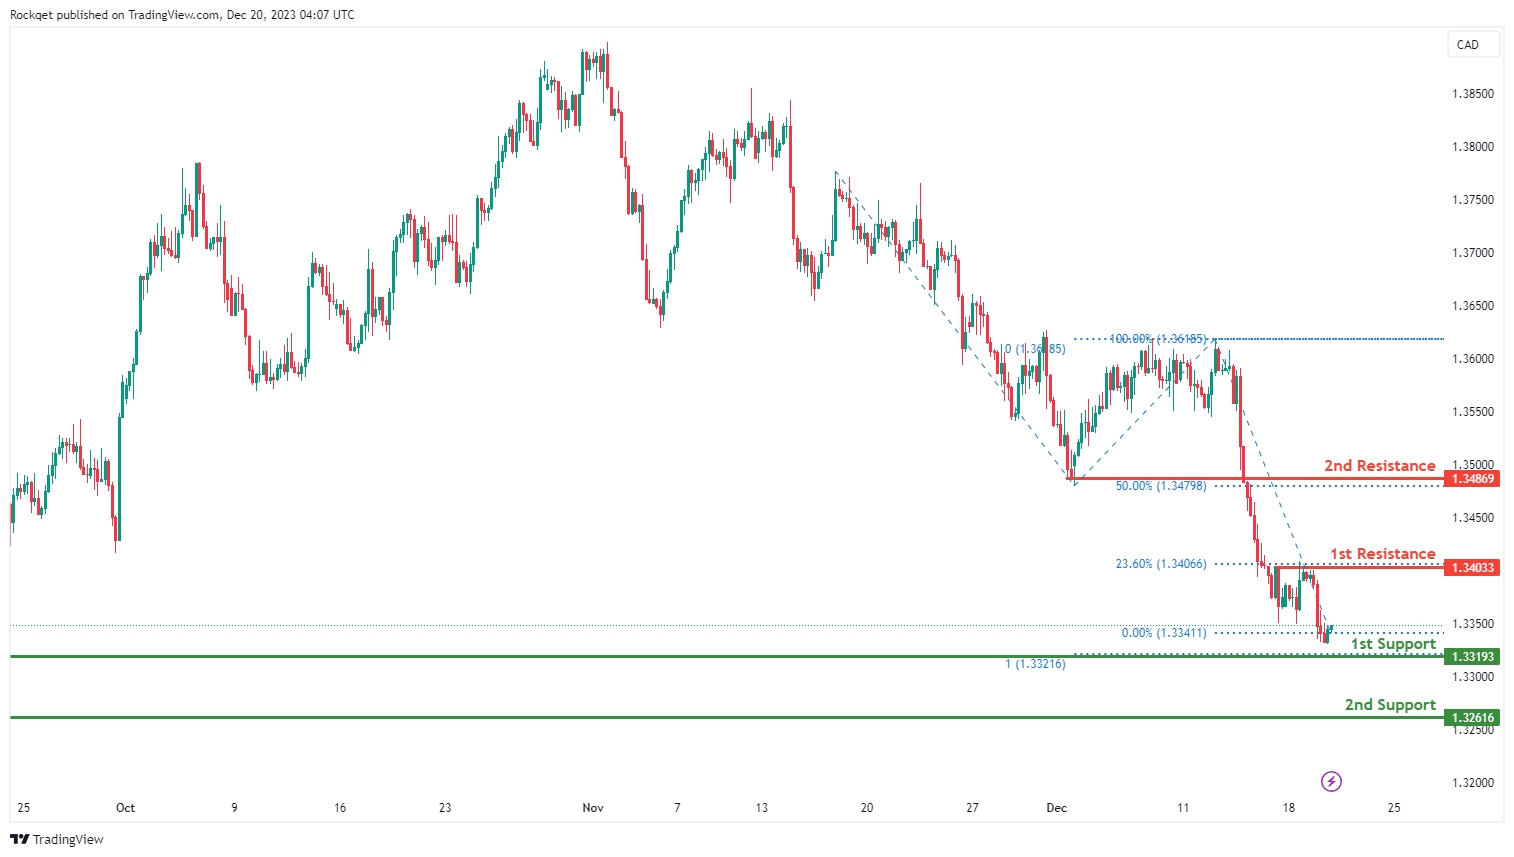
USD/CAD:
The USD/CAD chart currently exhibits an overall bearish momentum, indicating a potential for a drop towards the 1st support.
The 1st support level at 1.3319 is identified as a pullback support that aligns with the 100.00% Fibonacci projection level. Further below, the 2nd support level at 1.3261 is noted as an overlap support, further reinforcing its importance as a key support level.
To the upside, the 1st resistance level at 1.3403 is identified as a pullback resistance that aligns with the 23.60% Fibonacci retracement level. Higher up, the 2nd resistance level at 1.3486 is also marked as a pullback resistance that aligns with the 50.00% Fibonacci retracement level, suggesting a potential barrier for further upside movement.
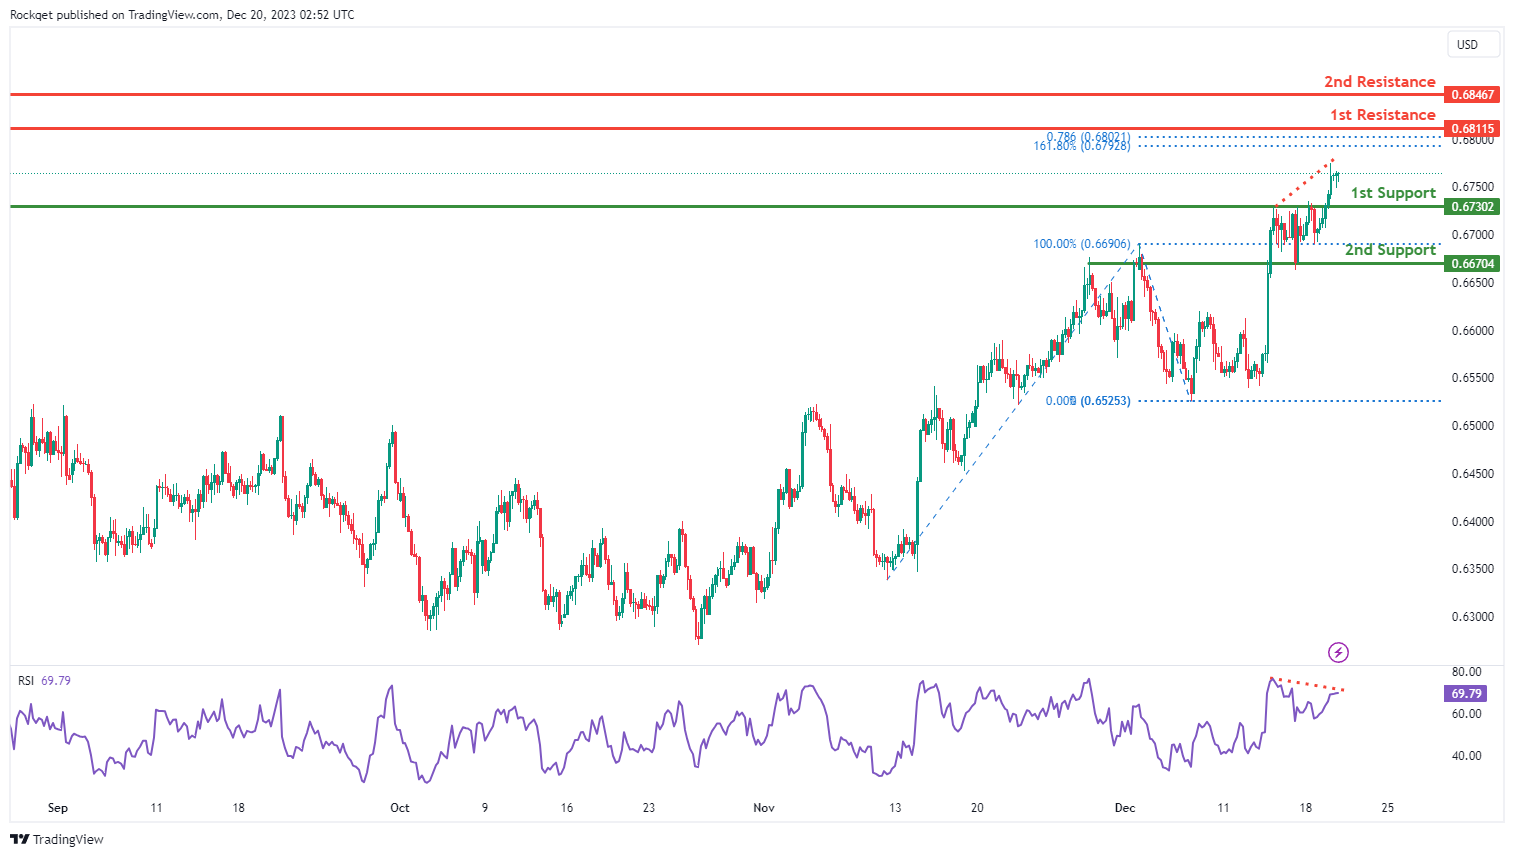
AUD/USD:
The AUD/USD chart currently exhibits an overall bullish momentum. In this context, there is a potential scenario for price to make a bullish continuation towards the 1st resistance. However, the Relative Strength Indicator (RSI) is also demonstrating a bearish divergence versus price, suggesting a potential for a bearish reversal.
The 1st resistance level at 0.6811 is identified as a swing-high resistance that aligns with a confluence of Fibonacci levels i.e. the 161.80% extension and the 78.60% projection levels. Higher up, the 2nd resistance level at 0.6846 is also noted as a swing-high resistance, indicating its potential significance as a barrier for further upward movement.
To the downside, the 1st support level at 0.6730 is identified as an overlap support. Further below, the 2nd support level at 0.6670 is also marked as an overlap, further reinforcing its importance as a key support level.
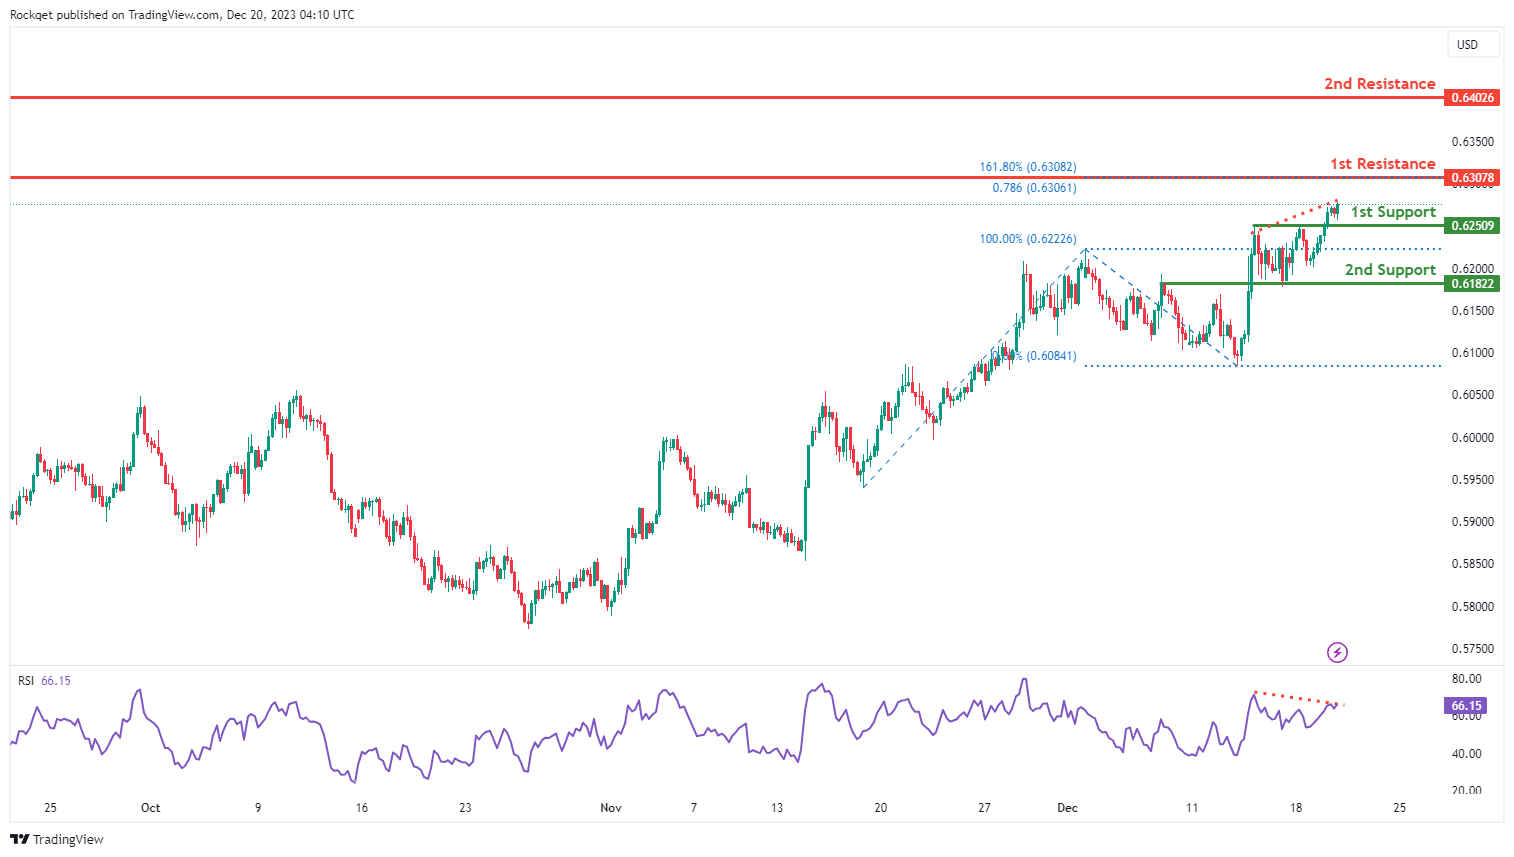
NZD/USD
The NZD/USD chart currently exhibits an overall bullish momentum. In this context, there is a potential scenario for price to make a bullish continuation towards the 1st resistance. However, the Relative Strength Indicator (RSI) is also demonstrating a bearish divergence versus price, suggesting a potential for a bearish reversal.
The 1st resistance level at 0.6307 is identified as a swing-high resistance that aligns with a confluence of Fibonacci levels i.e. the 161.80% extension and the 78.60% projection levels. Higher up, the 2nd resistance level at 0.6307 is also marked as a swing-high resistance, indicating its potential significance as a barrier for further upward movement.
To the downside, the 1st support level at 0.6250 is identified as an overlap support. Further below, the 2nd support level at 0.6182 is also noted as an overlap support, further reinforcing its importance as a key support level.
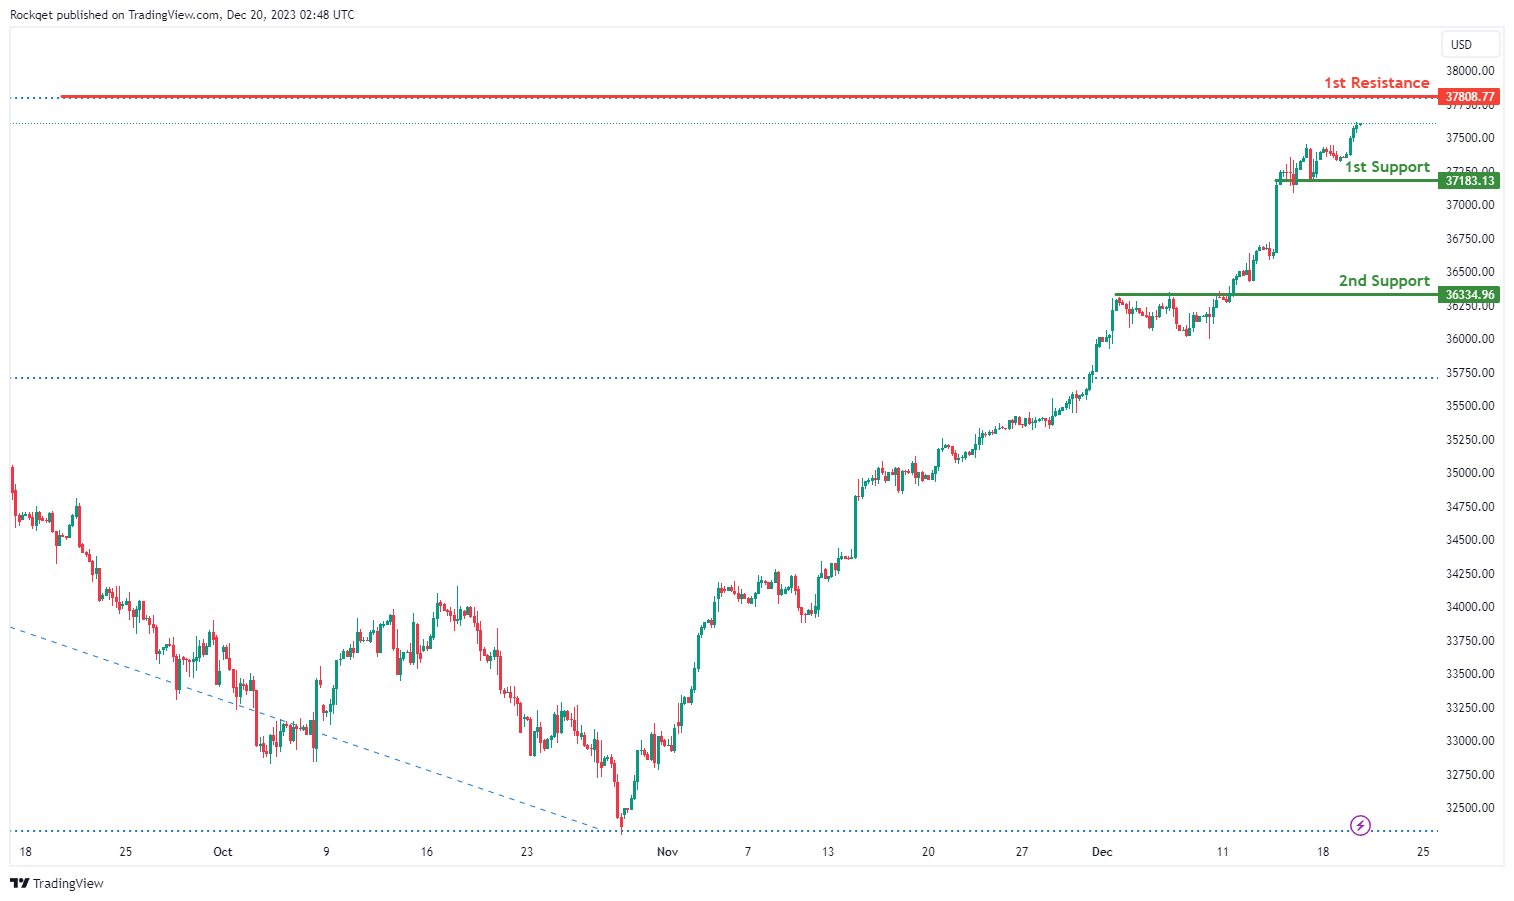
DJ30:
The DJ30 chart currently exhibits a bullish overall momentum, suggesting a potential scenario for a bullish continuation towards the 1st resistance.
The 1st support at 37183.13 is considered significant as it represents an overlap support. This level indicates a historical area where buying interest has been present, reinforcing its potential as a crucial support zone.
Similarly, the 2nd support at 36334.96 is identified as another overlap support, providing an additional layer of potential support for the index.
On the resistance side, the 1st resistance at 37808.77 is associated with the 161.80% Fibonacci Extension. This level may act as a barrier where selling interest could intensify, potentially causing a temporary pause or reversal in the bullish trend.
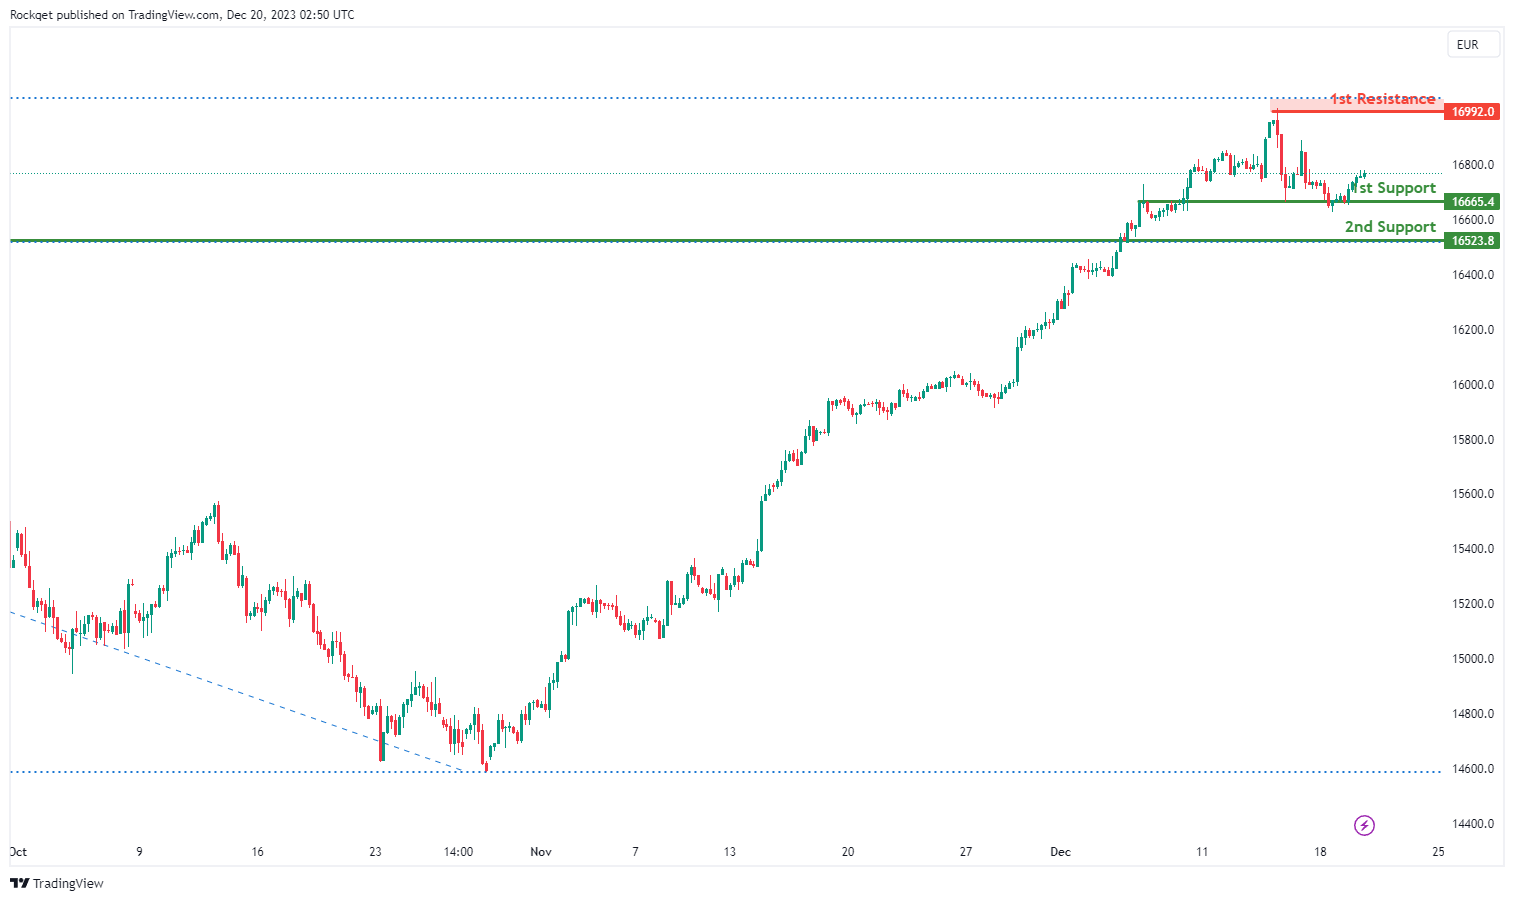
GER40:
The GER40 chart currently exhibits a bullish overall momentum, with contributing factors supporting this trend.
The potential scenario suggests that the price may experience a bullish bounce off the 1st support and move towards the 1st resistance.
The 1st support at 16665.40 is considered significant as it represents an overlap support. This level indicates a historical area where buying interest has been present, making it a potential strong support zone.
Additionally, the 2nd support at 16523.80 is identified as a pullback support, adding another layer of potential support for the price.
On the resistance side, the 1st resistance at 16992.00 is associated with the 127.20% Fibonacci Extension. This level could act as a target where selling interest might intensify, potentially causing a temporary halt or reversal in the bullish trend.
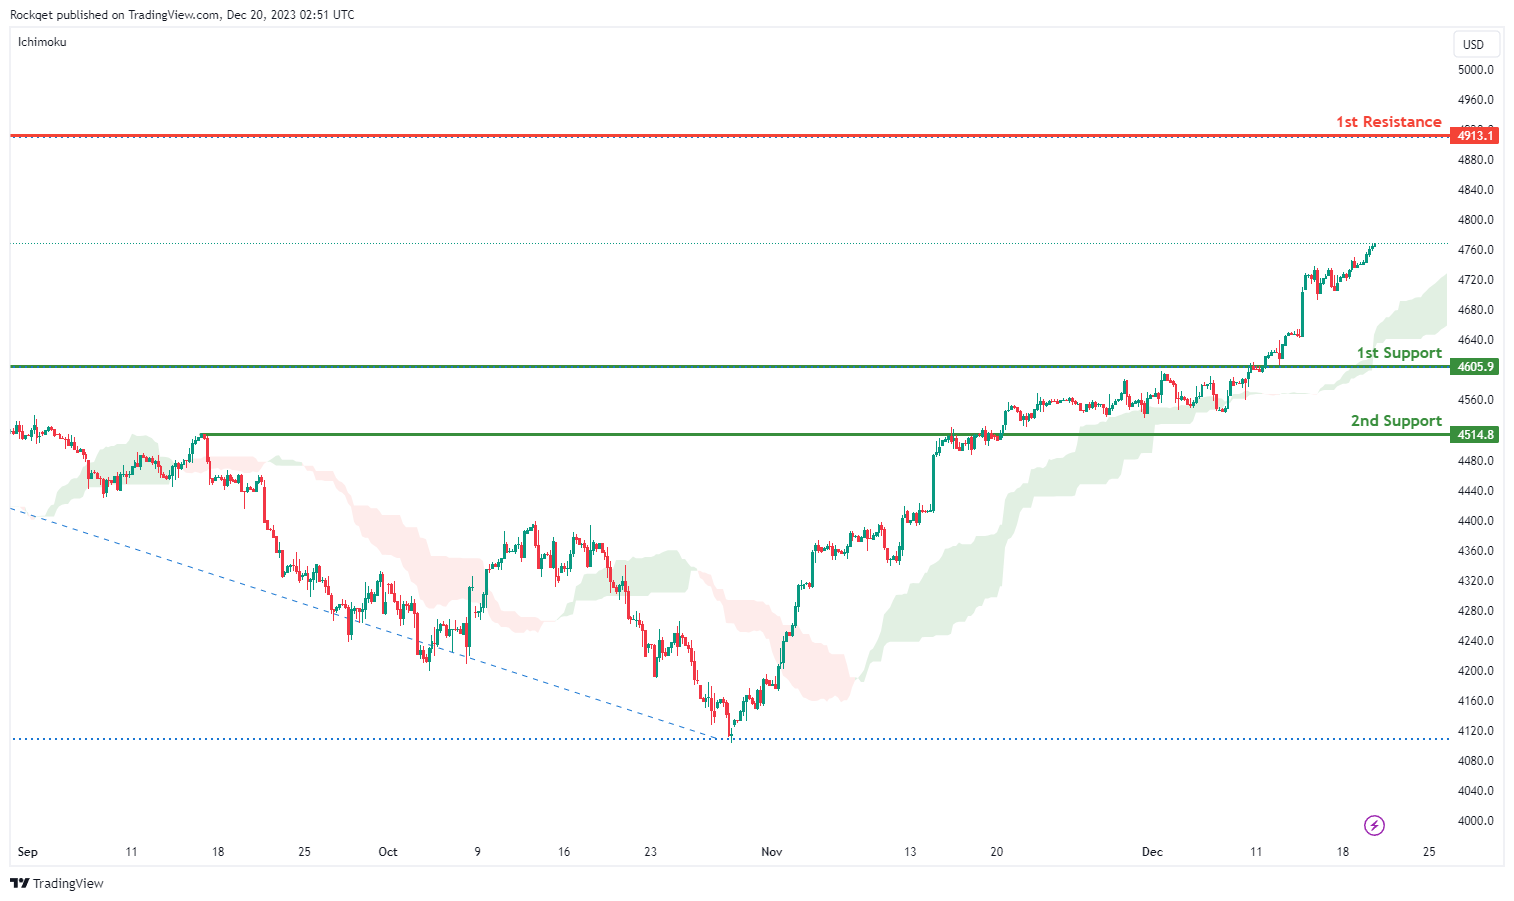
US500:
The US500 chart currently exhibits a bullish overall momentum, with factors contributing to this momentum being that the price is above the bullish Ichimoku cloud.Potential scenarios suggest a bullish continuation towards the 1st resistance level.
The 1st support at 4605.9 is identified as a pullback support, indicating a level where buying interest has historically been present. Additionally, the 2nd support at 4514.8 is recognized as an overlap support, adding another layer of potential support to the chart.
On the resistance side, the 1st resistance at 4913.1 is associated with the 161.80% Fibonacci Extension. This level may act as a barrier where selling interest could intensify, potentially causing a temporary pause or reversal in the bullish trend.
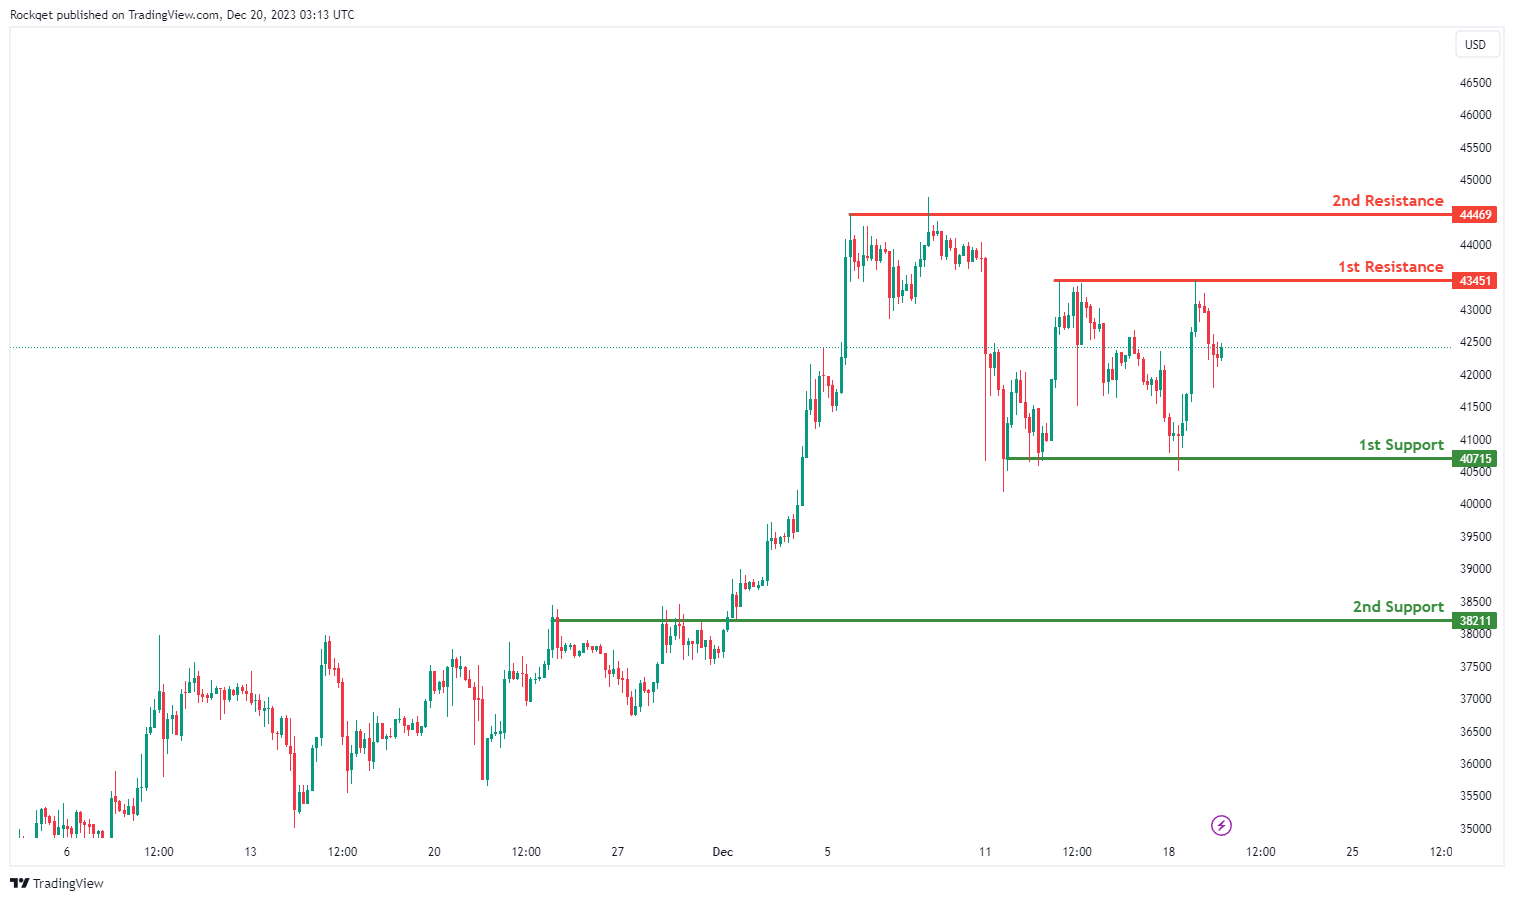
BTC/USD:
The BTC/USD chart currently exhibits a bullish overall momentum, suggesting a potential scenario for a bullish continuation towards the 1st resistance.
The 1st support at 40715 is considered significant as it represents a pullback support. This level indicates a historical area where buying interest has been present, reinforcing its potential as a crucial support zone. Similarly, the 2nd support at 38211 is identified as another pullback support, providing an additional layer of potential support for the cryptocurrency.
On the resistance side, the 1st resistance at 43451 is associated with a swing high resistance. This level may act as a barrier where selling interest could intensify, potentially causing a temporary pause or reversal in the bullish trend. Additionally, the 2nd resistance at 44469 is another swing high resistance, further emphasizing the potential challenge for the price to surpass these levels.
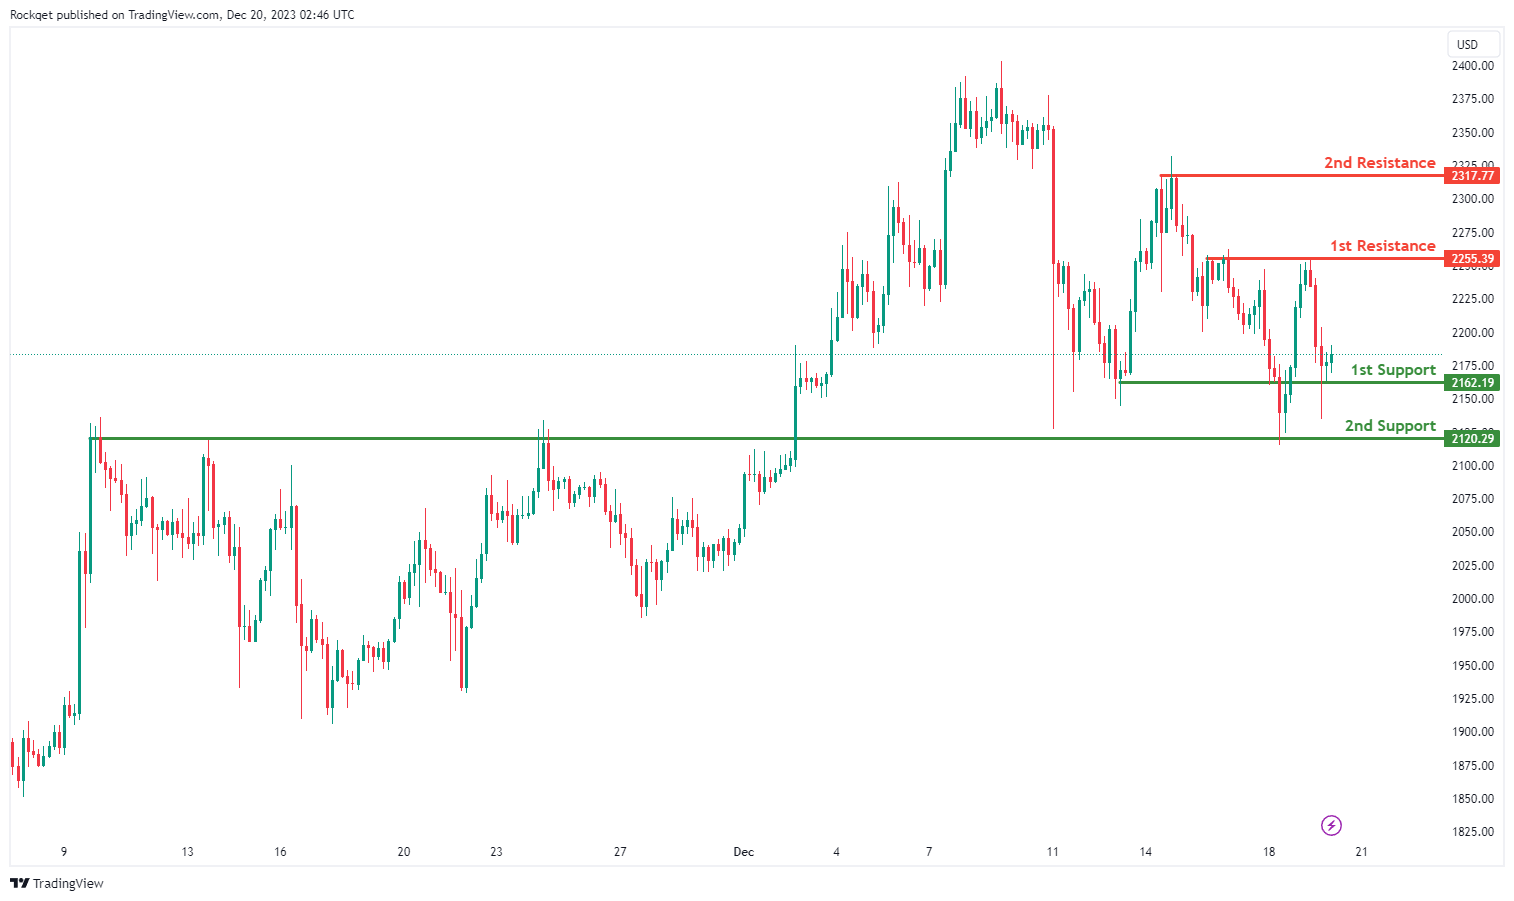
ETH/USD:
The ETH/USD chart currently exhibits a bullish overall momentum, suggesting a potential scenario for a bullish continuation towards the 1st resistance.
However, in the short term, the price could experience a drop to the 1st support level. The 1st support at 2162.19 is identified as a pullback support, representing a historical area where buying interest has been present. Additionally, the 2nd support at 2120.29 is considered an overlap support, adding an extra layer of potential support for the cryptocurrency.
On the resistance side, the 1st resistance at 2255.39 is associated with a pullback resistance, indicating a level where selling interest could intensify, potentially causing a temporary pause or reversal in the bullish trend. Furthermore, the 2nd resistance at 2317.77 is linked to a swing high resistance, highlighting a potential challenge for the price to surpass these levels.
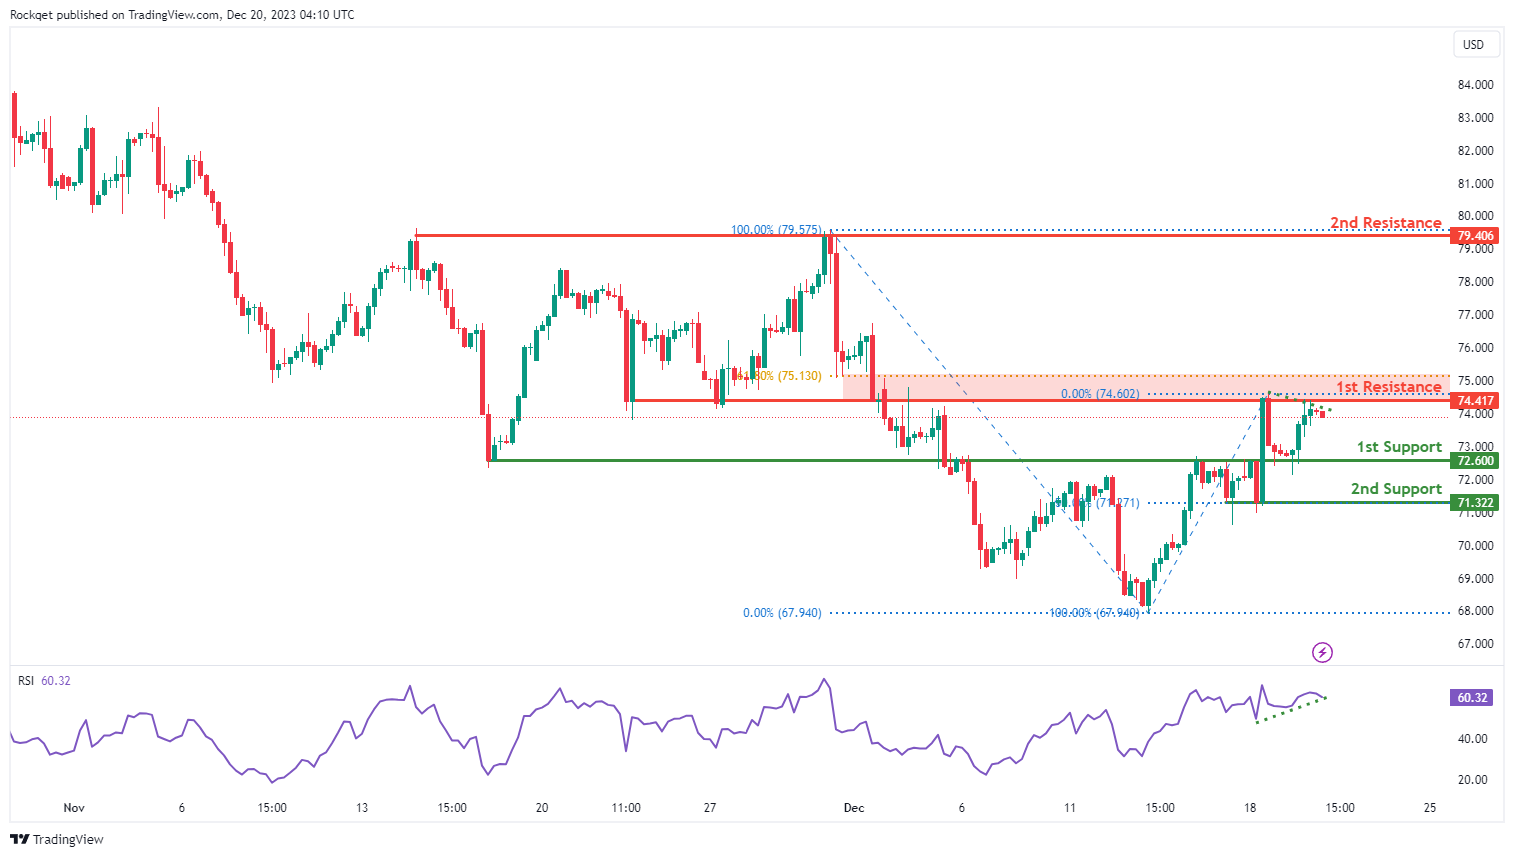
WTI/USD:
The WTI chart currently exhibits an overall bearish momentum, suggesting a prevailing downward trend. In this context, there is a potential scenario for price to make a bearish continuation towards the 1st support. However, the Relative Strength Indicator (RSI) is also demonstrating a bullish divergence versus price, suggesting a potential for a bullish reversal.
The 1st support level at 72.60 is identified as an overlap support. Further below, the 2nd support level at 71.32 is marked as a pullback support that aligns with the 50.00% Fibonacci retracement level, reinforcing its importance as a key support level.
To the upside, the 1st resistance level at 74.41 is identified as an overlap resistance that aligns close to the 61.80% Fibonacci retracement level. Higher up, the 2nd resistance level at 79.40 is noted as a multi-swing-high resistance, further indicating its potential significance as a barrier for further upward movement.
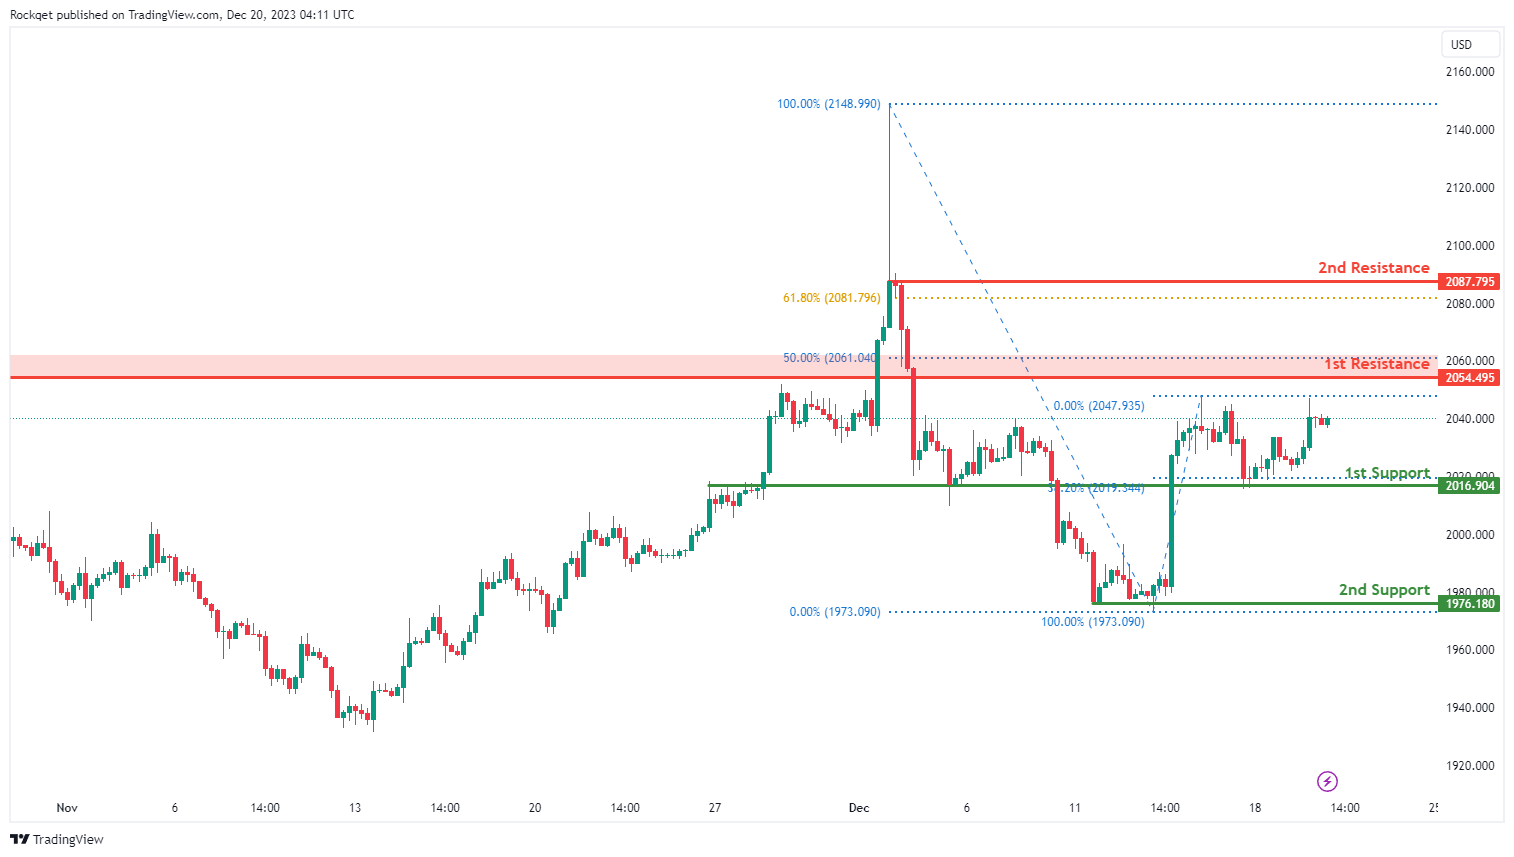
XAU/USD (GOLD):
The XAU/USD chart currently demonstrates a neutral momentum, indicating a potential for price to fluctuate between the 1st support and the 1st resistance.
The 1st support level at 2,016.90 is identified as an overlap support that aligns with the 38.20% Fibonacci retracement level. Further below, the 2nd support level at 1,976.18 is noted as a pullback support, reinforcing its importance as a key support level.
To the upside, the 1st resistance level at 2,054.49 is identified as a swing-high resistance that aligns close to the 50.00% Fibonacci retracement level. Higher up, the 2nd resistance level at 2,087.79 is marked as a pullback resistance that aligns close to the 61.80% Fibonacci retracement level, further indicating its potential significance as a barrier for further upward movement.
Australia’s Westpac leading index climbs to 0.3%, signaling stabilization, not an upturn
Westpac Leading Index in Australia showed an encouraging rise from -0.39% to 0.30% in November, marking the first positive, above-trend reading since mid-2022. However, Westpac cautioned that this uptick might be influenced by temporary factors. Also, the shift in underlying momentum, as RBA's tightening begins to slow, is seen more as a stabilization rather than the start of an upturn.
Further, Westpac highlighted weaker conditions in the domestic sphere, particularly impacting the household sector. This weakness is expected to continue into the first half of next year. Hence, Westpac anticipates that barring a "truly disastrous" December quarter CPI update, RBA is likely to maintain its current policy in the upcoming February meeting.
Japan’s divergent export trend: 26 months of US growth, 12 months of China decline
Japan's trade statistics for November were, marked by a slight decline in exports and a more significant drop in imports. Exports fell marginally by -0.2% yoy, totaling JPY 8829B, marking the first drop in three months.
A closer look at export destinations shows contrasting trends. Exports to US continued to grow, marking a 5.3% increase and extending the expansion streak to 26 months. In contrast, exports to China fell by -2.2%, continuing a downward trend for the 12th consecutive month. One of the most notable declines was in food shipments, which plummeted by -60.3%, significantly impacted by China's ban on Japanese seafood imports.
On the import side, Japan saw a more pronounced decline of -11.9% yoy, with total imports amounting to JPY 9597B. This reduction in imports contributed to a trade deficit of JPY -777B for the month.
When adjusted for seasonal variations, exports dropped by -1.8% mom to JPY 8567B, and imports decreased by -2.7% mom to JPY 8976B. Consequently, trade deficit narrowed from JPY -501B to JPY -409B.
RBNZ’s Orr highlights struggle with core inflation and migration impact
RBNZ Governor Adrian Orr, in his address to a parliament select committee today, emphasized there is "still a long way to go" to curb inflation. He added, "it's core inflation that's going to be our challenge ahead".
Orr also noted the complexity of this challenge, pointing out that much of the core inflation factors are entrenched within central and local government influences, including rates and taxes. He cautioned that tackling these elements in the "last five yards on the inflation battle is going to be tough."
Adding to the economic challenges, Orr highlighted the current record-high levels of net inward migration in New Zealand. This surge in migration has surpassed RBNZ's expectations and presents additional complexities for monetary policy, housing demand, asset prices, and the general inflation outlook.
Regarding the country's economic growth, Orr mentioned that GDP was "surprisingly subdued," with a contraction of -0.3% in Q3. He indicated that RBNZ is internalizing this complex situation and will provide more detailed insights in their monetary policy statement due in February.
Fed’s Goolsbee cautions against market euphoria on rate cuts
Chicago Fed President Austan Goolsbee, in an interview with Fox News overnight, said that investors might be "a little ahead of themselves" with their "euphoria" as stock markets surged to record highs following Fed's announcement last week.
Goolsbee did acknowledge that if inflation continues its downward trend towards target, Fed might reassess its restrictive stance. "If inflation continues to come down to target, then the Fed can reconsider how restrictive it wants to be," he stated.
However, Goolsbee was clear in emphasizing Fed's independence, asserting that the central bank will not be "bullied" by market pressures.
Fed’s Barkin seeks consistency and breath in disinflation for policy decisions
Richmond Fed President Thomas Barkin, in an interview with Yahoo Finance, acknowledged that the Fed is making "good progress" in its efforts to bring down inflation.
However, he pointed out that the economic data has been somewhat erratic, emphasizing his desire for "consistency" and "breadth" in the inflation metrics. He explained that he is looking for "consistency around our target and a broad-based disinflationary set of results."
On the topic of interest rate cuts, Barkin's stance was cautious and data-dependent. He suggested that a response from Fed would be appropriate if inflation trends downwards as hoped. However, he stressed the unpredictability of economic data
"If you're going to assume that inflation comes down nicely, then, of course, we'd respond appropriately. You know, I don't assume what the data is going to do. We'll see what happens," he said.
Fed’s Bostic: No rush to cut rates, eyes second half of 2024 for easing
Atlanta Fed President Raphael Bostic emphasized a lack of urgency in cutting interest rates, projecting potential rate reductions only in the second half of 2024.
In an event overnight, Bostic expressed his view that inflation is likely to decrease gradually over the next six months. This outlook underpins his stance that there is no immediate need to deviate from the current restrictive monetary policy.
"For me, I'm thinking inflation is going to come down relatively slowly in the next six months, which means there's not going to be urgency for us to pull off our restrictive stance," he stated.
Bostic anticipates that Fed might implement two rate cuts in the latter half of 2024. However, he clarified, "It is not like there has been an active discussion on this."
Highlighting the prevailing economic uncertainties, Bostic advocated for a "cautious but resolute" approach. This strategy involves a resistance to reacting hastily to individual data points and instead focuses on making sure "the trends are really trends."
Stock Market Outlook 2024: Soft Landings, Rate Cuts, and Elections
- Stellar year for US stock markets, fueled by ‘soft landing’ hopes
- Can the rally persist in 2024, despite high valuations and election uncertainty?
- European valuations are much cheaper, partly reflecting recession concerns
US stocks race higher, but tougher environment ahead
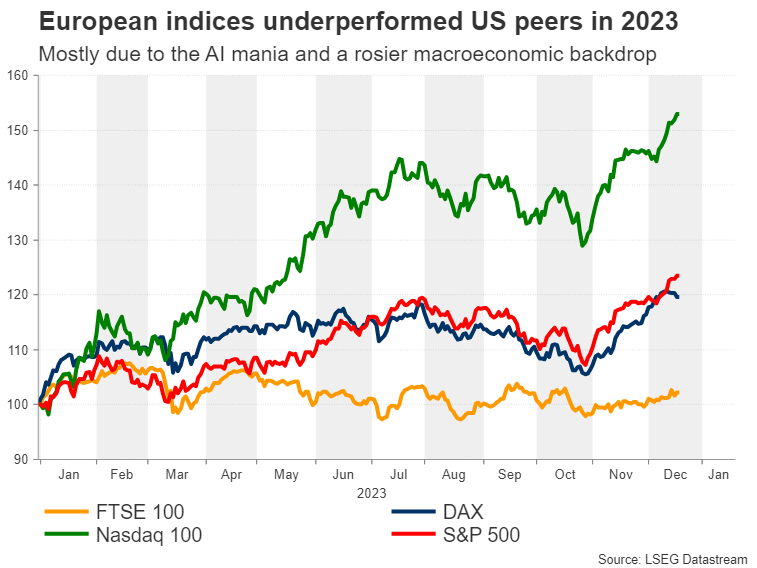
It’s been a sensational year for US equity markets. The S&P 500 has risen more than 23% while the tech-heavy Nasdaq 100 has gained a stunning 52% so far, with both indices coming within breathing distance of their record highs. Fears about a recession have melted away and investors are increasingly confident the US economy can achieve its elusive soft landing.
Bets that the Fed and other central banks will slash interest rates next year have also served as jet fuel for this rally, alongside the hype surrounding artificial intelligence and the prospect that it could usher in an era of rising productivity.
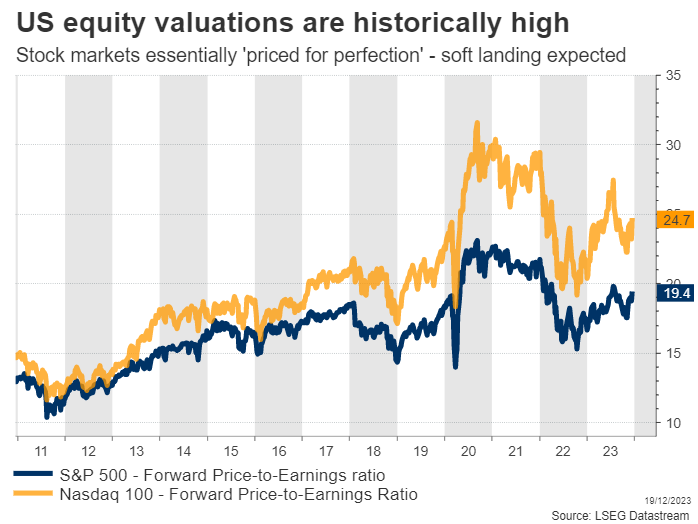
That said, there are some red flags as we head into next year. For starters, equity valuations are expensive. The S&P 500 is currently trading at over 19 times what analysts expect earnings to be over the coming year, which is a historically high valuation multiple.
Outside of the pandemic years, the last time the market traded at similar valuations was back in 2001, as the ‘dot com’ bubble was bursting. Such a high multiple would make more sense if interest rates were extremely low and investors had no real alternative to stocks, or if corporate earnings were growing at an impressive pace. Neither is the case today.
Indeed, earnings assumptions by analysts seem overly optimistic. For 2024, analysts expect S&P 500 companies to generate earnings growth of over 11%, which would be a tremendous acceleration from the 3% growth the market is on track to achieve this year. The question is whether such a profit boom is a realistic prospect, particularly as we are heading into a global economic slowdown.
Even though the US economy has been resilient, with an enormous government deficit shielding economic growth, it’s questionable whether this strength will persist. Business optimism is subdued and several retailers including Walmart have recently warned consumption is losing power, especially at lower income levels.
Looking outside the US, the situation is even worse. Europe is probably in a mild technical recession already, while China is dealing with the painful deleveraging of its housing sector. It’s difficult to square this gloomy picture with the cheerful earnings projections, considering that S&P 500 companies derive 40% of their revenue from overseas.
In other words, the soft landing narrative has been fully priced into equity markets, but it is not necessarily supported by the macroeconomic landscape. Even if the US ultimately dodges a recession, a weaker environment globally could still impact corporate earnings, preventing them from racing higher as anticipated.
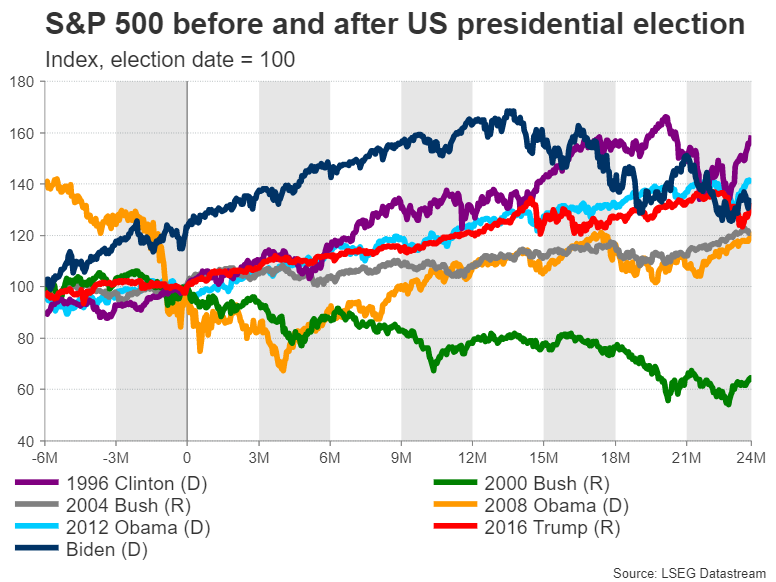
Another element is the US presidential election next year. Historically speaking, equity markets tend to underperform in election years, ahead of the vote in November. This phenomenon reflects uncertainty around the outcome, which pushes investors to hedge some of their risk exposure. That said, the market often rallies once the election has passed, almost irrespective of who wins.
Therefore, the risk-to-reward profile for US equities does not seem very attractive heading into next year. Stocks are already priced for perfection, which leaves scope for turbulence in case reality does not match the market’s rosy expectations.
Now to be clear, all this does not imply some apocalyptic crash is imminent. It simply means that the upside appears limited with valuations already stretched, especially if earnings growth undershoots.
Sluggish growth baked in European equities
The Euro area and UK have been suffering from subdued economic growth this year, leading markets to price in a higher probability of a recession.
Europe's economic engine - Germany - is on the brink of a technical recession due to the malaise in global manufacturing and its reliance on slowing Chinese demand. Meanwhile in the UK, things are not looking great either as inflation remains elevated, fueling concerns about a period of stagflation next year.
Although there are storm clouds hanging over Europe, pessimistic forecasts are already priced into European stocks. Forward earnings estimates have come down to reflect recessionary risks, at a time when a soft landing and corporate earnings accelerating is the baseline scenario in the US. Therefore, European stocks seem better positioned to weather the impact of earnings downgrades, especially if central banks fail to cut rates at the right pace, inflicting unnecessary damage on the economy.
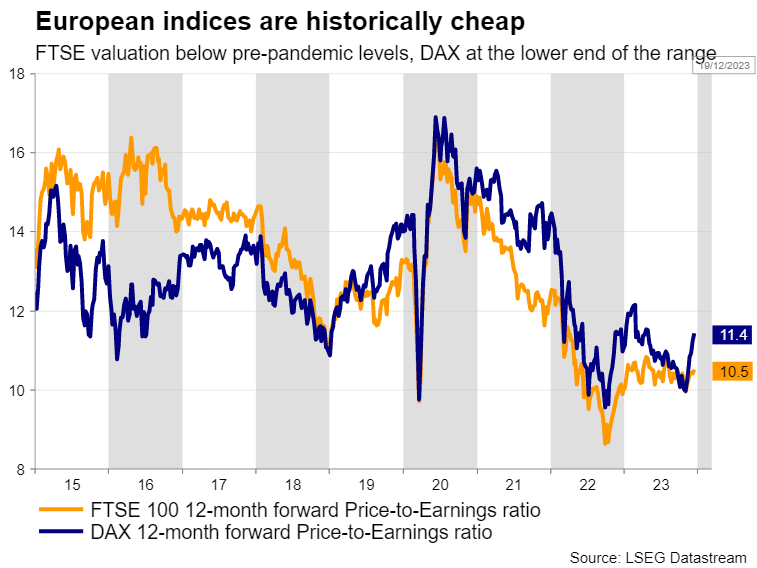
From a chart perspective, the FTSE 100 and DAX 40 are currently trading around 5% and 2% below their all-time highs, respectively. Combining the bleak earnings forecasts with the historically high prices, someone would expect stock valuations in Europe to be inflated. Surprisingly, the leading European indices are trading at a discount both historically and against the US markets.
Even if the discount can be attributed to a more value-oriented composition, the historically low valuations are clearly limiting the downside in case of a deeper-than-expected recession. Speaking about structural differences, interest rate cuts in a growing economy could bolster the tech-heavy US equity markets, but the defensive nature of European indices could attract more interest in a severe economic downturn.
Elections are another common risk factor for these economies in 2024. In June, markets will brace for the European Parliament elections, as the next European Commission needs to implement tighter fiscal reforms after a three-year period of ultra-loose policies.
Turning to the UK general election, the Labour Party has a massive lead against the incumbent Conservative Party in opinion polls. That’s a risk for British equities, considering that Labour governments are often associated with higher taxes, especially on corporations.
In a nutshell, the future of stock markets in the Euro area lies heavily on China’s economic performance next year, while for the UK, risks mostly stem from the government’s fiscal stance. But even if the worst-case scenario strikes, European shares are in a better position to absorb any shocks compared to their US counterparts, as much of the pessimism is already baked in.