Sample Category Title
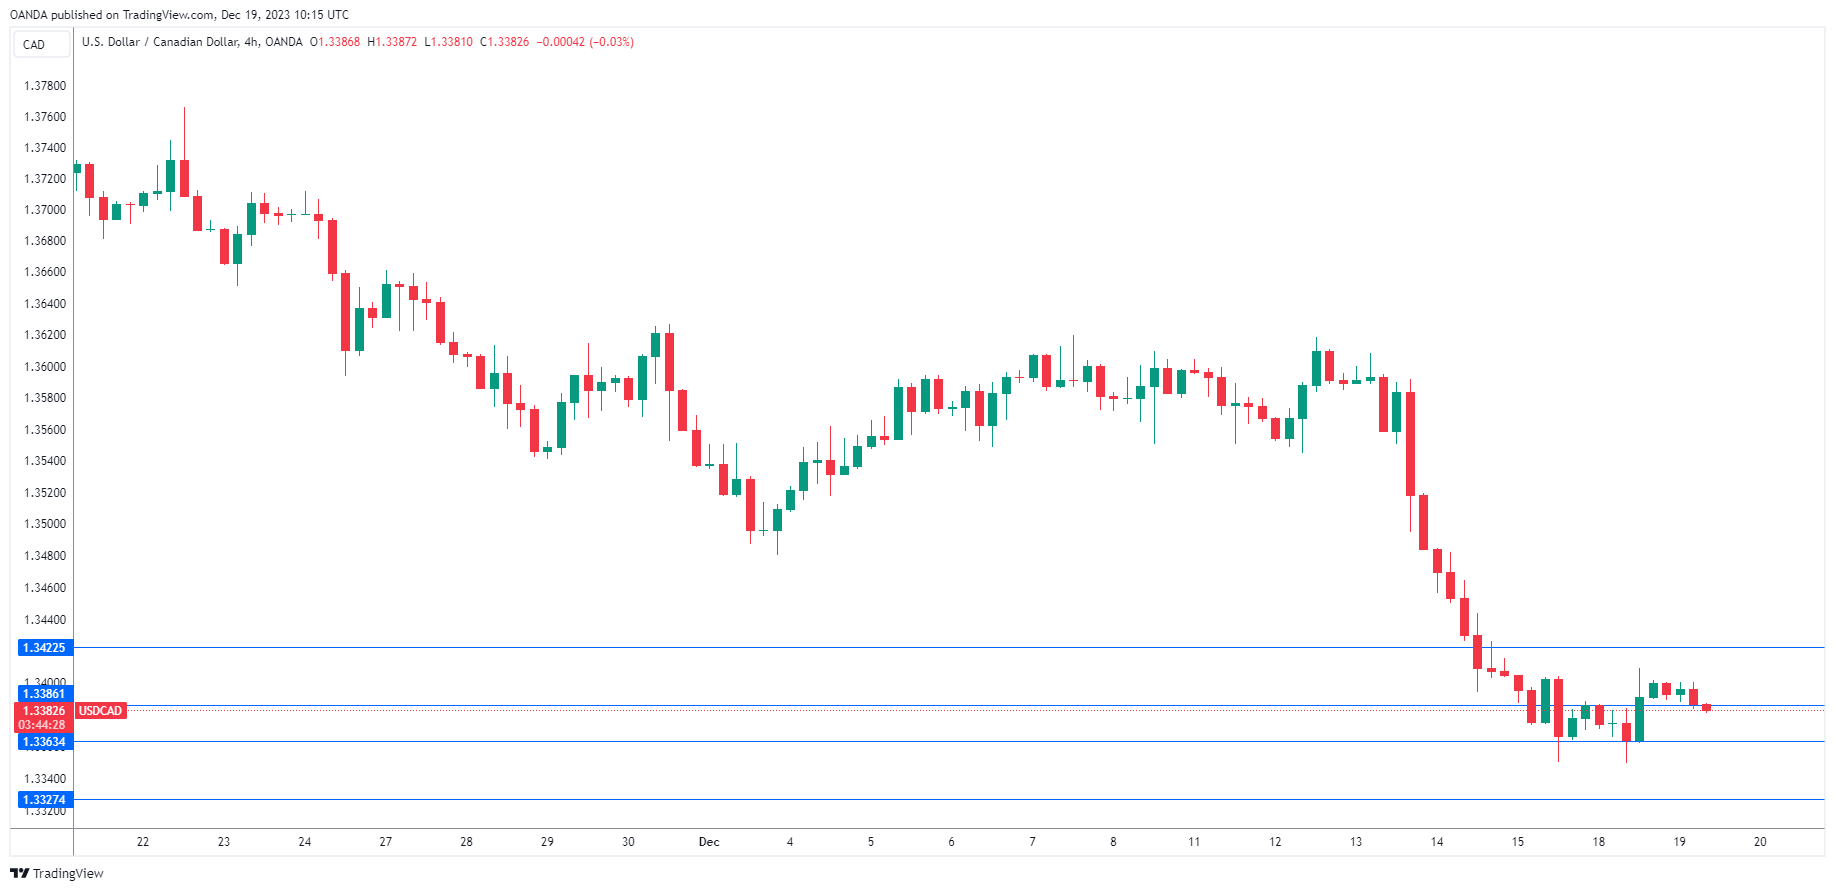
Canadian Dollar Drifting Ahead of CPI Release
- Canada’s inflation rate expected to fall to 2.9%
- Fed members push back against rate cut expectations
The Canadian dollar is showing little movement on Tuesday. In the European session, USD/CAD is trading at 1.3382, down 0.13%. We could see stronger movement from the Canadian dollar in the North American session, with the release of the Canadian inflation report.
Canadian inflation expected to ease to 2.9%
Canada releases the November inflation report later on Tuesday. In October, inflation dropped to 3.1% y/y, down sharply from 3.8%. The market consensus for November stands at 2.9%. Two key core inflation indicators are expected to ease to an average of 3.3%, down from an average of 3.5% in October.
A further drop in inflation would be an encouraging sign for the Bank of Canada, which has raised the cash rate to 5.0% but has paused three straight times. The BoC remained hawkish at the December meeting and kept the door open to additional rate hikes but the markets are convinced that the rate-tightening cycle is over and have priced in rate cuts next year, starting in mid-2024. A drop in the November inflation report would bolster expectations for rate cuts next year. If inflation surprises on the upside, it would bolster the Canadian dollar and force the BoC to continue pausing rates at restrictive levels (‘higher for lower’).
The US dollar has hit a rough patch since the Fed meeting last week when Fed Chair Powell penciled in three rate cuts next year. Traders are far more bullish and have priced in six rate hikes in 2024, starting in March.
We’re seeing some pushback from the Fed to dampen rate-cut fever in the markets. On Friday, New York Fed President John Williams said a rate cut in March was “premature” and even warned that rates could move higher if inflation were to stall or reverse. Cleveland Fed President Mester said on Monday that the markets are a “bit ahead” of the Fed on rate cuts, as the Fed was focused on how long it would need to maintain rates in restrictive territory, while the markets were focused on rate cuts.
USD/CAD Technical
- USD/CAD is testing support at 1.3363. Below, there is support at 1.3327
- There is resistance at 1.3386 and 1.3422
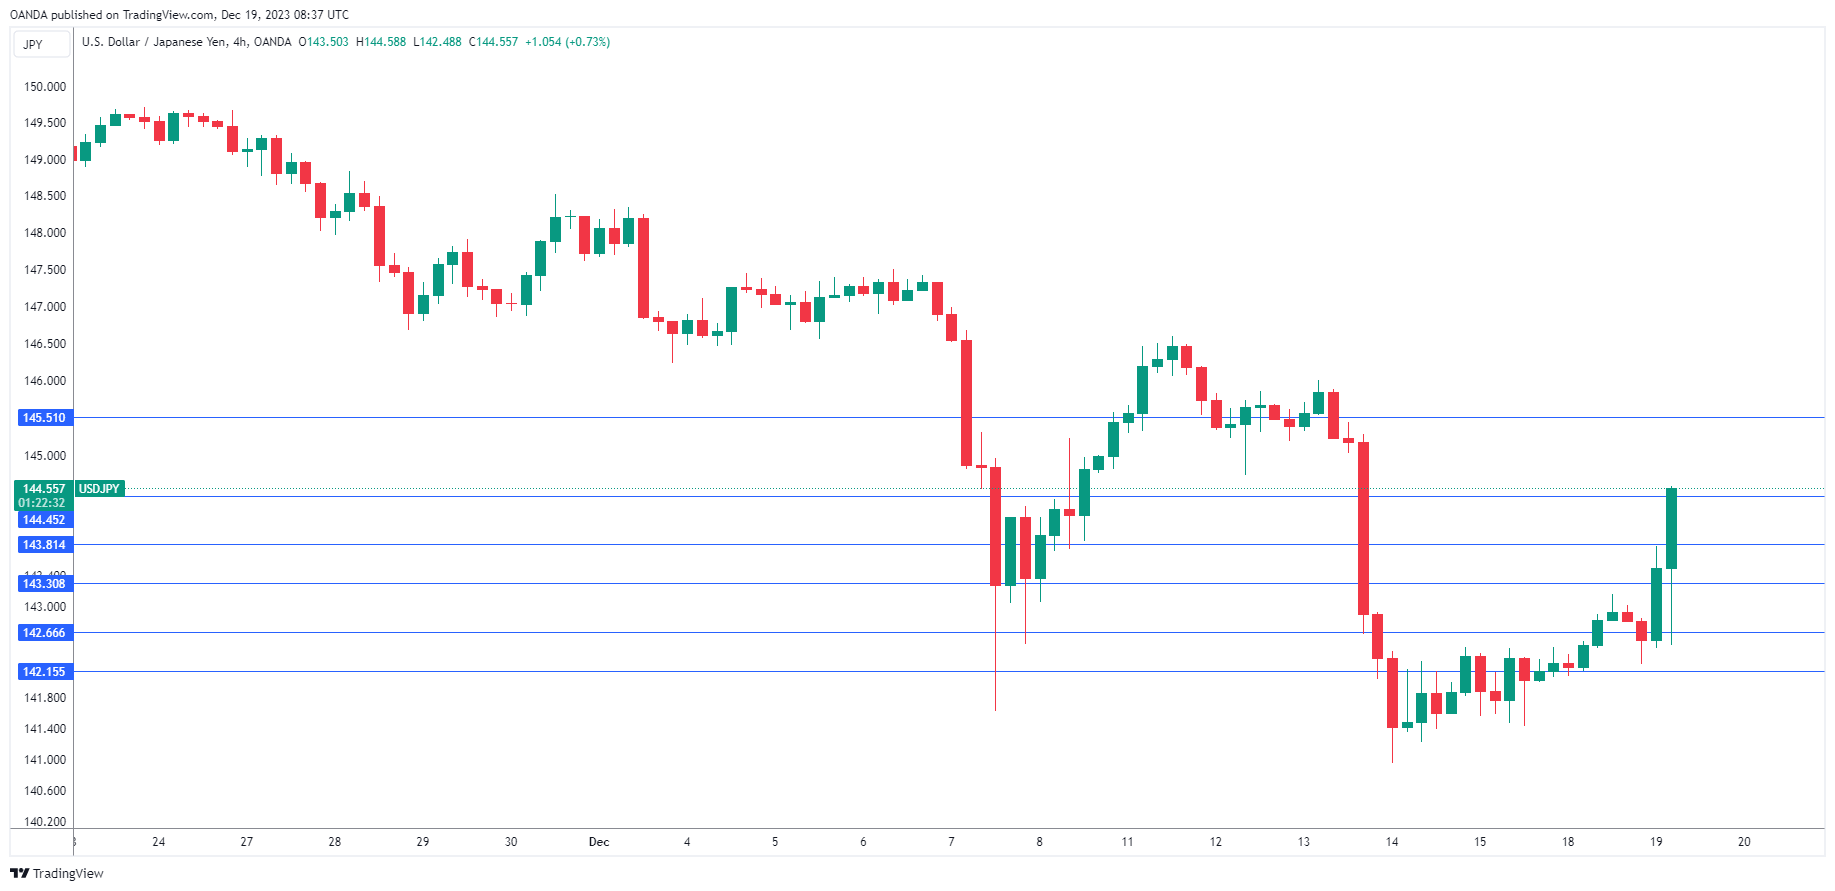
Japanese Yen Slides as BoJ Stands Pat
- BoJ makes no changes to policy or guidance
- Yen declines over 1%
The Japanese yen is sharply lower on Tuesday. In the European session, USD/JPY is trading at 144.42, up 1.15%. The yen surged 1.95% last week but has faltered and pared most of those gains this week.
BoJ maintains policy
Tuesday’s Bank of Japan meeting was a live meeting, as there was speculation that the central bank might make a move after some broad hints of tighter policy from senior Bank officials. In the end, the meeting was a non-event as even a tweak in language was not to be found, and disappointed market participants gave the yen a thumbs down.
The BoJ maintained its policy settings, but speculation is high that the central bank will tighten policy next year, at a time when the other major banks are loosening policy as inflation moves lower. Governor Ueda acknowledged that prices and wages are moving higher but said more time was needed to determine if a “positive wage-inflation cycle will fall in place”. Core inflation has remained above the 2% target for some 19 months, but the BoJ has argued that inflation has been driven by cost-push factors and is not sustainable. At a post-meeting press conference, Ueda rejected exiting from the Bank’s ultra-loose policy, saying that uncertainty over the outlook is “extremely high”.
The markets have been exuberant since the Fed meeting last week when Fed Chair Powell penciled in three rate cuts next year. Traders are far more bullish and are betting on six rate hikes in 2024, starting in March.
We’re seeing some pushback from the Fed to reign in market expectations. On Friday, New York Fed President John Williams said a rate cut in March was “premature” and even warned that rates could move higher if inflation were to stall or reverse. Cleveland Fed President Mester said on Monday that the markets are a “bit ahead” of the Fed on rate cuts, as the Fed was focused on how long it would need to maintain rates in restrictive territory, while the markets were focused on rate cuts.
USD/JPY Technical
- USD/JPY has pushed past resistance at 143.30 and 143.81 and is testing resistance at 144.45. Above, there is resistance at 145.51
- There is support at 142.66 and 142.15
USD/JPY and NIKKEI React to Bank of Japan Decision
This morning, the Bank of Japan decided to leave interest rates unchanged at -0.10%. Its head, Kazuo Ueda, stated that:
→ the chances that the current ultra-loose monetary policy will change in January are very small;
→ further decisions of the Bank of Japan will be based on incoming economic information.
Thus, rumors that the Bank of Japan might raise rates from the negative zone did not come true. As a result, the NIKKEI index rose to November highs, and the yen weakened.
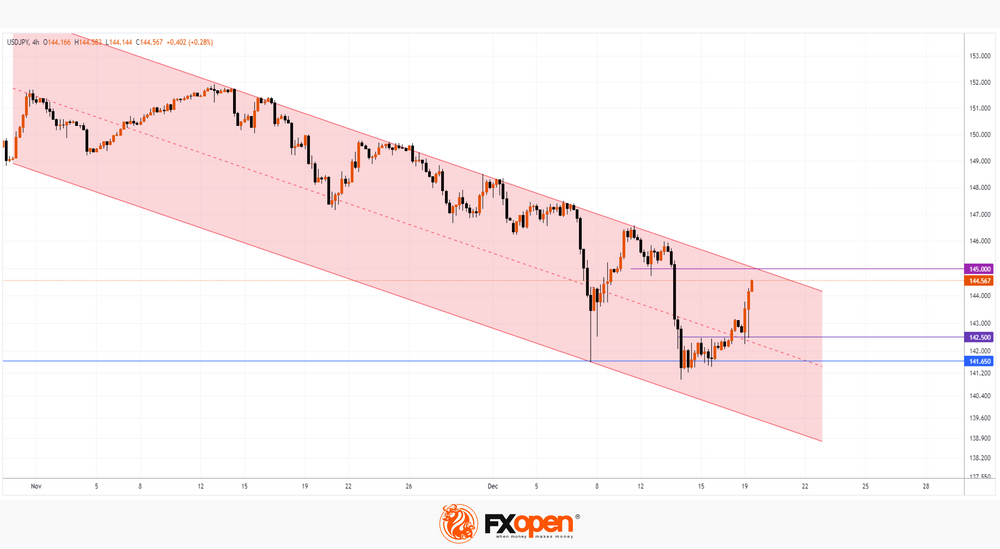
The 4 hour USD/JPY chart shows that:
→ The price forms a downward channel (shown in red). The strengthening of the yen against the US dollar, observed since November, was caused by both rumors related to the Bank of Japan and the prospect of a rate cut by the Federal Reserve.
→ The lower border of the channel pushed the price upward on December 7, indicating support at 141.65.
→ On December 14, there was an attempt at a bearish breakdown of this support. But instead of developing a downward movement to another touch with the lower border of the channel, the price entered into consolidation (an early bullish sign), which lasted until the end of last week and marked the resistance level of 142.5.
→ The closer the Bank of Japan's decision was, the stronger the bulls became. After breaking through the level of 142.5, it was tested. Moreover, not only the level of 142.5, but also the median line of the channel showed its support role.
The upward momentum that the USD/JPY market has received may develop during today's American session. It is possible that the quote will reach resistance at 145 yen per dollar, which is strengthened by the upper boundary of the downward channel.
This article represents the opinion of the Companies operating under the FXOpen brand only. It is not to be construed as an offer, solicitation, or recommendation with respect to products and services provided by the Companies operating under the FXOpen brand, nor is it to be considered financial advice.
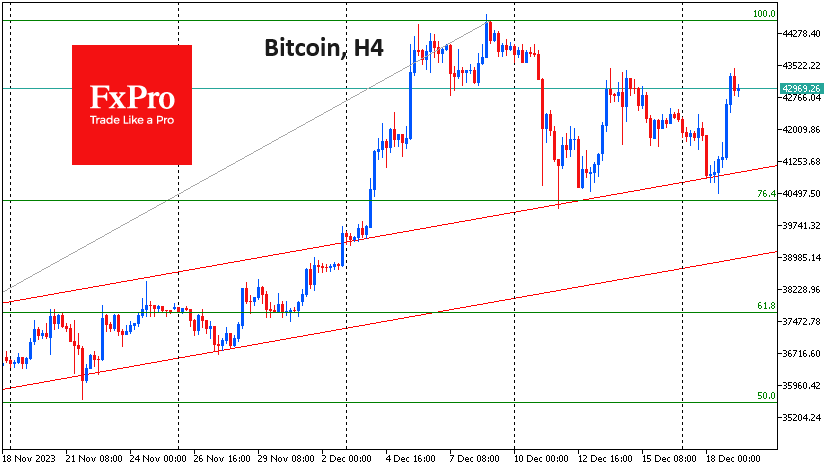
Bulls Quickly Returned to Crypto
Market Picture
The second half of Monday proved to be for the bulls in cryptocurrencies, triggering a 3.5% rise in capitalisation over the last 24 hours to $1.61 trillion. Daily updates of all-time highs in US stock indices support the appetite for crypto. The Nasdaq100, which has previously had a pronounced impact on the cryptocurrency market, did so yesterday.
Bitcoin is trading just below $43K, and as of this morning, in a thinly liquid market, it was rising at a peak of $43.4K, an eight-day high. Bitcoin has formed a double bottom on the intraday charts, and this dynamic indicates that the mood for a deeper correction has not materialised. On the other hand, Tuesday’s peak is close to last Thursday’s, leaving Bitcoin inside the range.
According to CoinShares, investments in crypto funds fell by $16 million last week for the first time after 11 weeks of inflows. Bitcoin investments were down $33 million, Ethereum was down $4 million, and Solana was up $11 million.
The slight outflow was more profit-taking than a change in sentiment, CoinShares said. Altcoins bucked the trend with inflows of $21 million, with Solana, Cardano ($3 million), XRP ($2.7 million) and Chainlink ($2 million) being the main beneficiaries. Trading activity remained well above the yearly average, totalling $3.6bn for the week.
News Background
Average fees on the Bitcoin network topped $37, hitting a yearly high. The growth was fuelled by another wave of activity in the Ordinals segment, which increased demand for space in the blockchain.
Cryptocurrency attorney and Crypto-Law founder John Deaton said that 20 per cent of US Senate members agree to support a ban on cryptocurrencies in the country. In his opinion, cryptocurrency opponent Senator Elizabeth Warren is the biggest threat to freedom in the US.
The issuer of the largest stablecoin USDT, Tether, has confirmed its course of cooperation with the US authorities. The firm said it is committed to fighting the illegal use of USDT.
Speculators have started reselling Solana’s Saga smartphones on eBay at prices above $2000 due to the hype surrounding the BONK meme-token Airdrop. Buyers of Saga phones get a guaranteed giveaway of 30 million BONK, worth more than the original price of the smartphone.
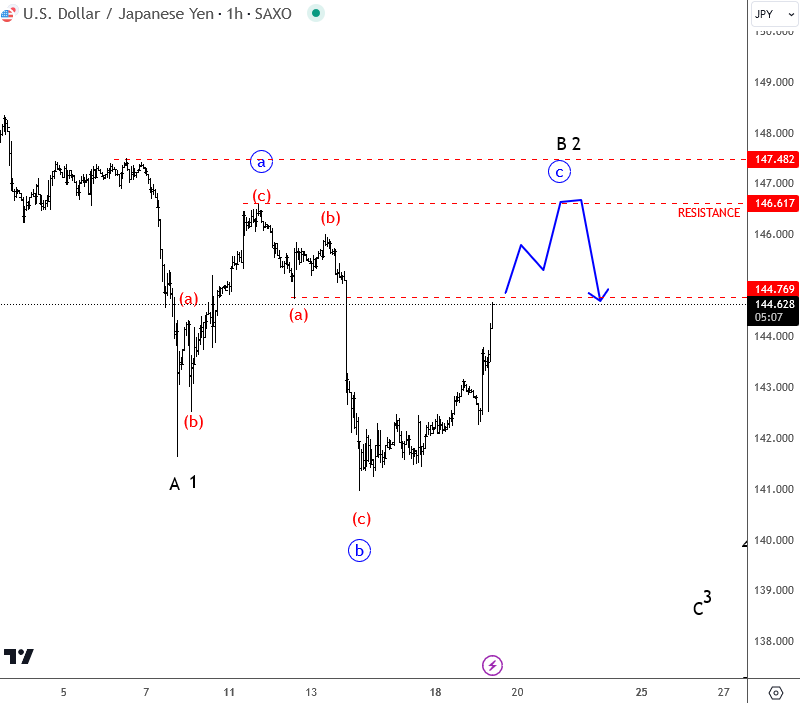
USD/JPY Remains Trapped in a Correction Following BoJ
Today's focus is on the Bank of Japan's decision to maintain its current policy stance, which has led to a depreciation of the Japanese Yen. Consequently, the USD/JPY pair is on an upward trajectory, seeking higher resistance levels. Although this trend may extend further, there is an anticipation of a potential downturn in 2024.
Ueda's hint at policy normalization in March 2024, along with the possibility of unforeseen market events, suggests a future shift in policy that could result in increased volatility and potentially strengthen the Yen. The latest Elliott wave analysis indicates a notable ongoing recovery, with the pair approaching the 144.76 mark. Surpassing it would validate the hypothesis that the recent decline was a three-wave move, indicative of a complex correction. Key resistance for a flat correction is identified in the 146.6 to 148 range, providing critical points to monitor for future market movement.
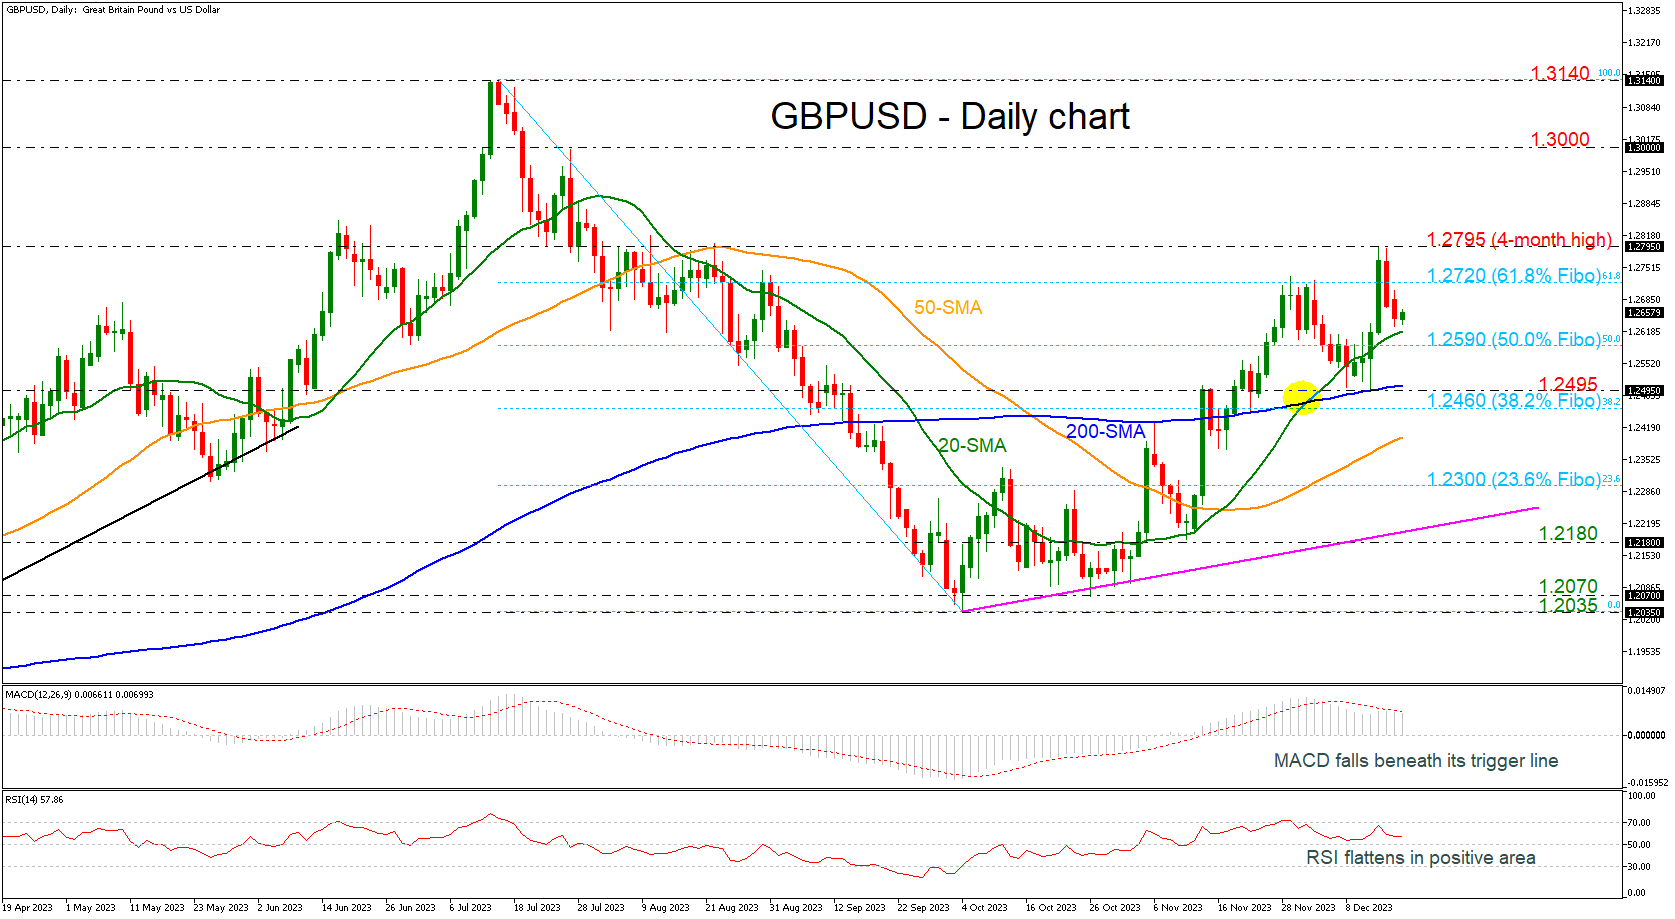
GBPUSD Attempts to Recoup Some Losses
- GBPUSD maintains weak bias in near term
- Falls from 4-month high
- MACD and RSI suggest horizontal move
GBPUSD climbed to a new four-month high in the previous week, but it reversed lower again, falling beneath the 61.8% Fibonacci retracement level of the down leg from 1.3140 to 1.2035 at 1.2720.
The next major support level for traders to have in mind is the 20-day simple moving average (SMA) at 1.2615, with the technical oscillators confirming another bearish wave. The MACD oscillator is falling beneath its trigger line in the positive territory, while the RSI is flattening above the 50 level.
If price action remains above the 50.0% Fibonacci of 1.2590, there is scope to test the 61.8% Fibonacci of 1.2720. Clearing this key level would see additional gains towards the four-month peak of 1.2795. This is considered to be a strong resistance area which has been rejected a few times in the past. Rising above it could see prices re-test the 1.3000 round number, taken from the peak on July 27.
If 1.2590 support fails, then the focus would shift to the downside towards 1.2495, which overlaps with the 200-day SMA. If breached, that would increase downside pressure, and perhaps bring about a reversal until the 38.2% Fibonacci of 1.2460 and the 50-day SMA at 1.2400. From here, GBPUSD would be on the path towards the 23.6% Fibonacci of 1.2300 ahead of the short-term ascending trend line at 1.2200.
Overall, GBPUSD has been bullish since bottoming at 1.2035. However, near-term weakness is expected to remain as long as technical oscillators are still losing some steam.
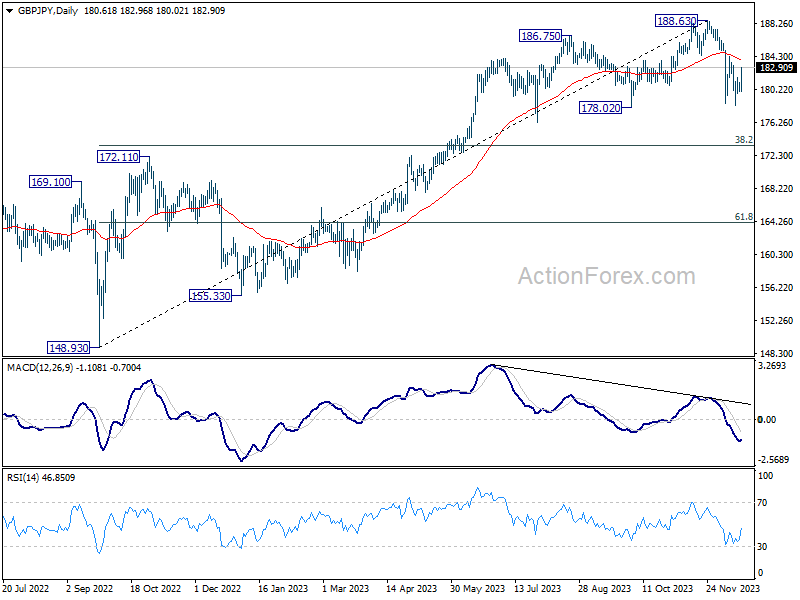
GBP/JPY Daily Outlook
Daily Pivots: (S1) 179.99; (P) 180.59; (R1) 181.20; More...
GBP/JPY's rebound from 178.32 accelerates higher today and focus is back on 184.43 resistance. Firm break there will argue that pull back from 188.63 has completed and bring retest of this high. Nevertheless, rejection by 184.43, followed by break of 178.32, will resume the whole fall from 188.63 to 38.2% retracement of 148.93 to 188.63 at 173.46.
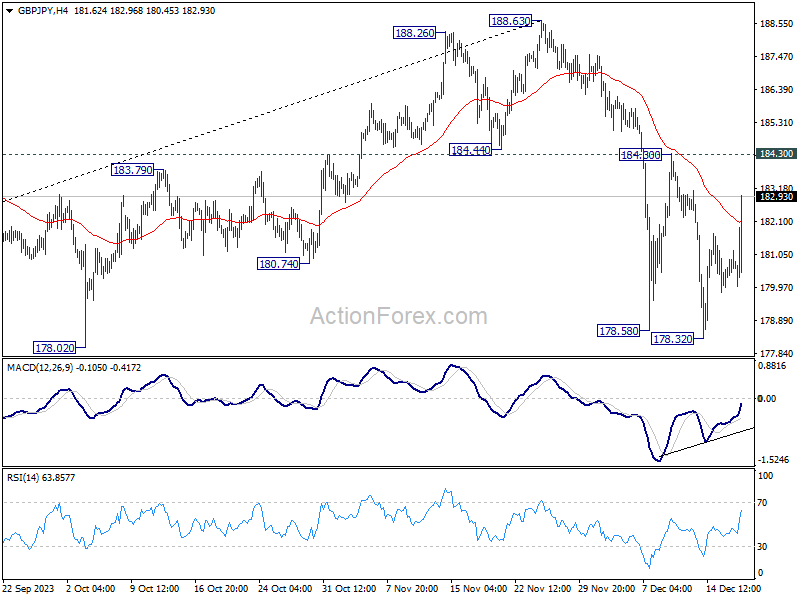
In the bigger picture, price actions from 188.63 medium term top are currently seen as a correction to the up trend from 148.93 (2022 low) only. As long as 172.11 resistance turned support holds, larger up trend from 123.94 (2020 low) is still in favor to resume through 188.63 at a later stage.
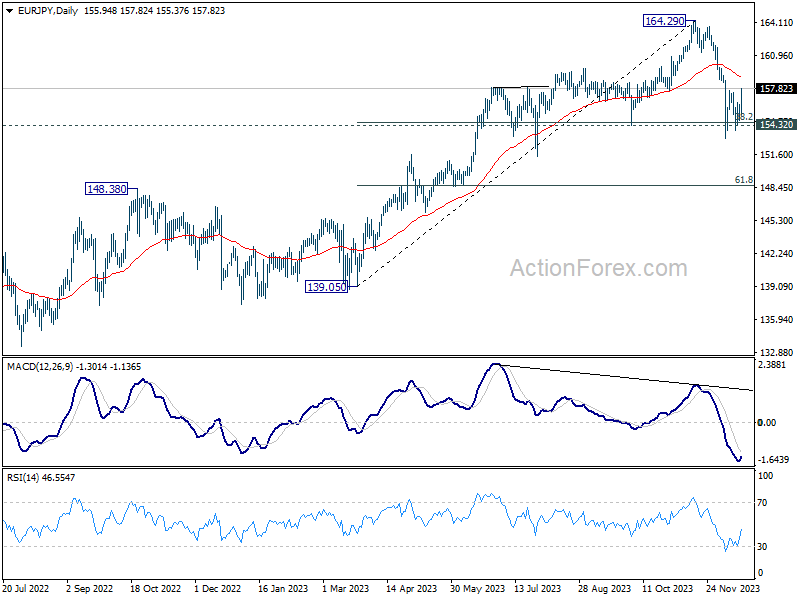
EUR/JPY Daily Outlook
Daily Pivots: (S1) 155.11; (P) 155.71; (R1) 156.59; More..
EUR/JPY's breach of 157.67 resistance suggest that rebound from 153.15 is resuming. Intraday bias is back on the upside for 55 D EMA (now at 159.00). On the downside, break of 153.15 will resume whole fall from 164.39 to 61.8% retracement of 139.05 to 164.29 at 148.69.
In the bigger picture, price actions from 164.29 medium term top are tentatively seen as a correction to rise from 139.05 for now. As long as 148.48 resistance turned support holds (2022 high), larger up trend from 114.42 (2020 low) could still resume through 164.29 at a later stage.
Yen weakens further after BoJ Ueda’s dovish press conference
Japanese Yen's decline gained momentum following dovish comments by Bank of Japan (BoJ) Governor Kazuo Ueda in the post-meeting press conference. Ueda reaffirmed the central bank's readiness to take "additional easing steps if necessary," highlighting the "extremely high" level of uncertainty surrounding the economy.
Addressing the possibility of a policy adjustment in January meeting, Ueda downplayed the likelihood of an abrupt rate hike, stating, "I don't think the chance is high for us to say abruptly that we will hike rates at a subsequent meeting." He also mentioned that "we won't see much new data" to come before the meeting, except branch managers' meeting which will provide insights into regional economies.
Ueda spoke about various policy scenarios under consideration, recognizing the high degree of uncertainty in current economic forecasts. He noted the difficulty in outlining a clear exit strategy from the ultra-loose monetary policy due to the unpredictability of achieving sustainable and stable inflation at the target level. Ueda assured that once the BoJ foresees conditions aligning with their targets, more information will be disclosed.
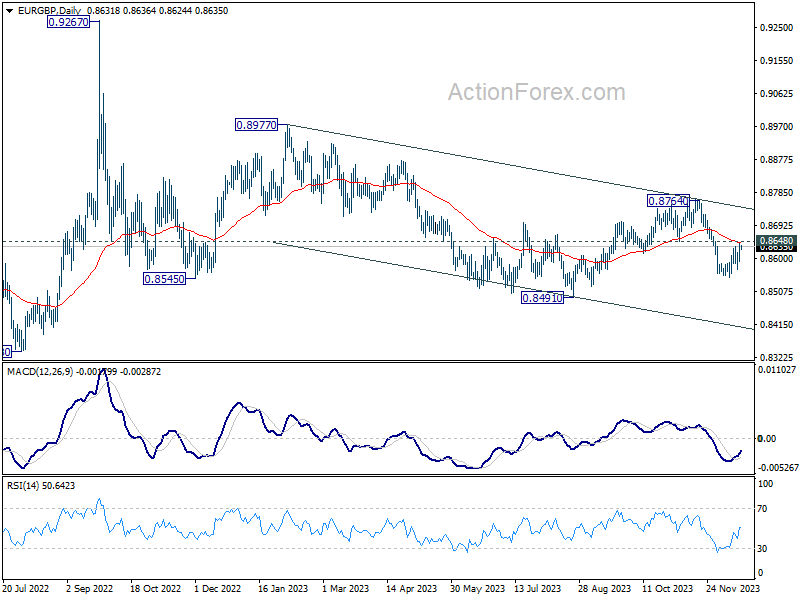
EUR/GBP Daily Outlook
Daily Pivots: (S1) 0.8600; (P) 0.8624; (R1) 0.8660; More....
Intraday bias in EUR/GBP stays neutral as consolidation from 0.8548 is still extending. Further decline is expected as long as 0.8648 support turned resistance holds. On the downside, break of 0.8548 will resume the decline from 0.8764 to retest 0.8419 low next. However, sustained break of 0.8648 will turn bias to the upside for stronger rebound.
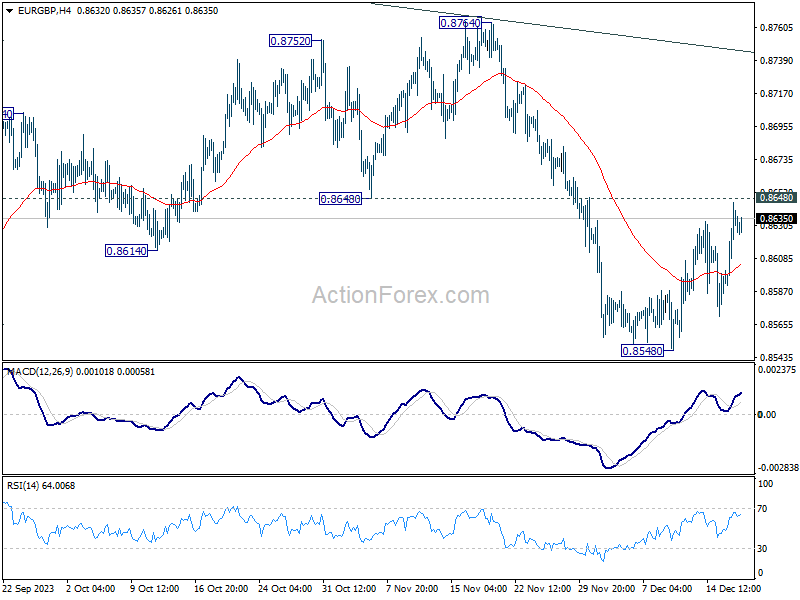
In the bigger picture, current development suggests that down trend from 0.9267 (2022 high) is still in progress. This decline is seen as the third leg of the pattern from 0.9499 (2020 high). Break of 0.8201 will target 100% projection of 0.9499 to 0.8201 from 0.9267 at 0.7969. In any case, outlook will stay bearish as long as 0.8764 resistance holds.