
Sample Category Title
WTI Oil Turns Down, But 2020 Trendline Feeds Hopes
- WTI oil futures driven by bears
- Will the 2020 bar block the way down?
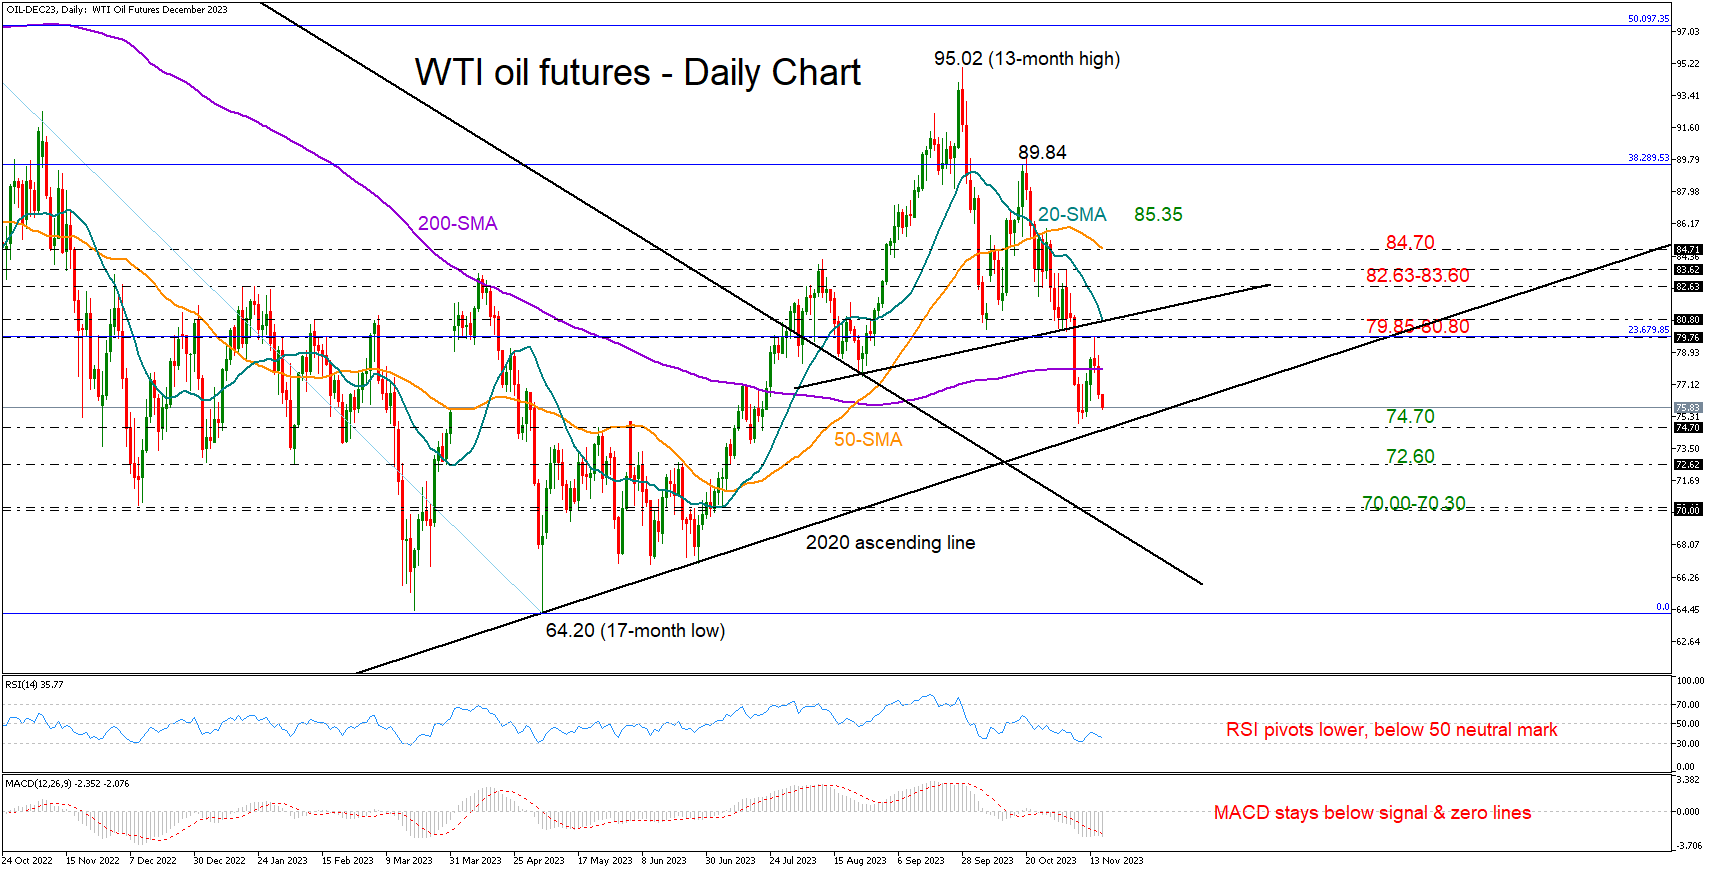
WTI oil futures reversed their post-CPI increase above the 200-day SMA, dropping immediately after reaching a high of 79.77 on Tuesday.
The RSI and the MACD have resumed their negative slope in the bearish area, signaling more depressing sessions ahead. But the upcoming sessions might be quite interesting as the long-term support trendline, which connects the 2020 and 2023 lows, is within breathing distance at 74.70 and could still act as a safety net.
A step below that ascending trendline would dampen market sentiment, likely causing a quick downfall to 72.60. Should selling forces persist, the price could meet its 2022 trough within the 70.00-70.30 zone, while lower, the descending line drawn from March 2022 could come to the rescue at 69.00.
If buying appetite boosts the price above its 200-day SMA, the focus will turn again to this week’s high of 79.77, where the 23.6% Fibonacci retracement of the 2022-2023 downtrend is positioned. The 20-day SMA will be closely watched as well at 80.80 given its limitations in October, while the 82.60-83.60 territory could be another hurdle ahead of the 50-day SMA.
Summing up, despite the negative technical indicators, there is a chance for WTI oil futures to rotate higher when they reach the 2020 upward-sloping line at 74.70.
AUDUSD Pulls Back from a 3-Month High
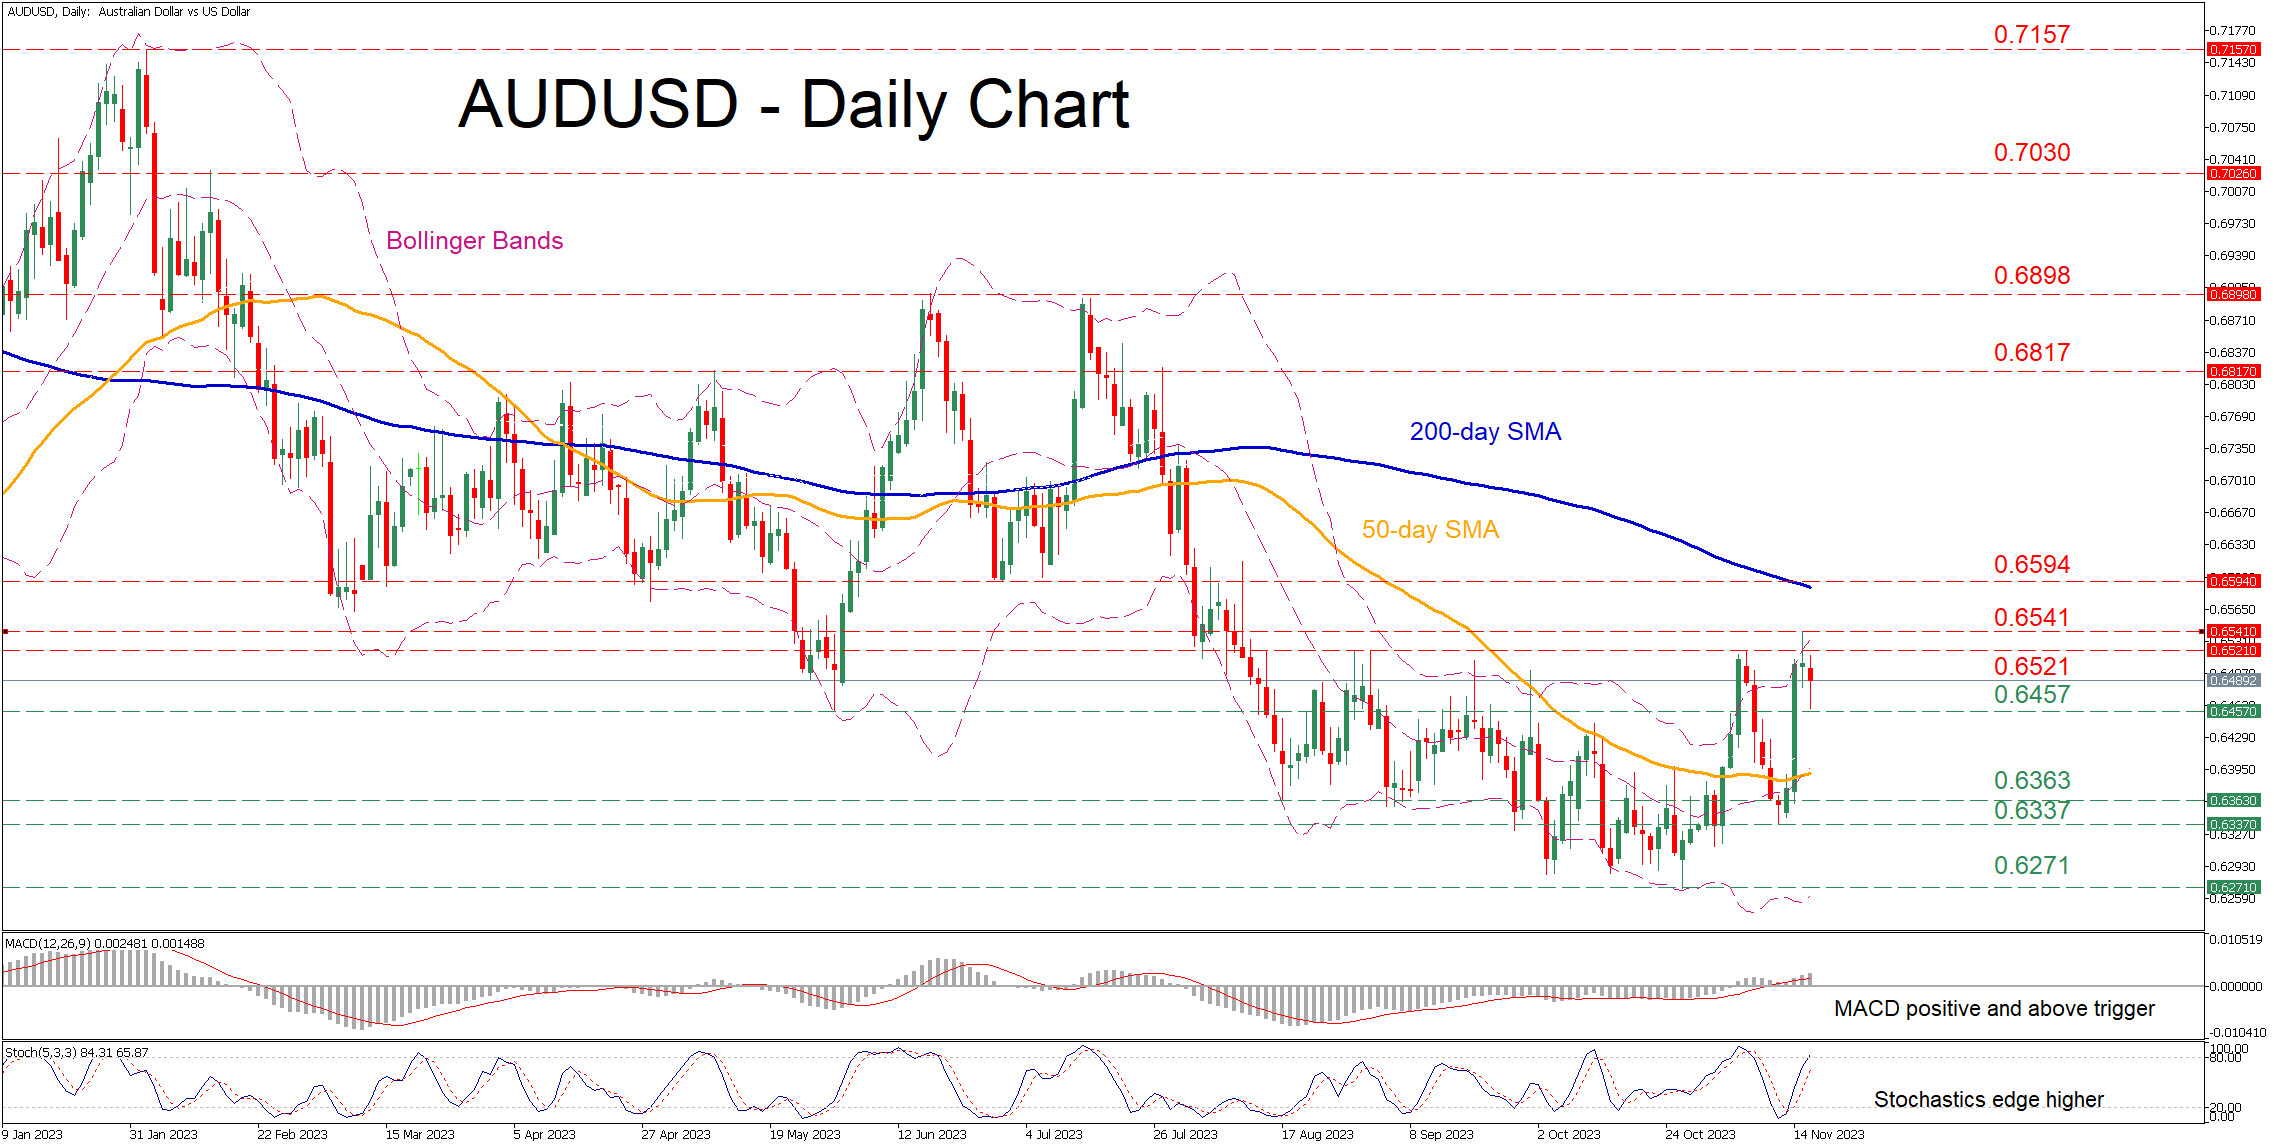
- AUDUSD hit a fresh three-month peak of 0.6541 on Wednesday
- But quickly pared some gains, hinting that the way to recovery is long
- Momentum indicators diverge from the price action
AUDUSD had been in an aggressive decline following a double top pattern in mid-July, with the pair posting consecutive multi-month lows. Even though the price spiked upwards following its bounce off the one-year low of 0.6271, its advance seems to be faltering, despite the momentum indicators being tilted to the upside.
Should the recent setback extend, the price could initially test the May low of 0.6457. A break beneath that region could pave the way for August-September support of 0.6363 ahead of the November bottom of 0.6337. Failing to halt there, the pair might revisit its one-year low of 0.6271.
On the flipside, bullish actions could propel the price towards the November resistance of 0.6521, which also held strong in September and August. Conquering this barricade, the bulls might attack the recent three-month high of 0.6541. Further upside attempts could then stall at the July support of 0.6594, which coincides with the 200-day simple moving average (SMA).
In brief, AUDUSD’s rebound appears to be losing steam amid diverging technical signals. For the bulls to regain confidence that the recovery could resume, the pair must reclaim the 200-day simple moving average (SMA).
US 30 Index Continues the Upside Rally Near 35,000
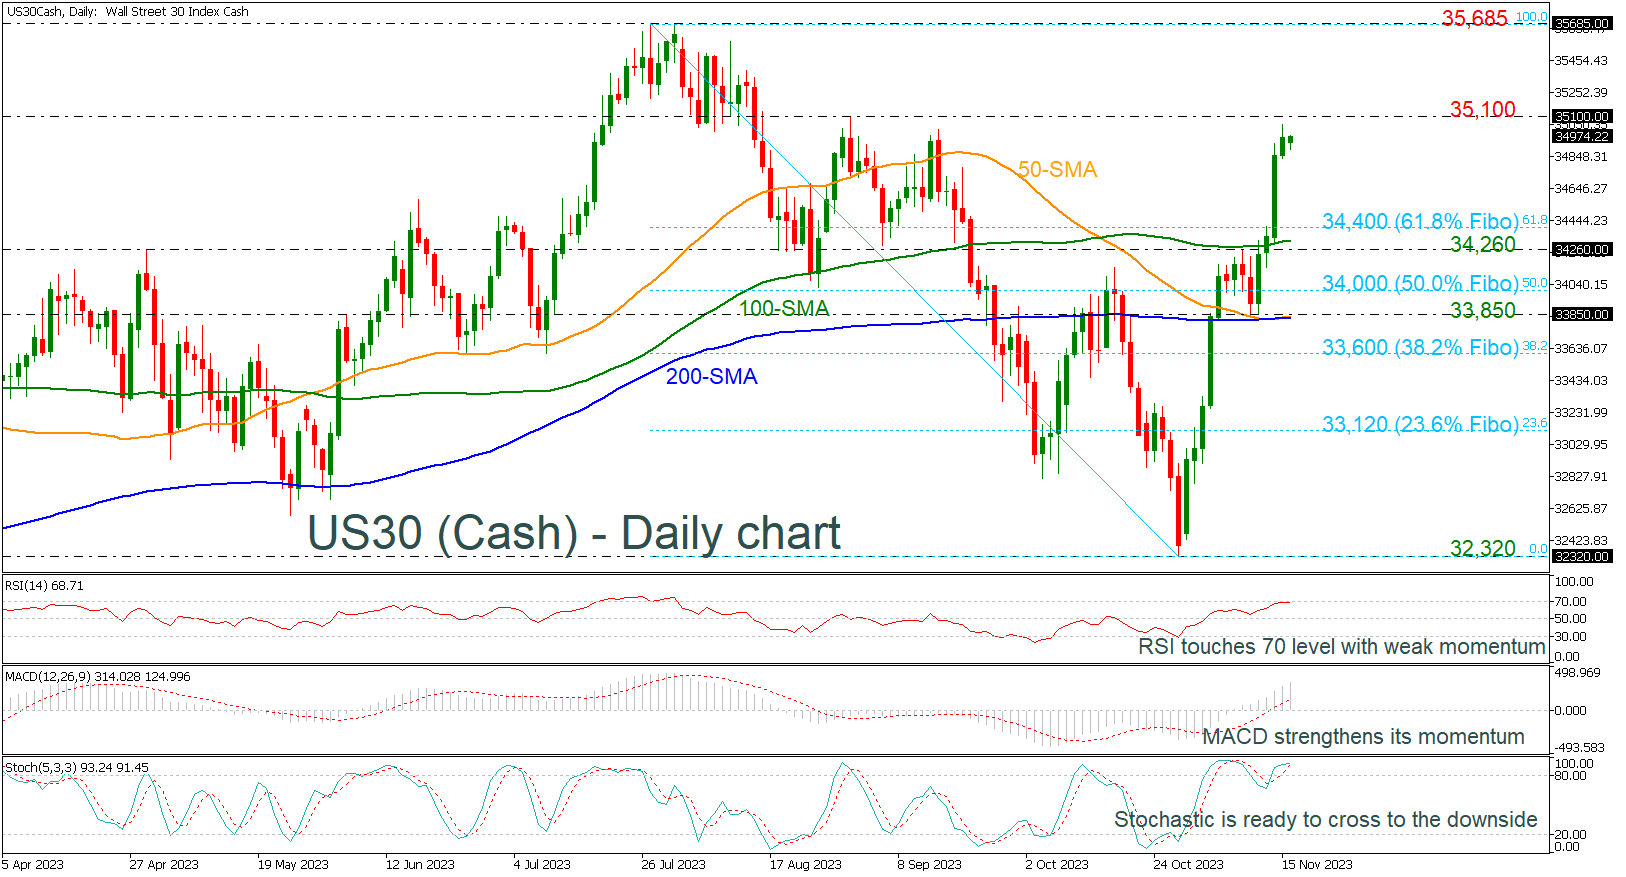
- US 30 holds above 61.8% Fibo and SMAs
- RSI and stochastic suggest bearish correction in near term
- Only a move above 35,985 would shift broader bias to positive
The US 30 (Cash) index has advanced considerably after the bounce off the 32,320 support level, overcoming the 200-day simple moving average (SMA) and the shorter-term SMAs. Notably, the price is rallying well above the 61.8% Fibonacci retracement level of the down leg from 35,685 to 32,320 at 34,400 but with weaker momentum than before.
Technically, the RSI indicator found resistance near the 70 line and the stochastic oscillator is ready for a bearish crossover between its %K and %D lines in the overbought territory, both suggesting a negative correction in the near term. However, the MACD is still extending its bullish momentum above its trigger and zero lines, indicating more gains.
Immediate resistance is coming from the 35,100 barrier, taken from the peaks on August 31, before meeting the 35,685 barricade, registered in August 1. Any jump above these levels would shift the broader outlook to bullish as well.
Alternatively, if the bears take the lead, the price may head towards the 61.8% Fibonacci of 34,400 ahead of the 100-day SMA near the 34,260 support. Steeper losses would open the door for the 50.0% Fibonacci of 34,000 and the 33,850 zone, which stands near the bullish crossover within the 200- and the 50-day SMAs.
All in all, the US 30 index is looking bullish in the near term and any movements above 35,685 would brighten the long-term outlook too.
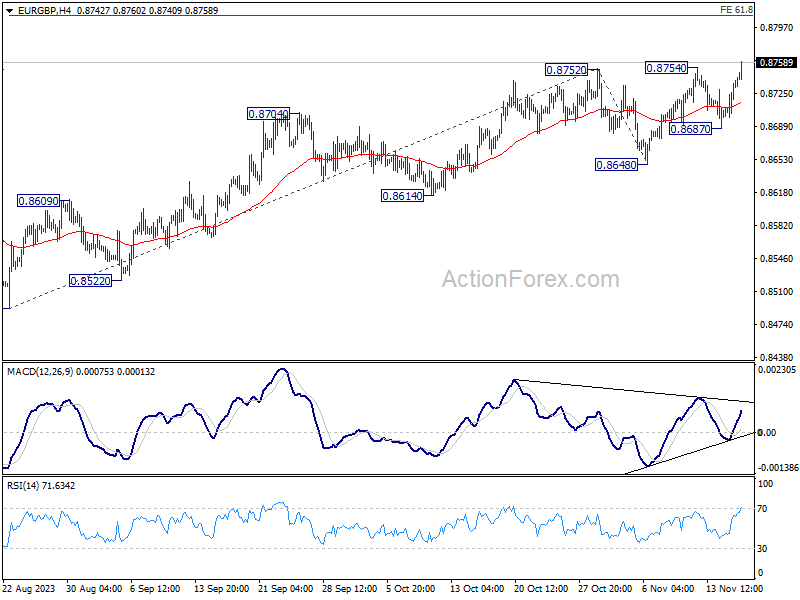
EUR/GBP: Hits New Multi-Month Highs, On Track For Eventual Clear Break of Pivotal Fibo Barrier
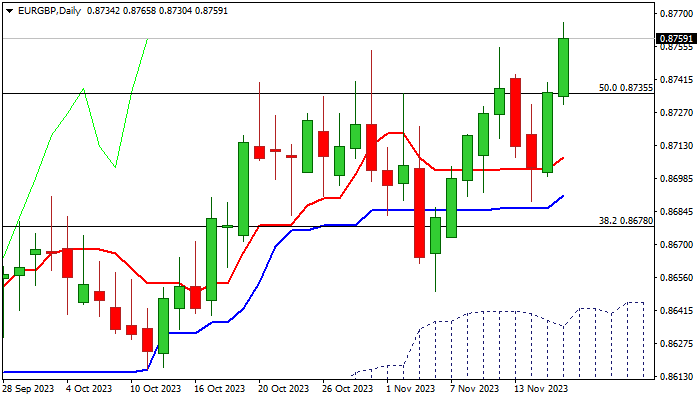
EURGBP holds firm bullish tone and extends fresh bullish acceleration into second consecutive day, trading at the highest levels since late April on Thursday morning.
The cross gained pace after lower than expected UK inflation in October deflated pound on fading expectations for further policy tightening.
Fresh advance is holding comfortably above pivotal Fibo level at 0.8735 (50% retracement of 0.8978/0.8492 downtrend) and on track to register eventual firm break above this level, after several attempts in past one month stalled here.
Rising positive momentum and moving averages in full bullish configuration on daily chart support the action, with close above 0.8735 and penetration into thickening weekly cloud (cloud base lays at 0.8765) to confirm bullish signal for test of next targets at 0.8792/0.8808 (Fibo 61.8% / weekly cloud top).
Broken Fibo 50% (0.8735) reverted to solid support and should hold to keep bulls intact,.
Conversely, another failure here would question bulls and add to risk of another bull-trap, though deeper drop and violation of rising 10DMA (0.8713) will be needed to weaken near-term structure and shift focus to the downside.
Res: 0.8765; 0.8792; 0.8808; 0.8863.
Sup: 0.8735; 0.8713; 0.8705; 0.8688.
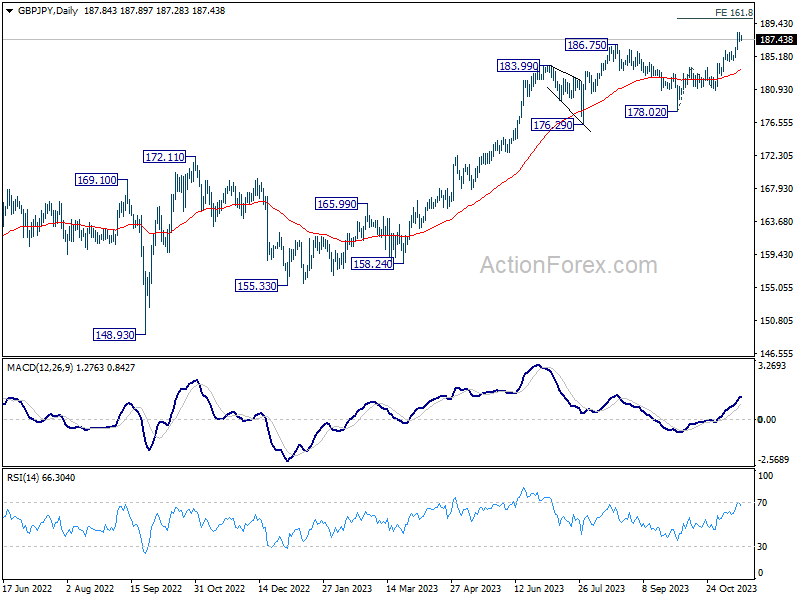
GBP/JPY Daily Outlook
Daily Pivots: (S1) 187.37; (P) 187.80; (R1) 188.41; More...
A temporary top is in place at 188.26 in GBP/JPY and intraday bias is turned neutral for consolidations. Downside should be contained by 55 4H EMA (now at 185.86) to bring rebound. Break of 188.26 will resume larger up trend to 161.8% projection of 178.02 to 183.79 from 180.74 at 190.07.
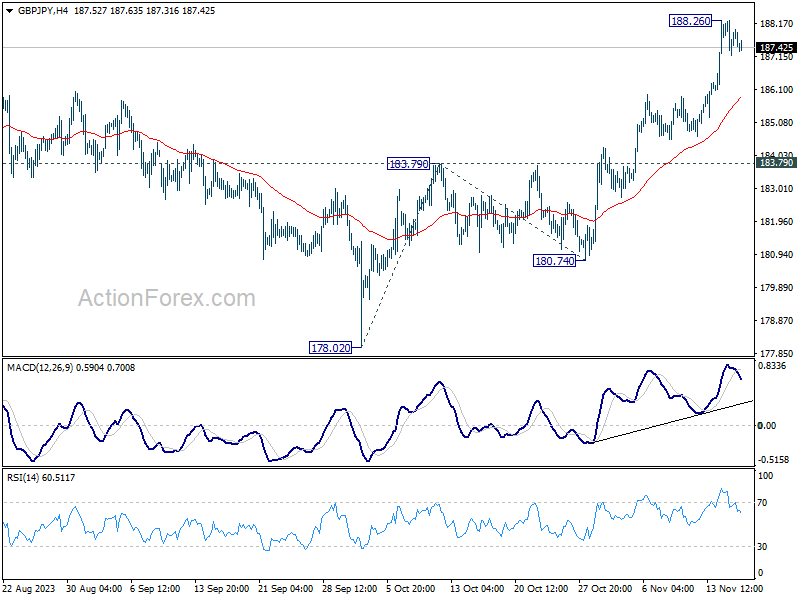
In the bigger picture, as long as 178.02 support holds, larger up trend from 123.94 (202 low) should still be in progress, next target is 195.86 (2015 high). For now, outlook will stay bullish as long as 183.79 resistance turned support holds, in case of deep pullback.
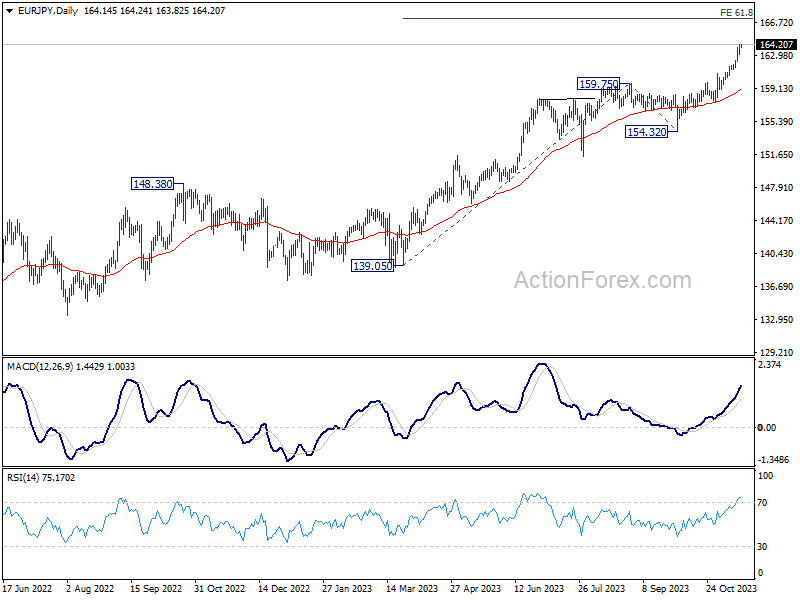
EUR/JPY Daily Outlook
Daily Pivots: (S1) 163.45; (P) 163.84; (R1) 164.60; More....
EUR/JPY's rally continues today and intraday bias stays on the upside. Next near term target is 61.8% projection of 139.05 to 159.75 from 154.32 at 167.11. On the downside, below 163.05 minor support will turn intraday bias neutral and bring consolidations first, before staging another rally.
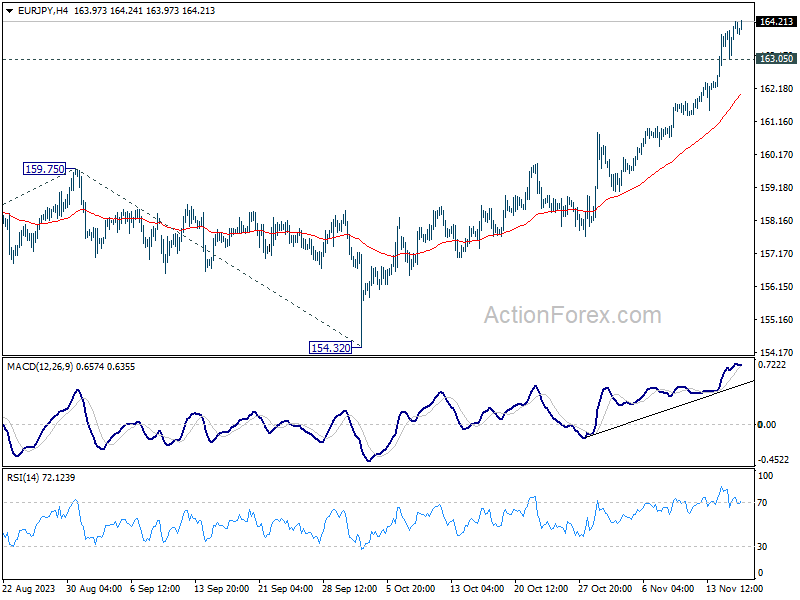
In the bigger picture, rise from 114.42 (2020 low) is in progress. Next target is 169.96 (2008 high). On the downside, break of 159.75 resistance turned support is needed to be the first sign of medium term topping. Otherwise, outlook will remain bullish even in case of deep pullback.
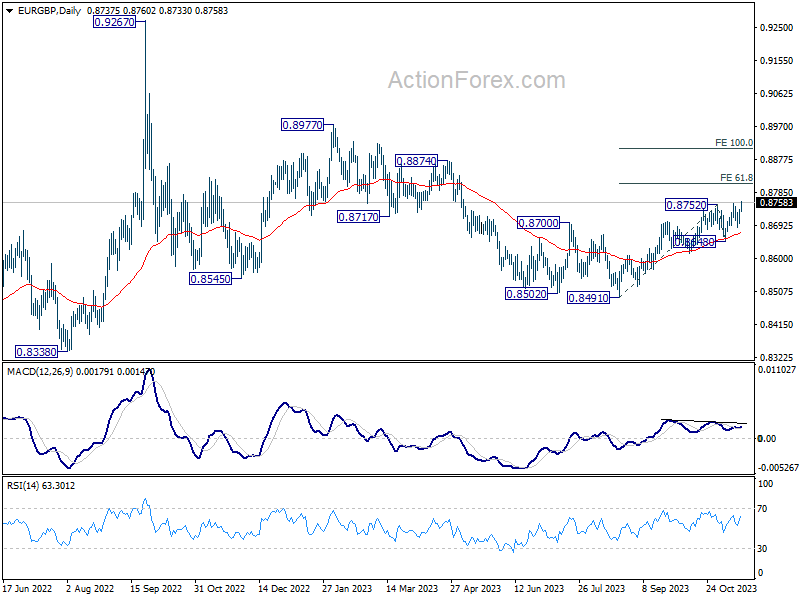
EUR/GBP Daily Outlook
Daily Pivots: (S1) 0.8685; (P) 0.8708; (R1) 0.8727; More....
EUR/GBP's strong rally and break of 0.8754 confirms resumption of whole rise from 0.8491. Intraday bias is back on the upside. Next target is 61.8% projection of 0.8491 to 0.8752 from 0.8648 at 0.8809. On the downside, break of 0.8687 support is needed to indicate short term topping. Otherwise, further rally remains in favor in case of retreat.
In the bigger picture, current development suggests that whole down trend from 0.9267 (2022 high) has completed with three down to to 0.8491. Rise from 0.8491 is seen as another leg inside that pattern from 0.9499 (2020 high). Further rally should be seen to 0.8977 resistance and above. This will remain the favored case as long as 0.8648 support holds.
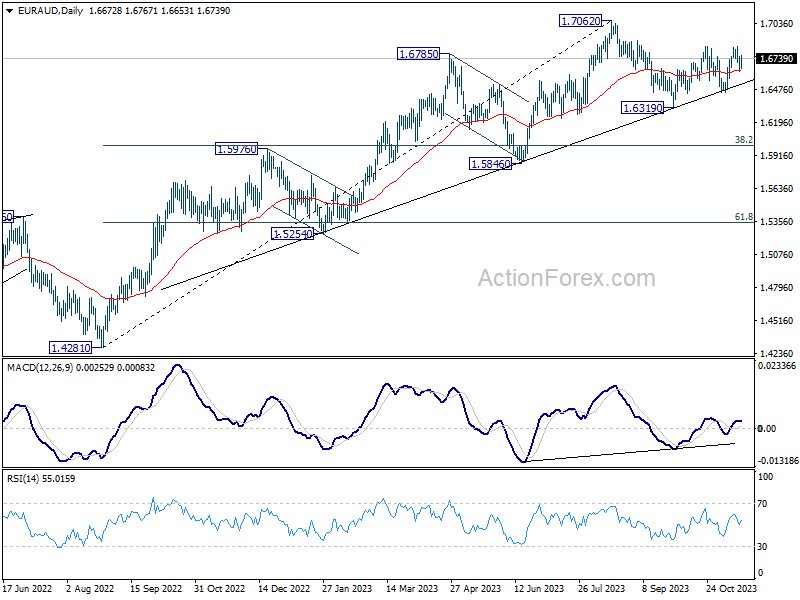
EUR/AUD Daily Outlook
Daily Pivots: (S1) 1.6612; (P) 1.6688; (R1) 1.6738; More...
EUR/AUD recovered quickly after dipping to 1.6631 and intraday bias remains neutral at this point. On the upside, sustained break of 1.6843 will resume the rebound from 1.6319 for retesting 1.7062 high next. On the downside, however, below 1.6631 minor support will turn bias back to the downside for 1.6449 support instead.
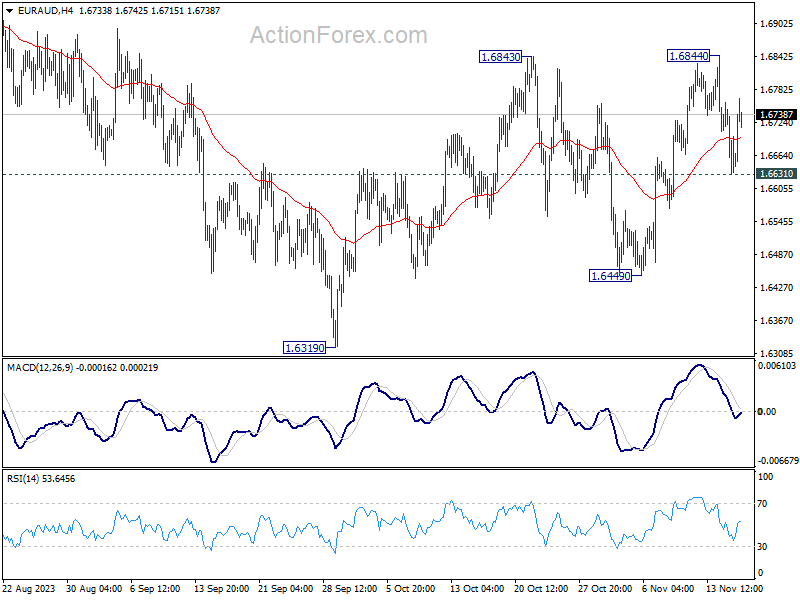
In the bigger picture, while 1.7062 is a medium term top, there is no clear sign of trend reversal as EUR/AUD continues to draw strong support from the medium term trend line. Break of 1.7062 will resume the larger up trend from 1.4281 (2022 low) to 1.7691 fibonacci level. Nevertheless, break of 1.6449 support will argue that deeper correction is underway to 38.2% retracement of 1.4281 to 1.7062 at 1.6000.
EUR/CHF Daily Outlook
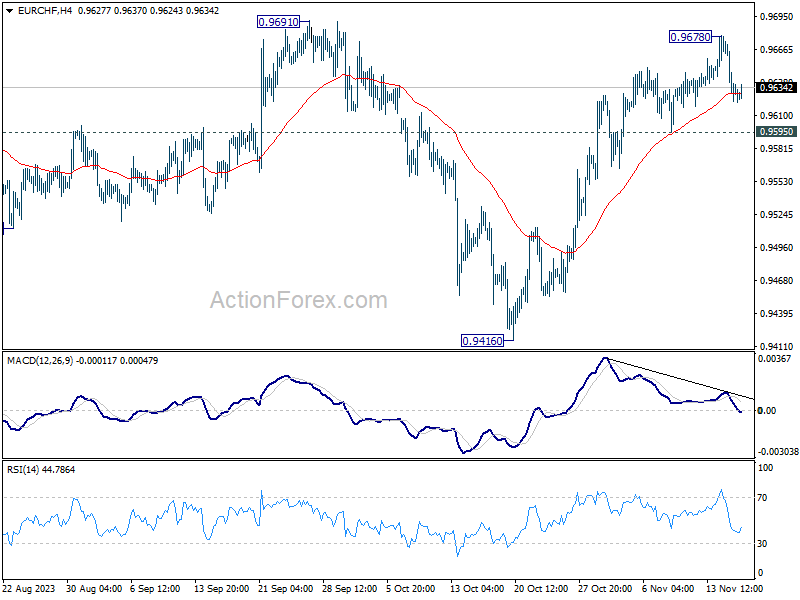
Daily Pivots: (S1) 0.9613; (P) 0.9644; (R1) 0.9665; More...
A temporary top was formed at 0.9678 in EUR/CHF, ahead of 0.9691 resistance. Intraday bias is turned neutral first. Another rise is expected as long as 0.9595 support holds. Firm break of 0.9691 will argue that whole decline from 1.0095 has completed, just ahead of 0.9407 support (2022 low). Nevertheless, break of 0.9595 support will indicate short term topping, and turn bias back to the downside for deeper pull back.
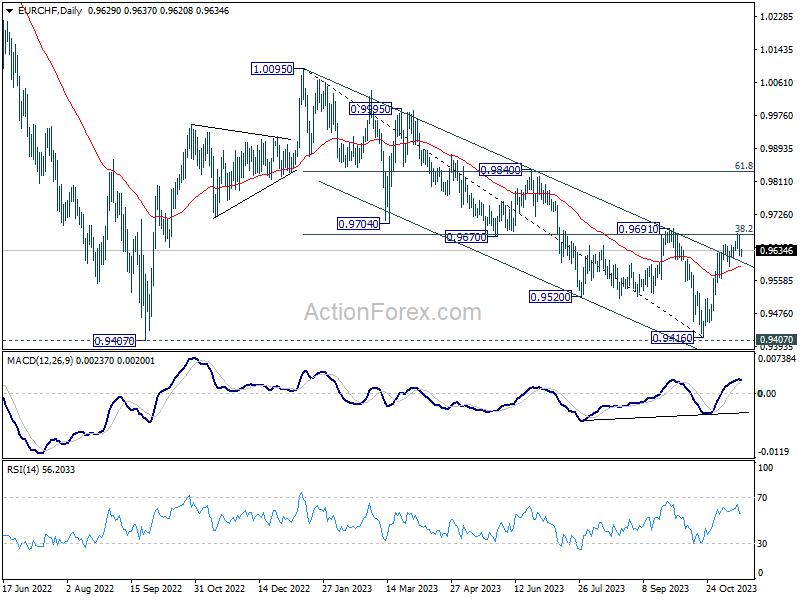
In the bigger picture, fall from 1.0095 (2023 high) might have completed at 0.9416, just ahead of 0.9407 support (2022 low). Sustained break of 0.9691 cluster resistance (38.2% retracement of 1.0095 to 0.9416 at 0.9675) will pave the way to 61.8% retracement at 0.9836 and above. However, rejection by 0.9691 will maintain medium term bearishness for another test on 0.9407 at least.
Euro Under Bearish Pressure
The euro (EUR) corrected throughout Wednesday and lost 0.3% after a substantial rise on Tuesday.
Possible effects for traders
Strong Retail Sales report and indications of easing inflation bolstered the U.S. dollar, contributing to beliefs about a 'soft landing' of the U.S. economy. This scenario suggests the Federal Reserve might delay rate cuts and keep the base rate high longer. Eurozone Industrial Production figures showed a month-over-month decrease of 1.1% in September, a drastic difference compared to a 0.6% increase previously. Annually, the production showed a decline of 6.9%, a larger one than the prior 5.1% decrease. Lower Industrial Production figures put a substantial downward pressure on the euro.
In today's Asian trading session, EURUSD lost momentum as increased U.S. dollar demand exerted bearish pressure on the pair. Market participants will closely observe the European Central Bank (ECB) President Christine Lagarde's speech at 11:30 a.m. UTC today and the release of the U.S. weekly Initial Jobless Claims at 12:30 p.m. UTC. The data could affect the euro's price.