Sample Category Title
Dollar Under Renewed Pressure Amid Signs of Cooling Job Market and Easing Price Pressures
Dollar is facing renewed selling pressure in the early US session, as fresh economic data points to a further cooling in the job market. A significant uptick in continuing jobless claims, reaching their highest level in nearly two years, suggests a softening labor environment.
Adding to this, deeper-than-expected decline in import prices, influenced by both fuel and non-fuel components, indicates easing price pressures. Concurrently, Philadelphia Fed manufacturing survey underscores ongoing industry challenges, marking the 16th month of contraction in the last 18 months.
These economic indicators collectively bolster the argument that Fed may have reached the end of its current tightening cycle. This perspective aligns with growing market sentiment that anticipates no more rate hike by Fed. Instead, loosening would probably start in the first half of next year.
Elsewhere in the currency markets, Japanese Yen and Euro emerge as the day's strongest performers, with Swiss Franc also gaining ground. On the other hand, commodity-linked currencies, along with British pound, are facing challenges. Their performance throughout the remainder of the session is likely to hinge on shifts in global risk sentiment.
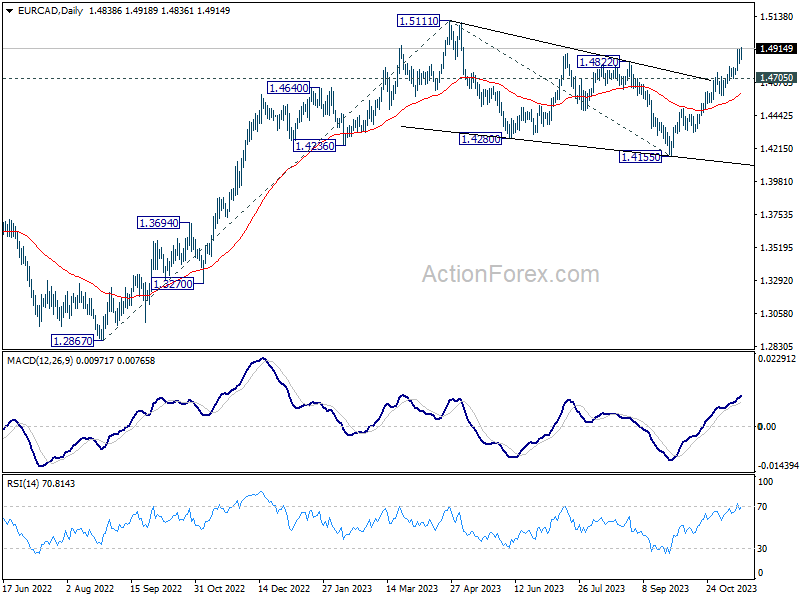
From a technical standpoint, EUR/CAD marches on as rise from 1.4155 is extending. As noted in previous reports, correction from 1.5111 should have completed with three waves down to 1.4155. Retest of 1.5111 high should be seen next. Firm break there will resume larger up trend from 1.2867. This will now remain the favored case as long as 1.4705 support holds.
In Europe, at the time of writing, FTSE is down -0.56%. DAX is up 0.67%. CAC is down -0.15%. Germany 10-year yield is down -0.0405 at 2.604. Earlier in Asia, Nikkei dropped -0.28%. Hong Kong HSI fell -1.36%. China Shanghai SSE fell -0.71%. Singapore Strait Times rose 0.03%. Japan 10-year JGB yield fell -0.0065 to 0.791.
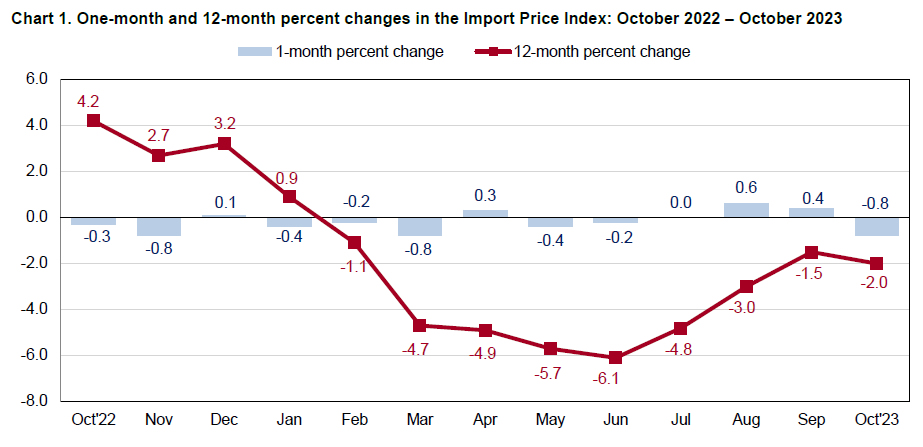
US import price fell -0.8% mom in Oct
US import price index fell -0.8% mom in October, larger decline than expectation of -0.3% mom. That's the first monthly drop since June, and the largest since March.
Prices for import fuel declined -6.3% mom, after advancing 6.3% mom the previous month. The October drop was the first 1-month decrease since May and the largest monthly decline since September 2022.
Nonfuel import prices declined -0.2% mom for the third consecutive month. Prices for nonfuel imports have not recorded a monthly advance since February.
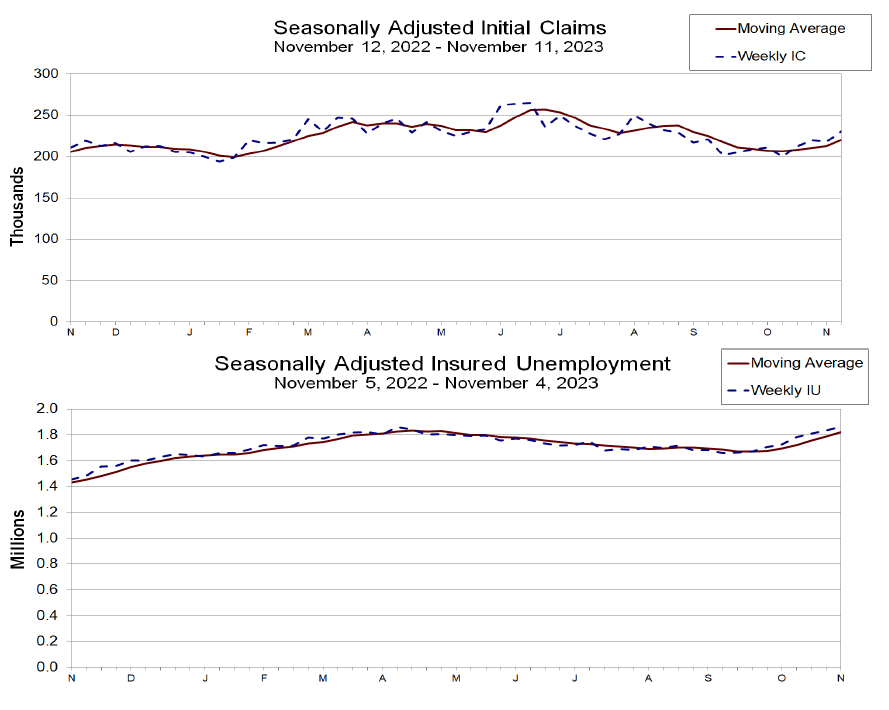
US initial jobless claims rose to 231k, continuing claims highest in nearly two years
US initial jobless claims rose 13k to 231k in the week ending November 11, above expectation of 222k. Four week moving average of initial claims rose 8k to 220k.
Continuing claims rose 32k to 1865k in the week ending November 4. That's the highest level since November 27, 2021. Four-week moving average of continuing claims rose 34.5k to 1823k.
BoE's Greene: Incredibly high wage growth remains a concern
BoE monetary policymaker Megan Greene expressed cautious optimism in a recent interview with Bloomberg TV, acknowledging the positive signs of declining inflation in the UK.
Greene noted that the recent data, which showed a drop in inflation to 4.6% and a weakening in wage growth, was indeed "good news." However, she voiced concerns about the persistence of inflation, particularly in the services component of CPI. Besides, her apprehension primarily stems from the still elevated wage growth, which she described as "incredibly high."
She emphasized the challenges posed by this situation, stating, "If we have an economy with fairly low productivity growth and really high wage growth, it's going to be hard to hit the (2% inflation) target."
Australia's employment grows 55k, yet signs of cooling emerge
Australia's labor market displayed stronger-than-anticipated performance in October, with employment figures surpassing expectations. The economy added 55k jobs, well above forecasted growth of 22.8k. This increase was driven by both full-time and part-time employment, which rose by 17k and 37.9k respectively.
Despite this robust job growth, unemployment rate edged up slightly from 3.6% to 3.7%, aligning with market expectations. Participation rate also saw an uptick, rising by 0.2% to 67.0%. Additionally, month-over-month hours worked in the economy increased by 0.5%.
Bjorn Jarvis, ABS head of labour statistics, noted that over the past two months, this equates to an average monthly employment growth of approximately 31k people, slightly lower than average growth of 35k people a month since October 2022.
He also highlighted that annual growth rate in hours worked has slowed to 1.7%, down from around 5% mid-year, and lower than annual employment growth of 3.0%. This slowdown may suggest that "the labour market is starting to slow, following a particularly strong period of growth."
Japan's exports increase for second month, despite persistent decline in China shipments
In October, Japan experienced a mixed bag in its trade sector. Exports saw a modest rise of 1.6% yoy to JPY 9167B, marking the second consecutive month of growth, albeit at a slower pace compared to September's 4.3% yoy increase.
One notable aspect was the continued decline in shipments to China, which fell by -4.0% yoy. This marks the eleventh consecutive month of decline, underscoring the strained trade relations and potentially shifting economic alliances in the region.
Conversely, exports to the US surged by 8.4% yoy, buoyed by robust demand for hybrid vehicles and mining and construction machinery. This surge propelled the value of U.S.-bound shipments to record levels. Similarly, exports to Europe experienced a healthy increase of 8.9% yoy, indicating diversified trade relations.
On the import front, Japan witnessed a significant drop of -12.5% yoy to JPY 9810B. The trade balance resulted in a deficit of JPY -663B.
Looking at seasonally adjusted terms, both exports and imports saw month-on-month declines, with exports decreasing by -1.2% mom to JPY 8800B and imports falling by -0.7% mom to JPY 9262B. Consequently, trade deficit widened from September's JPY -420B to JPY -462B.
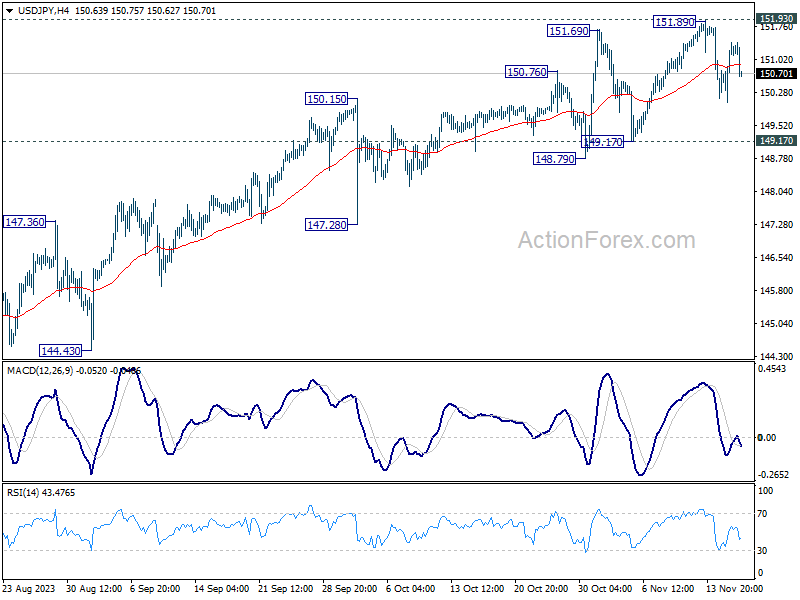
USD/JPY Mid-Day Outlook
Daily Pivots: (S1) 150.49; (P) 150.95; (R1) 151.86; More...
USD/JPY dips notably in early US session but stays well inside established range of 149.17/151.89. Intraday bias stays neutral for the moment. Further rally is in favor as long as 149.17 support holds. On the upside, decisive break of 151.93 resistance will confirm resumption of long term up trend. Next target will be 157.69 projection level. However, firm break of 149.17 will be a sign of bearish reversal and bring deeper fall to 147.28 support first.
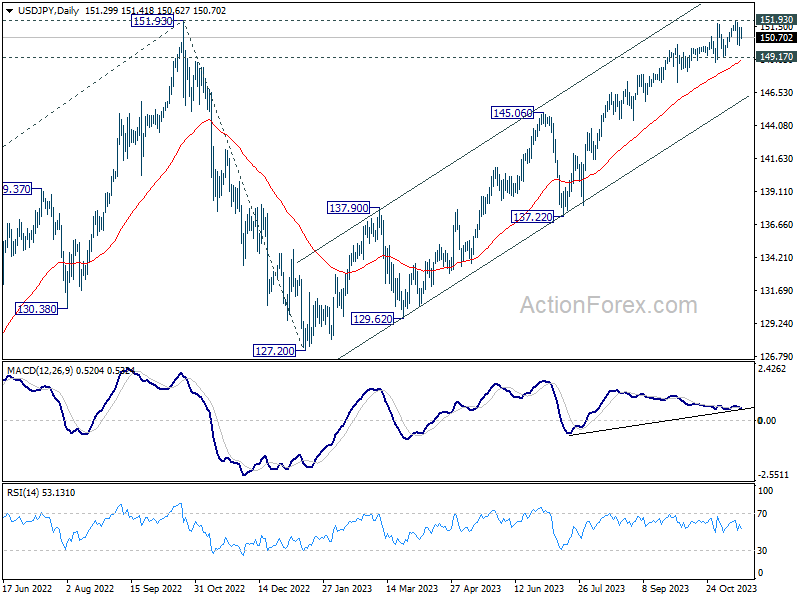
In the bigger picture, immediate focus is now on 151.93 resistance (2022 high). Rejection by 151.93, followed by sustained break of 145.06 resistance turned support will argue that rise from 127.20 has completed, and turn outlook bearish for 137.22 support and below. However, sustained break of 151.93 will confirm resumption of long term up trend. Next target will be 61.8% projection of 102.58 (2021 low) to 151.93 from 127.20 at 157.69.
Economic Indicators Update
| GMT | Ccy | Events | Actual | Forecast | Previous | Revised |
|---|---|---|---|---|---|---|
| 23:50 | JPY | Trade Balance (USD) Oct | -0.46T | -0.71T | -0.43T | |
| 23:50 | JPY | Machinery Orders M/M Sep | 1.40% | 0.90% | -0.50% | |
| 00:00 | AUD | Consumer Inflation Expectations Nov | 4.90% | 4.80% | ||
| 00:30 | AUD | Employment Change Oct | 55.0K | 22.8K | 6.7K | |
| 00:30 | AUD | Unemployment Rate Oct | 3.70% | 3.70% | 3.60% | |
| 04:30 | JPY | Tertiary Industry Index M/M Sep | -1.00% | -0.10% | -0.10% | 0.70% |
| 13:15 | CAD | Housing Starts Y/Y Oct | 275K | 255K | 270K | |
| 13:30 | USD | Initial Jobless Claims (Nov 10) | 231K | 222K | 217K | 218K |
| 13:30 | USD | Import Price Index M/M Oct | -0.80% | -0.30% | 0.10% | 0.40% |
| 13:30 | USD | Philadelphia Fed Manufacturing Survey Nov | -5.9 | -11 | -9 | |
| 14:15 | USD | Industrial Production M/M Oct | -0.40% | 0.30% | ||
| 14:15 | USD | Capacity Utilization Oct | 79.40% | 79.70% | ||
| 15:00 | USD | Natural Gas Storage |
US import price fell -0.8% mom in Oct
US import price index fell -0.8% mom in October, larger decline than expectation of -0.3% mom. That's the first monthly drop since June, and the largest since March.
Prices for import fuel declined -6.3% mom, after advancing 6.3% mom the previous month. The October drop was the first 1-month decrease since May and the largest monthly decline since September 2022.
Nonfuel import prices declined -0.2% mom for the third consecutive month. Prices for nonfuel imports have not recorded a monthly advance since February.
US initial jobless claims rose to 231k, continuing claims highest in nearly two years
US initial jobless claims rose 13k to 231k in the week ending November 11, above expectation of 222k. Four week moving average of initial claims rose 8k to 220k.
Continuing claims rose 32k to 1865k in the week ending November 4. That's the highest level since November 27, 2021. Four-week moving average of continuing claims rose 34.5k to 1823k.
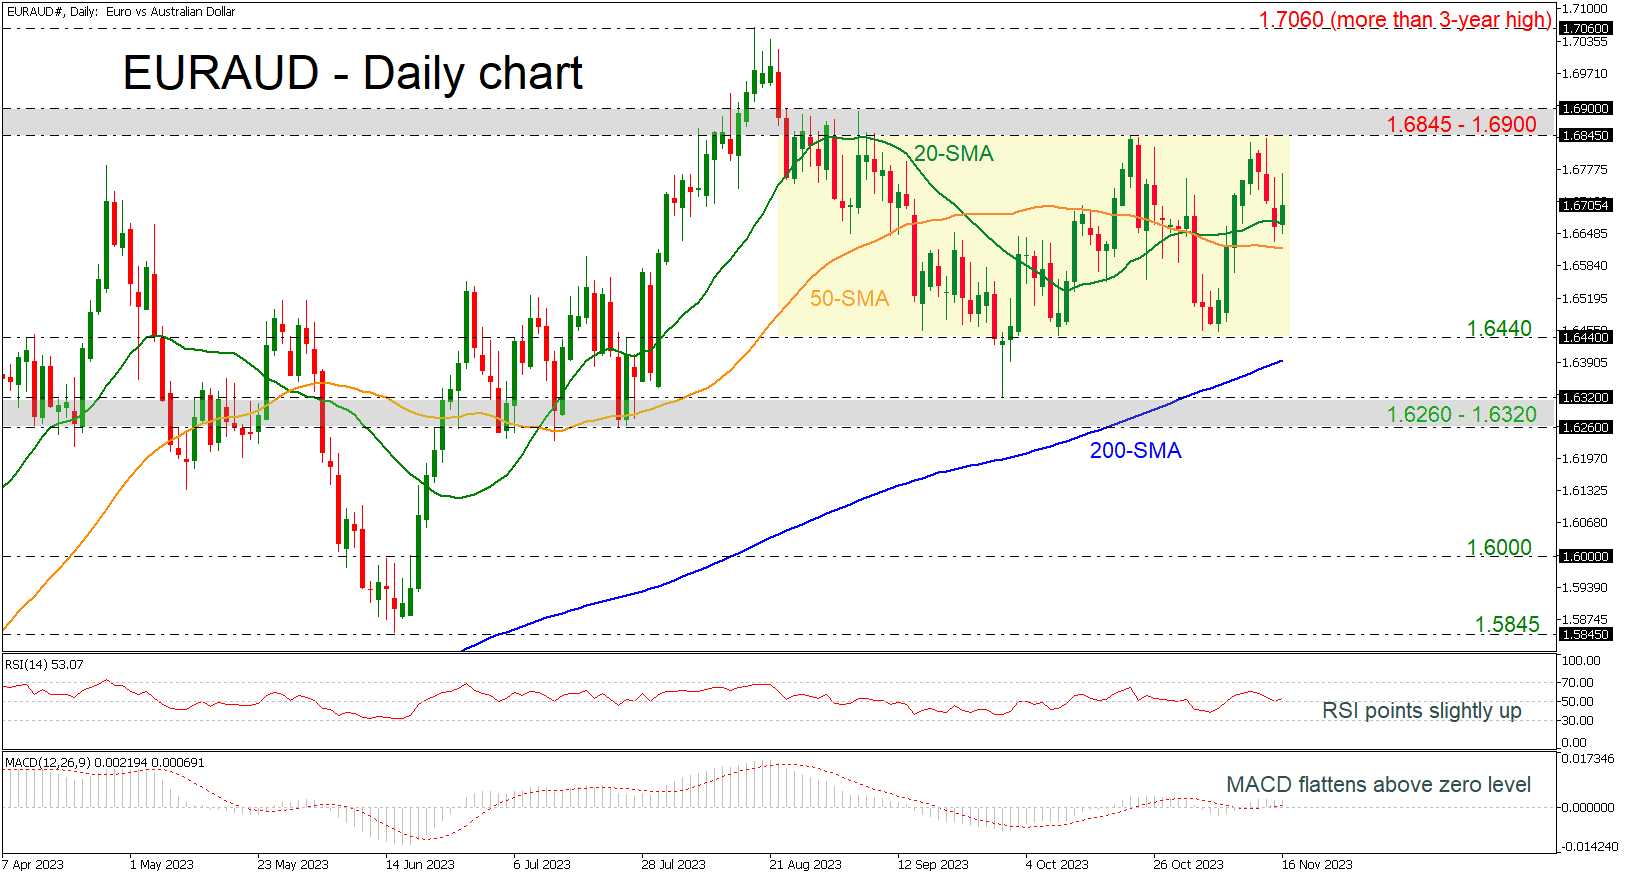
EURAUD Holds in Sideways Channel Around 1.6700
- EURAUD bounces off 20-day SMA
- Momentum indicators confirm the weak momentum
EURAUD has been developing within a trading range of 1.6440 to 1.6845 since August 23 with the short-term simple moving averages (SMAs) acting as mid-levels.
The technical oscillators are confirming the sideways move, as the MACD is flattening near its zero level and the RSI is ticking marginally up around the neutral threshold of 50.
If buyers stay in play, the door will open for the tight zone of 1.6845 – 1.6900. Running higher, the pair will have to face the more-than-three-year high of 1.7060 and if there is a break of it, that would shift the neutral outlook to positive.
Should the bears press the price below lower, the 20- and the 50-day SMAs around 1.6670 and 1.6620 respectively may prevent an aggressive downfall towards the lower boundary of the range at 1.6440. If the latter gives way too, the decline could continue towards the 200-day SMA at 1.6395 before testing the 1.6260 – 1.6320 support area.
In a nutshell, despite the latest existing rebound off the 20-day SMA, there are some obstacles to consider before a real bullish trend reversal takes place. The pair needs to break the trading range to show a clear trend direction.
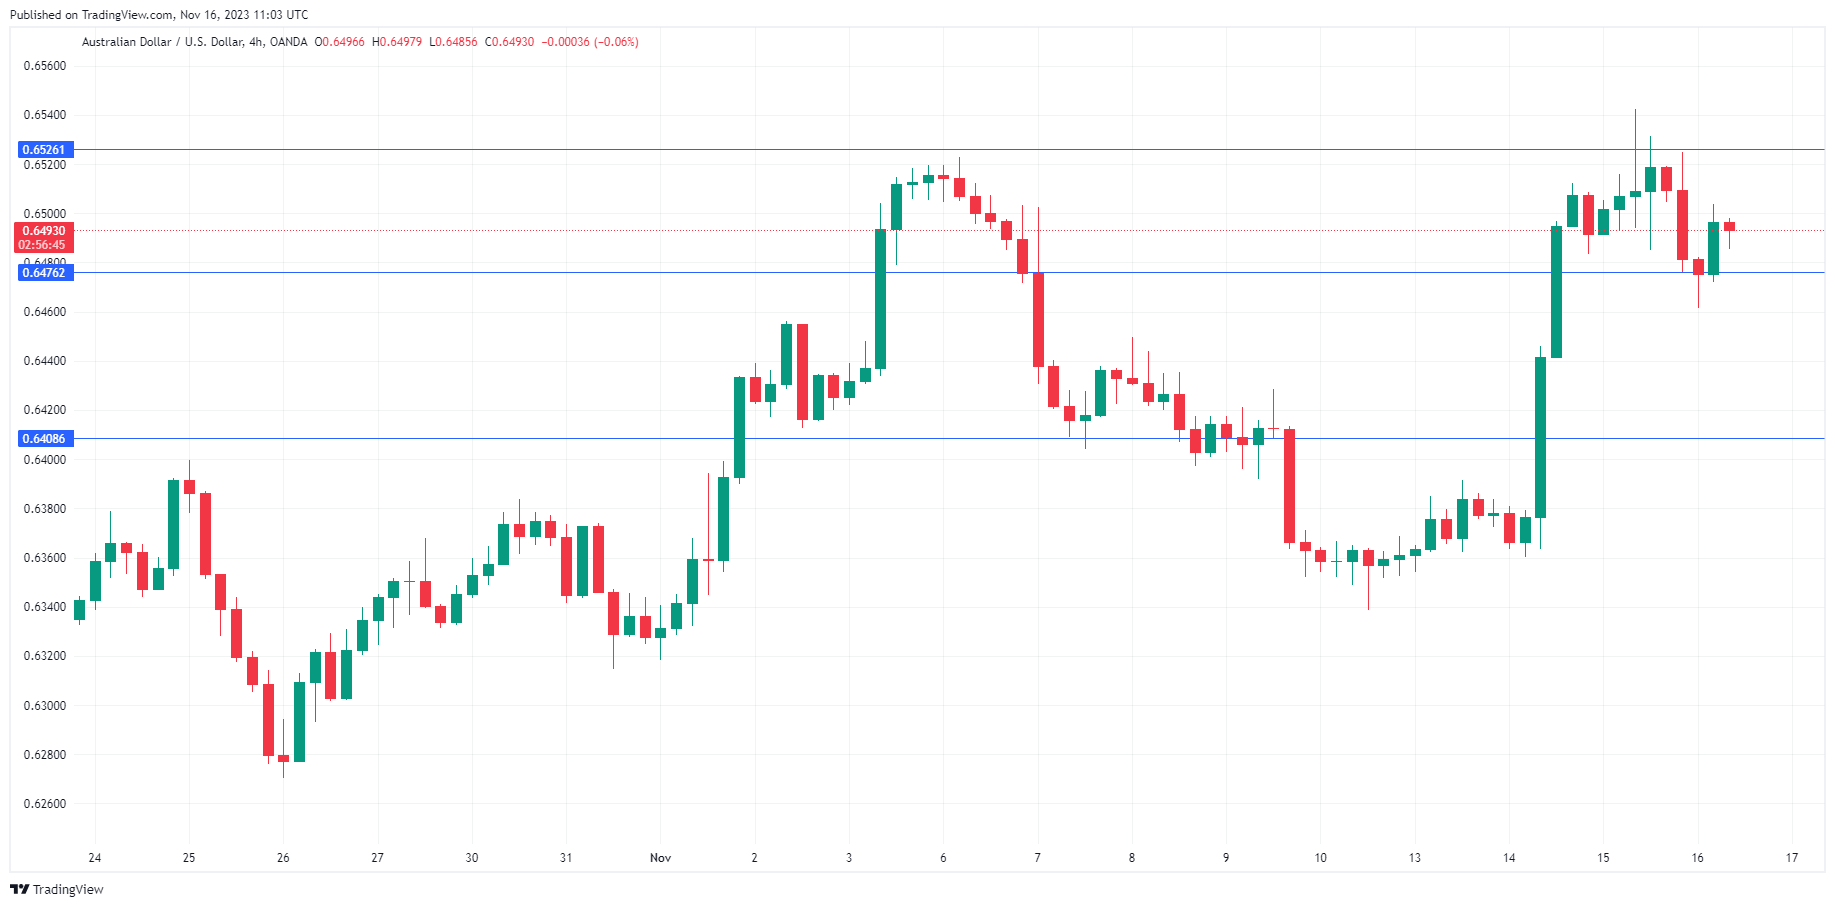
Australian Dollar Yawns After Strong Employment Gains
- Australia’s employment jumps
The Australian dollar is lower on Thursday. In the European session, AUD/USD is trading at 0.6492, down 0.27%.
Australian employment jumps
Australian employment was hotter than expected in October, as the economy created 55,000 jobs. This blew past the market consensus of 20,000 and was much higher than the modest September gain of 7,800. The unemployment rate rose to 3.7% as expected, up from 3.6%, and the participation rate inched higher to 67%, up from 66.8%.
The employment report was positive but is unlikely to have much impact on the central bank’s rate policy. The sharp gain in jobs was mostly in part-time positions, with the October 14th referendum responsible for many temporary positions. The markets shrugged off the data and the Australian dollar gave up ground before recovering.
The markets have fully priced in a pause at the December meeting after the Reserve Bank of Australia raised rates earlier this month to 4.35%. A rate hike in February 2024 is possible, but that decision will depend on the data, particularly the fourth-quarter inflation report in January.
Australian wage growth climbed 1.3% q/q in the third quarter, matching the consensus estimate and above an upwardly revised 0.9% gain in Q2. This was the highest gain since records started in 1997, but the spike was largely due to an increase in minimum wage and a pay rise for elderly care workers. As with the employment release, the sharp increase in wage growth was largely ignored by the markets and had little impact on the Australian dollar.
In the US, retail sales fell 0.1% in October, better than the market consensus of -0.3% but well below the September revised reading of 0.9%. This snapped a six-month streak of gains and is another sign that elevated rates continue to cool the economy.
AUD/USD Technical
- AUD/USD tested support at 0.6476 earlier. Below, there is support at 0.6408
- 0.6526 and 0.6592 are the next resistance lines
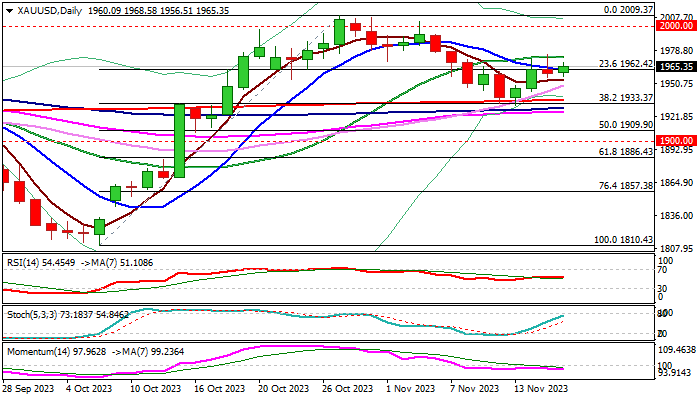
XAU/USD: Gold Remains Constructive Though Still Looking for Clearer Direction Signal
Gold regained traction on Thursday after three-day recovery was strongly rejected on Wednesday, remaining biased higher, although still capped under pivotal barriers at $1970/73 (50% retracement of $2009/$1931/20DMA).
Wednesday’s bearish candle with long upper shadow warns about recovery stall and the downside will remain vulnerable (on threats of bull-trap) as long as $1970/73 resistances cap, as momentum remains negative on daily chart.
Gold benefited from fresh signals that Fed’s tightening cycle is near its end and despite still constructive dollar, however, more work on either side will be required to generate clearer direction signal.
Bullish scenario requires sustained break above $1970/73 pivots to signal an end of $2009/$1931 corrective phase and confirm continuation of recovery from $1931 higher low (underpinned by a bear-trap under 200DMA).
Caution on repeated failure at $1970/73 zone which would boost signals that recovery is running out of steam, which would keep at risk lower pivots at $1936/33 (200DMA/Fibo 38.2% of $1810/$2009) loss of which to generate signal of bearish continuation of the leg from $2009 (Oct 27 high) on completion of failure swing pattern on daily chart.
Res: 1970; 1973; 1979; 1991.
Sup: 1954; 1943; 1936; 1933.
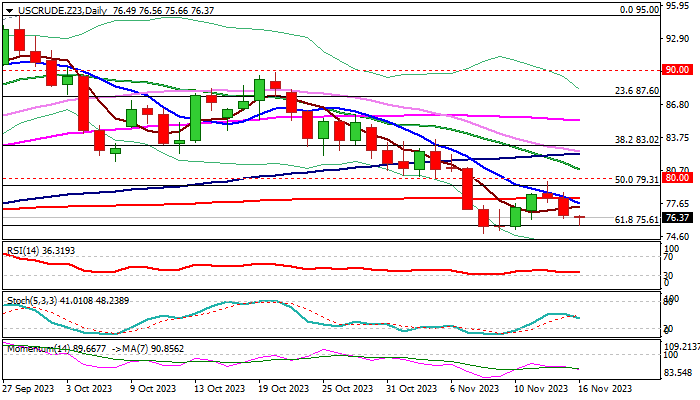
WTI Oil: Worries About China Demand and Rise in US Crude Inventories Keep Bears in Play
WTI oil price holds in red for the third straight day and pressuring pivotal Fibo support at $75.61 (61.8% retracement of $63.63/$95.00 rally) which was dented last week, but with triple failure to register close below support and generate fresh bearish signal.
Technical picture on daily chart remains bearish as negative momentum continues to strengthen and MA’s are in bearish setup, with formation of 10/200DMA death-cross, adding to bearish near-term outlook.
Sustained break of $75.61 pivot is needed to signal continuation of a larger downtrend, which paused for a limited correction and expose next targets at $71.03 (Fibo 76.4%) and $70.00 (psychological).
Broken 200DMA ($78.12) should keep the upside protected to maintain bearish near-term bias and guard upper pivots at $79.75 (recovery top of Nov 14) and $80 (psychological).
Weakening fundamentals on record production in the US, rise of US crude stocks above expectations and fears that China’s economy may further struggle to recover to pre-pandemic levels, which would further harm demand and keep oil prices under pressure for now.
Res: 76.56; 77.38; 78.12; 79.31.
Sup: 75.61; 74.92; 73.38; 71.73.
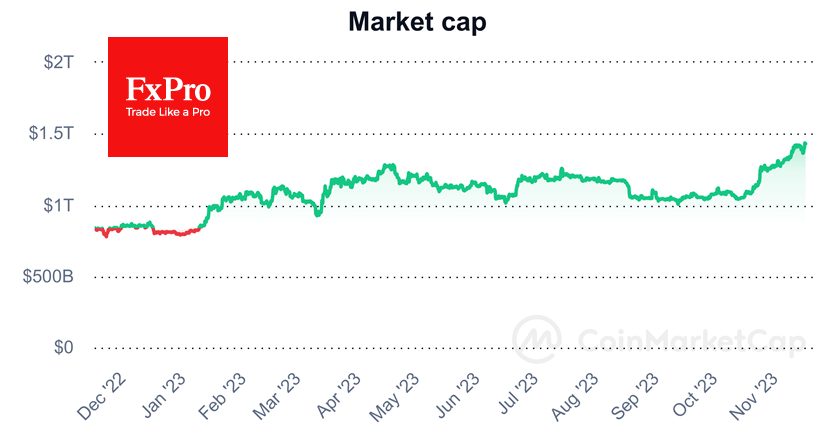
Crypto Market Soars to New Heights
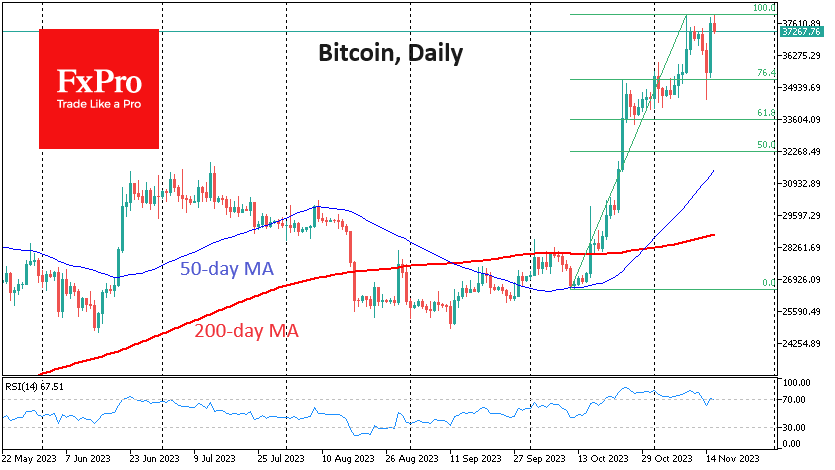
Market picture
On Wednesday, the crypto market experienced a new growth spurt, rising 4.6% in 24 hours to $1.44 trillion, updating highs since May 2022. Bitcoin and several altcoins returned to the highs they tested a week earlier. Cardano (+11.11%) and Solana (+10.5%) led the growth among the leading coins.
Once again, the dynamics of crypto and equity markets have diverged. However, it should be noted that this seemingly negative correlation only works in the short term, as both asset classes have been rising steadily since October.
Bitcoin tested the $38K area again on Thursday morning. For now, it is not giving up. A move higher would renew the highs from May 2022, and it makes sense that the bulls would need a reason to break it up. However, the chances of further gains are higher than a reversal to the downside. If we accept that Tuesday’s decline was a correction, it has opened the way to $45-46K.
News background
The crypto market showed resilience in the third quarter, maintaining a steady pace of venture deals and investment volume despite a general downward trend in 2023, according to Binance Research. Venture capital funds invested the most in gamification projects, payment systems and trading platforms.
The US SEC filed 784 enforcement actions in fiscal 2023 and received $4.9 billion in penalties, of which $930 million was distributed to affected investors.
US financial conglomerate Citigroup announced the launch of an app that uses blockchain technology and smart contracts to support bilateral spot foreign exchange transactions.
Uniswap Labs released a cryptocurrency wallet app for Android. The tool allows users to exchange via a decentralised exchange directly within the app, eliminating the need for a separate browser extension.
According to Kaiko, Solana (SOL) has soared 520% in the last 12 months, ranking sixth in the cryptocurrency capitalisation league table. The Solana network developers’ partnership with Google, Circle and Amazon will increase the altcoin’s appeal. The increase in the number of DeFi protocols based on this blockchain will also help increase the value of the digital currency.
BoE’s Greene: Incredibly high wage growth remains a concern
BoE monetary policymaker Megan Greene expressed cautious optimism in a recent interview with Bloomberg TV, acknowledging the positive signs of declining inflation in the UK.
Greene noted that the recent data, which showed a drop in inflation to 4.6% and a weakening in wage growth, was indeed "good news." However, she voiced concerns about the persistence of inflation, particularly in the services component of CPI. Besides, her apprehension primarily stems from the still elevated wage growth, which she described as "incredibly high."
She emphasized the challenges posed by this situation, stating, "If we have an economy with fairly low productivity growth and really high wage growth, it's going to be hard to hit the (2% inflation) target."
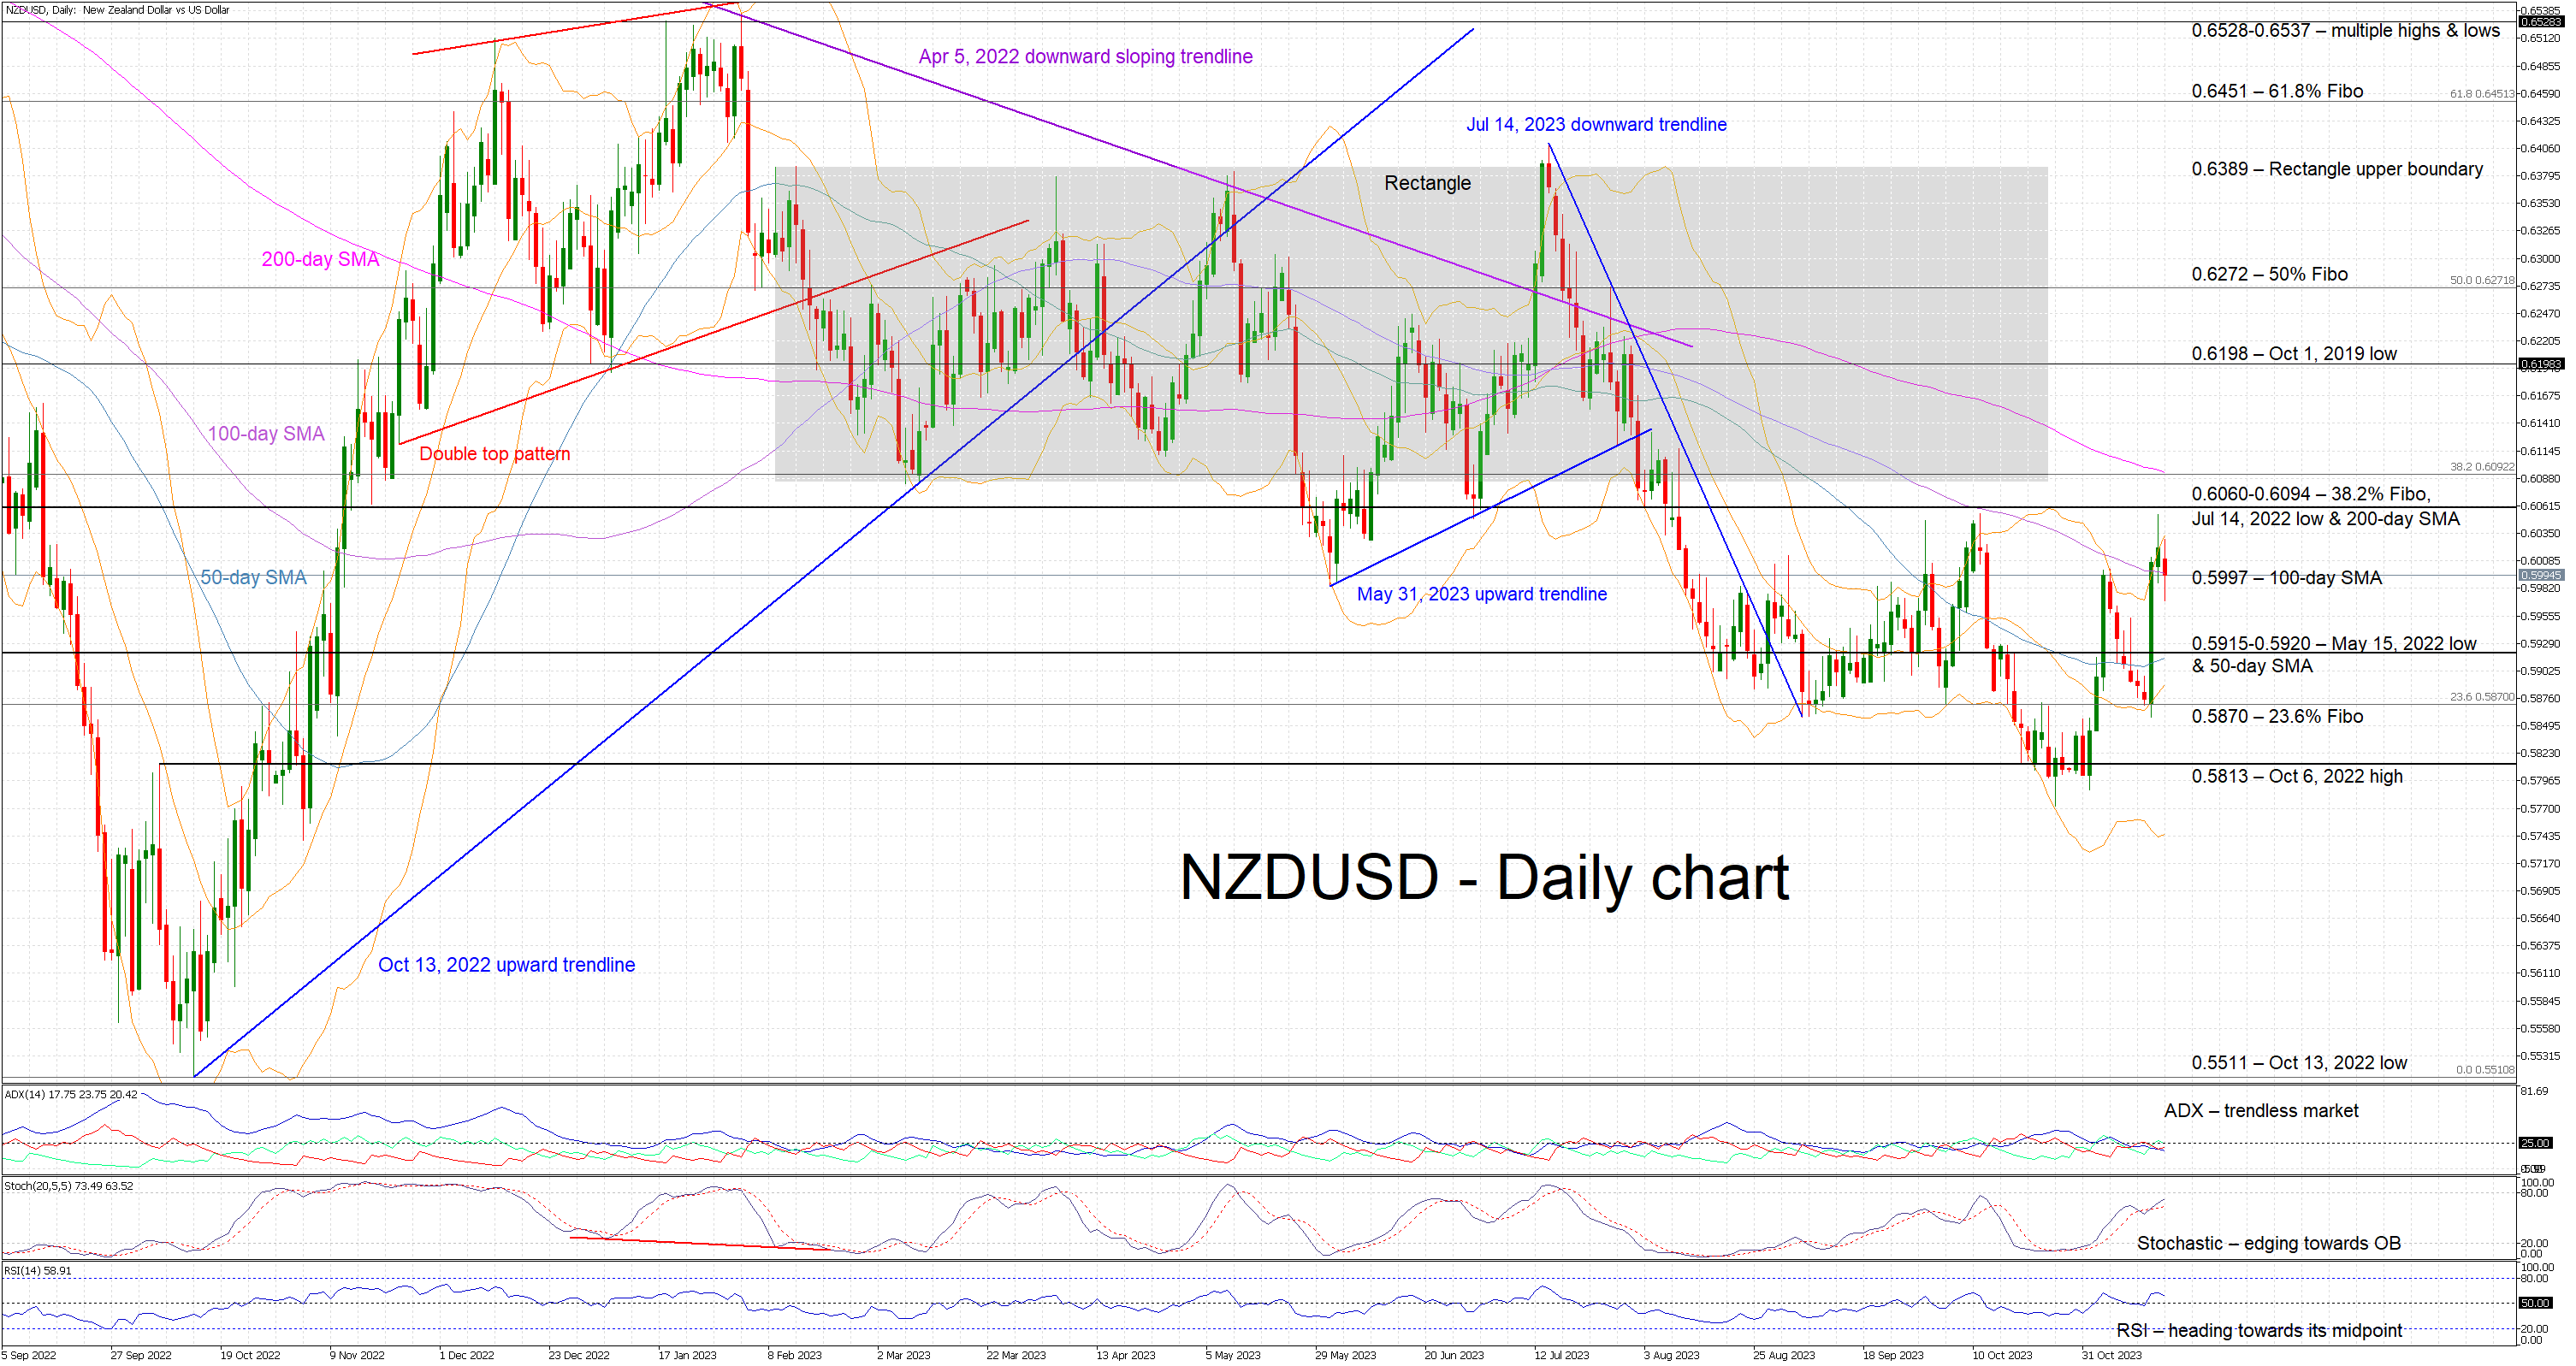
Could NZDUSD Enter a New Downtrend?
- NZDUSD in the red today after testing the October high
- USD recovery across the board drives today’s move
- Mixed Momentum indicators complicate the short-term outlook
NZDUSD is edging lower, reacting to Tuesday's very strong green candle that pushed the pair towards the October 11 high of 0.6054. NZDUSD bulls took advantage of the widespread USD weakness but failed to overcome the 0.6060 level and are now testing the support set by the 100-day simple moving average (SMA). In the meantime, a double top pattern appears to be forming but a move below the 0.5772 neckline is needed for this structure to become active.
Amidst these developments, the focus has turned to the mixed momentum indicators. More specifically, the Average Directional Movement Index (ADX) points to a trendless market, and the RSI is edging lower but remains above its 50-midpoint. More importantly, the stochastic oscillator has moved above its moving average and is heading for its overbought territory. A higher high in the stochastic oscillator without a similar print in NZDUSD would be considered a bearish signal.
If the bulls remain confident, they could try to keep NZDUSD above the 100-day SMA at 0.5997 and then gradually push towards the busier 0.6060-0.6094 region. This is defined by the 38.2% Fibonacci retracement of the April 5, 2022 – October 13, 2022 downtrend, the July 14, 2022 low and the 200-day SMA. If successful, the bulls could have the chance to record a new 3-month high, opening the door for a protracted move towards the next resistance area that stands at 0.6198.
On the flip side, the bears are trying to regain market control. They could try to keep NZDUSD below the 0.5997 level and then set a course towards the 0.5915-0.5920 range that is populated by the May 15, 2022 low and the 50-day SMA. Lower, the bears could face strong support at both the 0.5870 and 0.5813 levels.
To sum up, NZDUSD bulls have made their move, but they appear to lack the strength to record a new higher high. They now have to defend their recent gains against the resurgent bears.