Sample Category Title
CHFJPY Impulse Structure Should Extend Higher
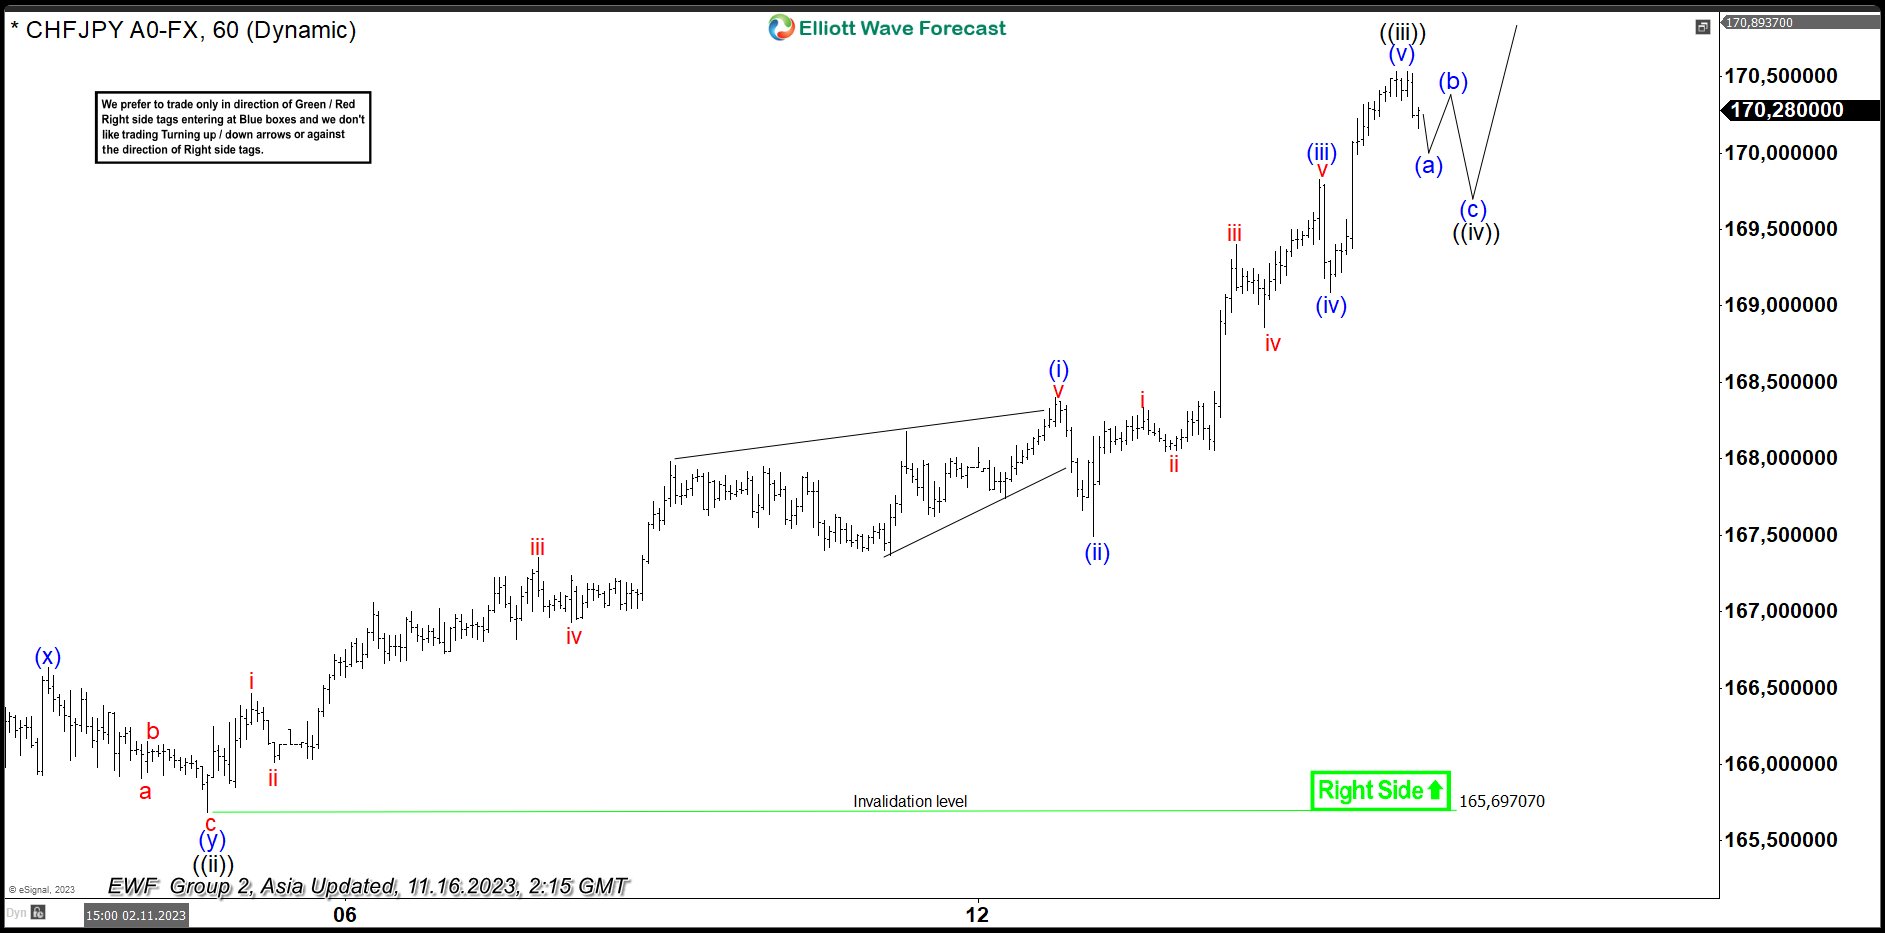
CHFJPY continues to make a sequence of higher high suggesting the pair is in a bullish market. Recent impulsive move higher looks incomplete and pair should continue to extend higher. Sequence from 10.3.2023 low is in progress as an impulse Elliott Wave structure. Up from 10.3.2023 low, wave 1 ended at 168.41 and dips in wave 2 ended at 164.96. Pair has resumed higher in wave 3 with internal subdivision as an impulse structure in lesser degree.
Up from wave 2, wave ((i)) ended at 167.22 and pullback in wave ((ii)) ended at 165.69 as the 1 hour chart below shows. Up from there, wave (i) ended at 168.4 and dips in wave (ii) ended at 167.49. Pair rallies higher in wave (iii) towards 169.82 and dips in wave (iv) ended at 169.08. Wave (v) higher ended at 170.535 which completed wave ((iii)) in higher degree. Pullback in wave ((iv)) is in progress to correct cycle from 11.3.2023 low before the rally resumes. Near term, as far as pivot at 165.69 low stays intact, expect pullback to find support in 3, 7, or 11 swing for further upside. Potential support for wave ((iv)) comes at 23.6 – 38.2% Fibonacci retracement of wave ((iii)). This area comes at 168.7 – 169.4.
CHFJPY 60 Minutes Elliott Wave Chart
CHFJPY Elliott Wave Video
https://www.youtube.com/watch?v=ew0tluG0g7s
Technical Outlook and Review
DXY:
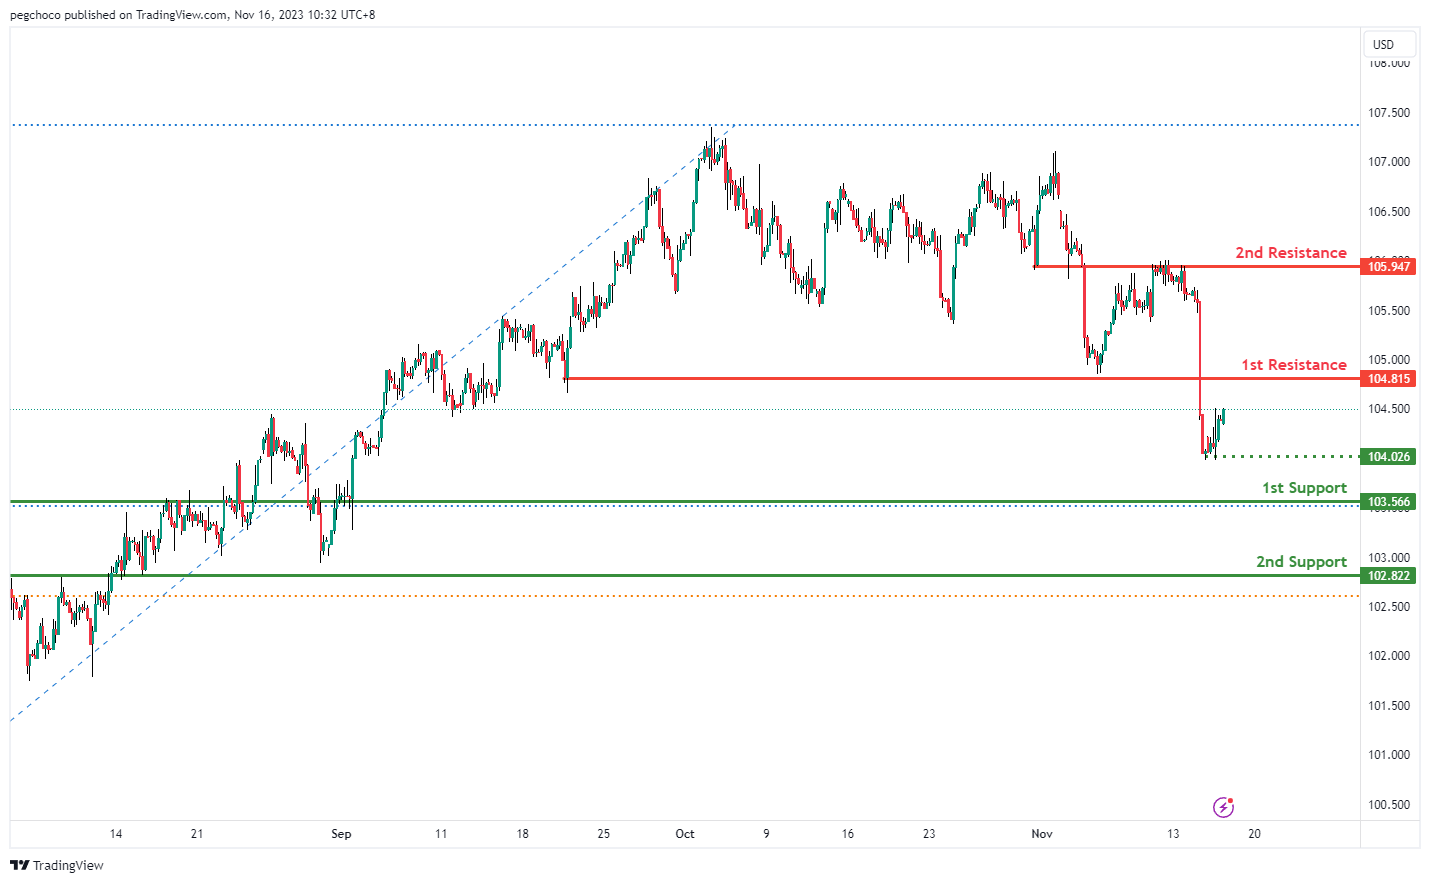
The DXY (US Dollar Index) chart currently displays a bearish overall momentum, suggesting the potential for a bearish reaction off the 1st resistance level, followed by a drop towards the 1st support.
The 1st support at 103.56 is identified as an overlap support and also coincides with the 50% Fibonacci Retracement level. This confluence suggests that it could act as a significant level of support, where traders may expect the price to find buying interest or experience a pause in the bearish movement.
The 2nd support at 102.82 is categorized as an overlap support and coincides with the 61.80% Fibonacci Retracement level. This level further reinforces its potential as a support level, given the confluence of technical factors.
On the resistance side, the 1st resistance at 104.01 is noted as a pullback resistance. This level indicates a potential barrier to further upward movement, where selling interest may emerge.
The 2nd resistance at 105.94 is identified as an overlap resistance, suggesting another potential level where the price may encounter selling pressure during its bearish reaction.
EUR/USD:
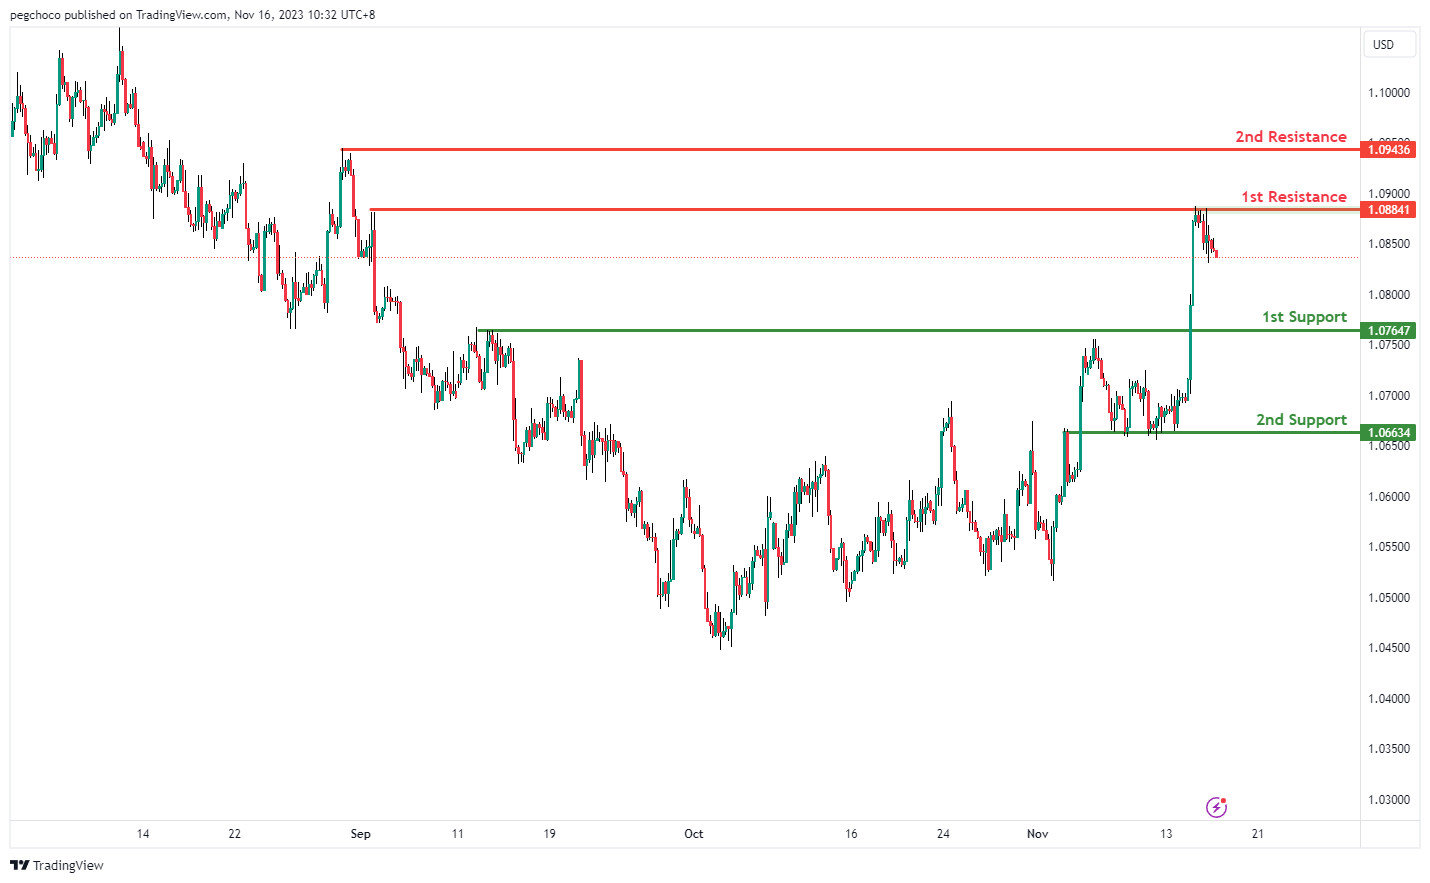
The EUR/USD chart currently exhibits a bearish overall momentum, indicating the potential for a bearish continuation towards the 1st support level.
The 1st support at 1.0764 is considered a pullback support level. This level suggests a potential area of support where traders may anticipate the price finding buying interest or experiencing a pause in its bearish movement.
The 2nd support at 1.0663 is categorized as an overlap support level. Overlap supports often carry significance as they represent areas where the price has previously found support, making it a relevant level to watch for potential price reactions.
On the resistance side, the 1st resistance at 1.0884 is identified as a multi-swing high resistance level. This level indicates a potential barrier to further upward movement, where selling interest may emerge.
The 2nd resistance at 1.0943 is characterized as a swing high resistance level. Swing highs often act as points of resistance, further reinforcing the potential for a bearish continuation.
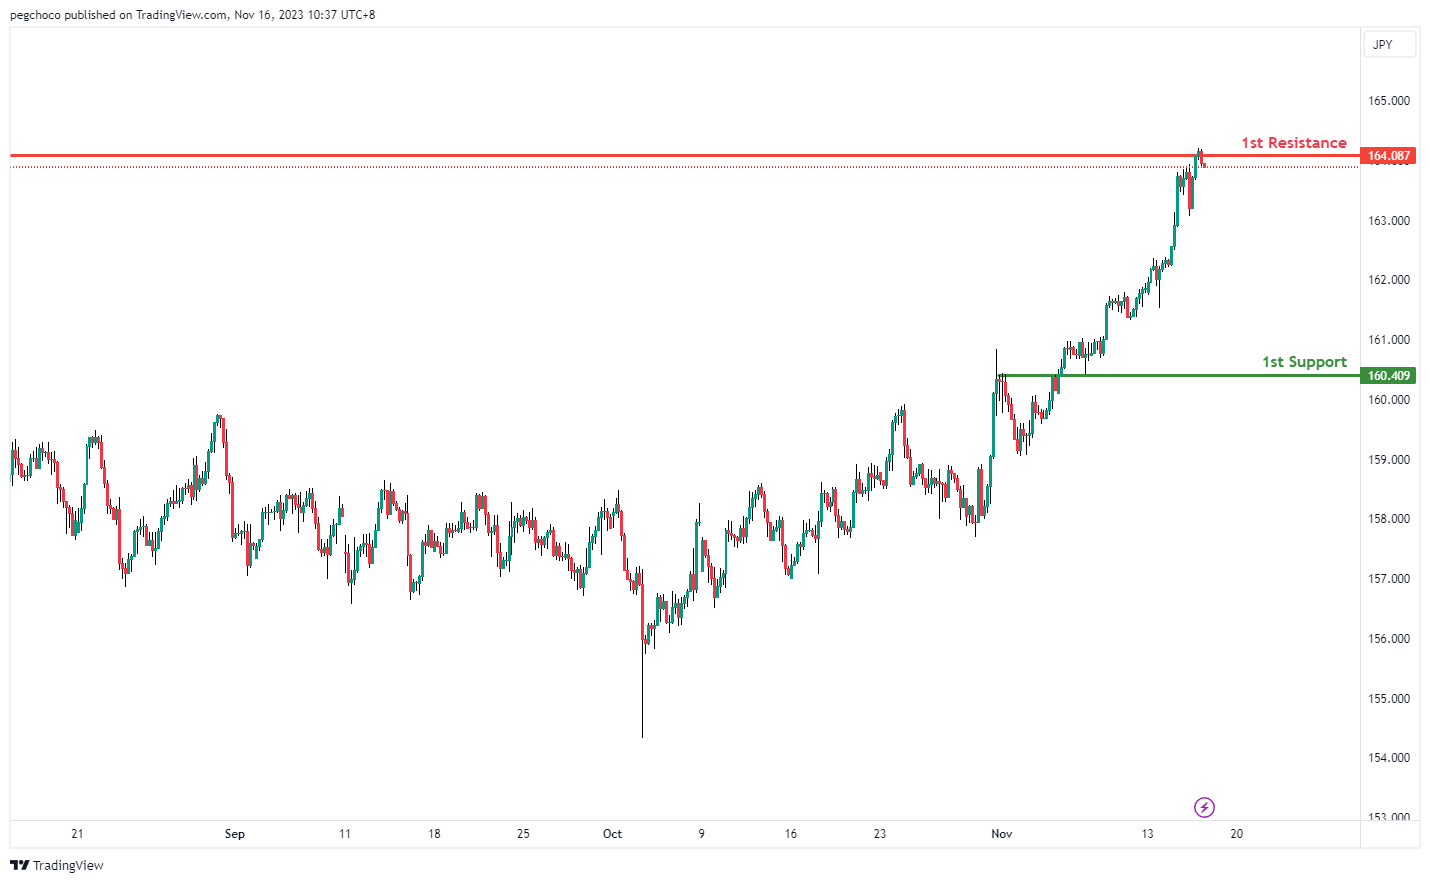
EUR/JPY:
The EUR/JPY chart currently exhibits a bearish overall momentum, suggesting the potential for a bearish reaction off the 1st resistance level and a subsequent drop towards the 1st support.
The 1st support at 160.40 is identified as an overlap support, indicating a price level where historical trading activity has occurred. It may act as a level where buyers could potentially step in or where selling pressure may decrease.
On the resistance side, the 1st resistance at 164.08 is categorized as a multi-swing high resistance. This level signifies an area where the price has faced significant selling pressure in the past, making it a relevant resistance level.
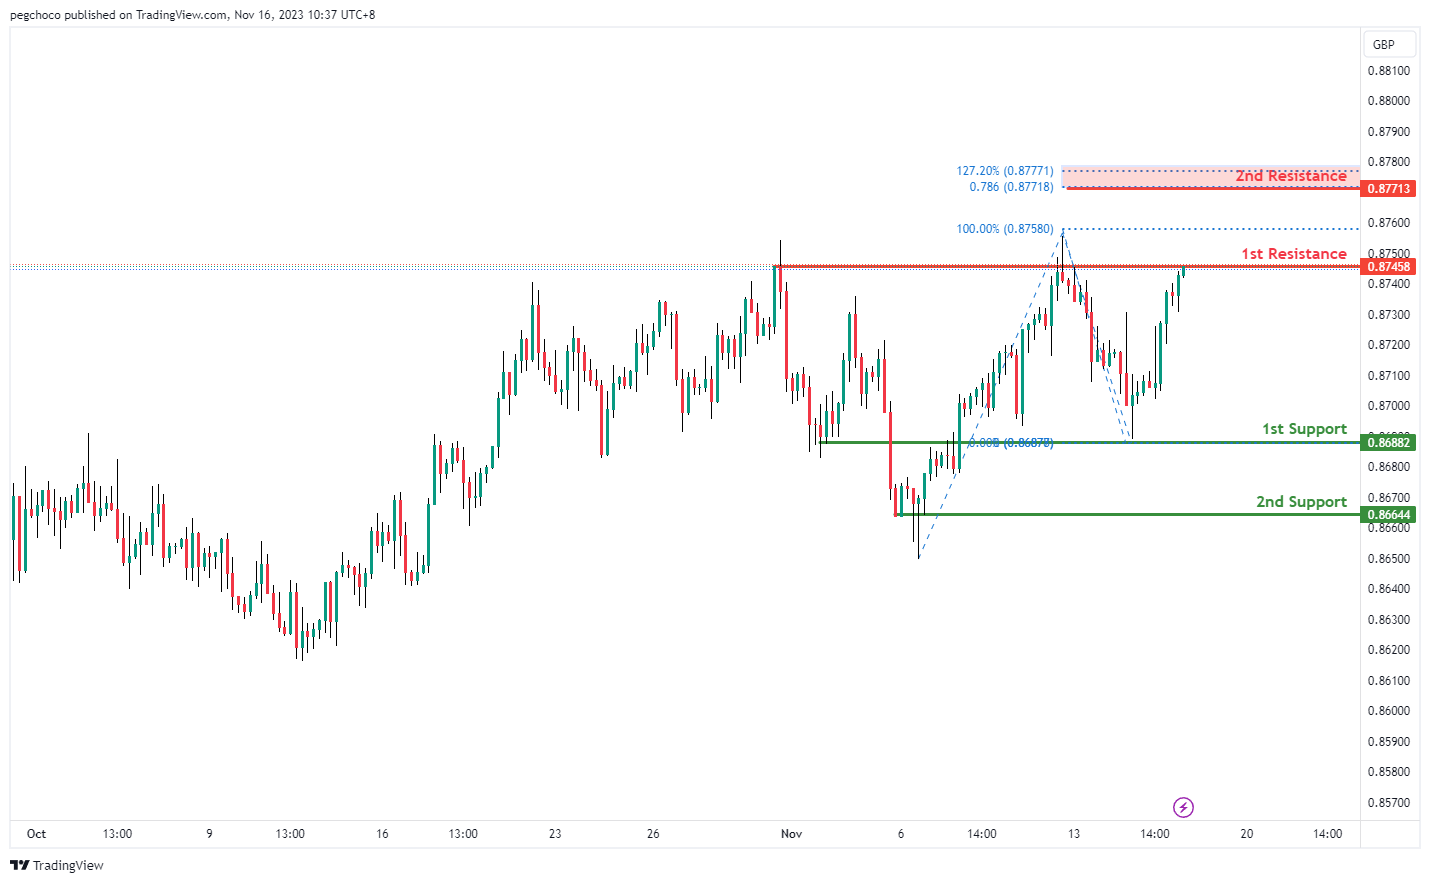
EUR/GBP:
The EUR/GBP chart currently demonstrates a bearish overall momentum, indicating the potential for a bearish reaction off the 1st resistance level, followed by a drop towards the 1st support.
The 1st support at 0.8713 is identified as an overlap support, signifying a historical price level where trading activity has occurred. It may act as a level where buyers could potentially step in or where selling pressure may decrease.
The 2nd support at 0.8664 is considered a multi-swing low support, reinforcing its significance as a support level. Multi-swing lows often indicate areas where buyers have intervened previously, making it a relevant support level.
On the resistance side, the 1st resistance at 0.8745 is categorized as a swing high resistance. This level represents a point where the price has encountered significant selling pressure in the past, making it a notable resistance level.
The 2nd resistance at 0.8771 is noteworthy as it is associated with both the 78.60% Fibonacci Projection and the 127.20% Fibonacci Extension. This indicates a potential Fibonacci confluence, suggesting a strong resistance barrier.
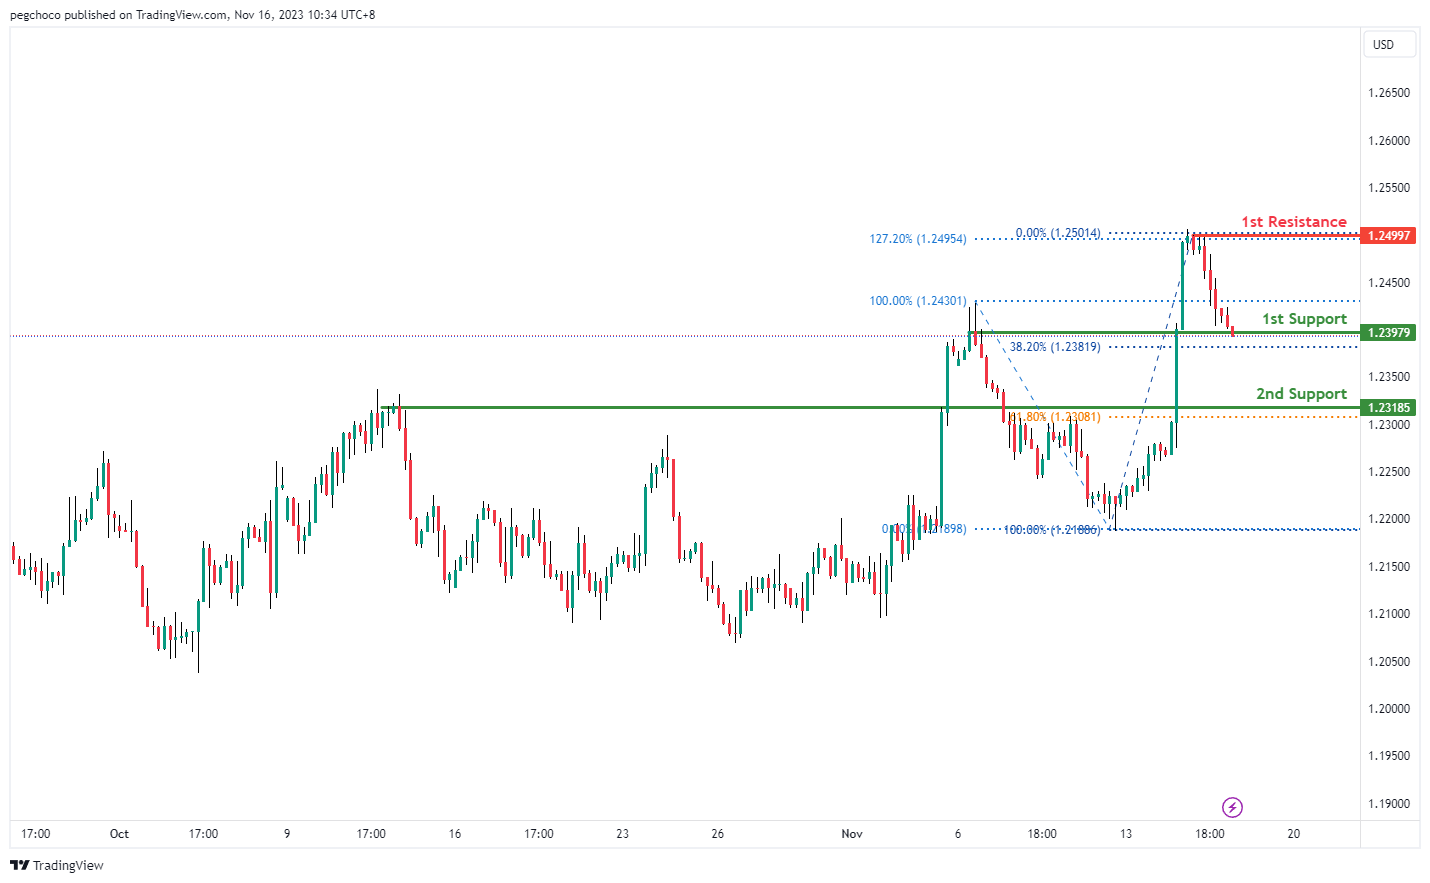
GBP/USD:
The GBP/USD chart currently has a bearish overall momentum, suggesting the potential for a bearish break off the 1st support level, followed by a drop towards the 2nd support level.
The 1st support at 1.23979 is identified as a pullback support and coincides with the 38.20% Fibonacci Retracement level. This level suggests a potential area of support where traders may expect the price to find buying interest or experience a pause in the bearish movement.
The 2nd support at 1.23185 is also categorized as a pullback support and coincides with the 61.80% Fibonacci Retracement level. It further reinforces its potential as a support level, indicating another relevant area where buyers may step in.
On the resistance side, the 1st resistance at 1.2499 is described as a swing high resistance and also coincides with the 127.20% Fibonacci Extension level. This level suggests a potential barrier to further upward movement, where selling interest may emerge.
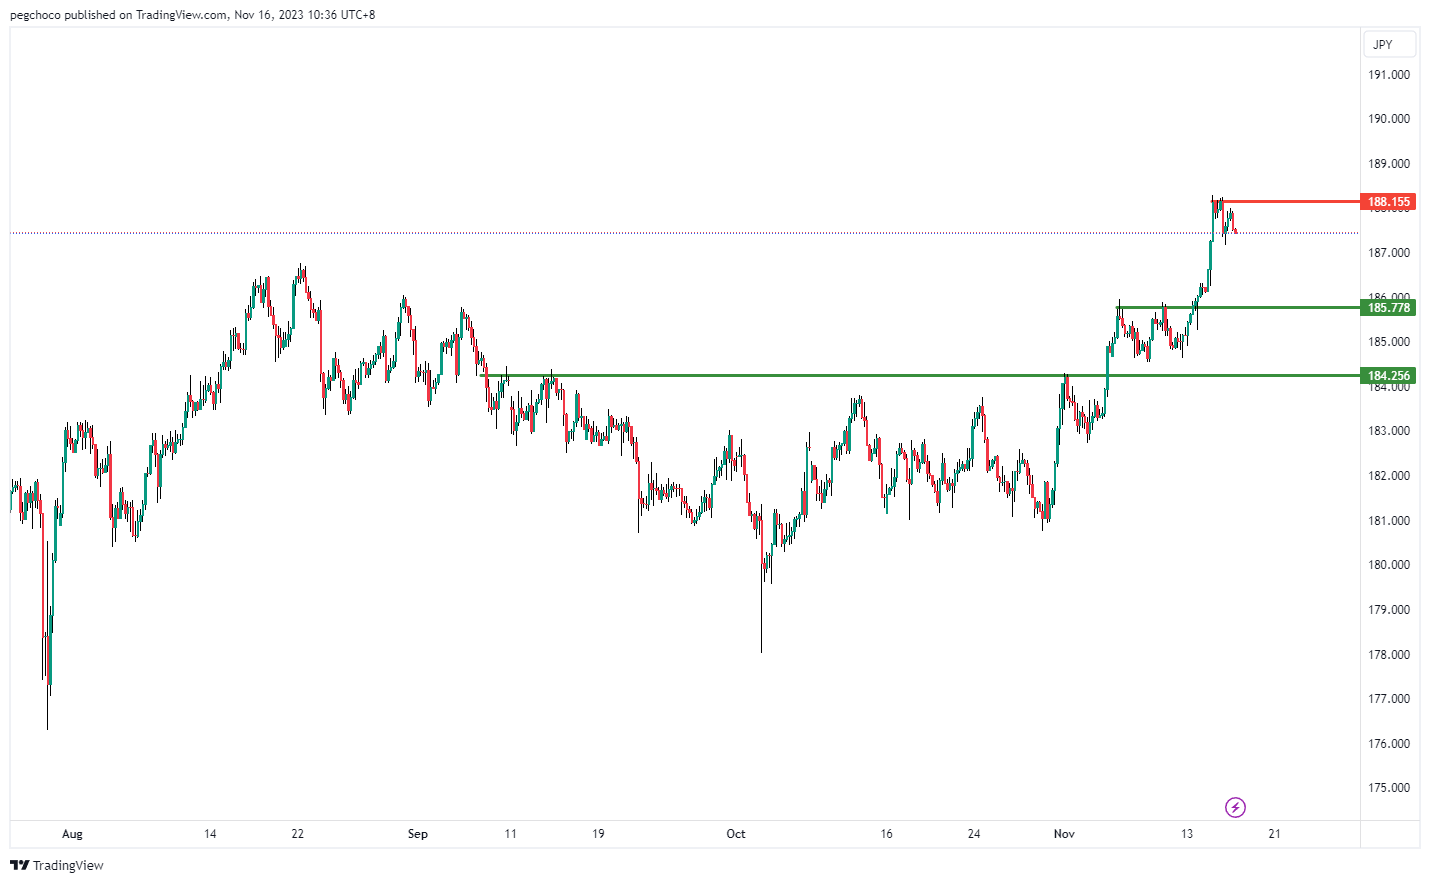
GBP/JPY:
The GBP/JPY chart currently exhibits a bearish overall momentum, suggesting the potential for a bearish continuation towards the 1st support level.
The 1st support at 185.77 is identified as a pullback support. This level signifies a point where the price may find buying interest or a temporary pause in the bearish movement. It is a level to watch for potential support.
The 2nd support at 184.25 is also a pullback support, reinforcing its significance as a potential level of support. Pullback supports are areas where buyers have previously stepped in, making them relevant support levels.
On the resistance side, the 1st resistance at 188.15 is categorized as a swing high resistance. This level represents a point where the price has encountered significant selling pressure in the past, making it a notable resistance level.
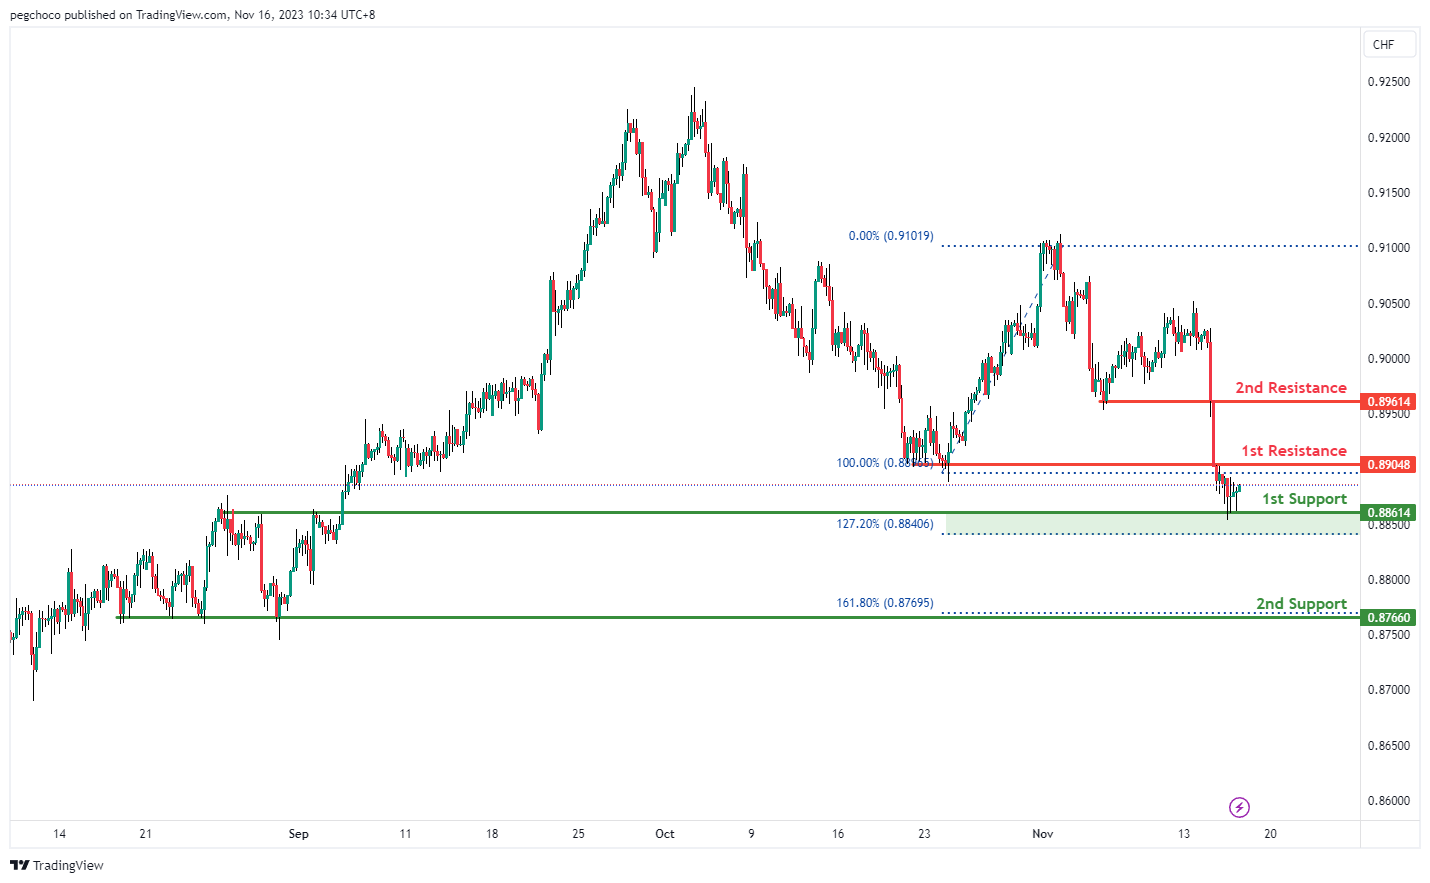
USD/CHF:
The USD/CHF chart currently shows a neutral overall momentum, suggesting that price could potentially fluctuate between the 1st resistance and 1st support levels.
The 1st support at 0.8861 is considered a pullback support level, and it also coincides with the 127.20% Fibonacci Extension, making it a significant level to watch. This level may act as a potential area of support where traders could expect buying interest or a pause in downward movement.
The 2nd support at 0.8766 is categorized as a multi-swing low support and is further reinforced by the 161.80% Fibonacci Extension. Multi-swing lows often indicate areas where buyers have previously stepped in, making it a relevant support level.
On the resistance side, the 1st resistance at 0.8904 is identified as a pullback resistance. This level suggests a potential area where selling interest may emerge, potentially leading to a pause or reversal in the upward movement.
The 2nd resistance at 0.8961 is also characterized as a pullback resistance, reinforcing the potential for a price reversal or a barrier to further upward movement.
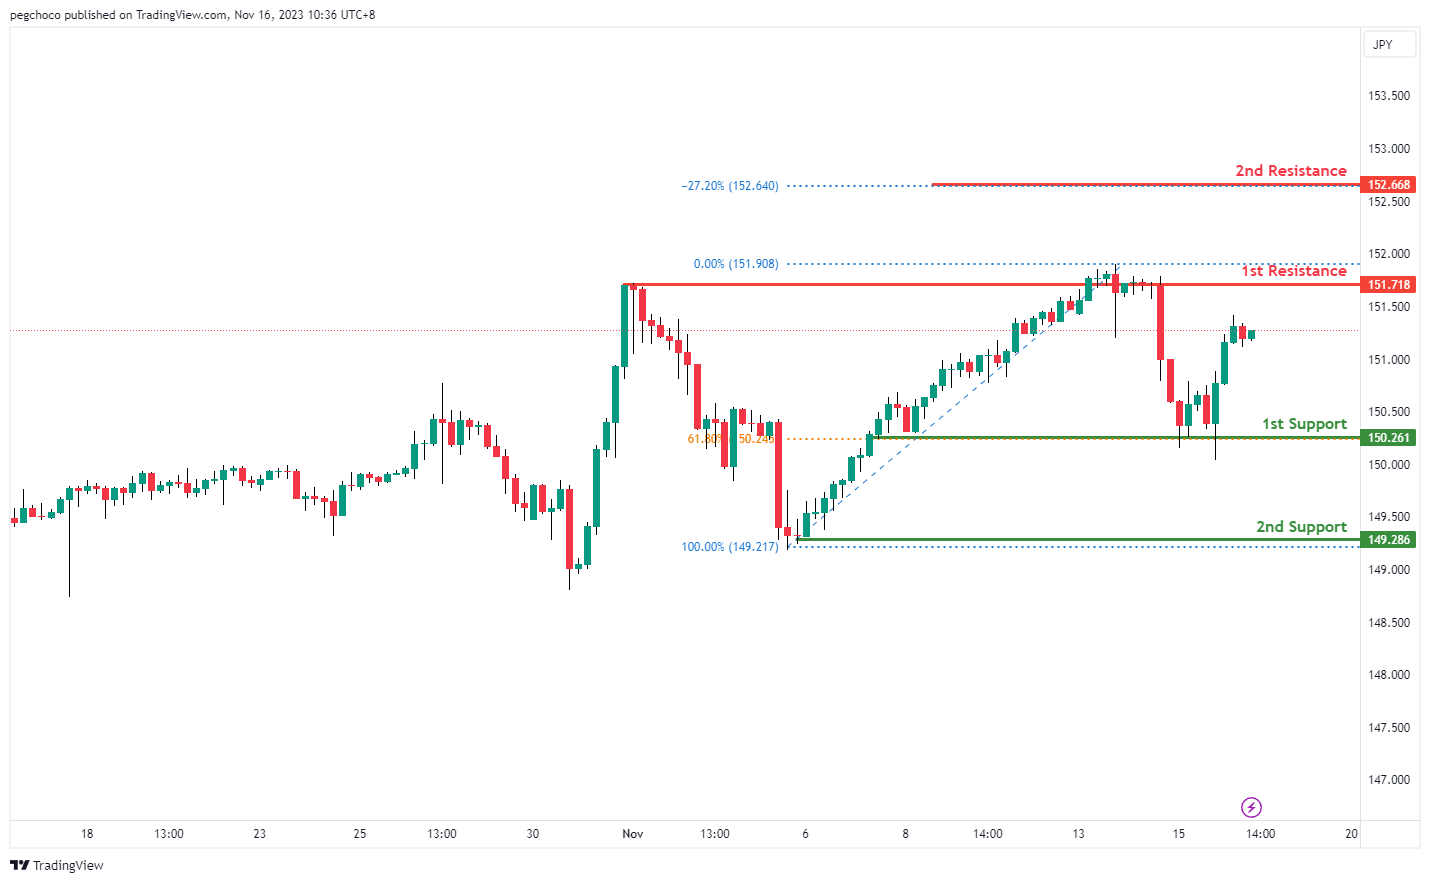
USD/JPY:
The USD/JPY chart currently exhibits a bullish overall momentum, suggesting the potential for a bullish continuation towards the 1st resistance level.
The 1st support at 150.26 is identified as an overlap support, and it also coincides with the 61.80% Fibonacci Retracement level. This level indicates a significant area of potential support, where traders may expect buying interest or a pause in the upward movement.
The 2nd support at 149.28 is considered a swing low support, further reinforcing its potential as a support level. Swing lows often signify areas where buyers have stepped in previously, making it a relevant support level.
On the resistance side, the 1st resistance at 151.71 is categorized as a multi-swing high resistance. This level suggests that there may be selling interest in this area, potentially acting as a barrier to further upward movement.
The 2nd resistance at 152.66 is noted as a level associated with the -27% Fibonacci Extension, indicating another potential area where the price may encounter selling pressure during its bullish continuation.
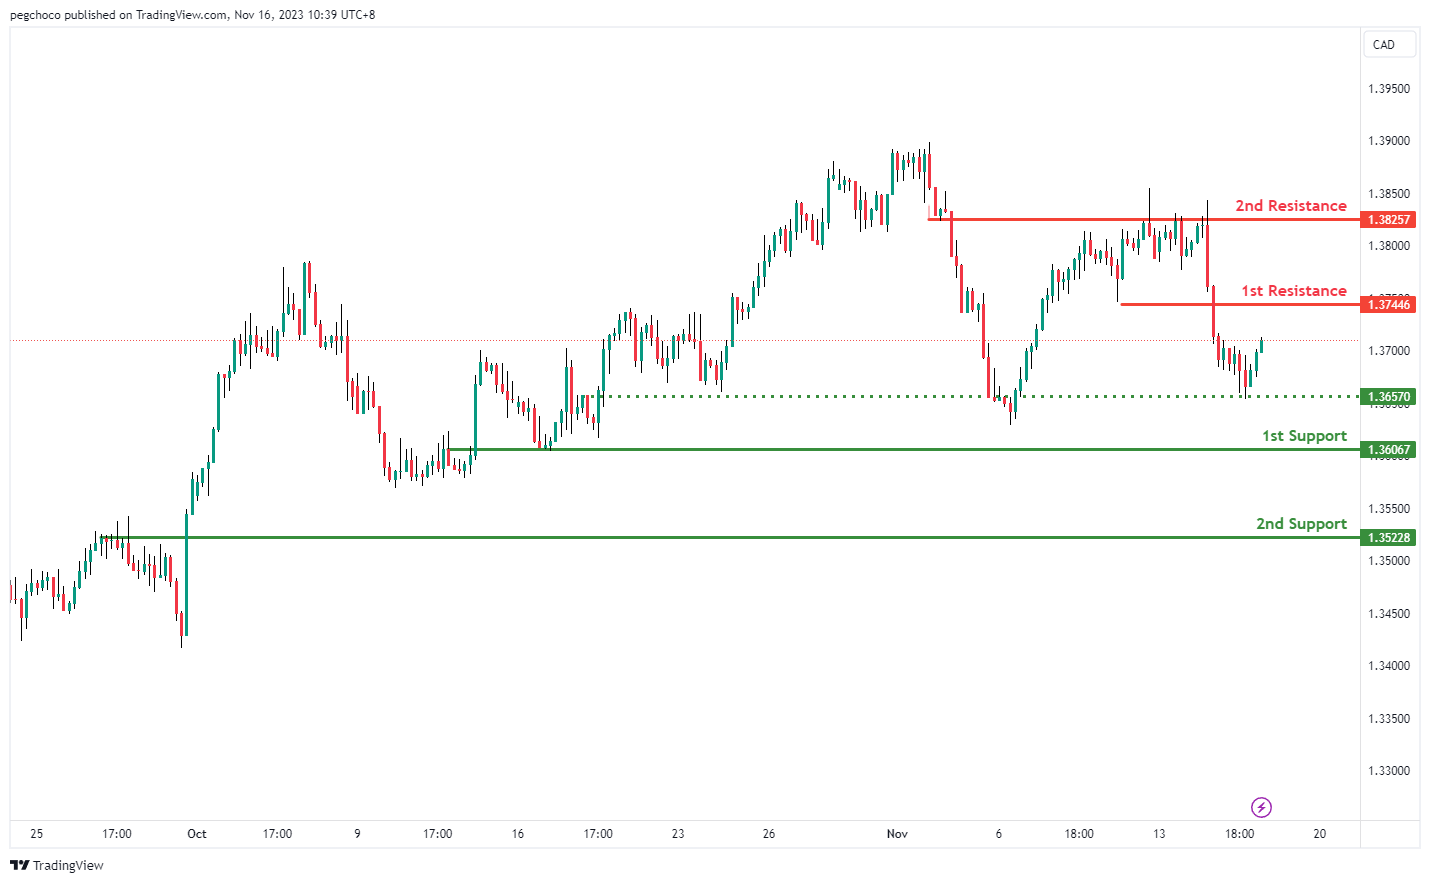
USD/CAD:
The USD/CAD chart currently shows a weak bullish momentum, indicating the potential for further upside movement towards the 1st resistance.
The 1st resistance level at 1.3745 is identified as a pullback resistance. Higher up, the 2nd resistance level at 1.3826 is marked as an overlap resistance, highlighting a potential barrier against further upward momentum.
To the downside, the intermediate support at 1.3657 is identified as an overlap support while the 1st support level at 1.3607 is also marked as an overlap support. Further below, the 2nd support level at 1.3523 is noted as a pullback support.
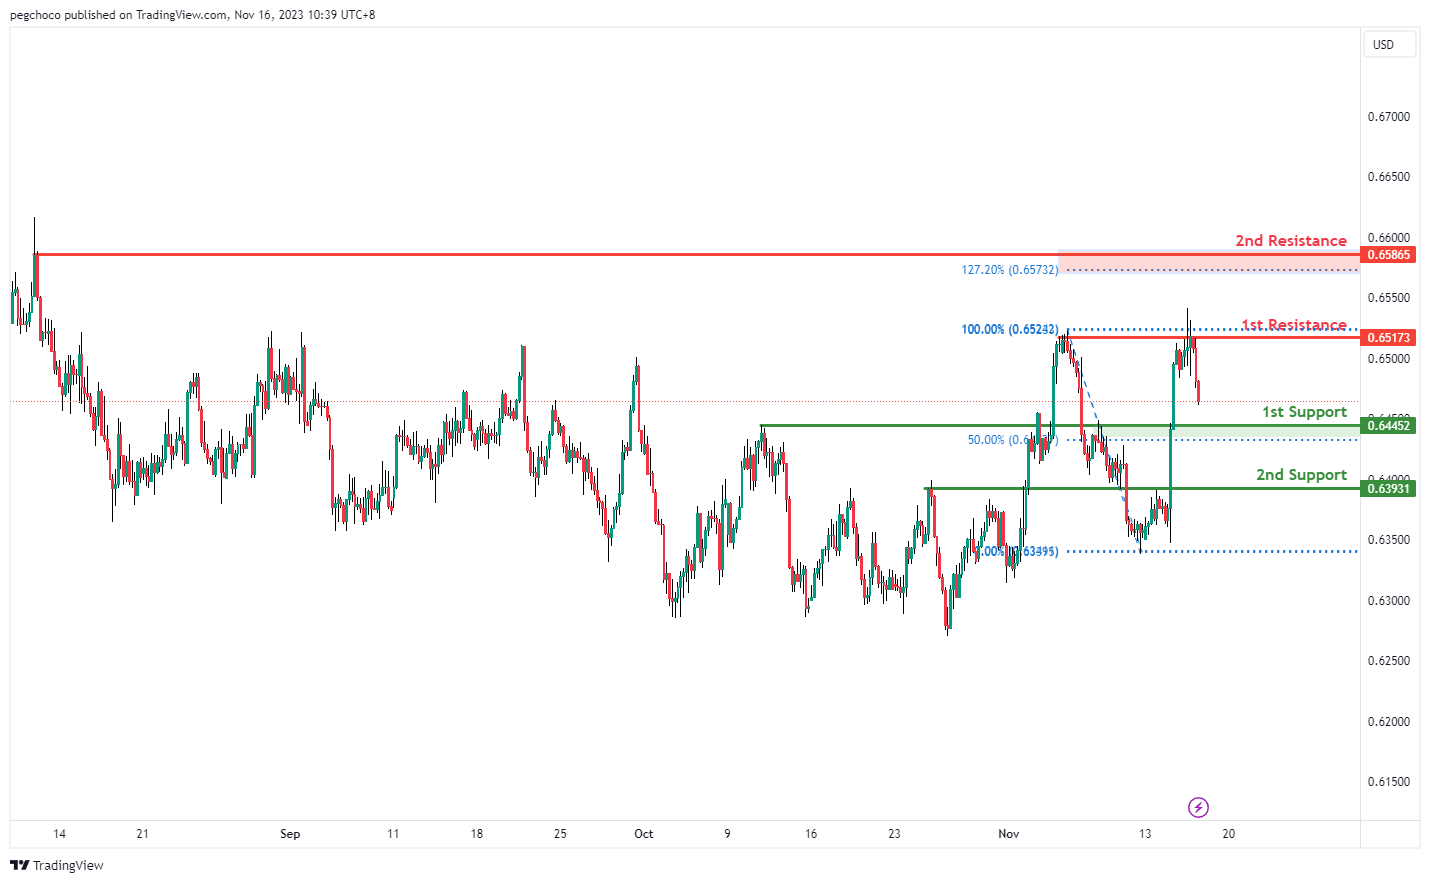
AUD/USD:
The AUD/USD chart currently exhibits an overall bearish momentum, suggesting the potential for a bearish continuation towards the 1st support.
The 1st support level at 0.6455 is identified as a pullback support that aligns close to the 50.00% retracement level. Further below, the 2nd support level at 0.6393 is marked as an overlap support, suggesting a significant support level.
To the upside, the 1st resistance level at 0.6517 is identified as a multi-swing-high resistance. Higher up, the 2nd resistance level at 0.6587 is marked as a pullback resistance, suggesting that it could serve as a strong resistance level.
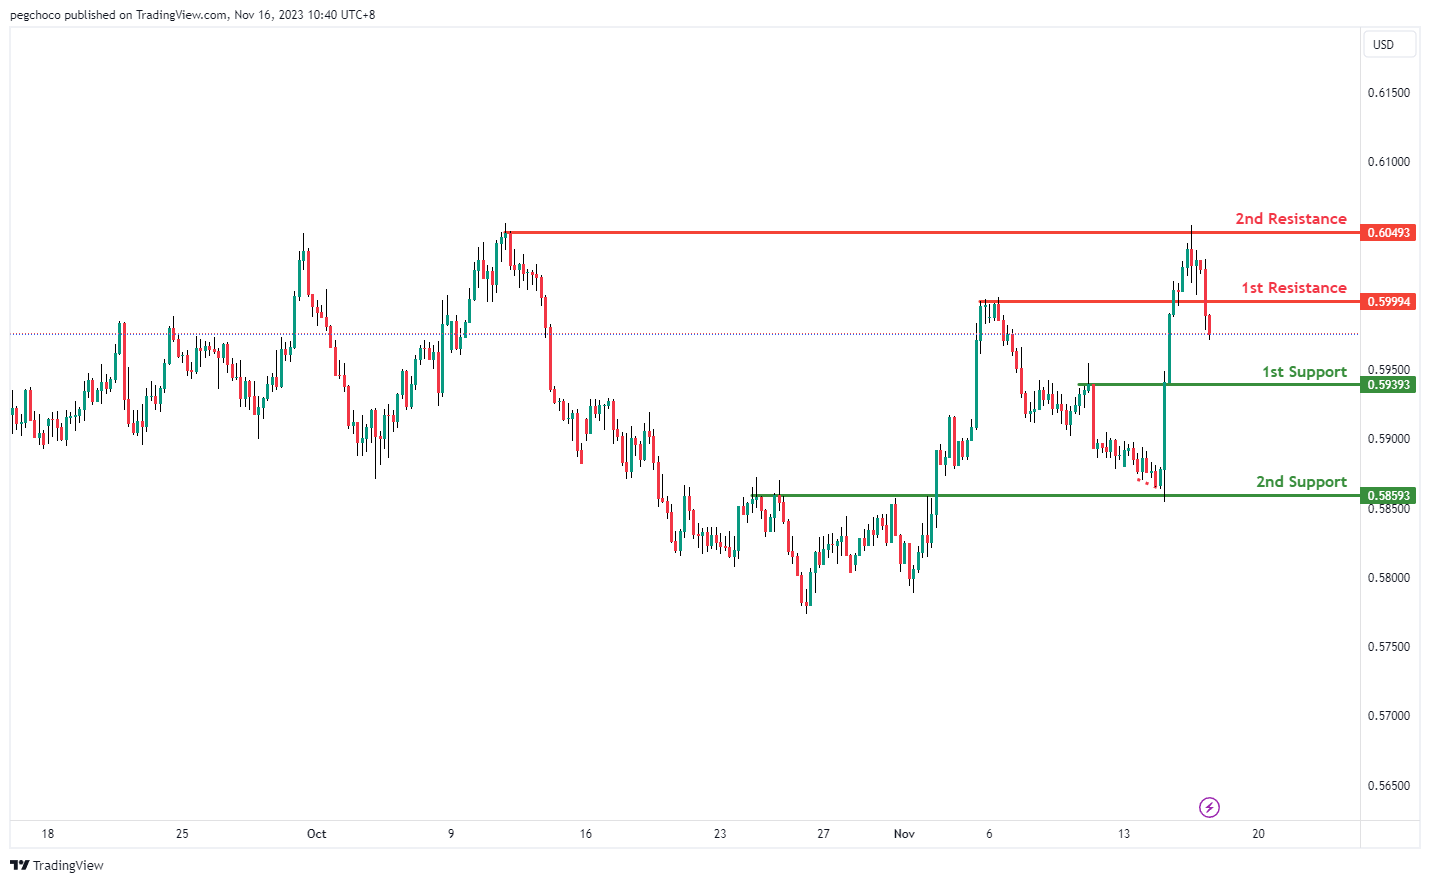
NZD/USD
The NZD/USD chart currently exhibits an overall bearish momentum, suggesting the potential for a bearish continuation towards the 1st support.
The 1st support level at 0.5939 is identified as a pullback support. Further below, the 2nd support level at 0.5859 is noted as an overlap support, signifying its significance as a strong support area.
To the upside, the 1st resistance level at 0.5999 is identified as a pullback resistance while the 2nd resistance level at 0.6049 is marked as a multi-swing-high resistance, indicating its potential strength as a barrier to further bullish movement.
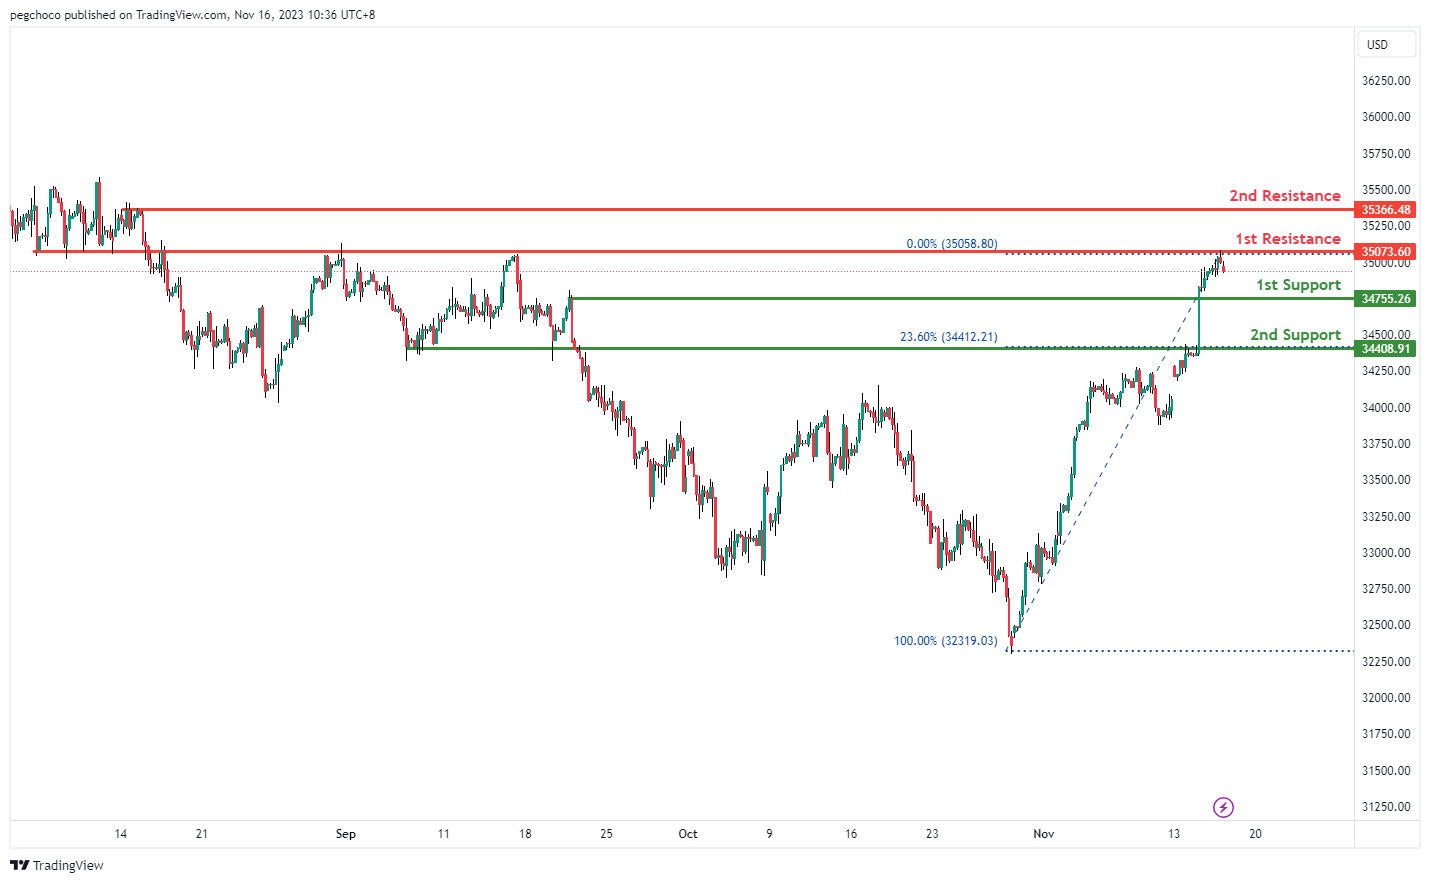
DJ30:
The DJ30 chart is currently showing an overall bearish momentum, with price making a bearish reaction off the 1st resistance and potentially make a bearish continuation towards the 1st support.
The 1st resistance level at 35073.60 is marked as an overlap resistance. Higher up, the 2nd resistance level at 35366.48 is noted as a pullback resistance, indicating a potential resistance area for further upward movement.
On the support side, the 1st support level at 34755.26 is identified as a pullback support. Further below, the 2nd support level at 34408.91 is noted as an overlap support, marking another potential level for a strong support area.
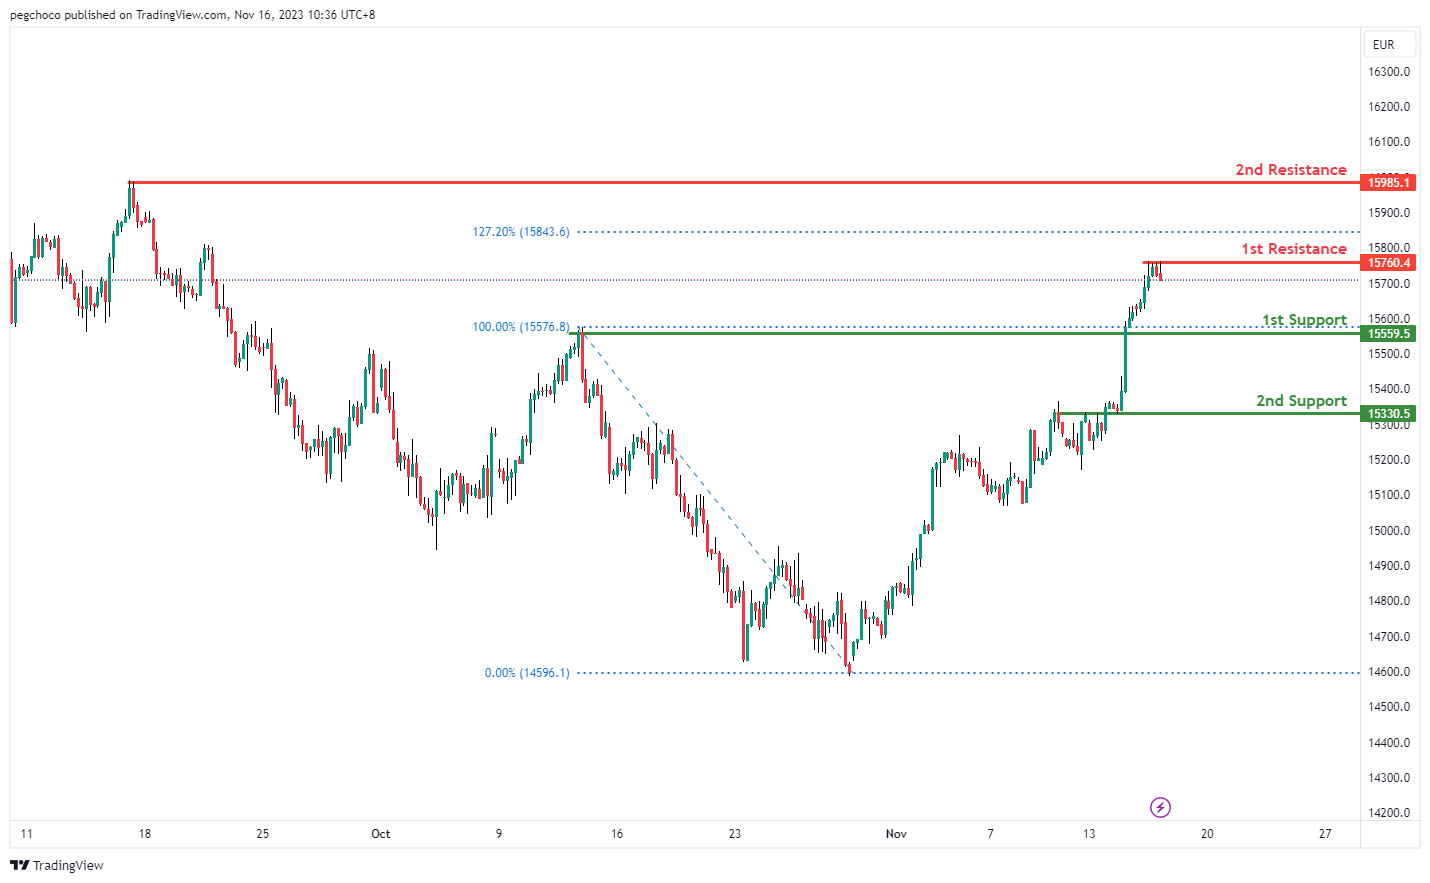
GER40:
The GER40 chart is currently displaying an overall bearish momentum, with price making a bearish reaction off the 1st resistance and potentially make a bearish continuation towards the 1st support.
The 1st resistance level at 15760.40 is marked as a pullback resistance that aligns close to the 127.20% Fibonacci extension level. Higher up, the 2nd resistance level at 15985.10 is noted as a swing-high resistance, indicating a potential resistance area for further upward movement.
On the support side, the 1st support level at 15559.50 is identified as a pullback support. Further below, the 2nd support level at 15330.50 is noted as an overlap support, marking another potential level for a strong support area.
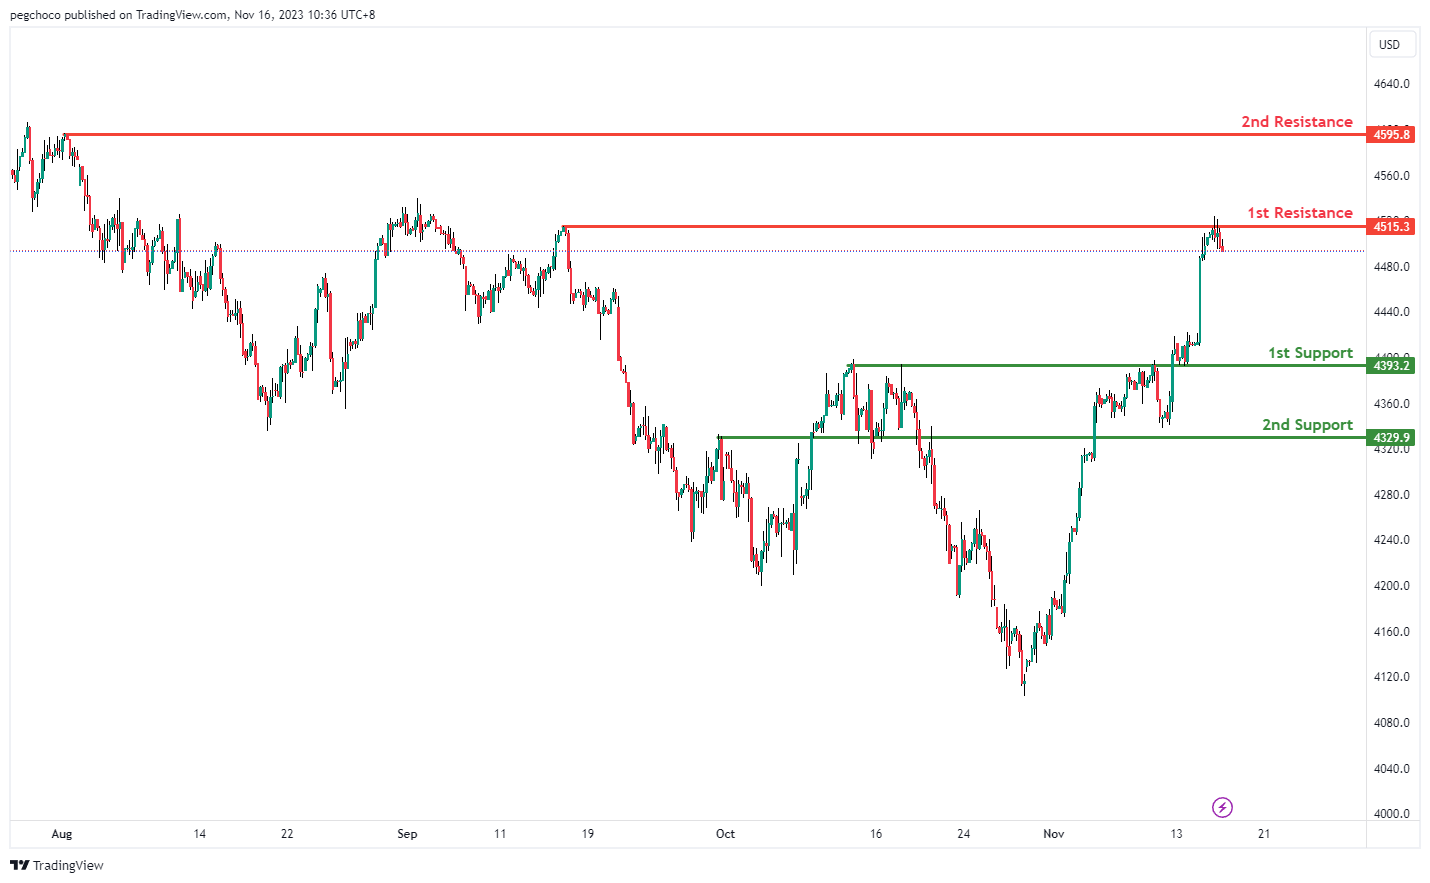
US500
The US500 chart is currently indicating an overall bearish momentum, with price making a bearish reaction off the 1st resistance and potentially make a bearish continuation towards the 1st support.
The 1st resistance level at 4515.30 is marked as a pullback resistance. Higher up, the 2nd resistance level at 4595.80 is also noted as a pullback resistance, indicating a potential resistance area for further upward movement.
On the support side, the 1st support level at 4393.20 is identified as an overlap support. Further below, the 2nd support level at 4329.90 is also noted as an overlap support, marking another potential level for a strong support area.
BTC/USD:
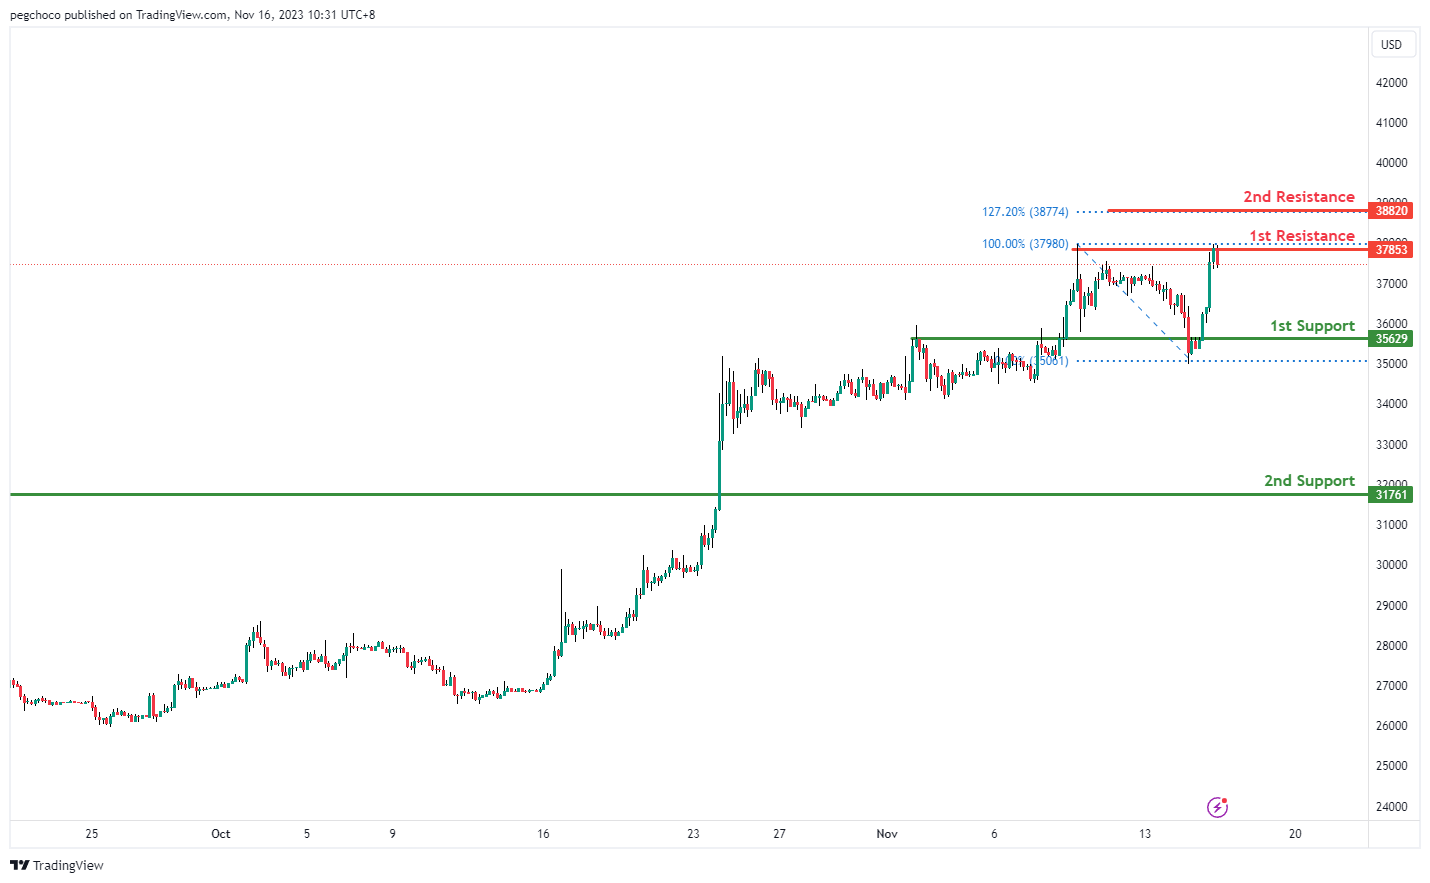
The BTC/USD chart currently exhibits a bearish overall momentum, suggesting the potential for a bearish reaction off the 1st resistance level and a drop towards the 1st support.
The 1st support at 35,629 is identified as a pullback support. This level indicates a point where buyers may step in or where a temporary pause in the bearish movement could occur. It is a level to watch for potential support.
The 2nd support at 31,761 is also a pullback support, reinforcing its significance as a potential support level. Pullback supports often indicate areas where buyers have previously intervened, making them relevant support levels.
On the resistance side, the 1st resistance at 37,853 is categorized as a swing high resistance. This level represents a point where the price has previously encountered significant selling pressure, making it a notable resistance level.
The 2nd resistance at 38,820 is noted as the 127.20% Fibonacci Extension level, which suggests a potential barrier to further upward movement
ETH/USD:
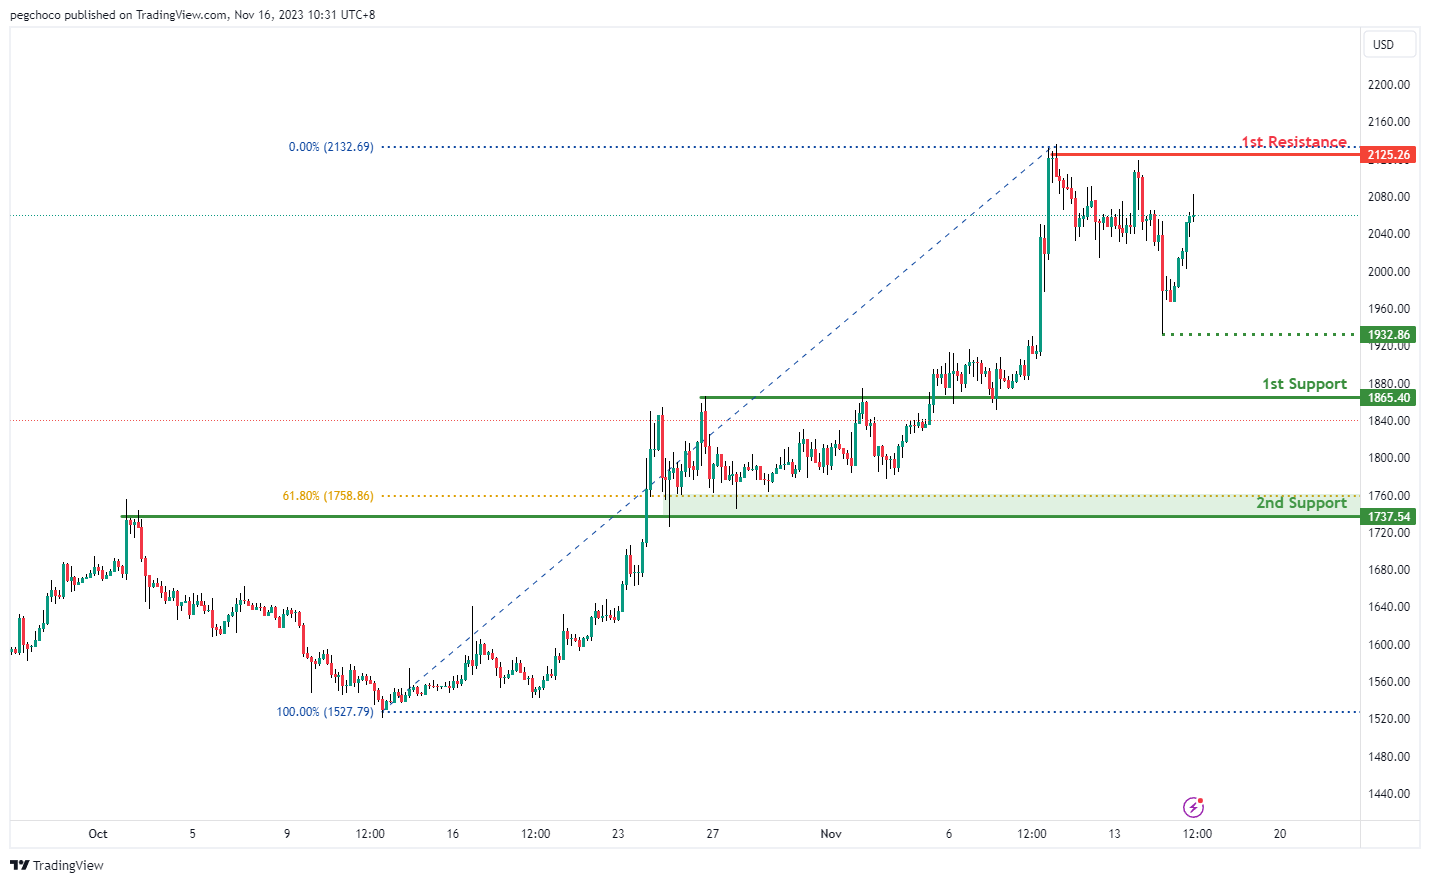
The ETH/USD chart currently demonstrates a bearish overall momentum, suggesting the potential for a bearish continuation towards the 1st support level.
The 1st support at 1,865.40 is identified as an overlap support. This level indicates a potential area where buyers may show interest or where a pause in the bearish movement could occur. It is a key level to watch for potential support.
The 2nd support at 1,737.54 is also an overlap support and coincides with the 61.80% Fibonacci Retracement level. This adds to its significance as a potential support level. Fibonacci retracement levels are commonly used by traders to identify key support and resistance areas.
On the resistance side, the 1st resistance at 2,125.26 is categorized as a multi-swing high resistance. This level represents a point where the price has previously faced notable selling pressure, making it an important resistance level to monitor.
WTI/USD:
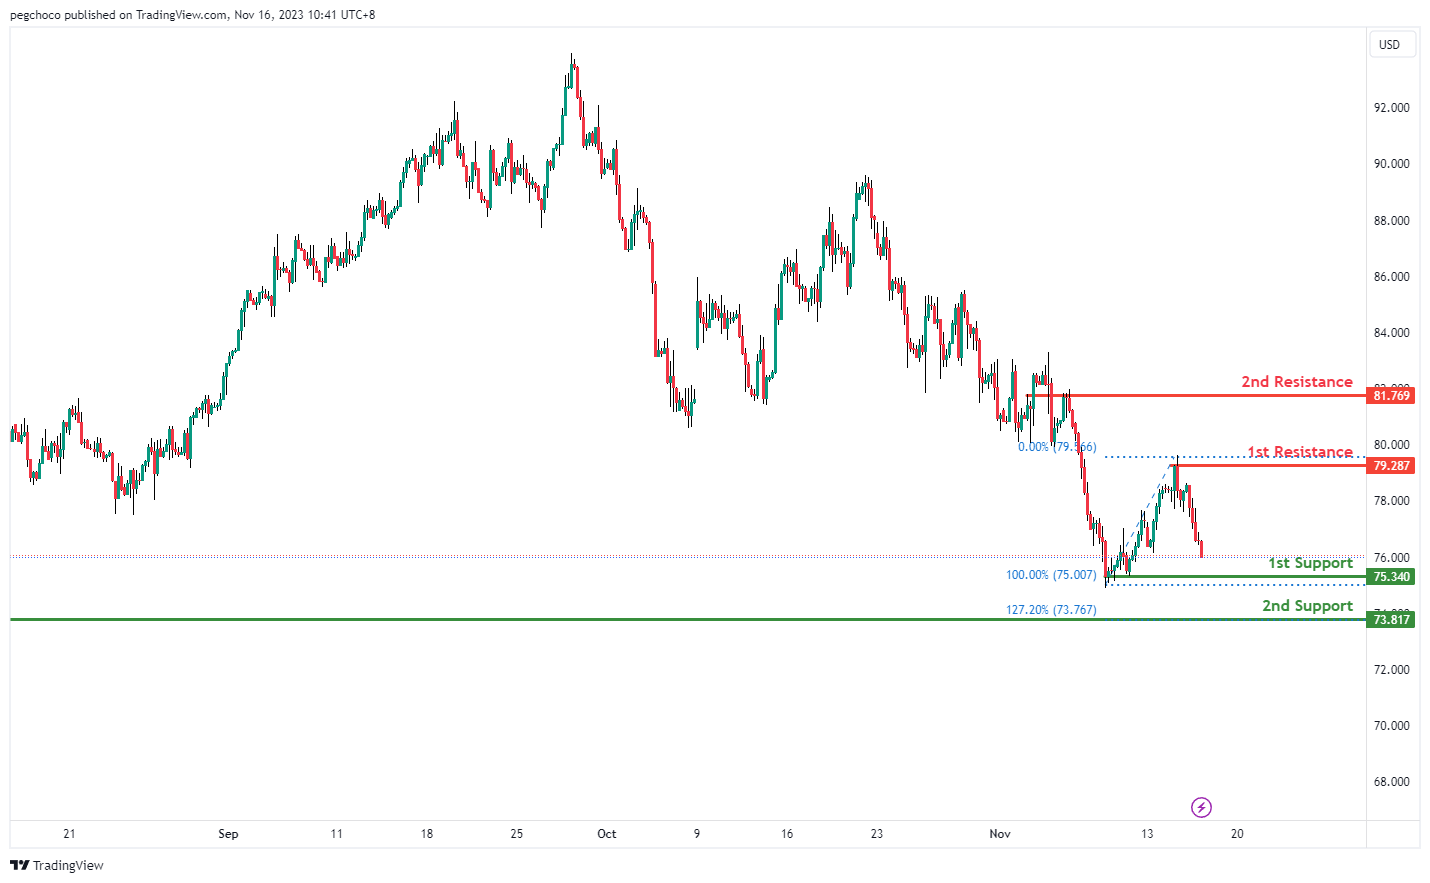
The WTI (West Texas Intermediate) chart currently shows an overall bearish momentum, suggesting the potential for a bearish continuation towards the 1st support.
The 1st support level at 75.34 is identified as a pullback support. Further below, the 2nd support level at 73.82 is noted as an overlap support that aligns with the 127.20% Fibonacci extension level, signifying its potential as a strong support area.
To the upside, the 1st resistance level at 79.29 is identified as a swing-high resistance. Higher up, the 2nd resistance level at 81.77 is marked as an overlap resistance, suggesting potential strength as a barrier to further bullish movement.
XAU/USD (GOLD):
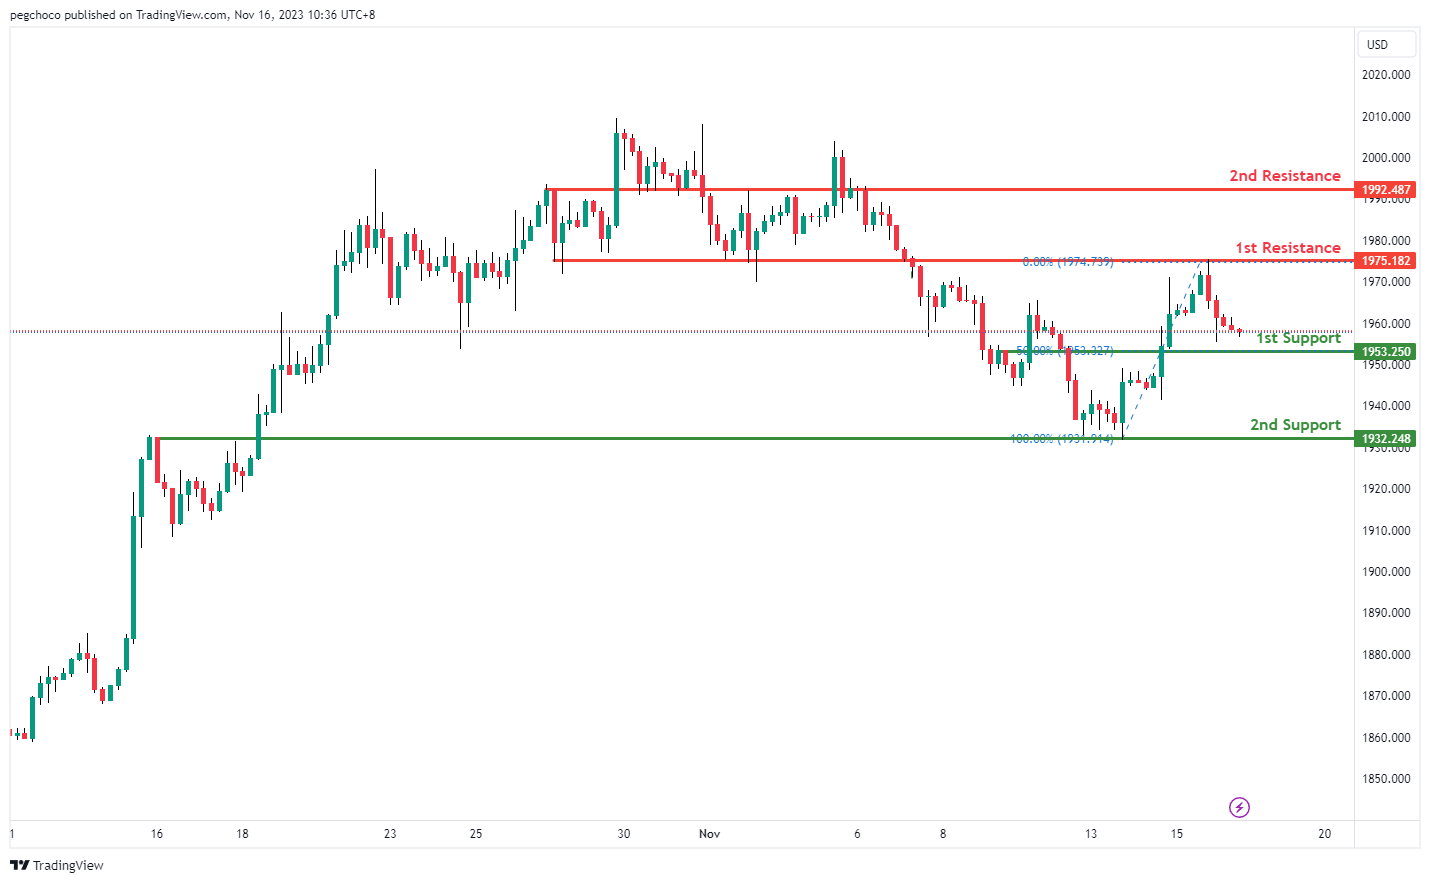
The XAUUSD (Gold) chart currently exhibits a bullish overall momentum, suggesting the potential for a bullish bounce off the 1st support level and a movement towards the 1st resistance.
The 1st support at 1953.25 is identified as a pullback support, indicating a potential level where buyers may step in. It signifies a price area where the market has previously found support during a pullback.
The 2nd support at 1932.77 is considered an overlap support, further reinforcing its potential as a support level. Overlap supports often indicate areas where price reversals or bounces may occur.
On the resistance side, the 1st resistance at 1975.18 is categorized as an overlap resistance. This level suggests that there may be selling interest in this area, potentially acting as a barrier to further upward movement.
The 2nd resistance at 1992.48 is also noted as an overlap resistance, indicating another potential area where the price may encounter selling pressure during its bullish movement.
Crude Oil Price At Risk of More Downsides, Gold Turns Green
Key Highlights
- Crude oil prices declined heavily toward $7520 before the bulls appeared.
- A key bearish trend line is forming with resistance near $78.80 on the 4-hour chart.
- Gold prices started a fresh increase from the $1,935 support zone.
- EUR/USD surged above the 1.0720 resistance zone.
Crude Oil Price Technical Analysis
In the past few days, Crude oil prices saw a steady decline amid the Israel-Hamas war. The price declined toward the $75.00 zone before the bulls appeared.
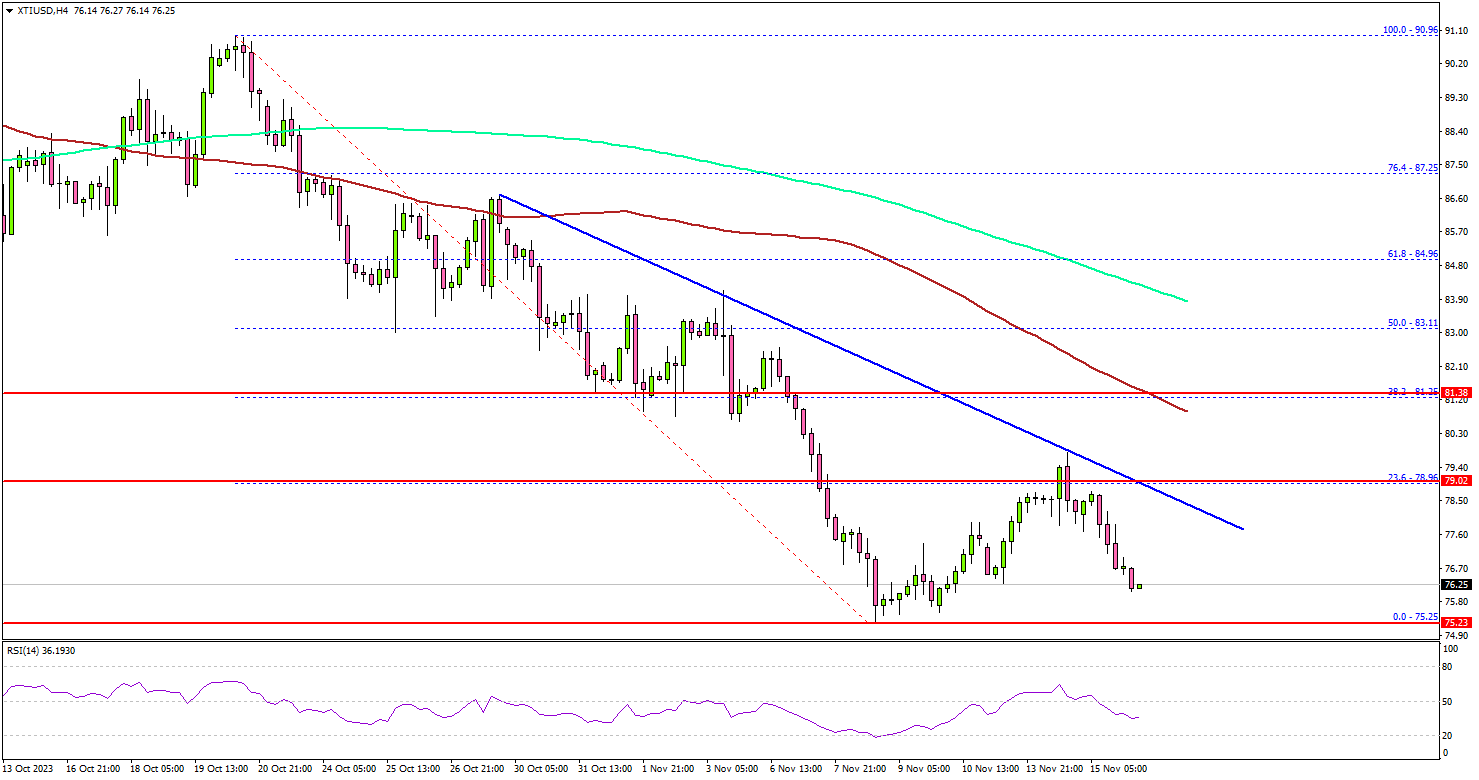
Looking at the 4-hour chart of XTI/USD, the price settled below the $80.00 pivot level, the 200 simple moving average (green, 4-hour), and the 100 simple moving average (red, 4-hour).
A low was formed near $75.25 and recently the price started an upside correction. There was a move above the $77.50 resistance zone. However, the price failed to clear the $78.80 resistance zone. It struggled near the 23.6% Fib retracement level of the downward move from the $90.96 swing high to the $75.25 low.
There is also a key bearish trend line forming with resistance near $78.80 on the same chart. The next major resistance is near the $81.20 zone or the 38.2% Fib retracement level of the downward move from the $90.96 swing high to the $75.25 low, above which the price may perhaps accelerate higher.
In the stated case, it could even visit the $83.20 resistance or the 200 simple moving average (green, 4-hour) in the coming days.
If not, the price might continue to move down. Immediate support is near the $75.80 level. The next support is at $75.00, below which there is a risk of a sharp decline. In the stated case, the price could dive toward the $72.50 support. Any more losses might call for a test of the $70.00 support zone.
Looking at gold prices, there was a consolidation phase near the $1,960 level and the bulls might now aim for more upside.
Economic Releases to Watch Today
- US Initial Jobless Claims - Forecast 220K, versus 217K previous.
Japan’s exports increase for second month, despite persistent decline in China shipments
In October, Japan experienced a mixed bag in its trade sector. Exports saw a modest rise of 1.6% yoy to JPY 9167B, marking the second consecutive month of growth, albeit at a slower pace compared to September's 4.3% yoy increase.
One notable aspect was the continued decline in shipments to China, which fell by -4.0% yoy. This marks the eleventh consecutive month of decline, underscoring the strained trade relations and potentially shifting economic alliances in the region.
Conversely, exports to the US surged by 8.4% yoy, buoyed by robust demand for hybrid vehicles and mining and construction machinery. This surge propelled the value of U.S.-bound shipments to record levels. Similarly, exports to Europe experienced a healthy increase of 8.9% yoy, indicating diversified trade relations.
On the import front, Japan witnessed a significant drop of -12.5% yoy to JPY 9810B. The trade balance resulted in a deficit of JPY -663B.
Looking at seasonally adjusted terms, both exports and imports saw month-on-month declines, with exports decreasing by -1.2% mom to JPY 8800B and imports falling by -0.7% mom to JPY 9262B. Consequently, trade deficit widened from September's JPY -420B to JPY -462B.
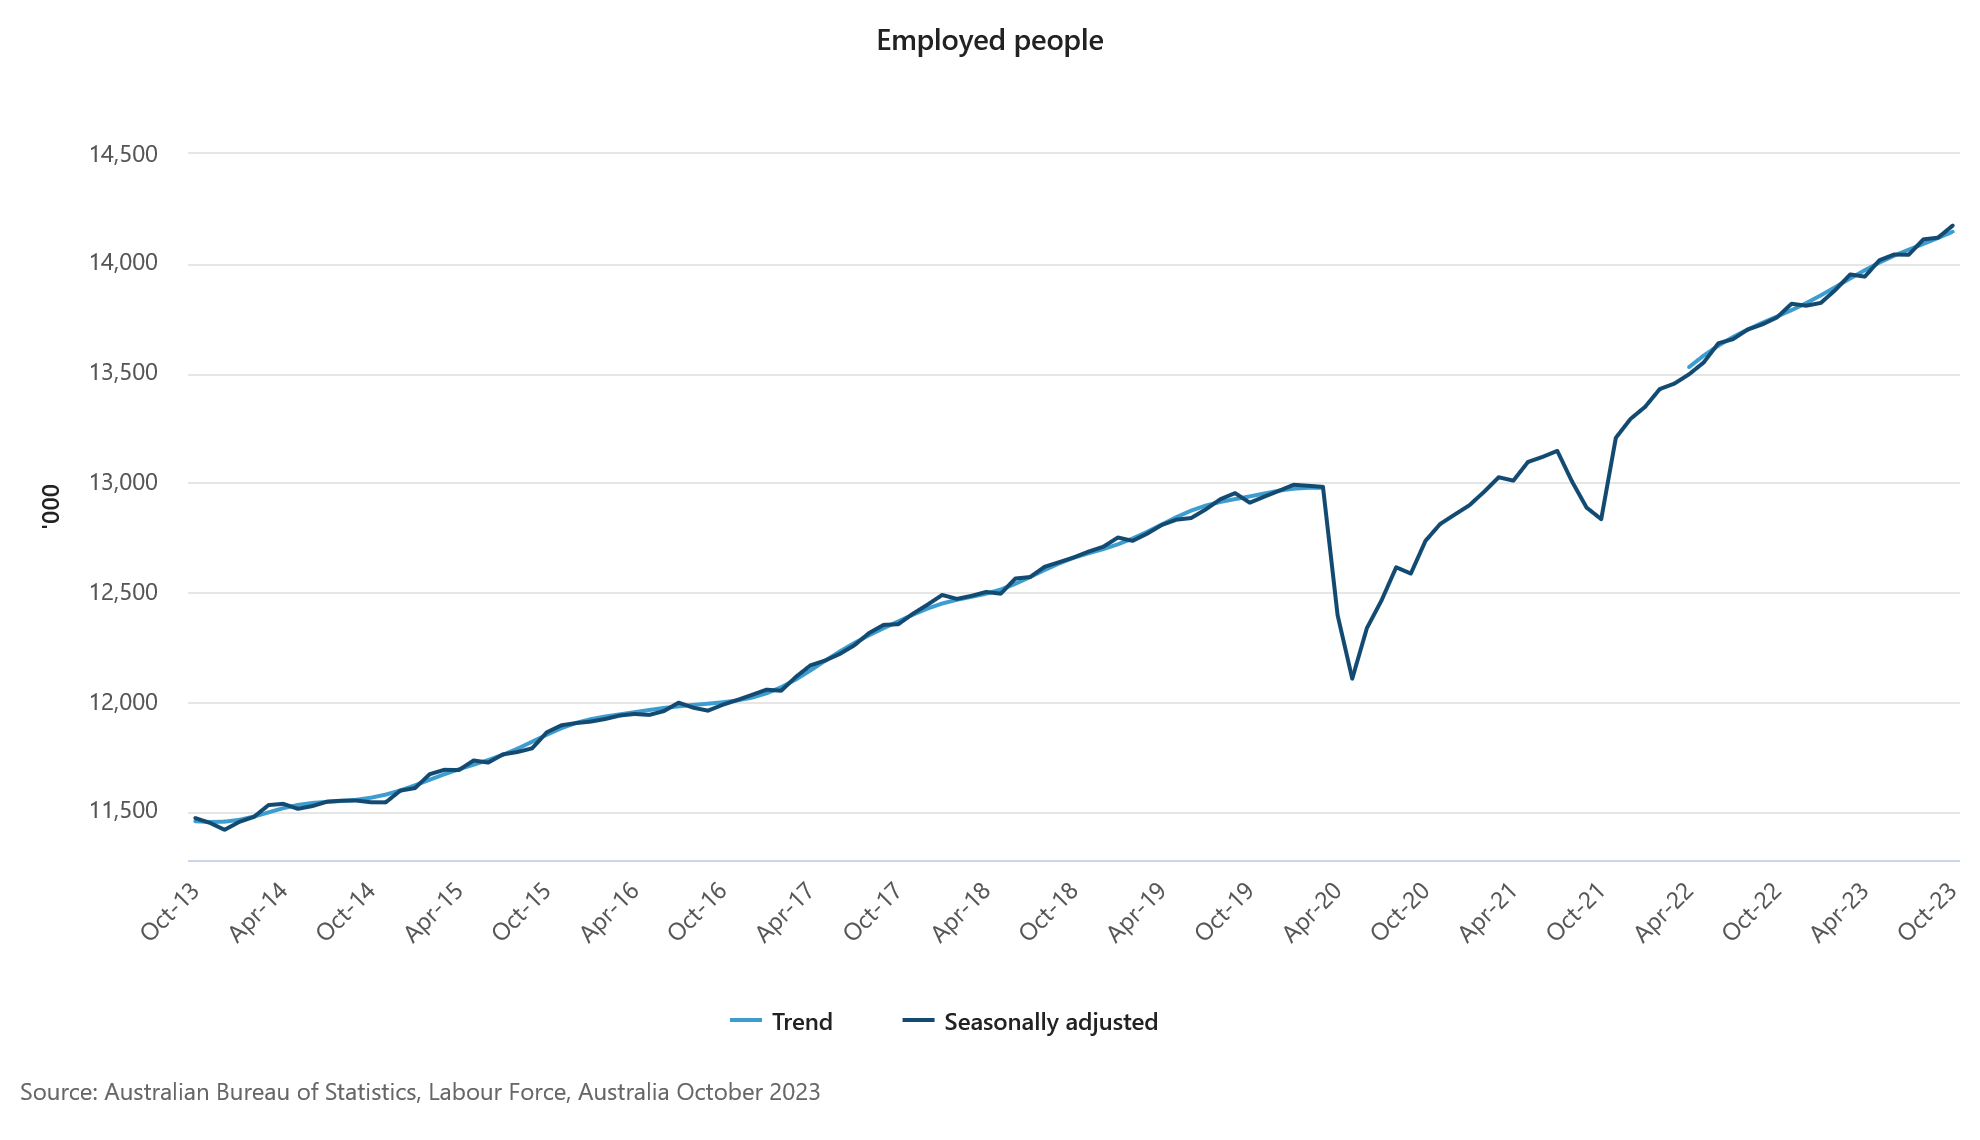
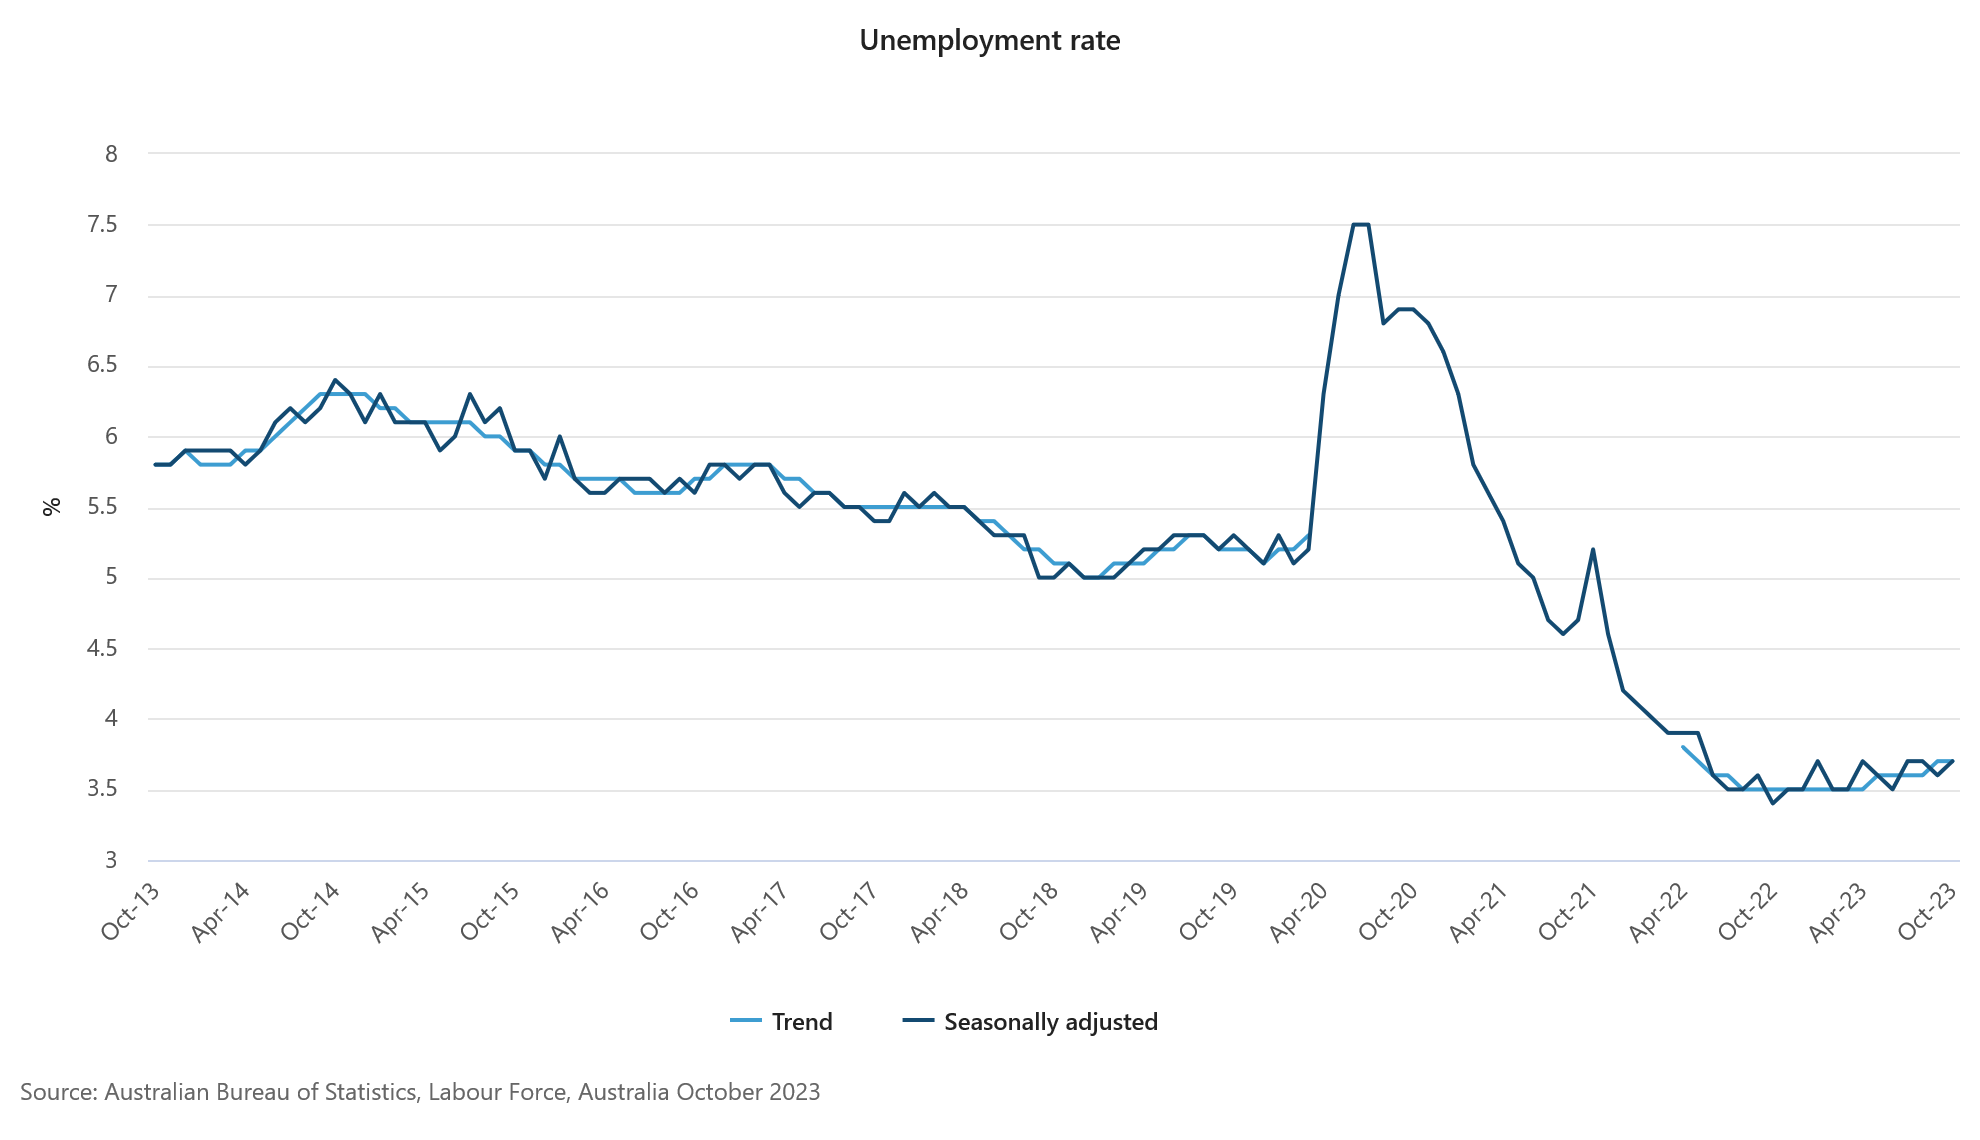
Australia’s employment grows 55k, yet signs of cooling emerge
Australia's labor market displayed stronger-than-anticipated performance in October, with employment figures surpassing expectations. The economy added 55k jobs, well above forecasted growth of 22.8k. This increase was driven by both full-time and part-time employment, which rose by 17k and 37.9k respectively.
Despite this robust job growth, unemployment rate edged up slightly from 3.6% to 3.7%, aligning with market expectations. Participation rate also saw an uptick, rising by 0.2% to 67.0%. Additionally, month-over-month hours worked in the economy increased by 0.5%.
Bjorn Jarvis, ABS head of labour statistics, noted that over the past two months, this equates to an average monthly employment growth of approximately 31k people, slightly lower than average growth of 35k people a month since October 2022.
He also highlighted that annual growth rate in hours worked has slowed to 1.7%, down from around 5% mid-year, and lower than annual employment growth of 3.0%. This slowdown may suggest that "the labour market is starting to slow, following a particularly strong period of growth."
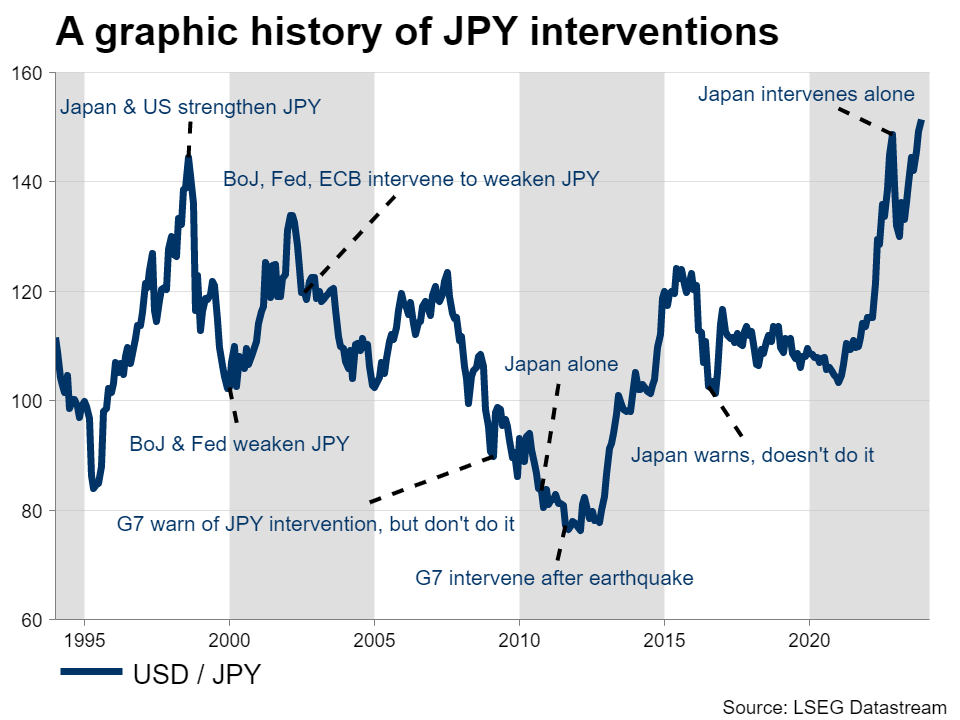
Yen Jeeps Sinking, Will Tokyo Intervene Again?
- Japanese yen loses over 13% this year as interest rate differentials widen
- Risk of another round of FX intervention is rising, but where exactly?
- Trend reversal is a story for next year - for now, outlook remains negative
Yen sinks despite favorable news
The Japanese yen remains the ‘sick man’ of the FX market. It almost touched a three-decade low against the US dollar this week, falling back to levels that prompted Tokyo to intervene in the FX market last year to defend the currency.
Interest rate differentials have been the driving force behind this relentless selling. The Bank of Japan has refused to raise rates, keeping them in negative territory even as foreign central banks like the Fed have raised their own rates to 5% or beyond. This enormous gap has seen capital leave Japan, searching for higher returns abroad.
High energy prices have also inflicted damage on the yen through the trade channel. Since Japan imports nearly all its oil and gas, the nation has been forced to pay more for its energy in recent years, which has deprived the yen from the trade surplus it has historically enjoyed.
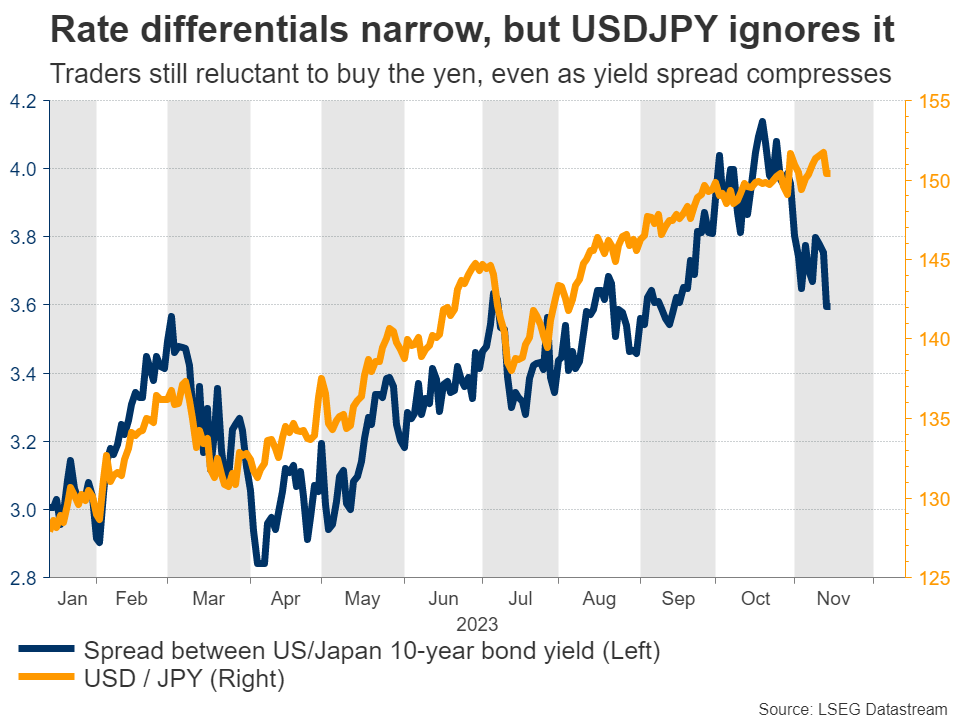
The striking part is that both of these forces lost their punch this month, with US bond yields and oil prices declining sharply, and still the yen was unable to recover. Instead, these favorable developments were only enough to stabilize the wounded currency, which underscores that traders are extremely reluctant to buy the yen.
Will Tokyo intervene again?
Without a question, the risk of another round of FX intervention has risen. The currency is already trading around levels that triggered intervention last year, and Japanese authorities have warned that they won’t hesitate to take further action.
The final authority in intervention matters is the minister of finance - Shunichi Suzuki - who recently said the government will ‘take all possible steps necessary to respond to currency moves’. That said, it’s important to note that Suzuki did not use phrases that would suggest intervention is imminent.
In the past, the buzzwords that would signal Tokyo is about to intervene would be describing FX moves as “one-sided” or “disorderly”. The fact that the finance minister refrained from using such language implies we are still some distance from actual intervention.
So the question is, where exactly is the line in the sand for Tokyo? That’s tough to answer, because the speed of currency depreciation matters in this calculation. In general, authorities are more concerned about sharp and sudden moves, as those threaten the nation’s economic stability.
Looking at the USD/JPY chart, some strategists believe the catalyst for intervention would be a break above the 152.00 region. However, the lack of urgency in the finance minister’s tone suggests the real threshold might be higher than that.
In this sense, the next spot to watch would be 155.00. How concerned Japanese officials sound as the yen approaches this area would be an indication of whether intervention is coming.
Is a trend reversal a story for 2024?
For now, it’s difficult to be optimistic on the yen. If the sharp drop in US yields and oil prices was not enough to lift the currency, it’s difficult to see what will, especially while the Bank of Japan remains so hesitant to phase out its colossal stimulus program.
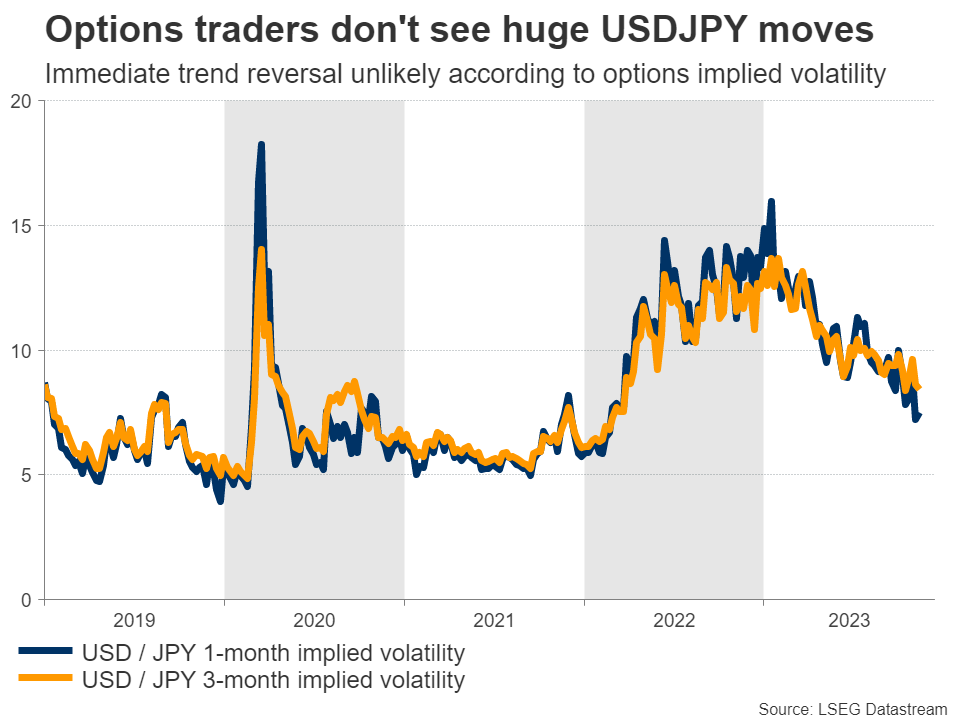
Options traders share this view. Implied volatility in short-dated USD/JPY options has fallen steadily in recent weeks, which means investors are not hedging against any massive yen moves in the next few months, viewing that scenario as unlikely. Hence, according to the options market, there’s no trend reversal on the immediate horizon.
But looking into next year, the outlook appears much brighter. With the global economy losing growth momentum and some regions teetering on the brink of recession, markets anticipate a rate-cutting cycle to begin around the spring. As such, the yen could get some relief from foreign interest rates falling next year.
The yen could also get a lift from the Bank of Japan tightening policy, perhaps by exiting negative interest rates. Markets are pricing in a minor rate increase for April, which coincides with the spring wage negotiations that will be crucial for the BoJ’s decision-making.
Similarly, there’s a chance the BoJ abandons yield curve control. This is the strategy that has crippled the yen, so scrapping it could help revitalize the currency. Whether that happens will depend on the wage negotiations and how the economic landscape evolves, but with the government preparing a heavy spending package to boost growth, the chances seem high.
All told, even though the near-term fortunes for the yen seem bleak, keeping the risk of intervention alive, the bigger picture looks more promising in an environment where interest rate differentials compress next year. The yen’s epic downtrend might be approaching its finale.
Fed’s Daly cautions against premature end to rate hikes, emphasizes need for patience
San Francisco Fed President Mary Daly, in an interview with the Financial Times, acknowledged the "very, very encouraging" signs of falling inflation in this week's data. However, she cautioned against hastily concluding the rate-raising cycle, emphasizing the importance of a cautious and informed approach.
Daly expressed concern about prematurely ending the cycle, noting the potential risks involved. "We have to be bold enough to say 'we don't know' and bold enough to say 'we need to take the time to do it right'," she stated. She warned that a premature halt could lead to a "stop-start" scenario, which could ultimately harm the Fed's credibility.
In her view, rate cuts are not on the immediate horizon. "Rate cuts are 'not happening for a while'," Daly remarked, suggesting a continued commitment to the current restrictive monetary policy direction until there is substantial evidence of a sustainable return to the 2% inflation target.
EUR/GBP – No More Rate Hikes Likely from BoE as Inflation Hits Two-year Low
- UK inflation fell to 4.6% in October (6.7% in September)
- Markets expect the next move to be a rate cut next summer
- EURGBP struggling to break technical resistance, despite data
UK inflation fell sharply in October and faster than the Bank of England anticipated, further reducing the prospect of any more rate hikes in this tightening cycle.
It was already likely that the BoE was done raising rates but as that was based on the view that inflation would fall to 4.8% last month, that could have changed with a higher reading this morning. Instead, it fell even further to 4.6% so there’s unlikely to be a big swing on the MPC in favour of hiking now, not unless the data performs much worse over the coming months.
It’s not just the headline numbers that are encouraging though. Much like the other data we’re seeing, the most recent monthly figures look extremely promising too, suggesting the pace of disinflation has accelerated recently in a manner consistent with inflation now running much lower than the annual comparisons suggest.
If we continue to see this over the coming months, especially if paired with similar trends in monthly wage growth, that first rate cut from the BoE could come earlier than many expect.
There will obviously be areas of stubbornness in the data, most notably services, but if monthly wage data continues to print at levels consistent with the 2% inflation goal and CPI data too, it’s surely only a matter of time until services fall as well. All things considered, this week’s data from the UK looks incredibly promising.
Is EUR/GBP running on fumes?
Today’s data has weighed on the pound, as you’d expect given what it means for interest rate expectations, and yet we haven’t necessarily seen an acceleration in the sell-off against the euro.
EURGBP Daily
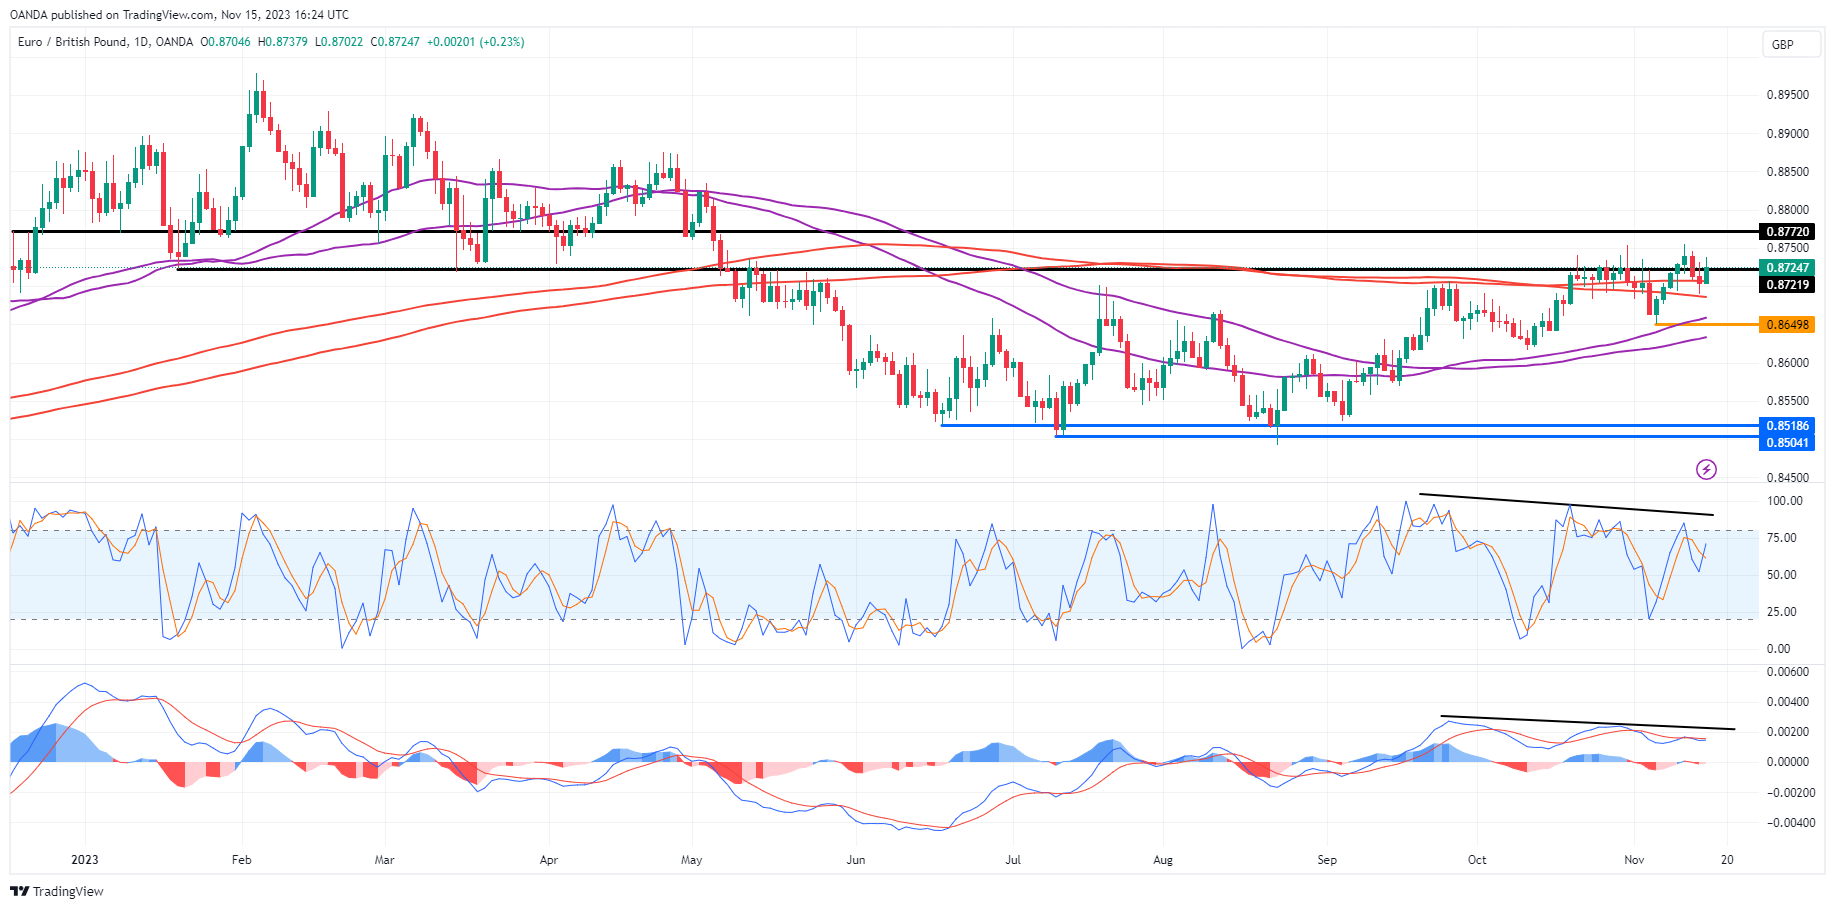
Source – OANDA on Trading View
The euro has rallied against the pound for the last few months, breaking above the 200/233-day simple moving average band in the process, but since doing that, it’s struggled to take off. Rather, it’s become very sluggish and done so is an area that’s proven to be a stubborn point of support and resistance over the last year.
You can see that from the stochastic and MACD on the bottom, both of which have been making lower highs while the price has done the opposite. To see that around a major area of resistance could be viewed as a sign that traders are losing faith in the rally.
That may make 0.8650 a very interesting level as a move below here could complete a double top breakout which would technically be a bearish signal.
Japanese Yen Slips as US Retail Sales Beats Expectations
- Japanese GDP contracts by 2.1%
- US retail sales decline by 0.1% but beats forecast
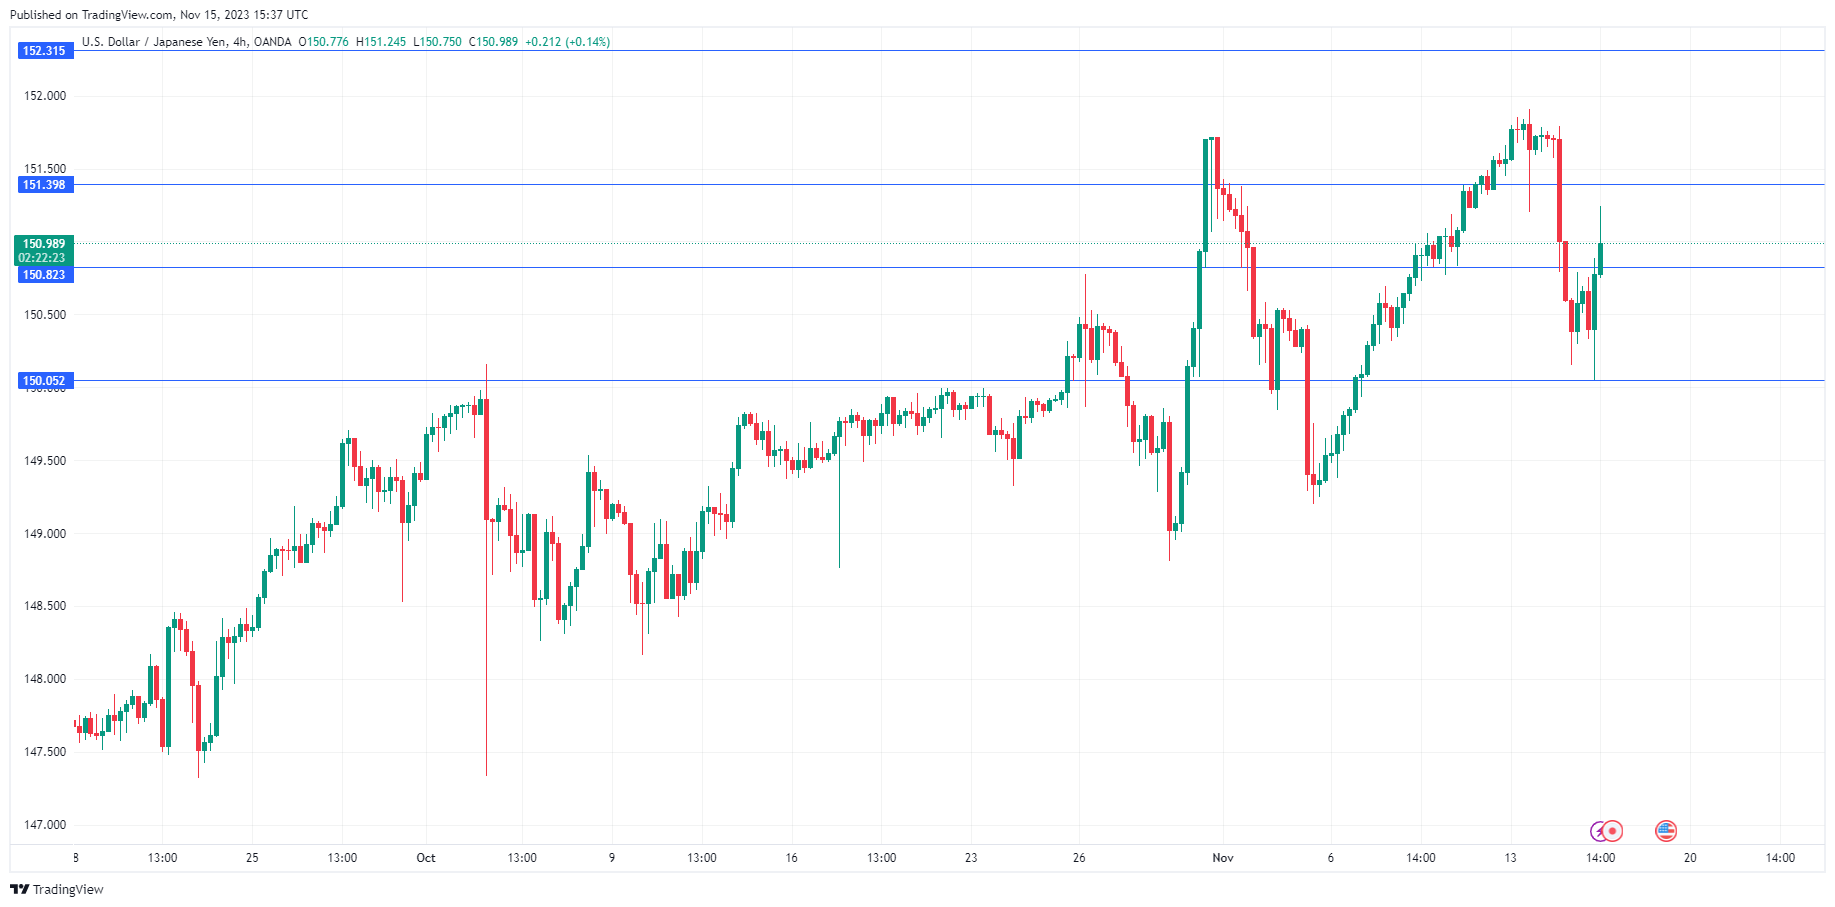
The Japanese yen has lost ground on Wednesday. In the North American session, USD/JPY is trading at 151.09, up 0.48%.
In the US, retail sales declined in October but still managed to beat expectations. Retail sales dropped 0.1% m/m, down from a revised 0.9% in September and snapping a streak of six straight increases. Still, this beat the market consensus of -0.3%.
Japan’s GDP falls 2.1%
Japan’s economy contracted 2.1% y/y in the third quarter, much worse than the market consensus of -0.6%. This follows a strong gain of 4.8% in the second quarter. On a quarterly basis, GDP declined 0.5%, missing the market consensus of -0.1% and the revised second-quarter reading of 1.1%.
The soft GDP release, the weakest in two years, reflected weaker consumer demand and a drop in exports due to decreased global demand. The Japanese economy has been unstable since the Covid pandemic in 2020, alternating between periods of contraction and expansion.
The Bank of Japan has been under pressure to tighten its ultra-loose policy in light of persistently high inflation, but policy makers will have little appetite to tighten while the economy remains fragile. The BOJ is also contending with a rapidly depreciating yen. The currency got a boost on Tuesday as a soft US CPI report sent the US dollar sharply lower, but the yen is back above 151 today and the threat of intervention is hanging in the air.
US inflation weaker than expected
US inflation was softer than expected in October, and the US dollar beat a hasty retreat on Tuesday, with sharp losses against the major currencies, including the yen.
Headline inflation fell from 3.7% to 3.2% and the core rate ticked lower to 4.1%, down from 4.0%. The markets have repriced the rate odds at the December meeting, with the probability of a pause at 99.8%, according to the CME’s FedWatch Tool. It is looking more likely that the Fed’s tightening cycle is over and the markets are now looking at a rate cut as early as May.
USD/JPY Technical
- USD/JPY has support at 150.82 and 150.05
- There is resistance at 151.39 and 152.31