Sample Category Title
US 500 Index Snaps Downtrend
- The US 500 index breaks downtrend after amazing rally
- Short-term bias bullish, but overbought conditions evident
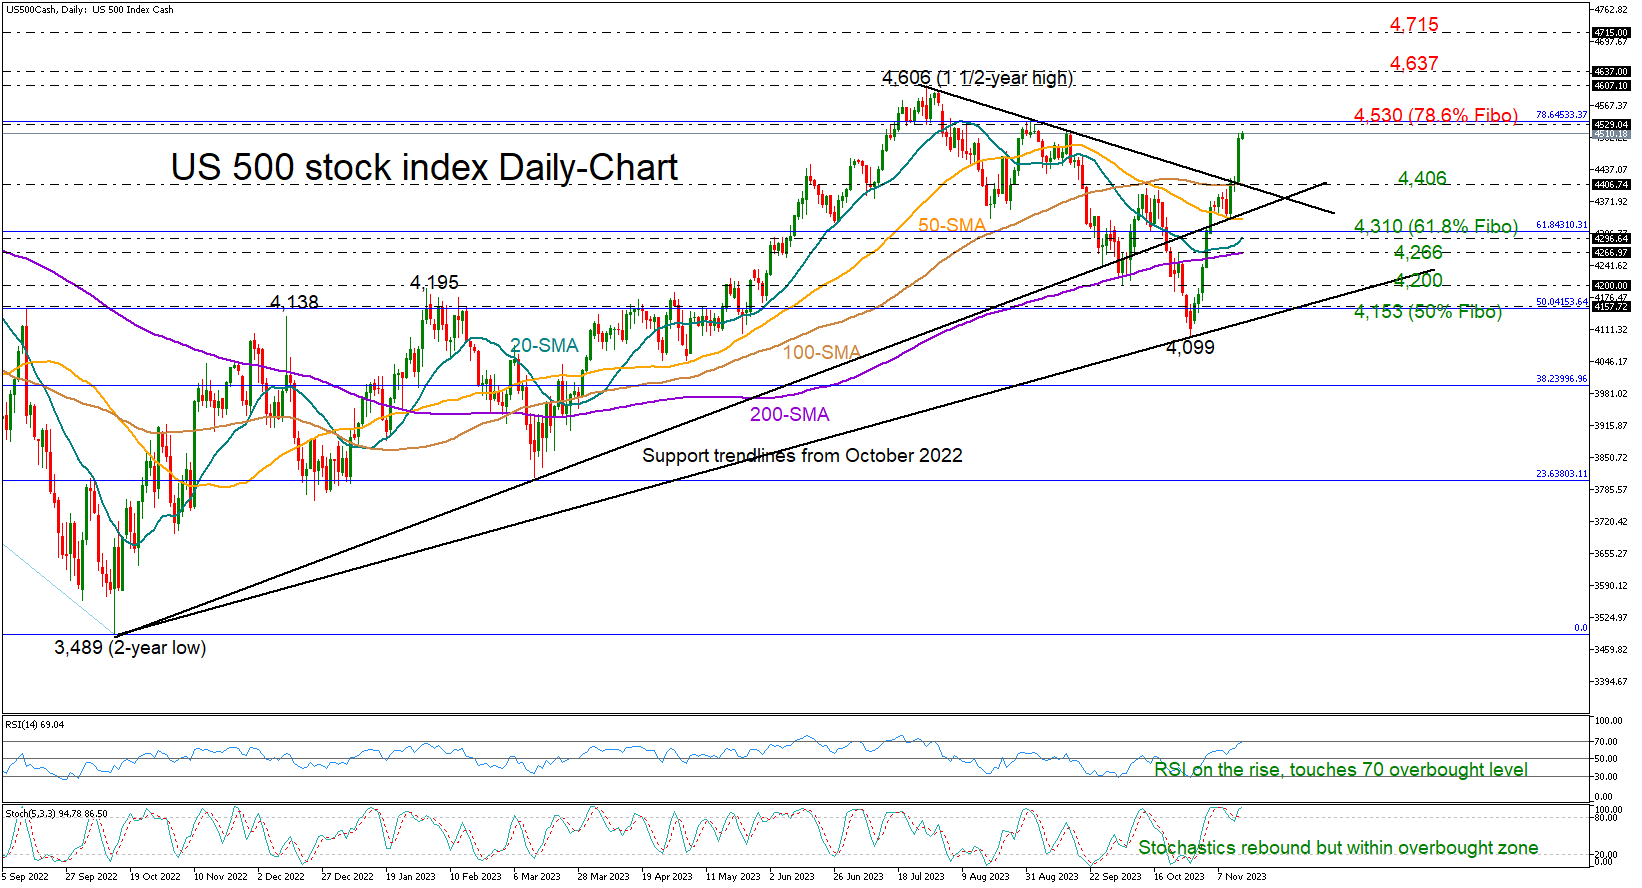
The US 500 stock index (cash) enjoyed its fastest daily rally (+2%) in a year on Tuesday, successfully scraping off the aggressive sell-off that started on September 15th to trade around 4,500 again.
The latest bullish explosion indicates that the price will continue to rise as it is significantly above the descending trendline from July and its simple moving averages. Yet, the overbought signals coming from the RSI and the stochastic oscillator are warning that the acceleration might be unsustainable, especially as the 4,530 high from September is within breathing distance. The latter also overlaps with the 61.8% Fibonacci retracement of the 2021-2022 downtrend.
If the bulls eliminate downside risks above 4,530, all the attention will turn to the 1½-year high of 4,606 registered in July. The March 2022 peak of 4,637 could come in sight as well ahead of the 4,715 barrier last seen in November 2021-January 2022.
Should the bears retake control, the index could slump back to 4,415 to test its 100-day SMA and the broken resistance trendline. Another bearish correction lower could halt immediately somewhere between the constraining line from October 2022 at 4,355 and the 50-day SMA. The 20- and 200-day SMAs could next come under the spotlight. If the latter proves fragile, the sell-off could worsen towards the 4,200 area.
In brief, the US 500 stock index has surpassed key obstacles, violating the downtrend from July’s peak. Hence, a continuation higher is more likely now, though with the index sailing in overbought waters some caution is warranted below 4,530.
Crypto Retreated Despite a Boom in Equities
Market picture
The burst of optimism in traditional markets bypassed cryptocurrencies on Tuesday. It seems that some investors shifted some of their assets from coins to shares, reducing the total capitalisation of cryptocurrencies by 1.7% over the last 24 hours.
Bitcoin continued its correction on Tuesday, which at one point seemed to get out of control as the price fell below $34.5K due to stop orders triggered. However, prices quickly moved away from the local extreme lows, and by Wednesday morning, there was moderate buying that took BTC back up to $35.6K.
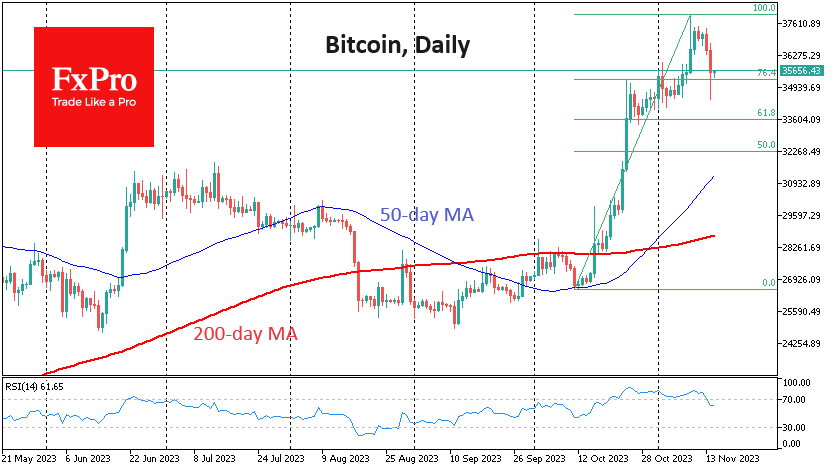
Perhaps the most acute question is whether the cryptocurrency market’s counter-trend dynamic indicates risk demand exhaustion or an attempt at a quick correction to continue following equities. We are leaning towards the latter and expect a fresh test of last week’s highs soon.
Ethereum pulled back below $2000 on Tuesday but is attempting to move higher again early Wednesday. In addition, there will be two “golden crosses” on the charts in the coming weeks – on the daily and weekly timeframes. The formation of this pattern usually attracts further buying demand.

News background
According to CCData, the Solana token (SOL) has seen the strongest growth among the major cryptocurrencies in recent weeks, and the coin’s share of total trading volume in the digital asset market has reached an all-time high (8.85%).
The leading meme coin of the Solana ecosystem, the Bonk token (BONK), has also seen rapid growth. In the last 30 days, it has grown by 850%, significantly outperforming popular and larger capitalisation meme coins such as DogeCoin, Pepe and Shiba.
Coinciding with the name of Elon Musk’s chatbot, the Grok token rose 13,000% in just one week after its launch, with a market capitalisation of $160 million.
The CBOE will launch leveraged futures trading on Bitcoin and Ethereum on 11 January 2024.
Morgan Creek founder Anthony Pompliano believes that all applications to launch spot bitcoin ETFs should be approved by the SEC simultaneously to avoid favouritism. He believes this will increase capital inflows into the cryptocurrency market and create a bullish trend.
Gold Rises as U.S. Dollar Weakens After Inflation Report
Gold (XAU) gained 0.87% on Tuesday as the U.S. dollar started to weaken after the U.S. inflation data demonstrated a slowdown, reinforcing beliefs that the U.S. interest rate might have already peaked.
Possible effects for traders
U.S. inflation indicated that U.S. consumer prices didn't change in October, and the year-over-year increase in core inflation numbers was the least significant in two years. The U.S. Dollar Index (DXY) and benchmark U.S. 10-year Treasury yields fell towards their two-month low due to lower-than-expected inflation figures. Thus, the opportunity cost of holding gold decreased. Following Tuesday's data, U.S. interest rate futures indicated a notable shift in market expectations regarding the U.S. interest rate trajectory. The chances of a rate cut by May 2024 jumped from 34% to 65%, according to the CME's FedWatch tool. Thus, anticipations of decreasing U.S. interest rates increase the gold's appeal.
XAUUSD continued to rise during the Asian and early European trading sessions. Today, traders should focus on the U.S. Producer Price Index (PPI) report due at 1:30 p.m. UTC. Higher-than-expected PPI figures may bring the XAUUSD price below 1,955. However, the short-term bullish trend in the pair may continue if the figures are lower than expected.
British Pound Rose Confidently as U.S. Inflation Slowed
Yesterday, GBPUSD rose by 1.79% after lower-than-expected U.S. Consumer Price Index (CPI) figures.
Possible effects for traders
On Tuesday, the GBPUSD pair strengthened following the mixed employment data from the U.K. and the U.S. CPI reports. Lower-than-expected U.S. inflation numbers caused significant shifts in the global markets, marking some of the most intense movements this year. Contrary to the anticipated 0.1% growth, the U.S. CPI remained unchanged in October. The core inflation rate increased by only 0.2% instead of the expected 0.3% rise. This data sharply contrasted with the forecast, leading to the reassessment of the U.S. rate hike trajectory.
During the early European trading session, GBPUSD declined following the release of lower-than-anticipated U.K. CPI numbers. Today's key event is the U.S. Producer Price Index (PPI) report due at 1:30 p.m. UTC. If the PPI figures exceed the forecast, GBPUSD could fall below 1.24500. Meanwhile, lower-than-expected PPI figures could support the short-term upward trend in GBPUSD.
EURUSD Eases After Sharp Rally Towards 2½-Month High
- EURUSD adds 200 pips and tries to reach 1.0900
- Trades well above moving average lines
- RSI suggests negative correction
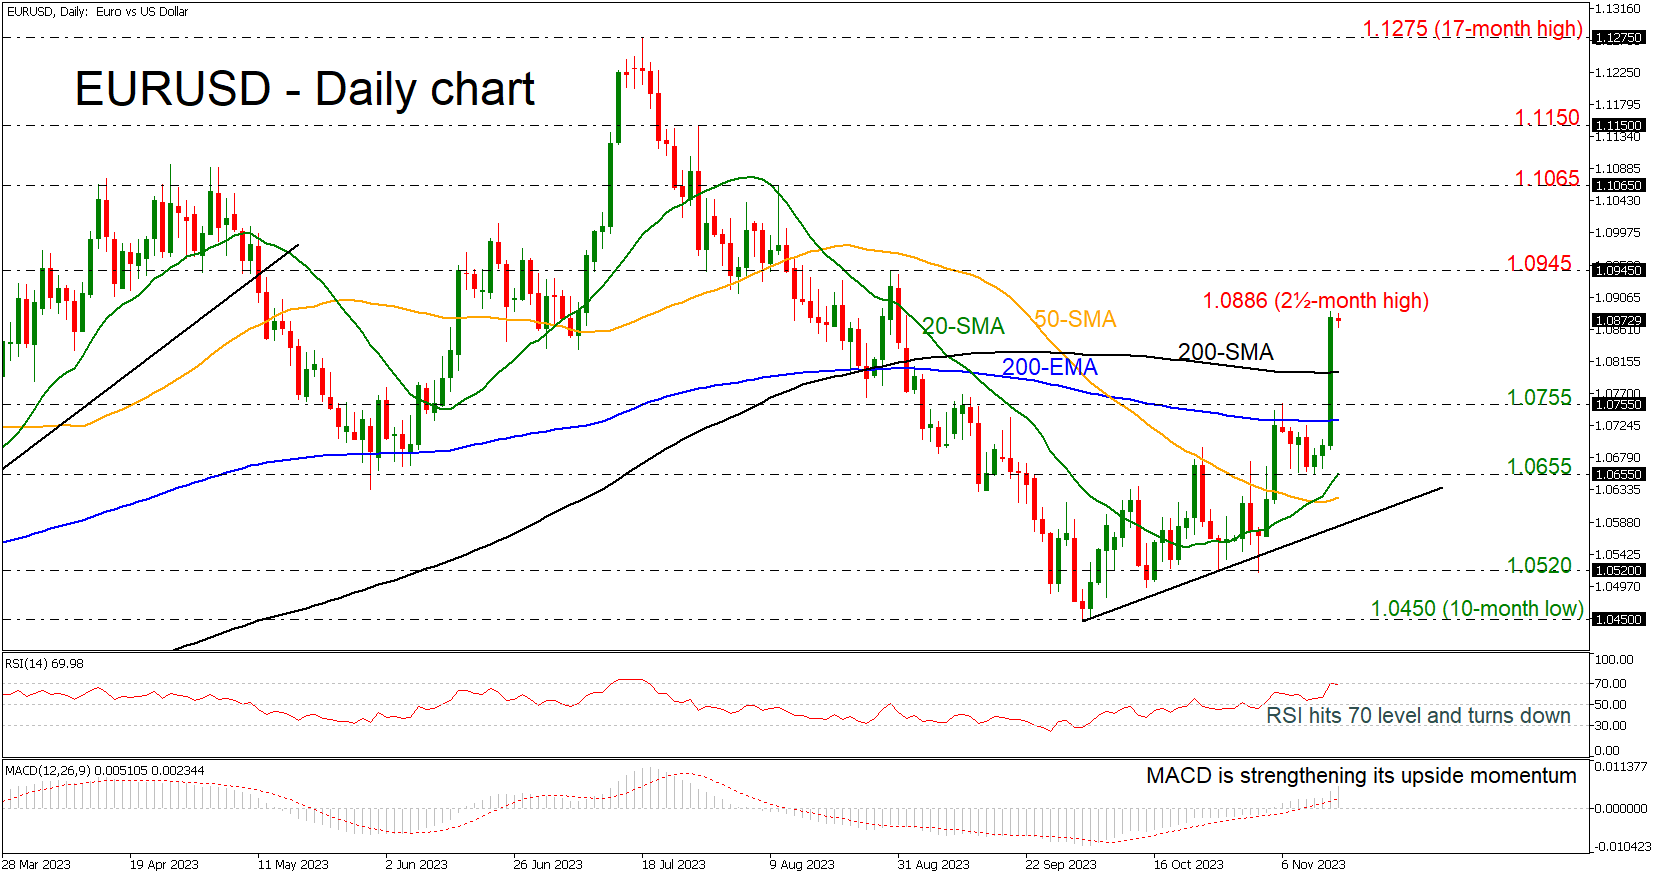
EURUSD skyrocketed yesterday after the US CPI release and added almost 200 pips, recording a new two-and-a-half-month high of 1.0886, but its rally seems to have temporarily paused.
Approaching the 1.0900 area, it seems to be a real struggle to surpass this round number according to the RSI. The RSI is losing momentum after it touched the overbought region; however, the MACD oscillator is still strengthening its bullish movement, suggesting that the bulls may not give the battle yet. Also, the pair climbed well above the 200-day exponential moving average (EMA) and the 200-day simple moving average (SMA), which were acting as strong resistance levels in the past and the 20- and 50-day SMAs printed a bullish crossover.
In the event the pair re-activates its uptrend above Tuesday’s top of 1.0886, the next target will be the 1.0945 resistance. Even higher, the bulls might head for the 1.1065 barricade, which was a key resistance zone during August.
On the downside, the 200-day SMA at 1.0800 is the first stop to have in mind ahead of the 1.0755 support and the 200-day EMA at 1.0733. Hence, a step beneath that line, the 1.0655 line, which overlaps with the 20-day SMA might produce negative volatility.
Summarizing, EURUSD is sustaining an upward trend above the moving average lines and well above the short-term uptrend line. To attract new buyers, the pair will need to pierce through the 1.0900 psychological mark.
USDJPY Bears Show Their Strength But Is It Enough for a Downleg?
- USDJPY in the green today after a strong red candle
- Bears took advantage of USD weakness in the market
- Momentum indicators have reached a crucial stage
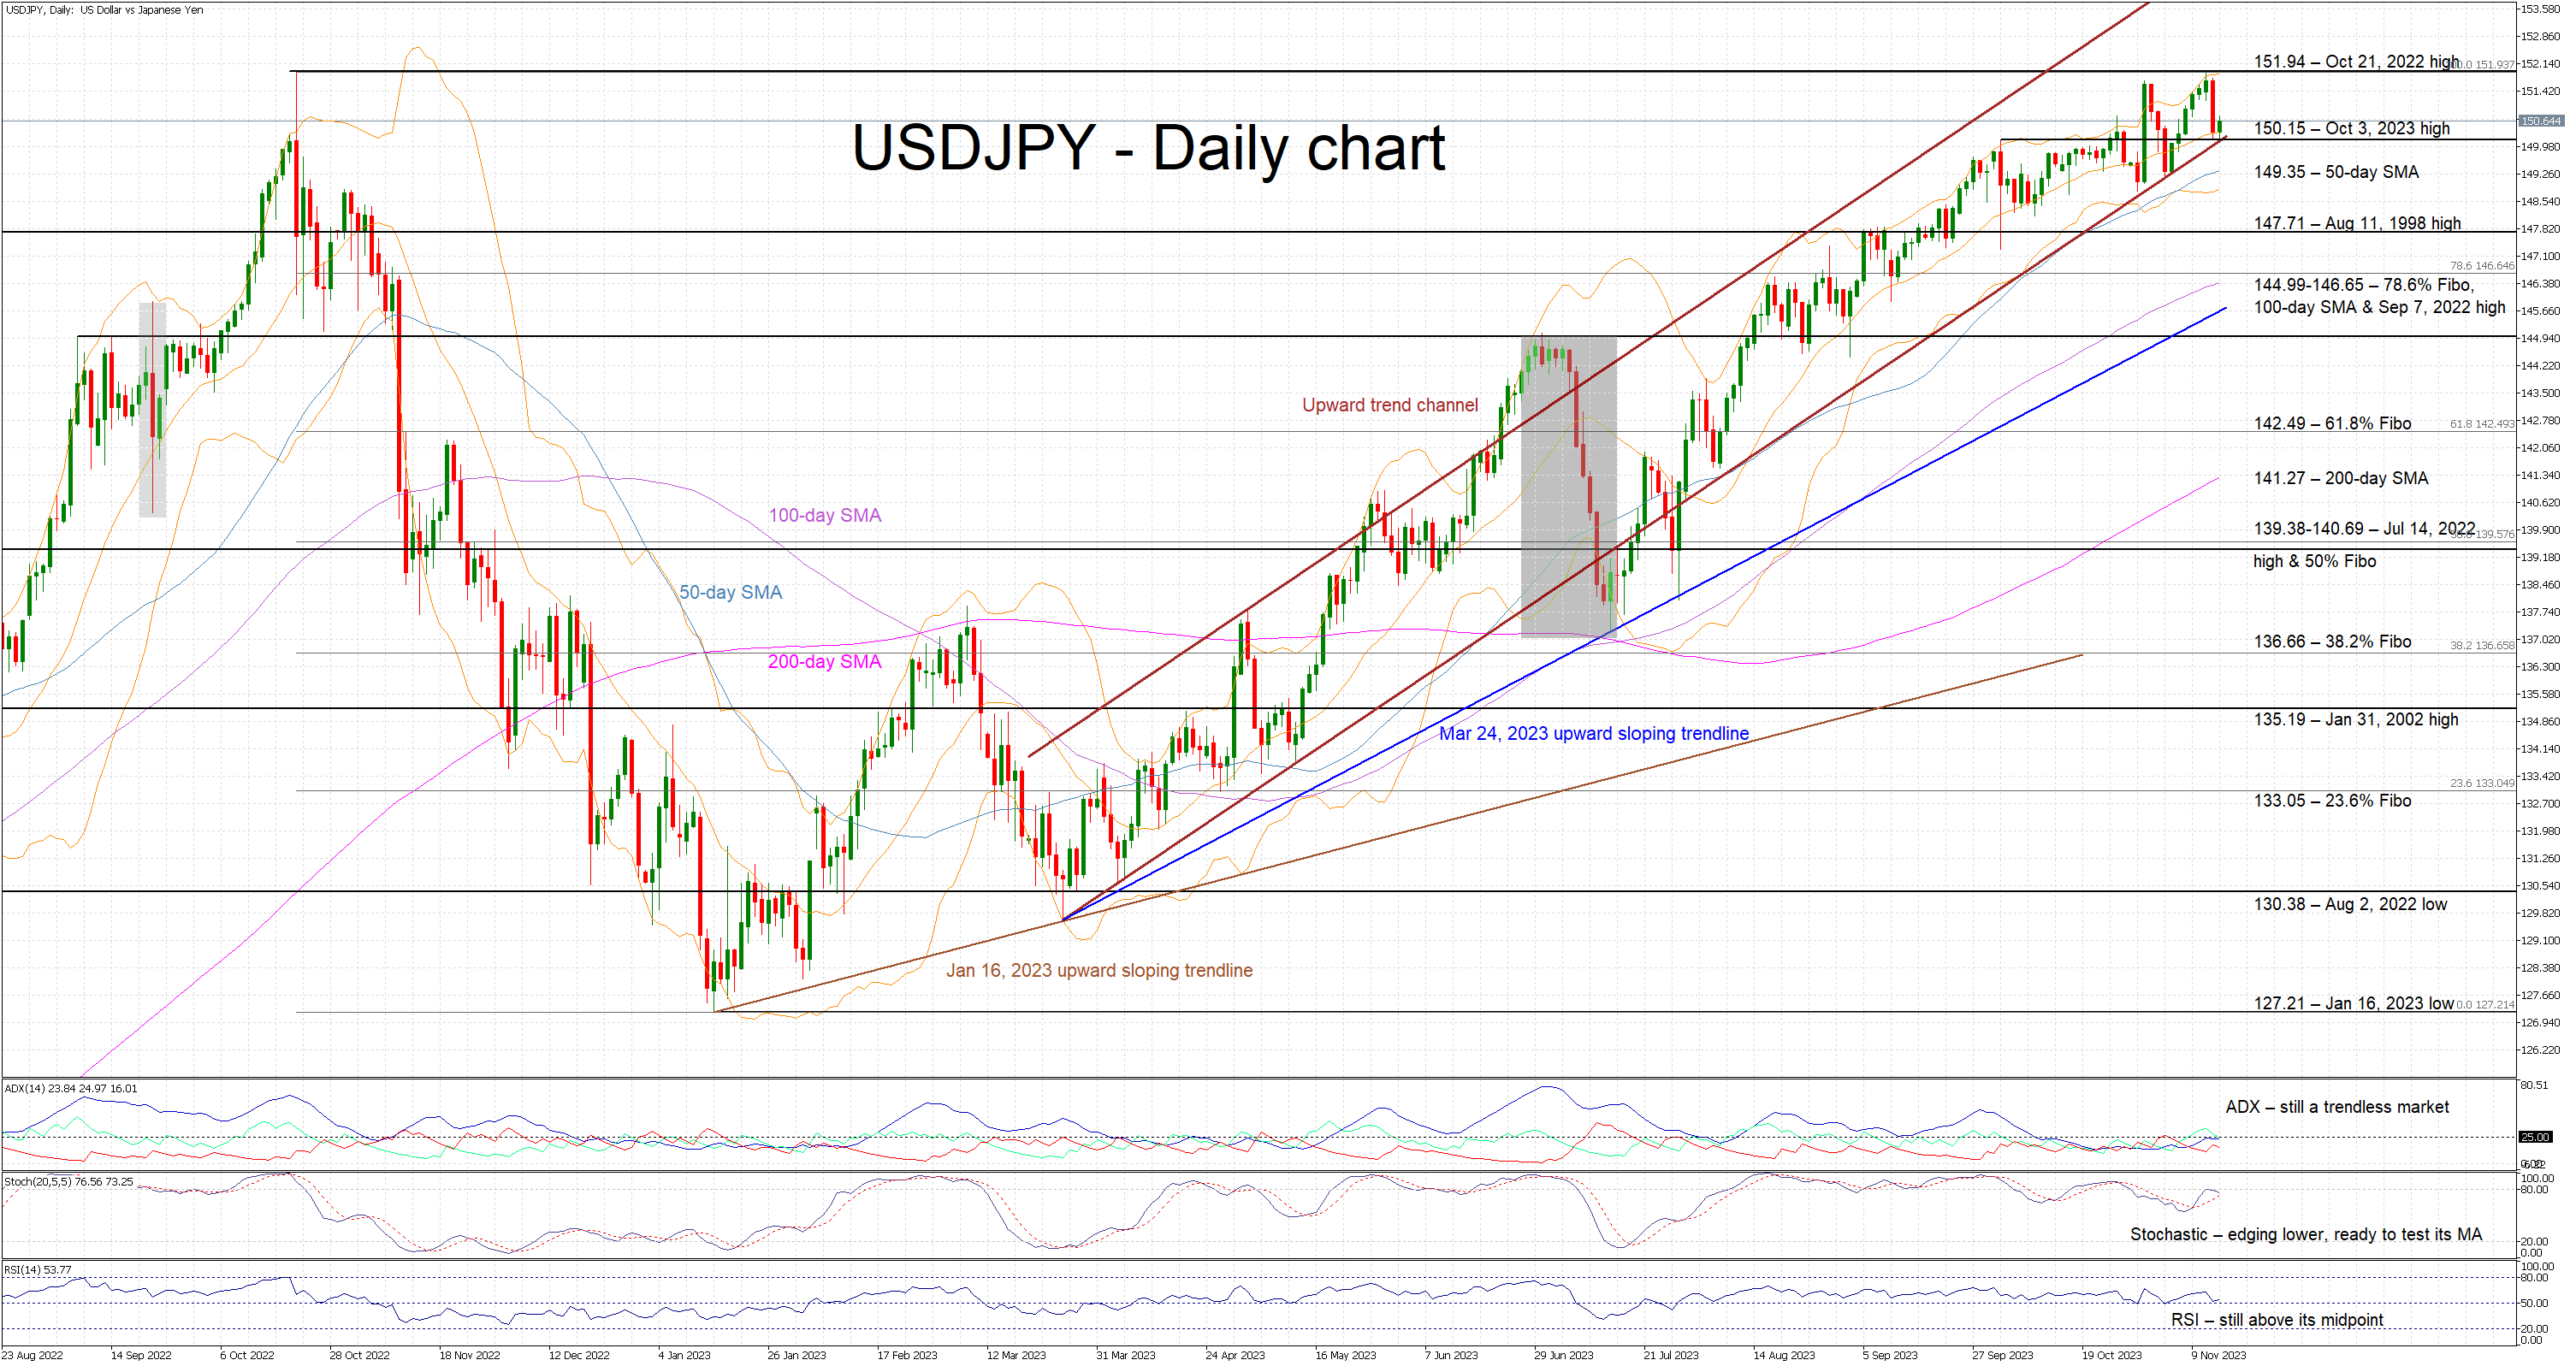
USDJPY is higher today, bouncing off the lower boundary of the ascending trending channel that has been in place since mid-March. Today’s reaction is partly the response from the USDJPY bulls to yesterday’s sizeable red candle. With Japanese authorities sticking to verbal intervention and the BoJ disappointing, market participants are fighting for the upper hand in USDJPY, resulting in an impulsive market.
In the meantime, the momentum indicators have reached a critical stage. The Average Directional Movement Index (ADX) is stuck below its 25-threshold and thus signals a trendless market. On the flip side, the RSI continues to hover above its 50-midpoint for the fourth consecutive month, revealing persistent bullish pressure. Crucially, the stochastic oscillator is gradually moving lower and preparing to test the resistance set by its moving average (MA). A break below the MA would be seen as a strong bearish signal.
Should the bulls remain hungry, they could try to confidently keep USDJPY above the 150.15 level. They could then have the chance to break the October 21, 2022 high at 151.94 and record a new 2023 high.
On the flip side, USDJPY bears are probably keen on finally breaking the lower boundary of the trending channel and the October 3, 2023 high at 150.15. If they are successful, they could have a go at pushing USDJPY below both the 50-day simple moving average at 149.35 and the August 11, 1998 high at 147.71 respectively. Even lower, the path appears to be clear until the 144.99-146.65 area.
To sum up, USDJPY bears have finally shown some signs of life, but the battle goes on as the bulls remain committed to breaking the 151.94 level and recording a new 2023 high.
EUR/USD Rallies Post US CPI While USD/JPY Takes Hit
EUR/USD started a fresh increase above the 1.0775 resistance. USD/JPY is declining and showing bearish signs below the 151.00 level.
Important Takeaways for EUR/USD and USD/JPY Analysis Today
- The Euro is rising and trading well above the 1.0835 resistance zone.
- There is a key bullish trend line forming with support near 1.0775 on the hourly chart of EUR/USD at FXOpen.
- USD/JPY is trading in a bearish zone below the 151.00 and 150.70 levels.
- There was a break below a major bullish trend line with support at 151.65 on the hourly chart at FXOpen.
EUR/USD Technical Analysis
On the hourly chart of EUR/USD at FXOpen, the pair started a fresh increase from the 1.0660 zone. The Euro climbed above the 1.0750 resistance zone against the US Dollar.
The pair even settled above the 1.0775 resistance and the 50-hour simple moving average. Finally, it tested the 1.0885 resistance. A high is formed near 1.0887 and the pair is now consolidating gains.
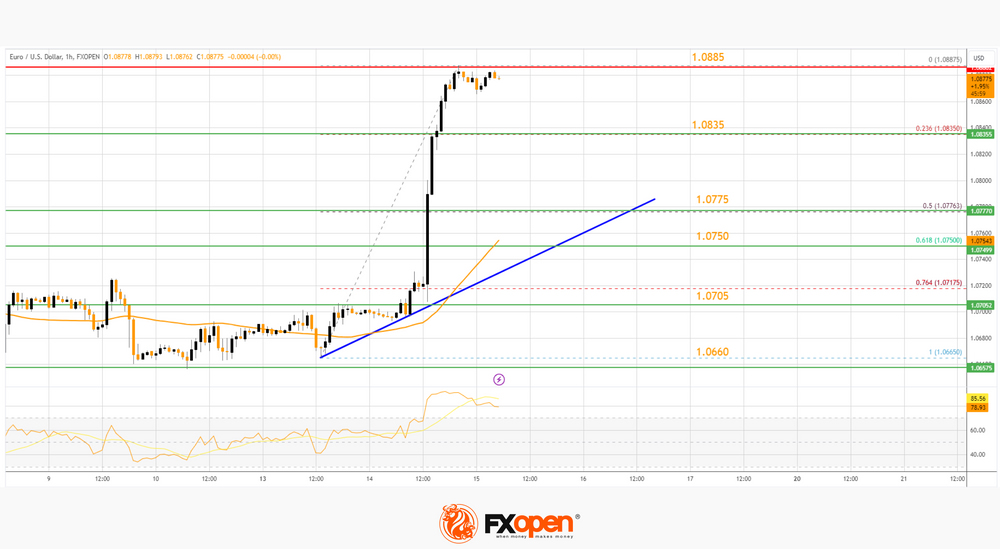
If there is a downside correction, the pair might test the 23.6% Fib retracement level of the upward move from the 1.0665 swing low to the 1.0886 high at 1.0835. The next major support is forming near a key bullish trend line at 1.0775.
The trend line is close to the 50% Fib retracement level of the upward move from the 1.0665 swing low to the 1.0886 high. The next key support is near the 50-hour simple moving average at 1.0750. If there is a downside break below 1.0750, the pair could drop toward the 1.0705 support. The main support on the EUR/USD chart is near 1.0660, below which the pair could start a major decline.
On the upside, the pair is now facing resistance near 1.0885. The next major resistance is near the 1.0920 level. An upside break above 1.0920 could set the pace for another increase. In the stated case, the pair might rise toward 1.0980.
USD/JPY Technical Analysis
On the hourly chart of USD/JPY at FXOpen, the pair started a strong decline well above the 151.80 zone. The US Dollar gained bearish momentum below the 151.50 support against the Japanese Yen.
There was a break below a major bullish trend line with support at 151.65. The pair even settled below the 151.00 level and the 50-hour simple moving average. Finally, it broke the 150.70 pivot level. A low is formed near 150.15 and the pair is now showing a lot of bearish signs.
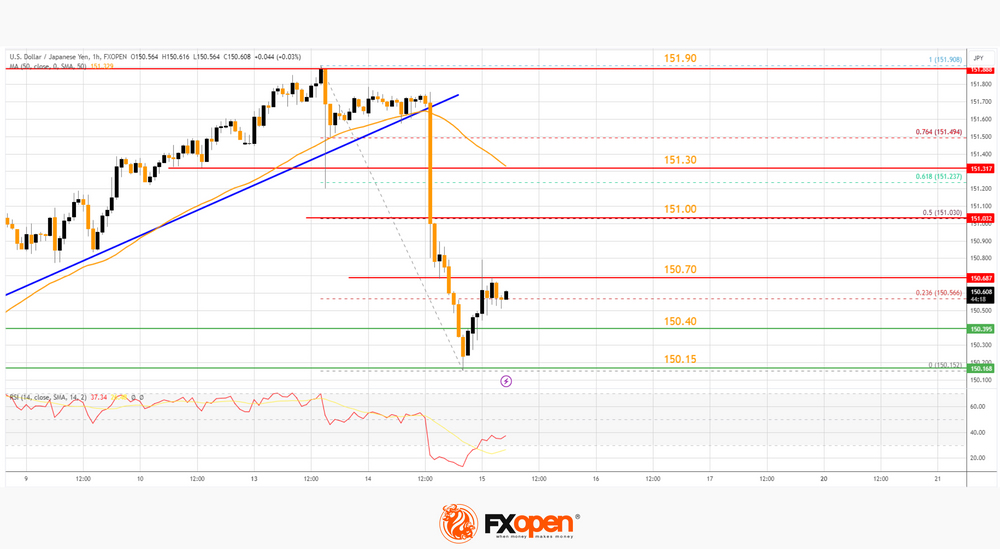
It is trading near the 23.6% Fib retracement level of the downward move from the 151.90 swing high to the 150.15 low. Immediate resistance on the USD/JPY chart is near 150.70.
The first major resistance is near the 50% Fib retracement level of the downward move from the 151.90 swing high to the 150.15 low at 151.00. The main resistance is near the 50-hour simple moving average at 151.30.
If there is a close above the 151.30 level and the hourly RSI moves above 50, the pair could rise toward 151.90. The next major resistance is near 152.50, above which the pair could test 154.00 in the coming days.
On the downside, the first major support is near 150.40. The next major support is near the 150.15 level. If there is a close below 150.15, the pair could decline steadily. In the stated case, the pair might drop toward the 148.50 support.
Trade global forex with the Innovative Broker of 2022*. Choose from 50+ forex markets 24/5. Open your FXOpen account now or learn more about trading forex with FXOpen.
* FXOpen International, Innovative Broker of 2022, according to the IAFT
This article represents the opinion of the Companies operating under the FXOpen brand only. It is not to be construed as an offer, solicitation, or recommendation with respect to products and services provided by the Companies operating under the FXOpen brand, nor is it to be considered financial advice.
Fed Done Hiking and Readying a Full Percentage Rate Cut by End Next Year
Markets
The Fed is done hiking and readying a full percentage rate cut by end next year. That’s what markets concluded from yesterday’s <0.1% ppt lower than expected CPI numbers. It triggered a mindboggling repositioning across the curve. It’s as if markets were waiting for one/any number to scoop up battered Treasuries. Yields fell 20-22.4 bps in the 2-7y bucket and 13.4-19.3 bps further out. The 2-y yield tested the recent November correction low at 4.80% while the 10-y hit lost support around 4.50% to finish at a two-month low of 4.44%. The rally in Treasuries caught German Bunds in their slipstream, pushing yields in the country between 9.3-11.3 bps lower across the curve. The 2-y over there lost the 3% mark, the 10-y tenor closed near the lower bound of the Oct-Nov downward trend channel at 2.6%. This level also coincides with the 38.2% retracement on the 2023 yield rally. The massive interest rate support loss and the equity rally it triggered (US stocks 1.4-2.4% higher) tackled the US dollar. DXY opened at 105.65 to close just north of 104 and in the process lost support at 105.51 and 104.38 (23.6% and 38.2% retracement on the 2023H2 DXY recovery). EUR/USD added almost two big figures into a close of 1.0879. Resistance areas at 1.0756, 1.0764 and 1.0862 posed no problems whatsoever. Dollar weakness even gave the ailing JPY a breather. USD/JPY fell to 150.37 (from 151.78). Compare this to EUR/JPY, which surged to a new 15-year high of 163.60.
Asian-Pacific equities keenly jump on the WS train. Stocks add up to 3% and more in China, with some good news in the country helping the move higher (see below). The yuan appreciated further to a three-month high of USD/CNY 7.24 with USD weakness helping at least as much. JPY pares some of yesterday’s gains amid poor Japanese Q3 growth and risk on. US Treasuries more or less stabilize. The economic calendar today contains US PPI and retail sales. Yesterday’s price action revealed a clear dovish skew towards data. Any downside miss is likely to extend the correction in US yields whereas a significant surprise to the upside is needed for a rebound worth the name. US 10-y yield support kicks in at 4.33% (Oct 22 interim high)/4.34% (38.2% retracement on the 2023 yield rise)/4.36% (Aug 23 interim high). Next resistance EUR/USD at 1.0945/1.0965 should hold as US bond sentiment will probably spill over to Europe as well. UK inflation numbers this morning printed a downside surprise similar to the US (0% m/m, 4.6% y/y and 5.7% for the core). The numbers, as in the US, cement market thinking of the BoE being done with hiking and instead preparing rate cuts mid-2024. Sterling losses are contained for now though. EUR/GBP rises towards 0.871.
News & Views
The Japanese economy contracted more than expected in Q3. After an 1.1% growth spurt in Q2, activity in Q3 contracted by 0.5% Q/Q (-0.1% expected). The decrease was mainly due to poor domestic demand (-0.4%), especially corporate investment. Private consumption stagnated after a substantial decline in Q2, underscoring sluggish underlying consumer demand. Government consumption was a supportive (0.3% Q/Q). Net exports shaved off -0.1 ppt as a modest rise in exports (0.5%) was offset by a 1.0% rise in imports. The BoJ may consider the poor performance of private consumption a sign that a sustained, demand driven inflation rise remains uncertain. In this respect, the BoJ probably won’t be in a hurry to exit stimulative policy. Even so, after a sharp decline at the open (mirroring the global market), the Japanese 10-y yield holds in the 0.80% area. USD/JPY this morning trades in the 150.65 area compared to levels of 151.5+ yesterday but this was due to USD weakness. The yen remains weak with the likes of EUR/JPY (163.9) touching multi-year peak levels.
Chinese October retail sales rebounded more than expected at 7.6% Y/Y from 5.5% Y/Y in September and 7.0% expected. YTD retail sales now are 6.9% higher compared to the same period last year. October industrial production data also showed a small beat (4.6% Y/Y vs 4.5% expected). At the same time, property investment (YTD -9.3%) remains a huge negative for the economy being a major drag on the fixed investment performance. The PBOC this morning offered much more cash (CNH 1450 bln) than expected (and what matured) via its 1-year Medium Term Lending facility. The cash injection suggests that the bank still sees the need for ongoing policy stimulation. The yuan this morning strengthened to USD/CNY 7.24, but this is mainly USD softness.
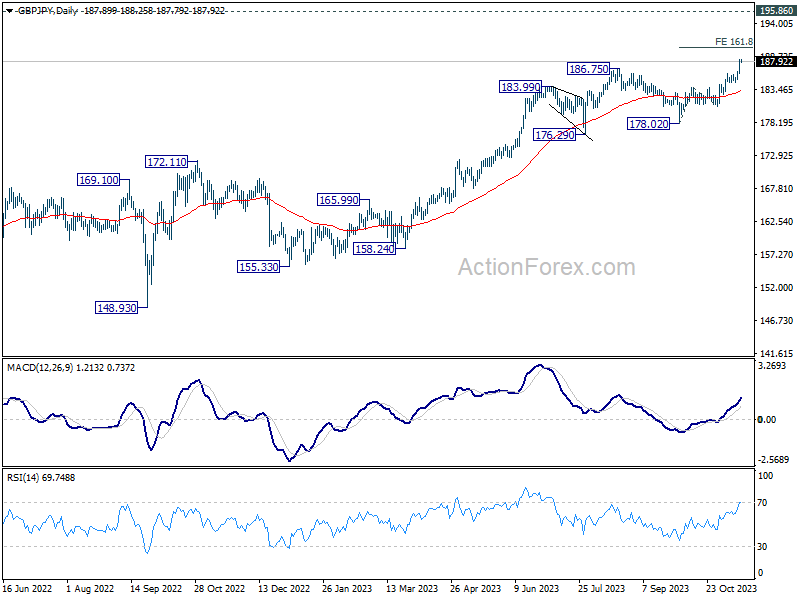
GBP/JPY Daily Outlook
Daily Pivots: (S1) 186.54; (P) 187.41; (R1) 188.84; More...
GBP/JPY's rally is in progress and intraday bias stays on the upside. Next target is 161.8% projection of 178.02 to 183.79 from 180.74 at 190.07. On the downside, below 187.26 minor support will turn intraday bias neutral and bring consolidations first, before staging another rise.
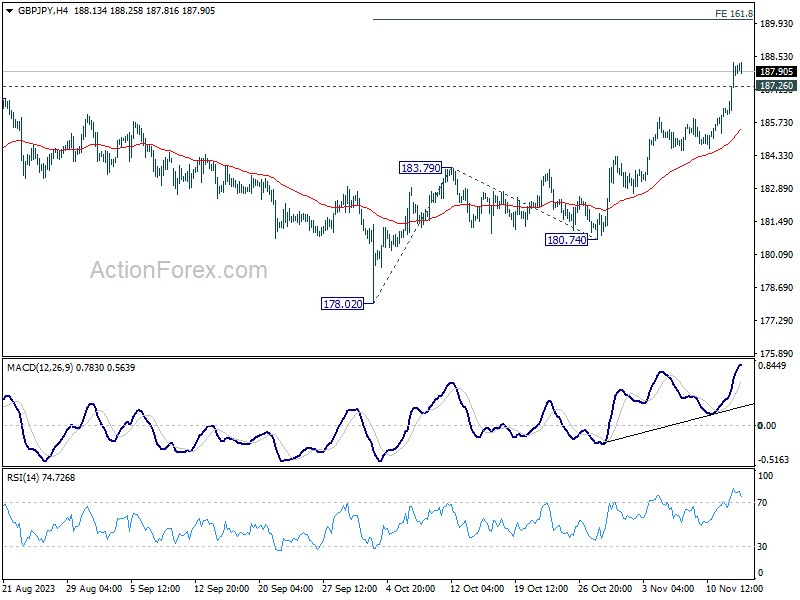
In the bigger picture, as long as 178.02 support holds, larger up trend from 123.94 (202 low) should still be in progress, next target is 195.86 (2015 high). For now, outlook will stay bullish as long as 183.79 resistance turned support holds, in case of deep pullback.
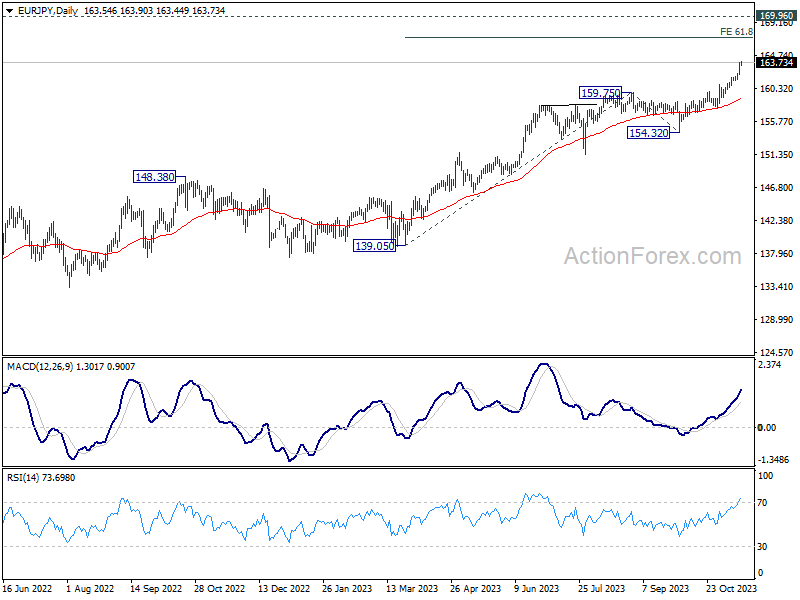
EUR/JPY Daily Outlook
Daily Pivots: (S1) 162.60; (P) 163.21; (R1) 164.21; More....
Intraday bias in EUR/JPY remains on the upside as recent rally is still in progress. Next near term target is 61.8% projection of 139.05 to 159.75 from 154.32 at 167.11. On the downside, below 163.23 minor support will turn intraday bias neutral and bring consolidations first, before staging another rally.
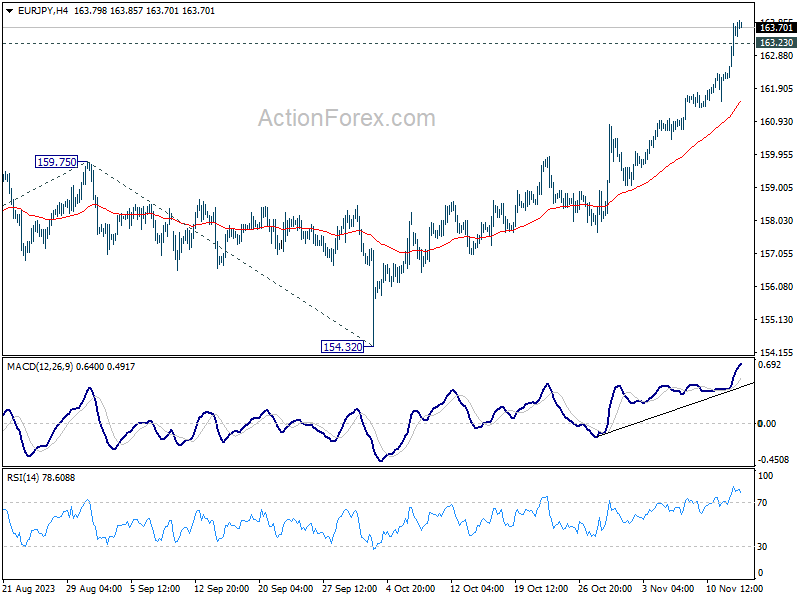
In the bigger picture, rise from 114.42 (2020 low) is in progress. Next target is 169.96 (2008 high). On the downside, break of 159.75 resistance turned support is needed to be the first sign of medium term topping. Otherwise, outlook will remain bullish even in case of deep pullback.