Sample Category Title
AUD/USD: On Track for Weekly Loss of Over 2%
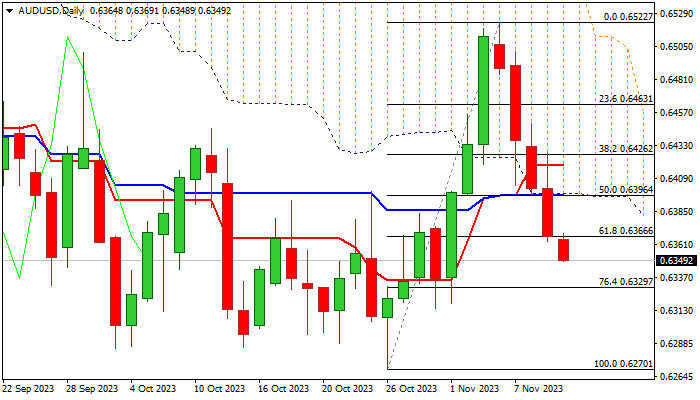
AUDUSD remains firmly in red for the fifth straight day and on track for a weekly loss of over 2% which erased the most of previous week’s gains.
Aussie came under increased pressure from the Fed’s latest hawkish shift, which so far offsets renewed hawkishness from the RBA on growing fears that inflation will remain resilient, indicating possible further rate hikes.
Technical picture on daily chart weakened significantly as the price broke below thick daily cloud and MA’s turned to bearish setup, while 14-d momentum is trending lower but still holding in positive territory.
On the other hand, deeply oversold stochastic may slow bears for consolidation which should offer better selling opportunities if limited and keeping bears intact.
Initial resistance lays at 0.6366 (broken Fibo 61.8% / 20DMA), with extended upticks to stay below 0.6396 (daily cloud base / daily Kijun-sen)) and maintain bearish bias.
Res: 0.6366; 0.6396; 0.6408; 0.6426.
Sup: 0.6329; 0.6314; 0.6285; 0.6270.
GBP/USD Stems Slide as GDP Beats Estimate
- UK GDP flat in third quarter
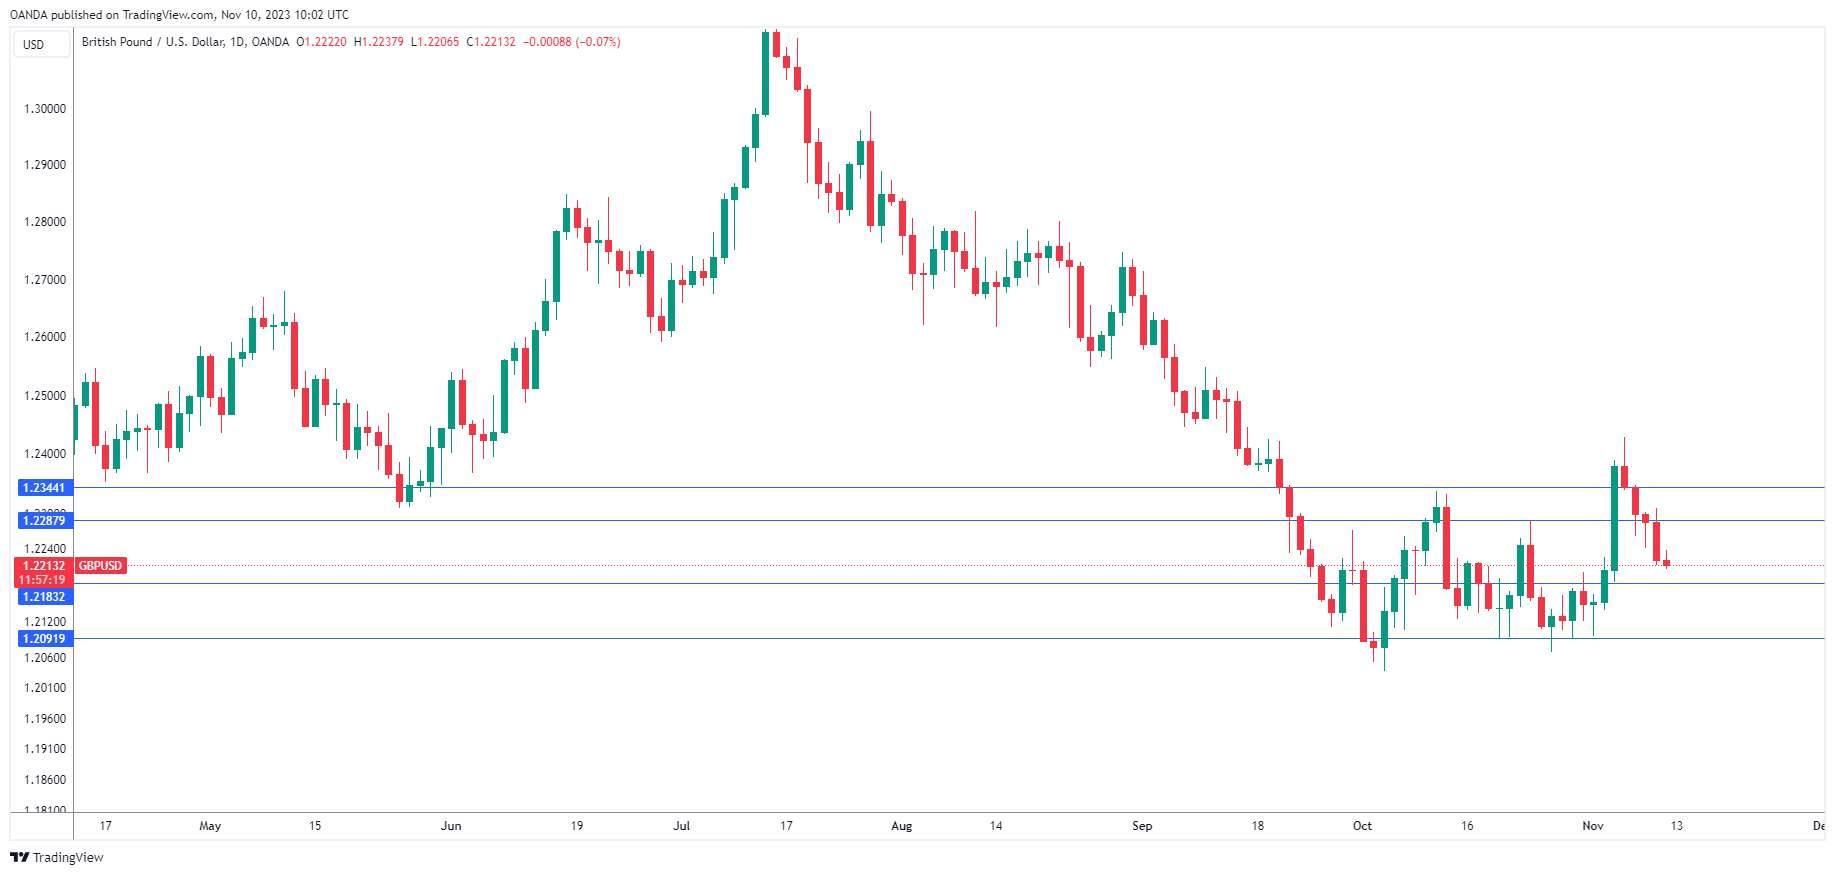
The British pound is steady on Friday. In the European session, GBP/USD is trading at 1.2219, down 0.02%. The pound is coming off a nasty four-day slide, in which it declined 1.19%.
GDP flatlines in Q3
Today’s UK’s GDP numbers weren’t pretty, but they managed to beat the forecasts, which has helped the British pound stabilize after a disappointing week. The economy flatlined in the third quarter, below the Q2 reading of 0.2% q/q but higher than the market consensus of -0.1%. Monthly, GDP eked out a gain of 0.2%, versus a revised 0.1% in July and above the market consensus of 0.0%.
The lack of growth in the third quarter is nothing to cheer about, but at least the UK will avoid a recession this year, which is defined as two consecutive quarters of negative growth. High interest rates and stubborn inflation continue to squeeze consumers and businesses, and a sharp drop in house sales has dragged down the services sector. Consumers are in a sour mood due to the cost of living crisis and are expected to cut down on Christmas shopping.
The Bank of England lowered its growth forecast for the fourth quarter at its meeting earlier this month when it kept interest rates unchanged. GDP is expected to rise just 0.1% q/q. Inflation is projected to fall back to the 2% target at the end of 2025, six months later than the previous forecast. Governor Bailey has been stressing that inflation remains too high, but the BoE nevertheless voted to hold rates after 14 straight increases. Another pause at the December meeting would be the central bank’s preferred plan of action, data permitting.
GBP/USD Technical
- There is resistance at 1.2287 and 1.2344
- 1.2183 and 1.2091 and are providing support
Gold Turns Lower Again
- Gold stalls recovery; cannot surpass 20-SMA
- Sentiment weakens, but the bulls might have another chance
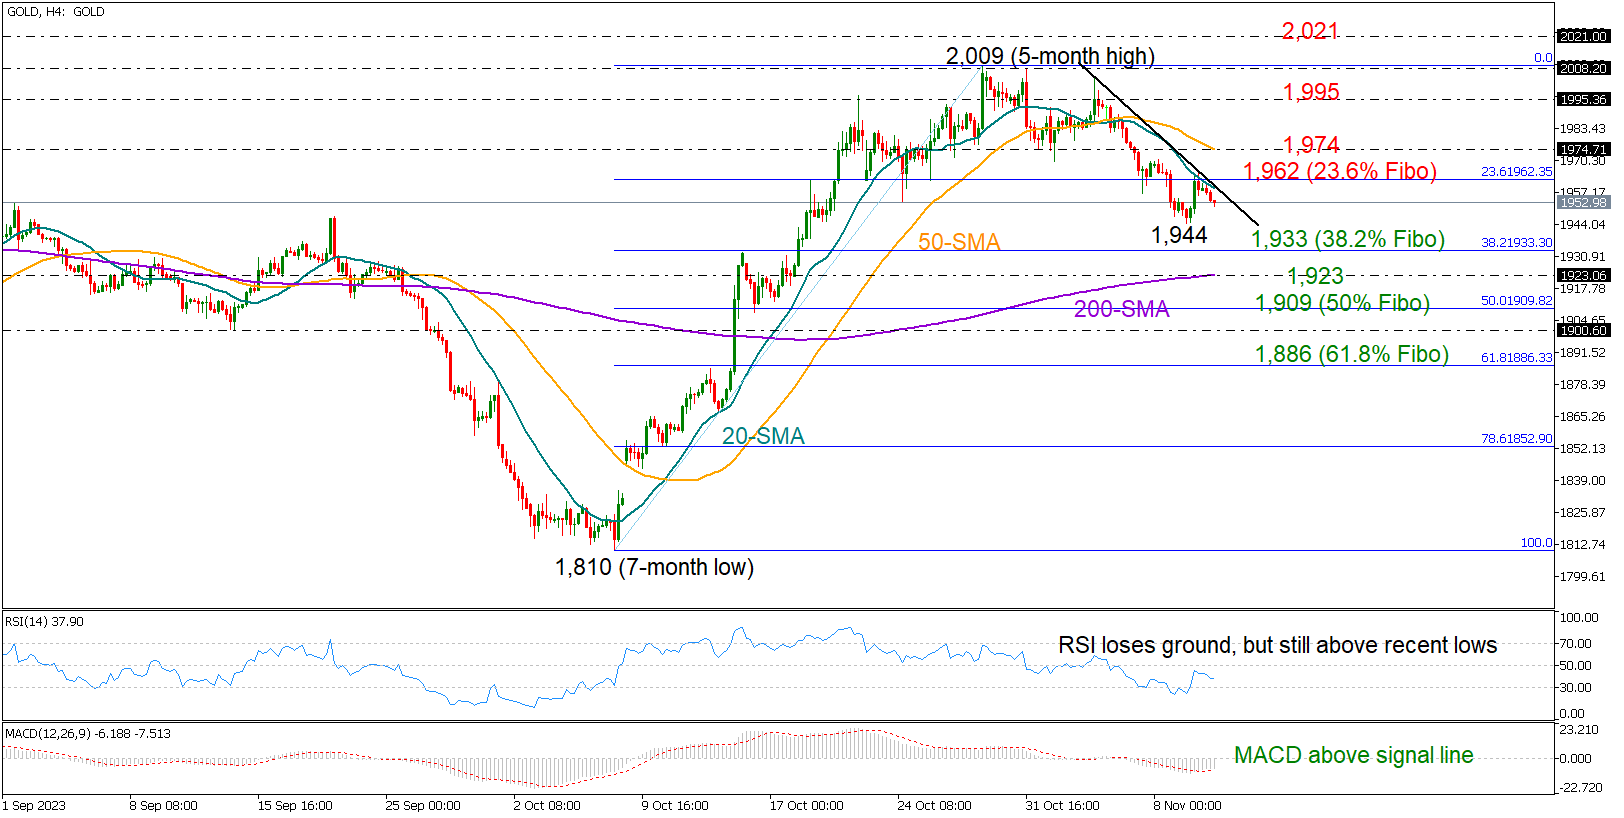
Gold rebounded from a three-week low of 1,944 on Thursday, but the recovery was immediately stopped by the 20-period SMA on the four-hour chart at 1,962. The 23.6% Fibonacci retracement of the previous uptrend cemented that ceiling, forcing the price to move lower.
The latest negative reversal in the RSI is discouraging, but the indicator is still in an upward move since bottoming out in the oversold region. Also, the MACD keeps recovering some distance above its red signal, suggesting that the bulls might have some fuel in the tank.
If resistance at 1,962 stands firm though, the precious metal could plummet again towards the 38.2% Fibonacci level of 1,933. The 200-period SMA might tackle selling pressures slightly lower at 1,923 and ahead of the 50% Fibonacci of 1,909. Then, if the bears breach the 1,900 psychological mark, the bearish wave might pick up pace towards the 61.8% Fibonacci of 1,886.
In the positive scenario, where gold jumps above its 20-period SMA, traders might pay attention to the 50-period SMA at 1,976. A bounce higher could take a breather around the 1,995 barrier. If the bulls successfully claim the latter, they might fight for an uptrend resumption above the wall of 2,009-2,020.
All in all, despite the negative mood in the market, the technical signals leave the door open to another upturn. A rebound above 1,962 could renew buying appetite. Otherwise, November's bearish wave could hit new lows.
GBPJPY Consolidates Near 2-Month Highs
- GBPJPY advanced to its highest since late August
- Trades sideways after failing to extend its breakout
- RSI and MACD are hovering in their positive regions
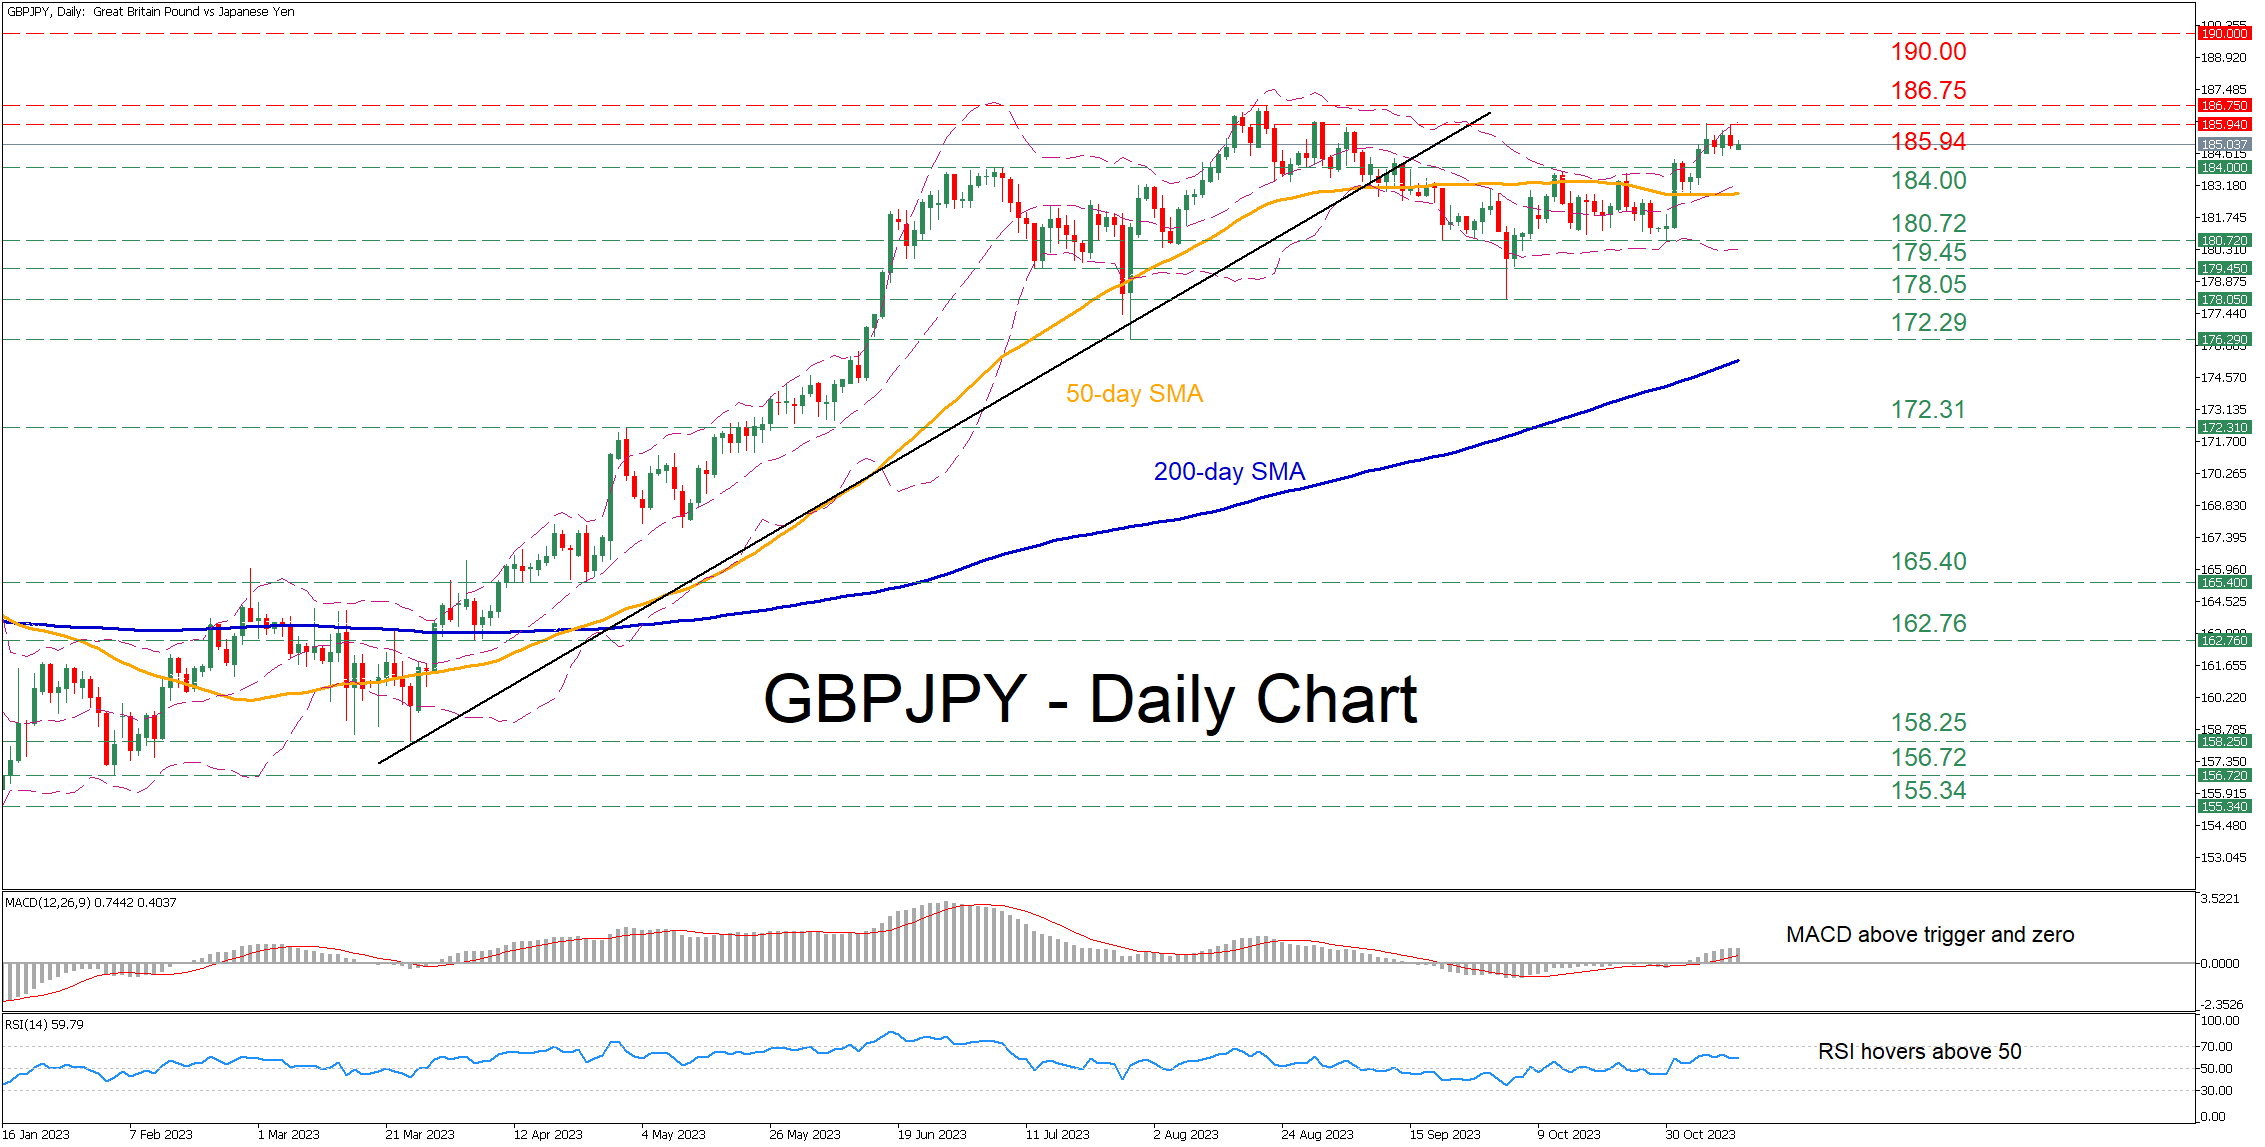
GBPJPY had been in a prolonged uptrend since January, posting an eight-year high of 186.75 on August 22 before experiencing a pullback. After a period of rangebound trading, the pair stormed back above the 50-day simple moving average (SMA) to a two-month peak of 185.94, but its rally seems to have temporarily paused.
Considering that the short-term oscillators remain tilted to the upside, the price could edge higher and revisit its recent two-month high of 185.94. Piercing through that wall, the pair may challenge the eight-year peak of 186.75. If that hurdle also fails, the bulls could propel the price to multi-year highs, where the 190.00 psychological mark might curb further advances.
On the flipside, should the pair reverse lower, immediate support could be found at 184.00, which acted as strong resistance both in July and October. A break below that region could trigger a retreat towards the September-October support zone of 180.72. In case of a downside violation, the bears may then attack the 179.45 hurdle, which held strong both in July and October.
In brief, GBPJPY retains a muted tone in the past few sessions despite its solid spike to the upside. Can the pair extend its advance or are we heading for a reversal?
USDCAD Tests 1.3800 Tricky Area
- USDCAD marks positive week, but slows pace near 1.3800
- Short-term bias skewed to the upside, but caution needed
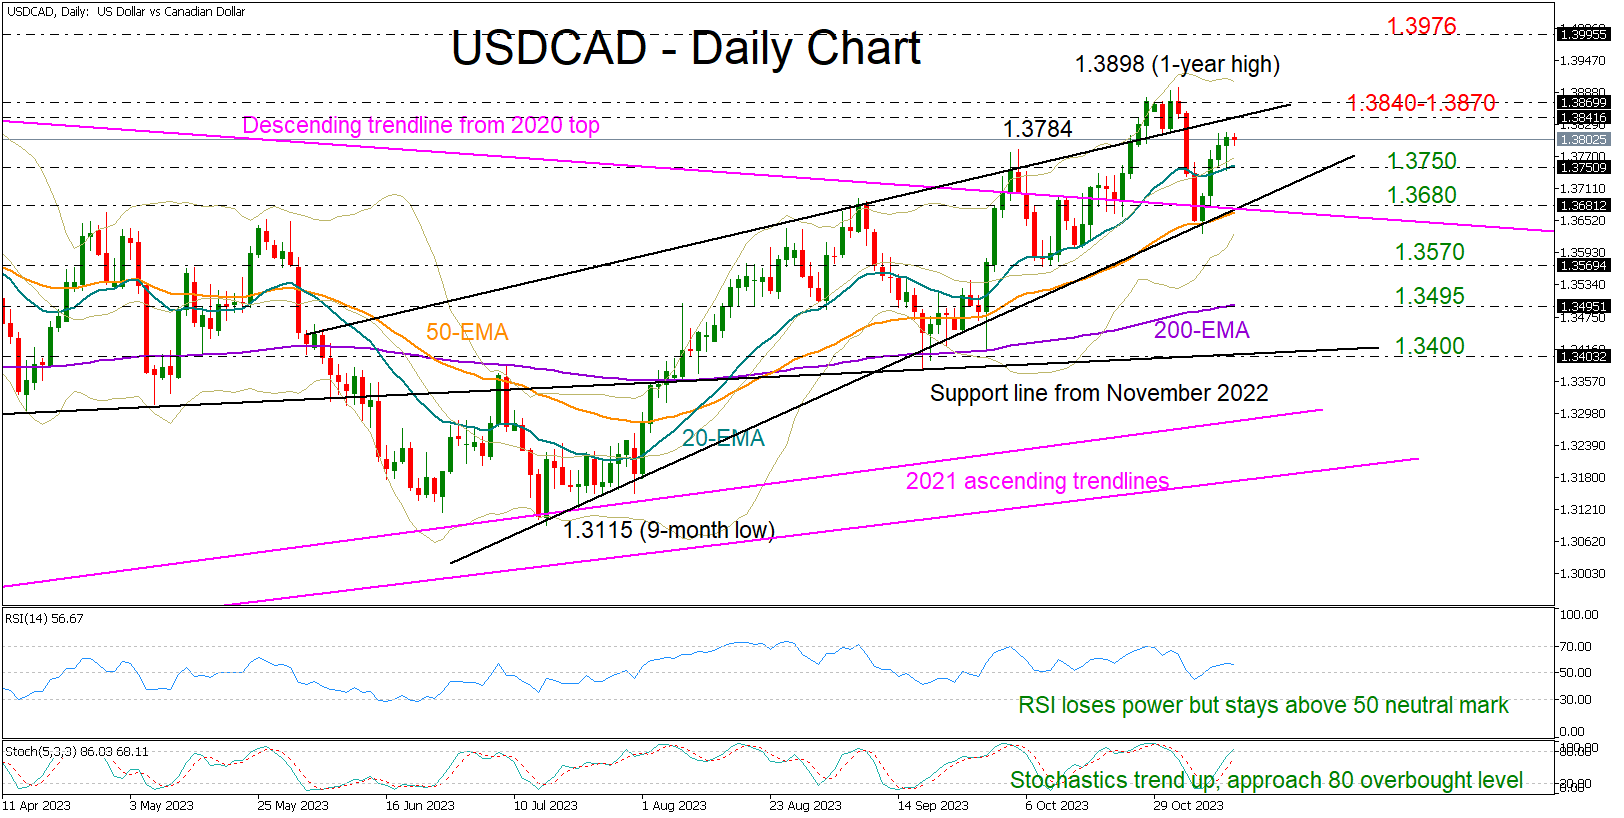
USDCAD has been in a bullish corrective mode during the week, retracing some of its losses from November’s one-year high of 1.3898.
Entering the 1.3800 area has been a struggle over the past two days, and there might be another tough obstacle within the 1.3840-1.3870 region, but the bulls may not give the battle yet, according to the technical indicators. Specifically, the RSI is still standing above its 50 neutral mark, despite losing some pace, and the stochastic oscillator has yet to confirm overbought conditions, both keeping the bias on the positive side for now.
In the event the pair re-activates its uptrend above November’s top of 1.3898, the next target will be the 2022 high of 1.3976 and the 1.4000 psychological mark. Even higher, the bulls might head for the 1.4100 number, which was a key resistance area during the first half of 2020.
On the downside, the 20-day exponential moving average (EMA) has been containing selling forces over the past two days. Hence, a step beneath that line at 1.3750 might produce fresh negative volatility, likely squeezing the price towards the 1.3680 trendline area. Another defeat there could add more fuel to the bearish wave, bringing the 1.3570 barrier immediately under the spotlight.
Overall, USDCAD is sustaining an upward trend above 1.3650-1.3670 in the four-month picture. To attract new buyers, the pair will need to pierce through the 1.3840-1.3860 bar.
ETH/USD Growing Rapidly on News from BlackRock
As it became known, BlackRock has filed an application with the SEC for an ETF based on spot Ethereum. Information about the iShares Ethereum Trust appeared on the Nasdaq website.
If such an expression is acceptable, the price of the second cryptocurrency has gone in pursuit of bitcoin, which is rewriting the highs of the year amid expectations associated with the approval of applications for ETFs for spot bitcoin — approval from the SEC already seems inevitable.
In just 10 hours after the news was published, the price of ETH/USD increased by more than 10%. The excitement is fueled by speculation that other Wall Street giants may file bids after BlackRock.
The ETH/USD chart shows that:
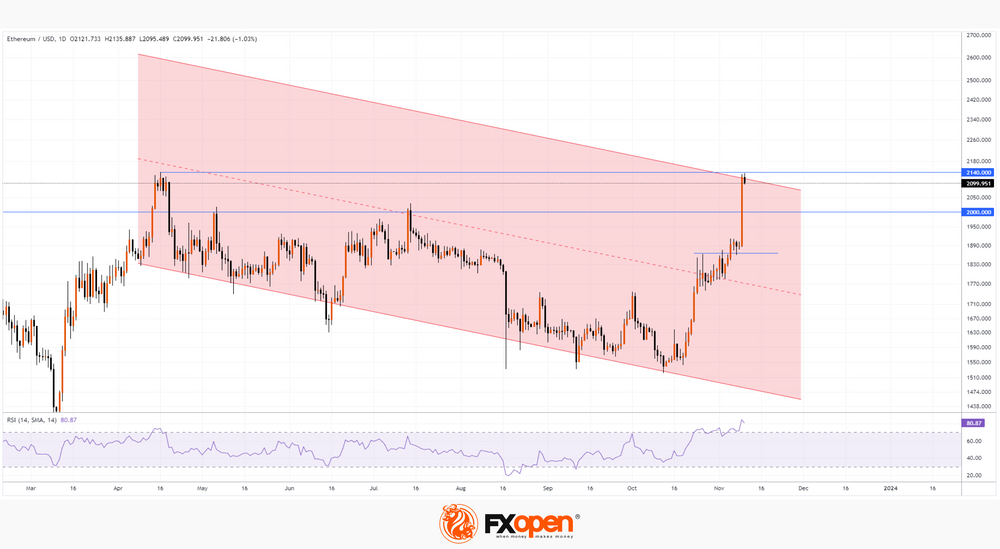
→ the price of Ethereum came close to the year’s high at 2140, set in April;
→ RSI indicates that the market is extremely overbought, which means it is vulnerable to a pullback.
The likelihood of a rollback is increased by the fact that the price of ETH/USD has slowed down its growth near the resistance block, which is formed by:
→ the upper limit of the parallel downward channel;
→ resistance from the high of the year.
It is possible that a pullback could occur after the formation of a double or triple top pattern on the hourly charts with a false breakout of the year's high, which would lure more buyers into the market, thereby making the correction more reasonable. Fundamentally though, the backdrop will remain strong as potential application approvals will make it possible for a wide range of investors to easily invest in Ethereum, increasing demand for this crypto asset.
This article represents the opinion of the Companies operating under the FXOpen brand only. It is not to be construed as an offer, solicitation, or recommendation with respect to products and services provided by the Companies operating under the FXOpen brand, nor is it to be considered financial advice.
US Russell 2000 Technical: Bearish Reaction at a Key Inflection Point
- Russell 2000’s week-to-date performance as of 9 November is the weakest among the US benchmark stock indices.
- The bearish reaction that wiped out almost 50% of last week’s gains has occurred right at a former key range support and 50-day moving average.
- Watch the 1,787 key short-term resistance.
The bearish force has started to unleash its paws again against the small-cap Russell 2000 Index where its current week-to-date loss is at -4.17% as of 10 November 2023, the worst underperformer among the US benchmark stock indices; S&P 500 (-0.25%), Nasdaq 100 (+0.59), and Dow Jones Industrial Average (-0.50%) over the same period.
Its latest key technical elements have turned bearish which indicates the start of another potential multi-week bearish impulsive sequence.
Bearish reaction from the former key range support
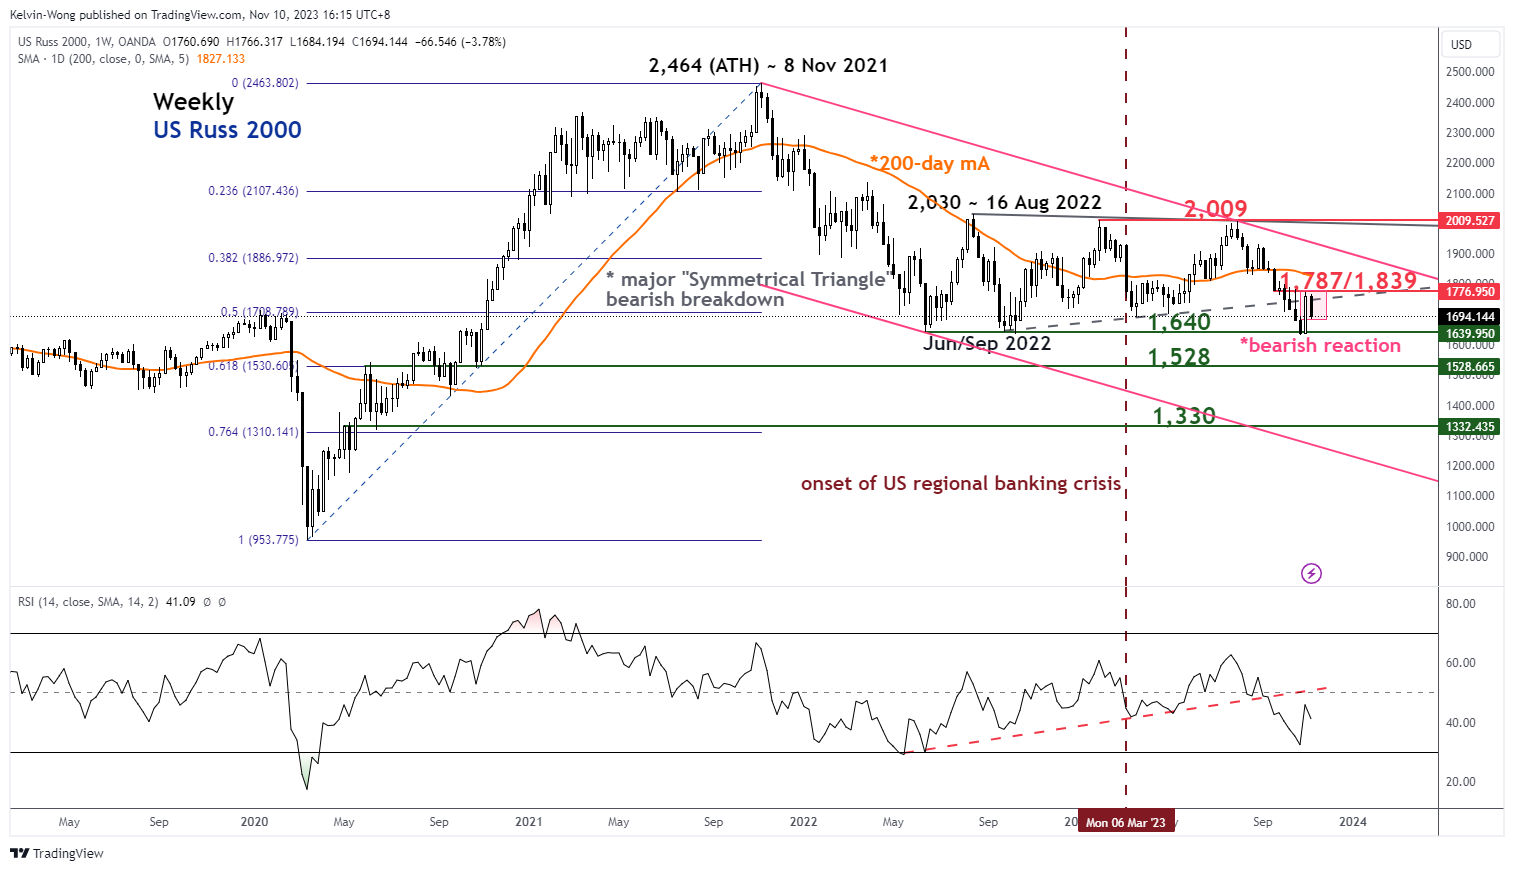
Fig 1: US Russ 2000 major trend as of 10 Nov 2023 (Source: TradingView, click to enlarge chart)
The current price actions of the US Russ 2000 Index (a proxy for the Russell 2000 futures) have almost wiped out 50% of last week’s gains induced by the dovish Fed Chair Powell’s ex-post FOMC press conference and the lacklustre US non-farm payrolls and ISM Services PMI data for October.
Interestingly, the current bout of bearish reaction has coincided with the former key “Symmetrical Triangle” range support from the June 2022 swing low now turns pull-back resistance at around 1,787.
Also, the weekly RSI momentum indicator has started to inch downward below the 50 level which indicates the potential revival of medium-term to major downside momentum.
Oscillating within a medium-term descending channel
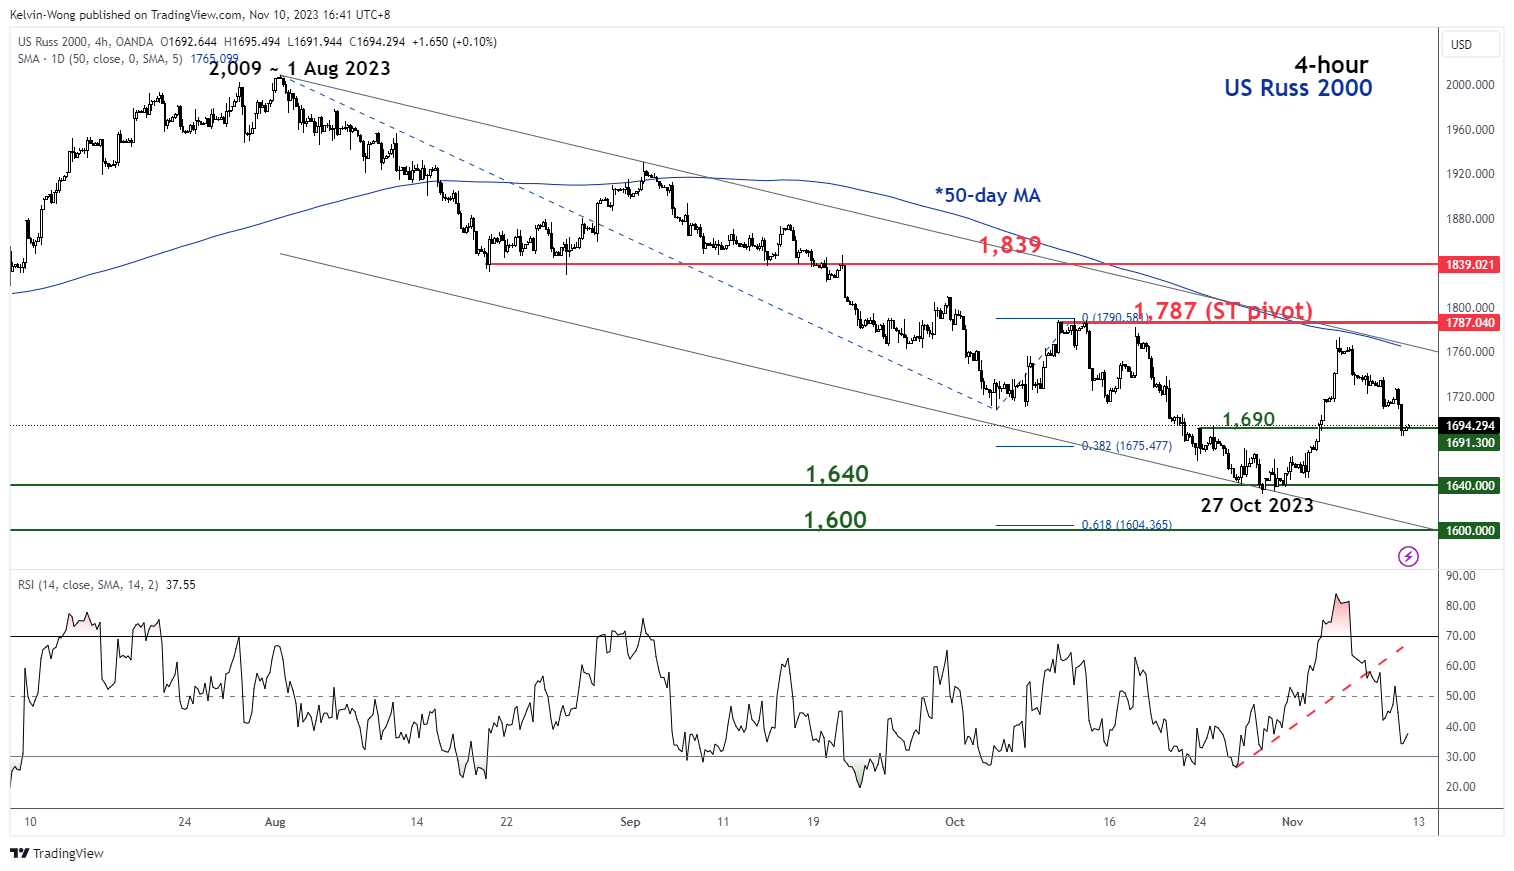
Fig 2: US Russ 2000 short-term trend as of 10 Nov 2023 (Source: TradingView, click to enlarge chart)
In the shorter time frame as seen on the 4-hour chart, the Index has continued to oscillate within a descending channel in place since 1 August 2023 where last week’s rally has been rejected right below the upper boundary of the descending channel and its downward sloping 50-day moving average.
All in all, these observations suggest that the odds are skewed towards the continuation of its short to medium-term downtrend phases of the Index rather than the start of a medium-term bullish reversal.
Watch the 1,787 key short-term pivotal resistance and a breakdown below its 1,690 near-term support may accelerate a further potential down move towards the next immediate supports at 1,640 and 1,600 (also the lower boundary of the descending channel & a Fibonacci extension level) in the first step.
On the other hand, a clearance above 1,787 negates the bearish tone for an extension of the corrective countertrend rebound to see the next intermediate resistance coming in at 1,839 (also the key 200-day moving average).
GBP/JPY Daily Outlook
Daily Pivots: (S1) 184.59; (P) 185.25; (R1) 185.64; More...
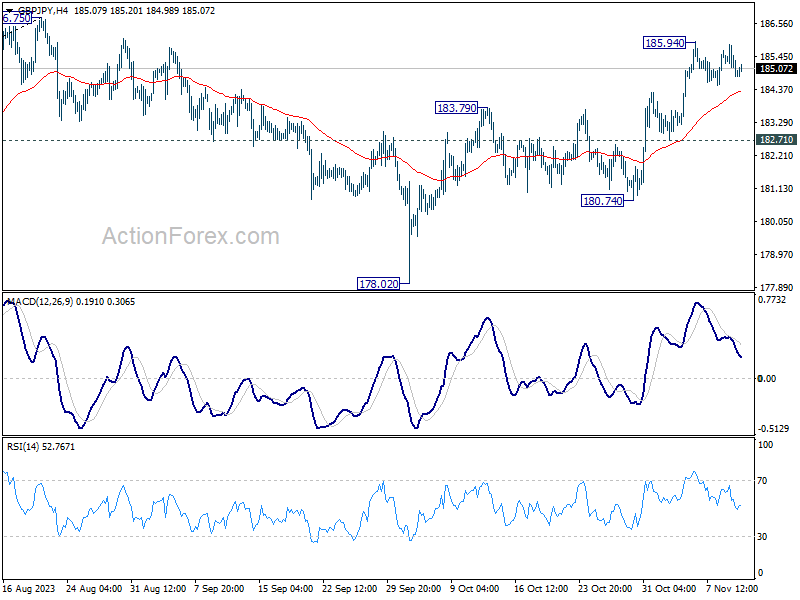
Intraday bias in GBP/JPY remains neutral as consolidation form 185.94 temporary top is extending. In case of deeper retreat, downside should be contained above 182.71 support. On the upside, above 0.8594 will resume the rebound from 178.02 to retest 186.76 resistance first. Decisive break there will resume larger up trend.
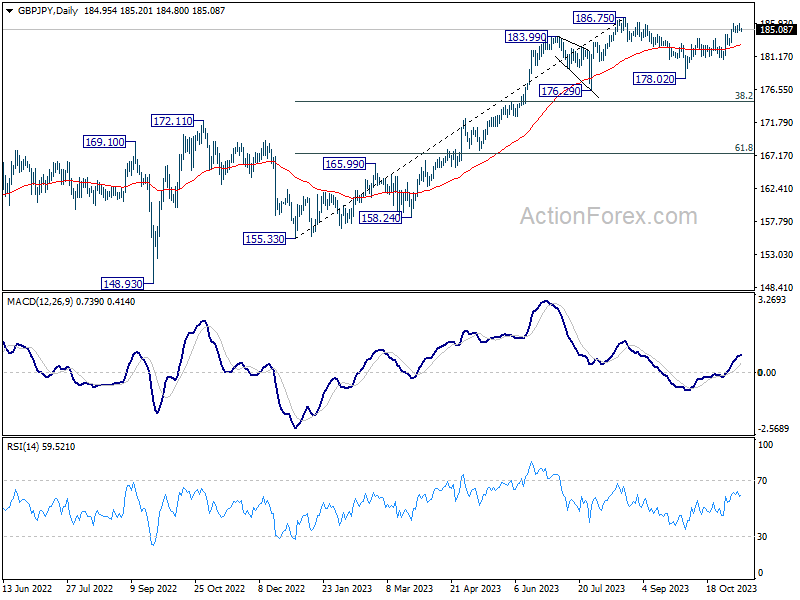
In the bigger picture, as long as 176.29 support holds, larger up trend from 123.94 (202 low) should still be in progress. Break of 186.75 will target 195.86 (2015 high). Nevertheless, firm break of 176.29 will confirm medium term topping, and bring lengthier and deeper consolidations.
EUR/JPY Daily Outlook
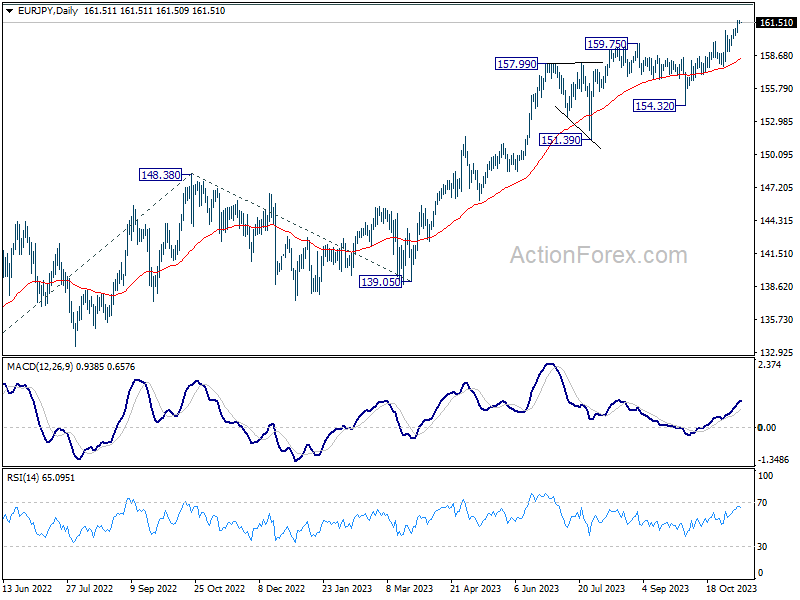
Daily Pivots: (S1) 161.29; (P) 161.55; (R1) 161.72; More....
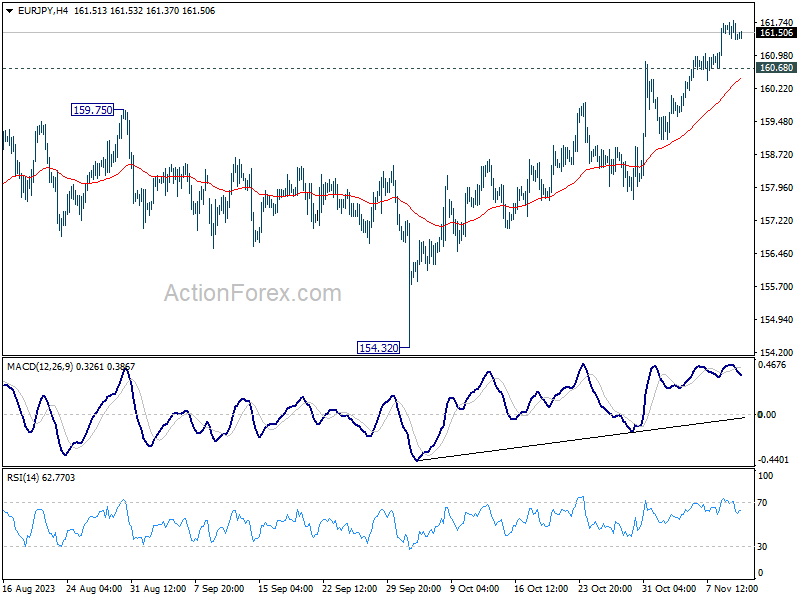
Despite some loss of momentum as seen in 4H MACD, intraday bias in EUR/JPY stays on the upside. Current rally should target 163.06 projection level next. But strong resistance could be seen there to limit upside on first attempt. On the downside, below 160.68 minor support will turn intraday bias neutral and bring consolidations first, before staging another rise.
In the bigger picture, rise from 114.42 (2020 low) is in progress. Next target is 100% projection of 124.37 to 148.38 from 139.05 at 163.06. On the downside, break of 154.32 support is needed to be the first sign of medium term topping. Otherwise, outlook will remain bullish even in case of deep pullback.
EUR/GBP Daily Outlook
Daily Pivots: (S1) 0.8704; (P) 0.8717; (R1) 0.8741; More....
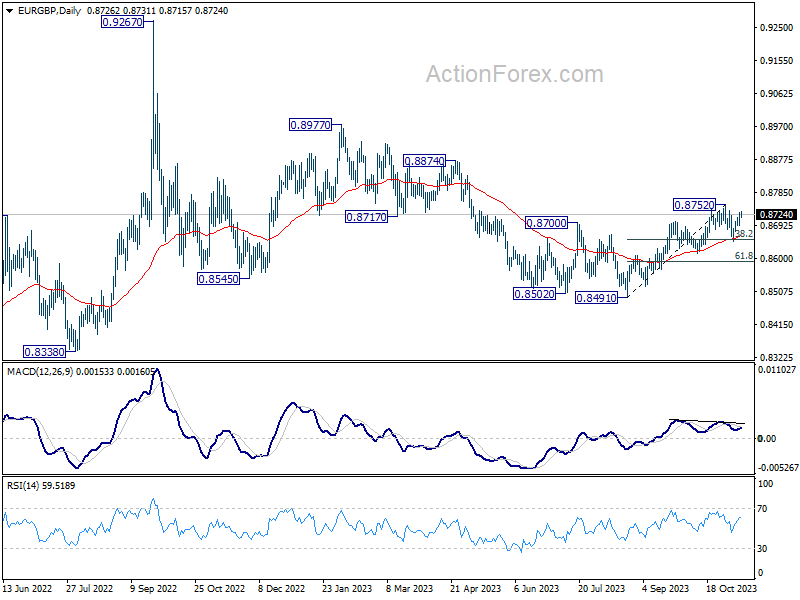
Intraday bias in EUR/GBP stays neutral at this point. Consolidation from 0.8752 could extend with another falling leg. But in that case, downside should be contained by 0.8614 support to bring rebound. Meanwhile, decisive break of 0.8752 will resume larger rally from 0.8491 towards 0.8874 resistance next.
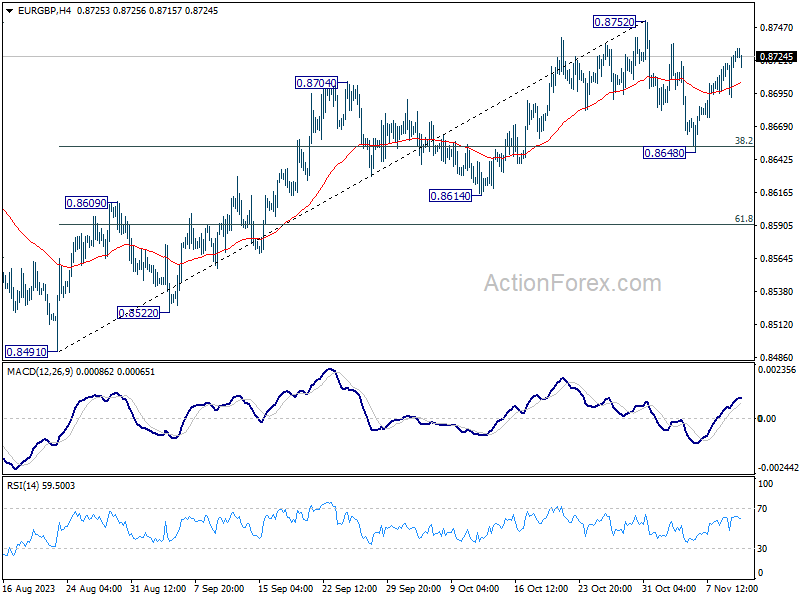
In the bigger picture, current development suggests that whole down trend from 0.9267 (2022 high) has completed with three down to to 0.8491. Rise from 0.8491 is seen as another leg inside that pattern from 0.9499 (2020 high). Further rally should be seen to 0.8977 resistance and above. This will remain the favored case as long as 0.8614 support holds.