

Sample Category Title
EUR/AUD Daily Outlook
Daily Pivots: (S1) 1.6698; (P) 1.6728; (R1) 1.6787; More...
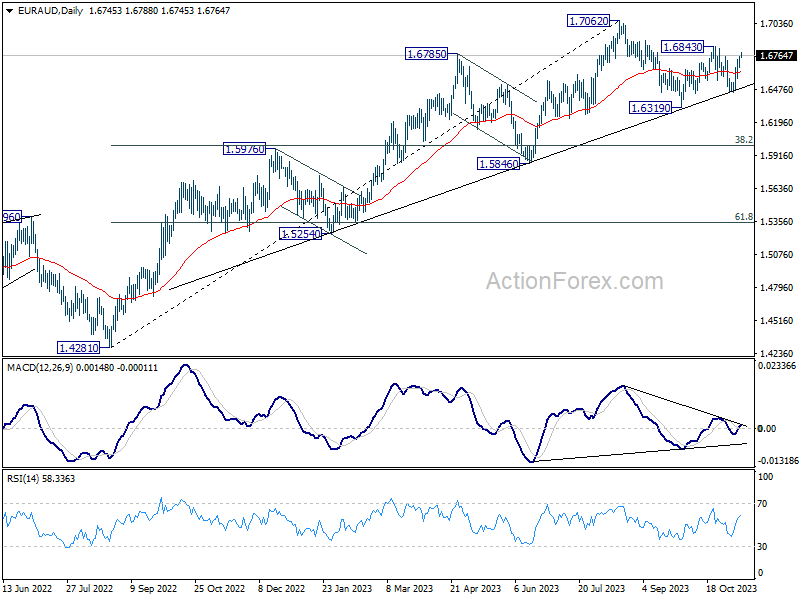
Intraday bias in EUR/AUD remains neutral, with mixed near term outlook. On the upside, break of 1.6449 will confirm strong rebound from medium term trend line again, and bring further rally to retest 1.7062 high. On the downside, however, break of 1.6449 will bring deeper fall to 1.6319 support instead.
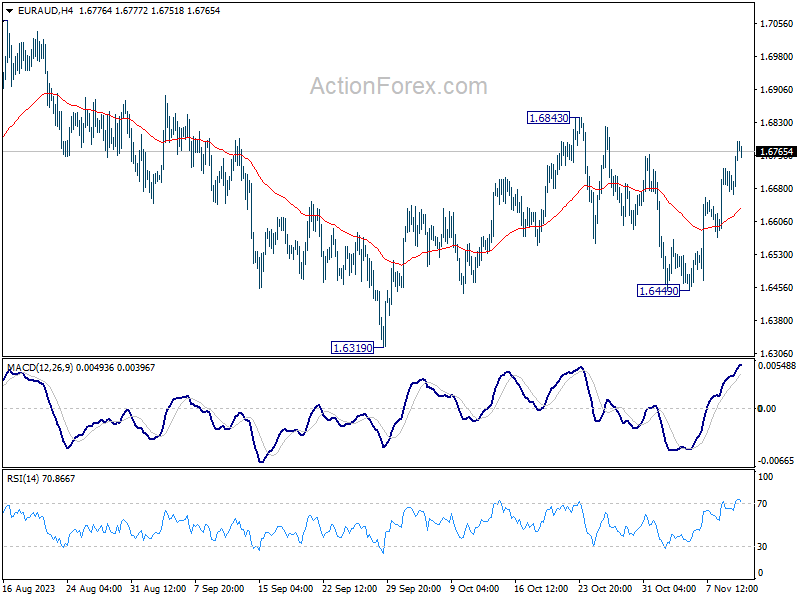
In the bigger picture, current development suggests that 1.7062 is already a medium term top. Fall from there is seen as a correction to the up trend from 1.4281 (2022 low). While deeper decline might be seen, strong support should emerge from 38.2% retracement of 1.4281 to 1.7062 at 1.6000 to contain downside. On the other hand, break of 1.6843 resistance will revive medium term bullishness that larger up trend is still in progress.
EUR/CHF Daily Outlook
Daily Pivots: (S1) 0.9618; (P) 0.9634; (R1) 0.9648; More...
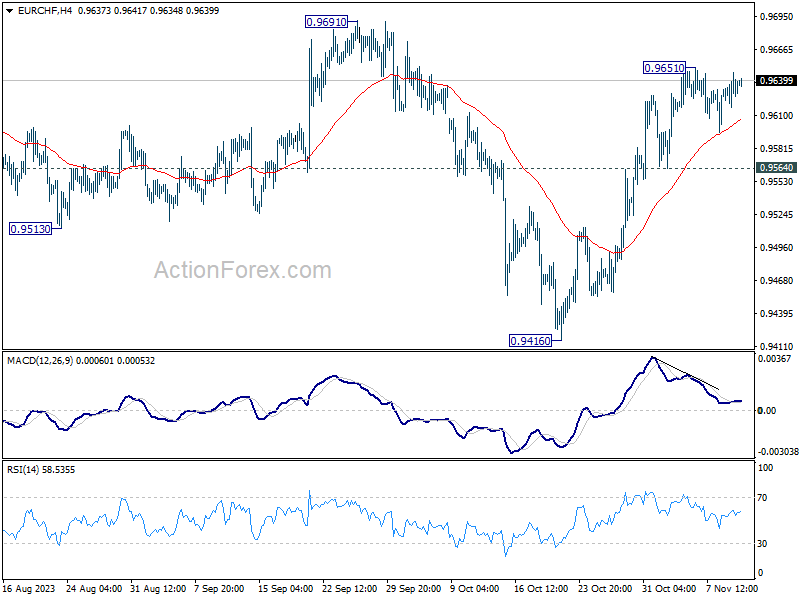
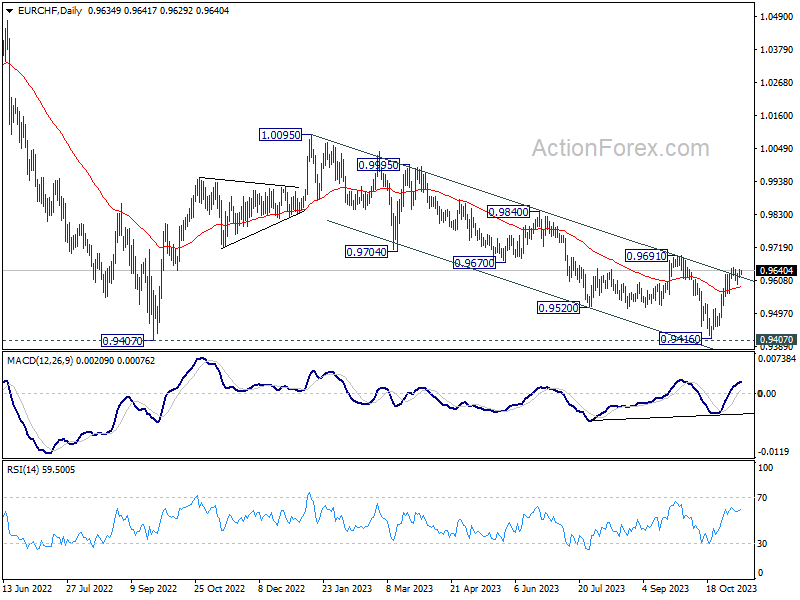
EUR/CHF is still extending the consolidation from 0.9651 and intraday bias stays neutral. Further rally is in favor as long as 0.9564 minor support holds. Above 0.9651 will resume the rebound from 0.9416 to 0.9691 resistance first. Firm break there will argue that whole decline from 1.0095 has completed at 0.9416, just ahead of 0.9407 support (2022 low). Nevertheless, break of 0.9564 will turn bias back to the downside for deeper fall.
In the bigger picture, as long as 1.0095 resistance holds, price actions from 0.9407 are viewed as a three-wave consolidation pattern first. Current rise from 0.9416 might be the third leg. That is, larger down trend from 1.2004 (2018 high) might still resume through 0.9407 at a later stage. However, decisive break of 1.0095 will argue that the long term down trend is reversing.
EUR/USD Daily Outlook
Daily Pivots: (S1) 1.0644; (P) 1.0685; (R1) 1.0709; More...
Intraday bias in EUR/USD stays neutral with focus on 55 4H EMA (now at 1.0657). Further rise is in favor as long as this EMA holds. Decisive break of 1.0764 cluster resistance (38.2% retracement of 1.1274 to 1.0447 at 1.0763) will extend the rise from 1.0447 to 61.8% retracement at 1.0958 next. However, sustained break of 55 4H EMA will argue that the rebound has completed, and target 1.0515 support, and then 1.0447 low.
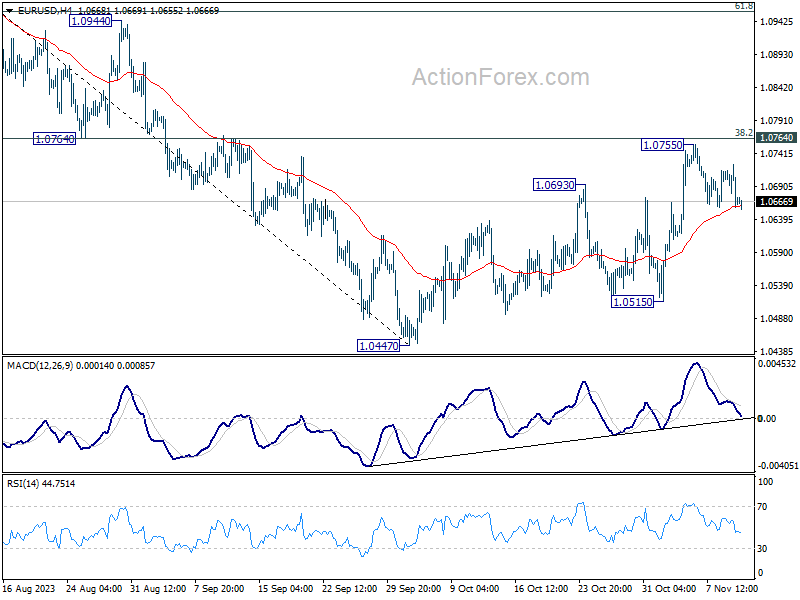
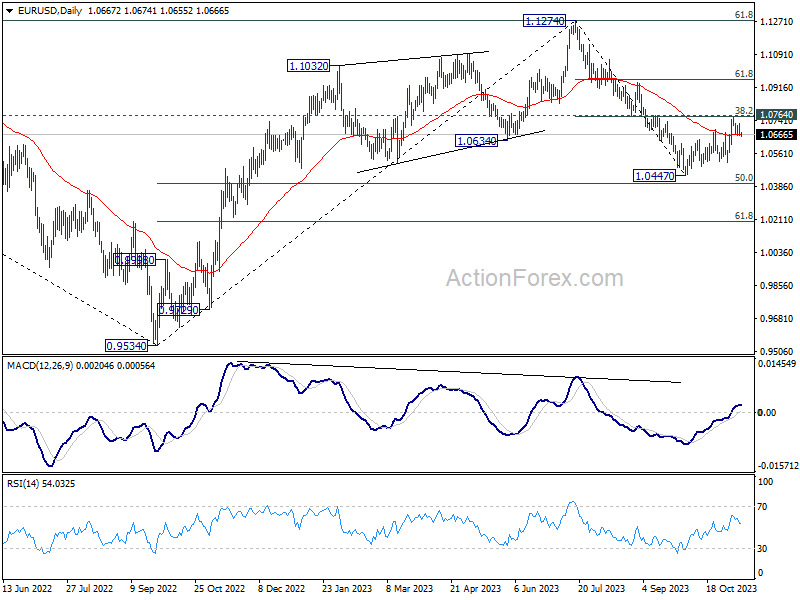
In the bigger picture, price actions from 1.1274 are viewed as a corrective pattern to rise from 0.9534 (2022 low). Rise from 1.0447 is tentatively seen as the second leg. Hence while further rally could be seen, upside should be limited by 1.1274 to bring the third leg of the pattern.
GBP/USD Daily Outlook
Daily Pivots: (S1) 1.2187; (P) 1.2248; (R1) 1.2283; More
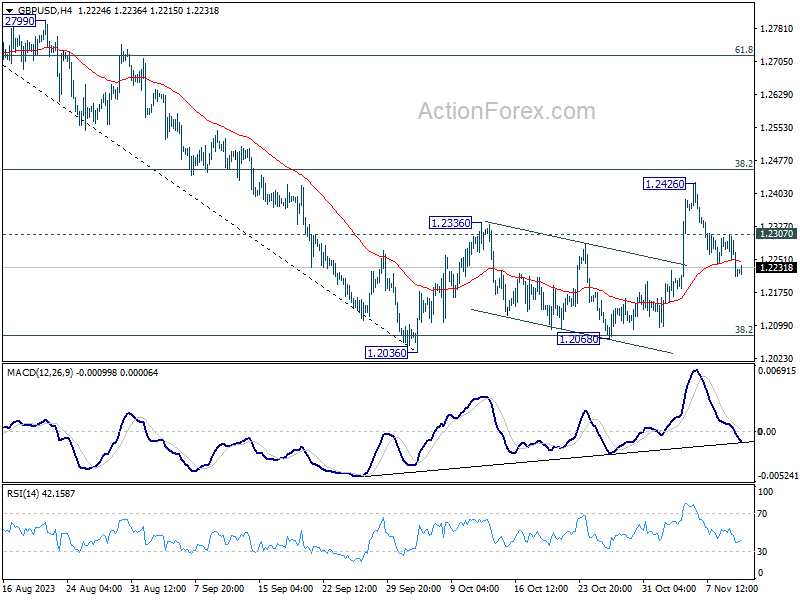
GBP/USD's break of 55 4H EMA (now at 1.2246) argues that corrective recovery from 1.2036 has completed with three waves up to 1.2426. That came after rejection by 38.2% retracement of 1.3141 to 1.2036 at 1.2458. Intraday bias is back on the downside for retesting 1.2036/68 support zone. Nevertheless, break of 1.2307 minor resistance will dampen this bearish case, and turn intraday bias neutral first.
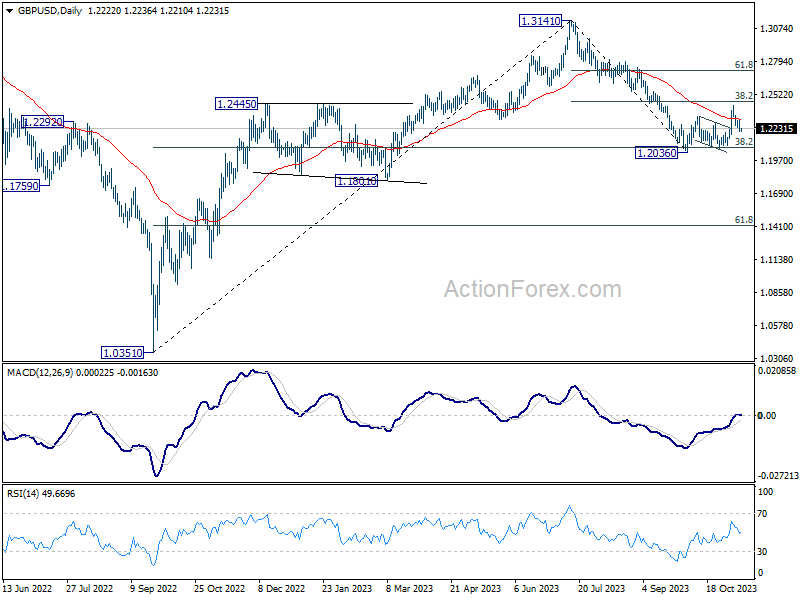
In the bigger picture, price actions from 1.3141 medium term top are seen as a correction to up trend from 1.3051 (2022 low). Strong rebound from 38.2% retracement of 1.0351 to 1.3141 at 1.2075 will argue that it's a sideway pattern only. However, sustained break of 1.2036 will indicate that it's a deeper correction that would target 61.8% at 1.1417 before completion.
USD/CHF Daily Outlook
Daily Pivots: (S1) 0.8992; (P) 0.9017; (R1) 0.9053; More....
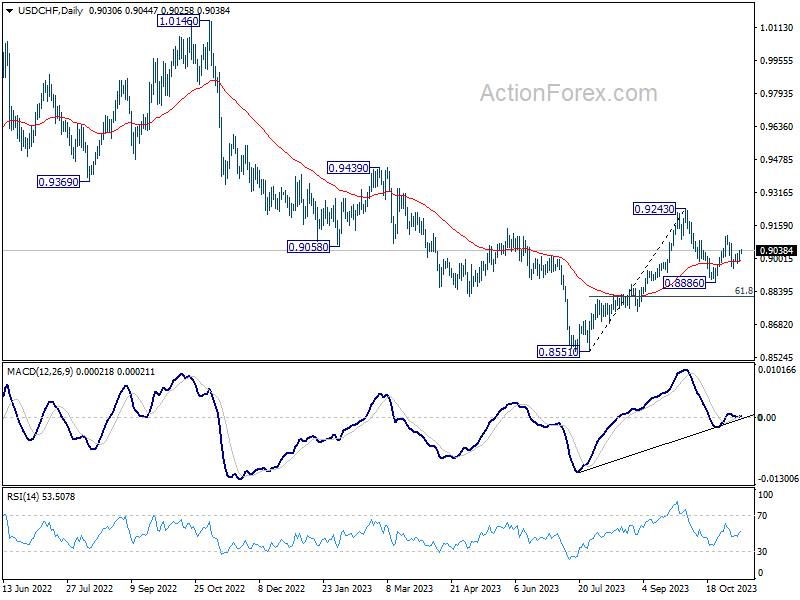
Intraday bias in USD/CHF remains neutral for the moment, as it's still bounded in range of 0.8952/9111. On the downside, below 0.8952 will target a test on 0.8886 support first. Break there will resume whole decline from 0.9243 to 0.8815 fibonacci level. However, break of 0.9111 will resume the rebound from 0.8886 instead, and target 0.9243 resistance.
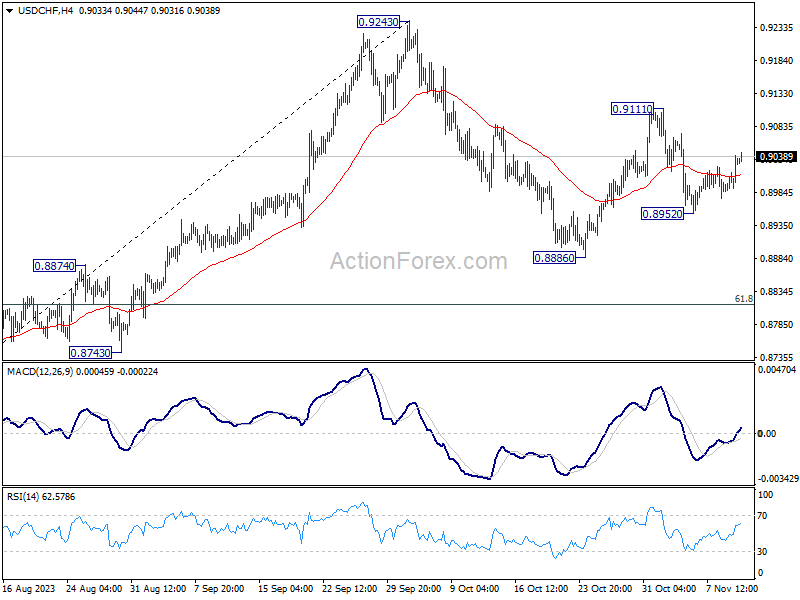
In the bigger picture, outlook is mixed up by the deeper than expected pull back from 0.9243. Yet there was no follow through selling after hitting 0.8886. On the upside, break of 0.9243 resistance will revive the case of medium term bottoming at 0.8851, and turn outlook bullish. However, sustained break of 61.8% retracement of 0.8551 to 0.9243 at 0.8815 will argue that larger decline from 1.0146 is ready to resume through 0.8551 low.
USD/JPY Daily Outlook
Daily Pivots: (S1) 150.94; (P) 151.17; (R1) 151.56; More...
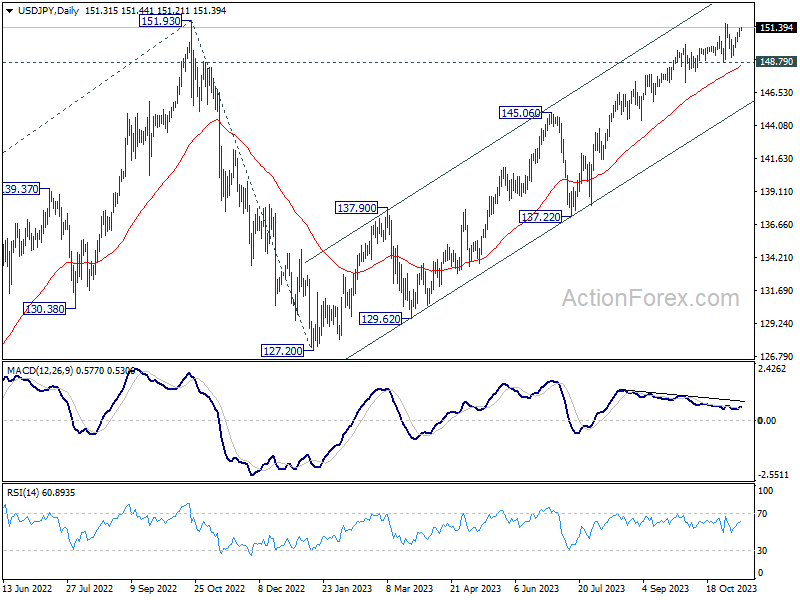
USD/JPY is still bounded in consolidation from 151.69 and intraday bias remains neutral first. Another falling leg could be seen but further rally is expected as long as 148.79 support holds. Firm break of 151.69 high will resume larger up trend. However, decisive break of 148.79 will indicate rejection by 151.93 key resistance, and bring deeper fall through 147.28 support.
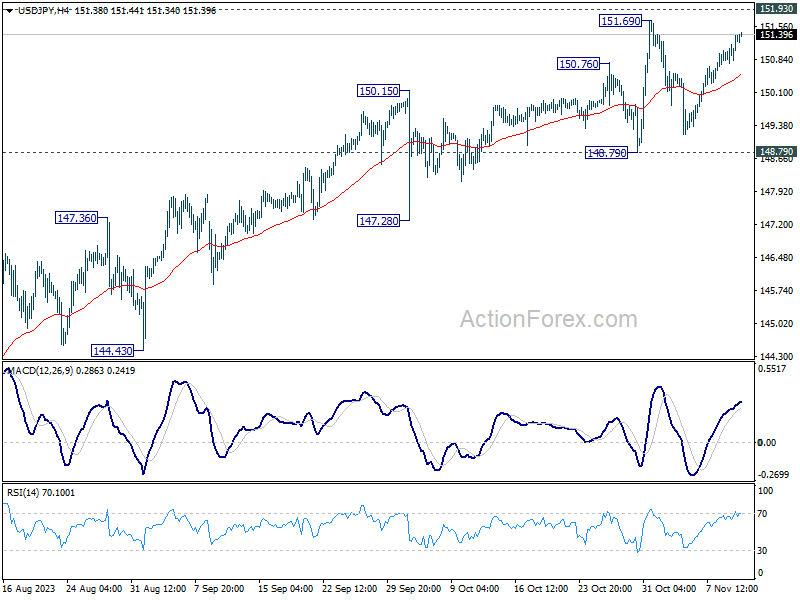
In the bigger picture, immediate focus is on 151.93 resistance (2022 high). Rejection by 151.93, followed by sustained break of 145.06 resistance turned support will argue that rise from 127.20 has completed, and turn outlook bearish for 137.22 support and below. However, sustained break of 151.93 will confirm resumption of long term up trend. Next target will be 61.8% projection of 102.58 to 151.93 from 127.20 at 157.69.
USD/CAD Daily Outlook
Daily Pivots: (S1) 1.3763; (P) 1.3790; (R1) 1.3833; More...
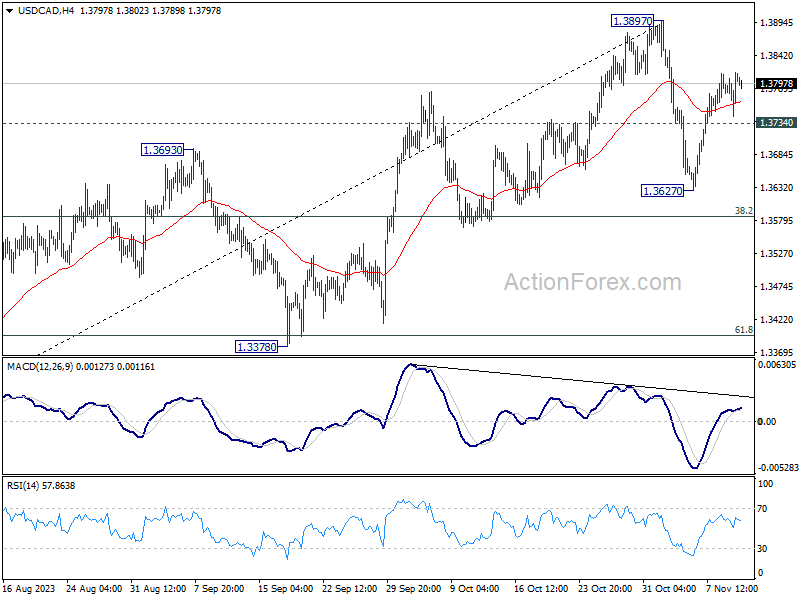
Intraday bias in USD/CAD stays mildly on the upside, as rebound from 1.3627 is in progress. Further rally should be seen to retest 1.397 resistance. On the downside, below 1.3734 minor support will turn bias back to the downside, to extend the corrective pattern from 1.3897 with another leg. But in this case, strong support should be seen from 38.2% retracement of 1.3091 to 1.3897 at 1.3589 to bring rebound.
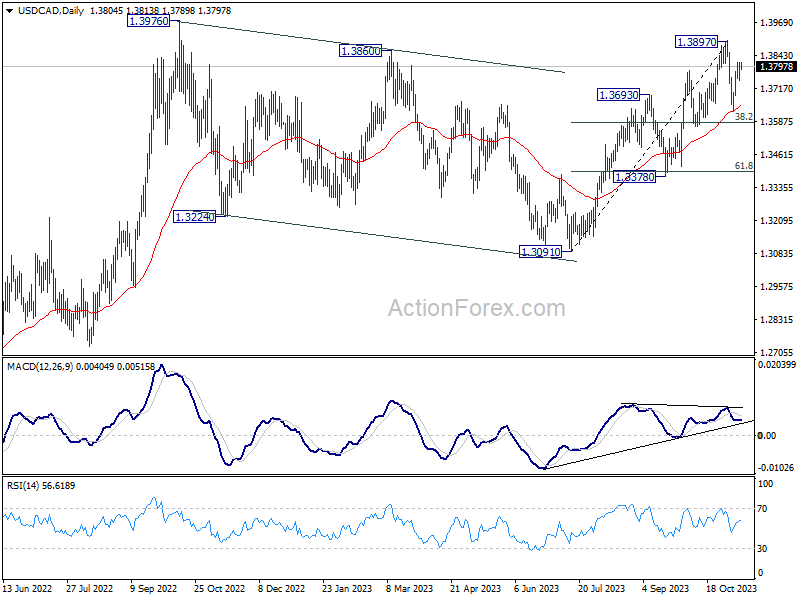
In the bigger picture, corrective pattern from 1.3976 (2022 high) should have completed with three waves down to 1.3091. Decisive break of 1.3976 high will confirm resumption of up trend from 1.2005 (2021 low). This will now remain the favored case as long as 1.3378 support holds. However, firm break of 1.3378 will argue that the pattern from 1.3976 is indeed still extending.
Gold Price Corrects Gains and Crude Oil Price Tumbles
Gold price is correcting gains below the $1,980 support. Crude oil prices declined heavily below the $80.00 support and moved into a bearish zone.
Important Takeaways for Gold and Oil Prices Analysis Today
- Gold price failed to settle above the $2,000 region and moved lower against the US Dollar.
- It broke a major bearish trend line with resistance near $1,958 on the hourly chart of gold at FXOpen.
- Crude oil prices dived toward the $75 zone before the bulls appeared.
- A key bearish trend line is forming with resistance near $76.90 on the hourly chart of XTI/USD at FXOpen.
Gold Price Technical Analysis
On the hourly chart of Gold at FXOpen, the price struggled to settle above the $2,000 resistance. The price started a fresh decline below the $1,980 pivot level.
The price traded below the $1,965 support and the 50-hour simple moving average. It tested the $1,945 zone. A low is formed near $1,944.71 and the price is now attempting a fresh increase. It broke a major bearish trend line with resistance near $1,958.
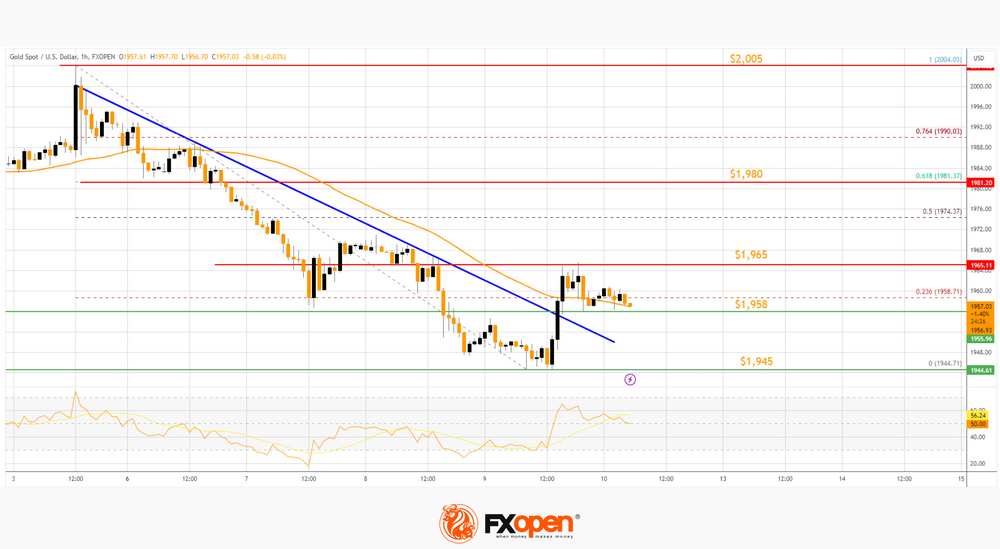
There was also a spike above the 23.6% Fib retracement level of the downward move from the $2,005 swing high to the $1,945 low. It is now facing resistance near the $1,965 level.
The next major resistance is near the 61.8% Fib retracement level of the downward move from the $2,005 swing high to the $1,945 low at $1,980, above which the price could test the $2,005 resistance.
The next major resistance is $2,020. An upside break above the $2,020 resistance could send Gold price toward $2,032. Any more gains may perhaps set the pace for an increase toward the $2,050 level.
Initial support on the downside is near the $1,958 level. The first major support is near the $1,945 level. If there is a downside break below the $1,945 support, the price might decline further. In the stated case, the price might drop toward the $1,920 support.
Oil Price Technical Analysis
On the hourly chart of WTI Crude Oil at FXOpen, the price struggled to continue higher above $83.30 against the US Dollar. The price formed a short-term top and started a fresh decline below $80.00.
There was a steady decline below the $78.00 pivot level. The bears even pushed the price below $77.00 and the 50-hour simple moving average. Finally, the price tested the $75.00 zone. A low is formed near $74.90 and the price is now consolidating losses.
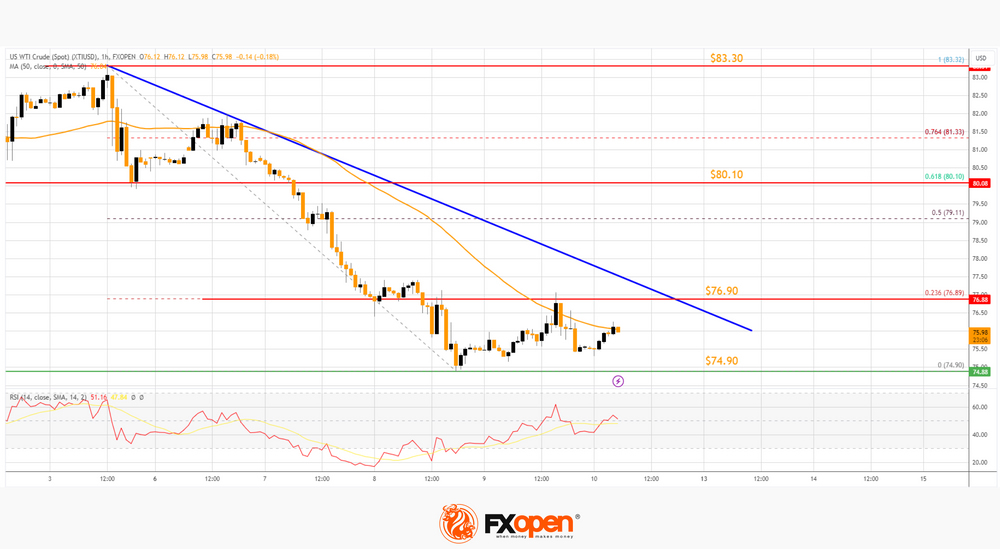
It is stuck near the 50-hour simple moving average. Immediate support is near the $74.90 level. The next major support on the WTI crude oil chart is near $74.20. If there is a downside break, the price might decline toward $72.50. Any more losses may perhaps open the doors for a move toward the $70.00 support zone.
On the upside, immediate resistance is near a key bearish trend line at $76.90. The trend line is near the 23.6% Fib retracement level of the downward move from the $83.32 swing high to the $74.90 low.
A clear move above the trend line resistance could send the price toward $80.10. It coincides with the 61.8% Fib retracement level of the downward move from the $83.32 swing high to the $74.90 low.
The next key resistance is near $83.30. If the price climbs further higher, it could face resistance near $85.00. Any more gains might send the price toward the $88.00 level.
This article represents the opinion of the Companies operating under the FXOpen brand only. It is not to be construed as an offer, solicitation, or recommendation with respect to products and services provided by the Companies operating under the FXOpen brand, nor is it to be considered financial advice.
Fed Chair Stressed Progress Toward 2.0% Inflation Goal Not Assured
Markets
After further bond gains post the softer than expected US data last week, sentiment changed course yesterday. Several ECB speakers including Vice President de Guindos warned that it’s premature to open the debate on rate cuts as inflation risks linger. Core yields at several maturities testing key support levels also made a further decline (in yields) less evident. However, moves mostly remained gradual during European trading hours. The German 2-y yield even declined 0.9 bps. The 10-y gained 3.0 bps. The 30-y underperformed (+7.0 bps). Later in US dealings, the $24 bln 30-y US Treasury auction went much more difficult compared to the 3 & 10-y sales earlier this week. A substantial yield concession put additional pressure especially at the longer end of the curve. Fed Chair Powell later at the IMF’s annual research conference also held some kind of ‘leaning against the wind’ attitude. He reiterated that the Fed can move carefully to both ‘address the risk of being misled by a few good months and the risk of overtightening’. Despite this two-sided risk, the Fed Chair stressed that progress toward to 2.0% goal is not assured and that the Fed won’t hesitate to tighten policy further if this would turn out to be appropriate. On broader financial conditions, Powell indicated that the Fed takes higher long-term yields into account, but it depends on how long the market move lasts. After Powell’s comments short-term yields also jumped higher but in the end the curve still bear steepened with the 2-y adding 8.9 bps while the 30-y jumped 15 bps. The 2-y yield again closed just north of 5%. The rise in US yields both due to the poor 30-y auction and Powell’s comments also pushed equities back in red (Dow -0.65%, Nasdaq -0.94%). The EuroStoxx 50 earlier closed with a nice +1.21%, regaining the 4200 mark. The dollar extended its comeback (DXY 105.91, EUR/USD 1.067), but the technical picture after all remains neutral. USD/JPY (close 151.35) again nears the multi-year peak levels (YTD top 151.72/2022 top 151.95).
Asian equity markets this morning join the setback on WS yesterday evening. Treasury yields are easing marginally. The dollar trades little changed (EUR/USD 1.067, DXY 105.9). Later today, November Consumer confidence of the University of Michigan will be published. Markets will keep a close look at the inflation expectations measures of the report. Also look out for an interview of ECB’s Lagarde with Martin Wolf for the FT. We expect the ECB Chair to reiterate that it is much too early to call victory on inflation. EMU yields probably still have some catching up to do after yesterday’s rise in the US. The first estimate of the UK Q3 GDP this morning was reported unchanged (0.0% Q/Q), slightly better than expected (-0.1%). However, the details were unconvincing with private consumption, government spending and gross fixed capital formation all declining on a quarterly basis. On the other hand, September activity data (especially services) where not that bad. In a first reaction, sterling gains marginally (EUR/GBP 0.8725).
News & Views
The Reserve Bank of Australia published its quarterly Statement on Monetary Policy following this week’s meeting when it lifted the policy rate by 25 bps to 4.35%. Detailed forecasts show a somewhat stronger growth path (1.25% for year-ended Dec23 from 1% and 2% for year-ended Dec24 from 1.75%) in combination with a more stubborn return of inflation towards the 2-3% inflation target (3% for year-ended Dec25 from 2.75%). Unemployment is expected to peak at 4.25% in Dec24 and stay there over the policy horizon. Back in July, the RBA estimated a 4.5% peak with unemployment ticking up faster. AUD/USD just like on Tuesday fails to profit from the slightly more hawkish RBA with AUD/USD holding around 0.6370.
Portuguese president Marcelo Rebelo de Sousa set March 10 as next (snap) general election date following this week’s resignation by Socialist PM Costa in the aftermath of a corruption investigation. Costa’s chief of staff Vitor Escaria and infrastructure minister Joao Galamba are central in the probe with PM Costa suspected of interventions to unblock procedures. Ruling Socialists won a resounding victory early last year and were significantly ahead in the polls ahead of the developing scandal.
US Yields Spike, Equities Fall, Oil Rebounds
Bad. Yesterday’s 30-year treasury auction in the US was bad. And this time, the bad auction got the anticipated reaction. The US Treasuries saw a sharp selloff - especially in the 20 and 30-year papers. The US 30-year yield jumped 22bp, the 20-year yield jumped more than 20bp, while the 10-year yield jumped 18bp to above 4.60%.
Then, the Federal Reserve (Fed) Chair Jerome Powell’s speech at an IMF event was hawkish. Powell repeated that the FOMC will move ‘carefully’ and that the Fed won’t hesitate to raise the interest rates again, if needed. The US 2-year yield is back above the 5% level.
Of course, the sudden jump in US yields hit appetite in US stocks yesterday. The S&P500 fell 0.80%, and Nasdaq fell 0.82%. The US bond auction brought along a lot of volatility, questions, and uncertainty.
At 5%, the US 2-year yield is still 50bp below the upper limit of the Fed funds target range. Therefore, if the Fed could convince investors that the rates will stay high for long, this part of the curve has potential to shift higher. On the longer end, we could reasonably expect the US 10-year yield to remain below the 5% mark – and even ease gently if economic growth slows and the job market loosens. A wider inversion between the US 2-10-year yield should boost the odds a higher of US recession. But hey, we are used to the inverted yield curve, and we believe that it won’t necessarily bring along recession. Goldman sees only a 15% chance of US recession next year.
In the FX
The US dollar jumped to its 50-DMA as a response to a rapid surge in the US Treasury yields. The EURUSD sank below the 1.07 level. From a technical perspective, the early week rally remained capped below a major Fibonacci level, the 38.2% retracement on summer to October selloff near the 1.0760. The EURUSD remains in a bearish trend after the failure to clear an important technical resistance. Unideal political news from Spain and Portugal, and a morose economic outlook for the Eurozone will likely keep the euro in retreat against the US dollar. Even though the European Central Bank (ECB) officials cry out loud that the rates will stay high for long in the Eurozone as well, it sounds much less credible when economic data doesn’t give sufficient support.
In the UK, the Bank of England (BoE) wants to look tough and convince investors that it’s too early to talk about rate cuts. But Cable’s latest surge remained capped below the 200-DMA, and the pair is back to 1.22. The medium-term outlook for Cable remains neutral to bearish. Another surge in the dollar appetite will easily send the pair to 1.20 psychological level.
The dollar-yen is back to misery, above 151. Traders want to buy the USDJPY, but they also know that the Japanese authorities are tempted to intervene to prevent the Japanese yen from getting shattered just because the Bank of Japan (BoJ) can’t keep up with the rest of the major global central bank policies. Japanese are happy to see inflation emerge after decades of deflation. Perhaps, the view of China – and Chinese deflation – doesn’t make them want to move any faster.
In energy, the oil bulls come in timidly near the $75pb psychological support. The oil selloff probably went too far and it’s time for – at least – a minor positive correction. A move toward the $78/80 range would be reasonable. This area includes the 200-DMA and the minor 23.6% Fibonacci retracement on September to November selloff.
Today is Friday. Fears of escalating geopolitical tensions could help strengthen the $75 support in US crude. But regarding that topic, the biggest fear of oil traders in Gaza was the implication of Iran in the war, which would then lead to another embargo on the Iranian oil, decrease the global supply and send prices higher. Now, the new market narrative is that, even if the Iranian oil gets banned, it doesn’t matter because first, the Iranian shipments have been falling due to weaker Asian demand and two, 90% of the Iranian shipments go to China anyway, and China doesn’t care about the Iranian oil ban, they will continue buying it. And oh, there is also the fact that the US shale production hit a record high of 13.2mbpd. Together with the rising worries of slower global demand, the above-stated factors should ensure that a potential rebound in oil prices doesn’t extend easily above the $78/80 range.