

Sample Category Title
EUR/CHF Daily Outlook
Daily Pivots: (S1) 0.9582; (P) 0.9607; (R1) 0.9647; More...
Intraday bias in EUR/CHF remains neutral first and further rise is in favor. Break of 0.9627 will resume the rebound from 0.9416 to 0.9691 key structural resistance. Firm break there will carry larger bullish implication. On the downside, below 0.9555 will turn bias to the downside for deeper pullback.
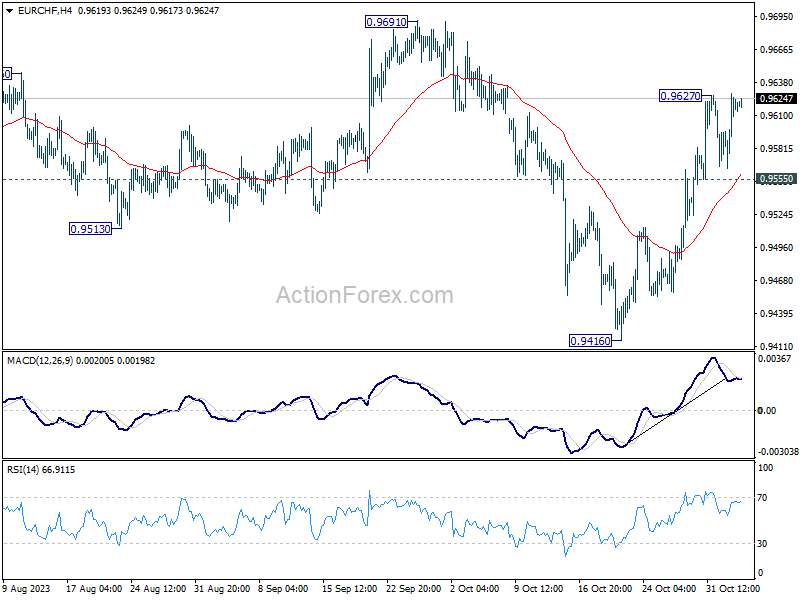
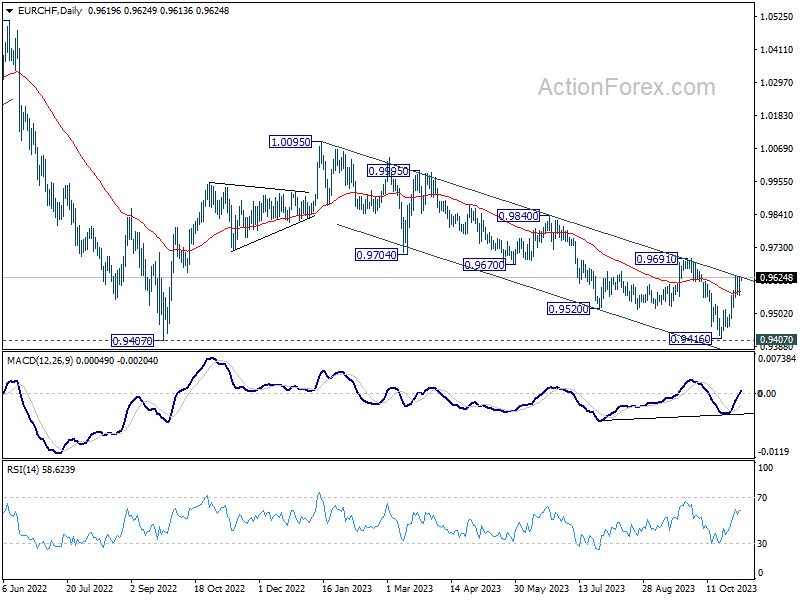
In the bigger picture, down trend from 1.2004 (2018 high) is still in progress. Decisive break of 0.9407 will confirm resumption, and target 61.8% projection of 1.1149 to 0.9407 from 1.0095 at 0.9018. On the upside, break of 0.9691, however, will indicate medium term bottoming just ahead of 0.9407. Further rally could then be seen back towards 1.0095 resistance.
AUD/USD and NZD/USD Show Signs of Life
AUD/USD is moving higher and might climb above 0.6450. NZD/USD is also rising and could extend its increase above the 0.5915 resistance zone.
Important Takeaways for AUD USD and NZD USD Analysis Today
- The Aussie Dollar started a fresh increase above the 0.6350 and 0.6400 levels against the US Dollar.
- There is a connecting bullish trend line forming with support near 0.6425 on the hourly chart of AUD/USD at FXOpen.
- NZD/USD is gaining bullish momentum above the 0.5870 support.
- There is a short-term contracting triangle forming with support near 0.5885 on the hourly chart of NZD/USD at FXOpen.
AUD/USD Technical Analysis
On the hourly chart of AUD/USD at FXOpen, the pair started a fresh increase from the 0.6320 support. The Aussie Dollar was able to clear the 0.6350 resistance to move into a positive zone against the US Dollar.
There was a close above the 0.6400 resistance and the 50-hour simple moving average. Finally, the pair tested the 0.6455 zone. A high is formed near 0.6456 and the pair is now consolidating gains.
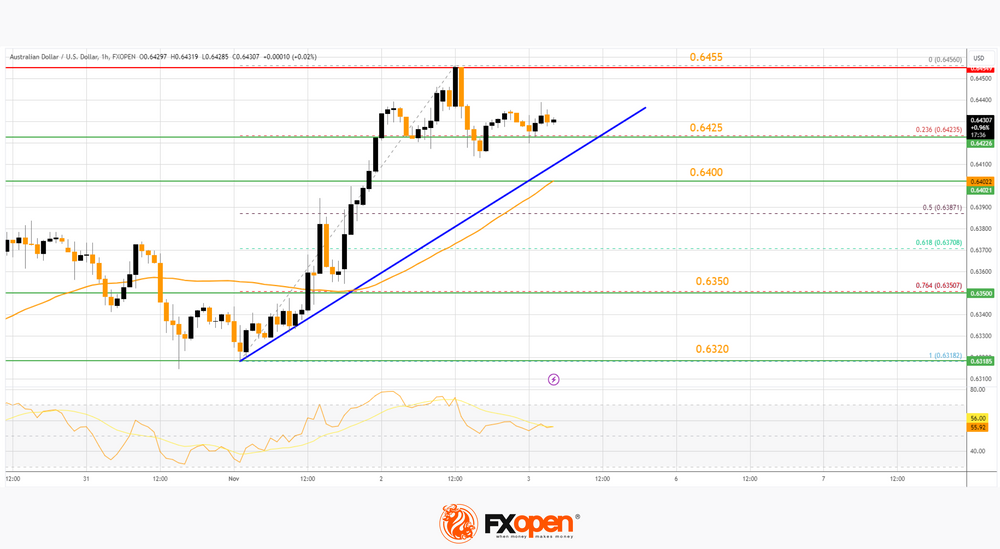
On the downside, initial support is near the 23.6% Fib retracement level of the upward move from the 0.6318 swing low to the 0.6456 high at 0.6425. There is also a connecting bullish trend line forming with support near the same zone.
The next support could be the 50-hour simple moving average at 0.6400. If there is a downside break below the 0.6400 support, the pair could extend its decline toward the 76.4% Fib retracement level of the upward move from the 0.6318 swing low to the 0.6456 high at 0.6350.
Any more losses might signal a move toward 0.6320. On the upside, the AUD/USD chart indicates that the pair is now facing resistance near 0.6455.
The first major resistance might be 0.6480. An upside break above the 0.6480 resistance might send the pair further higher. The next major resistance is near the 0.6550 level. Any more gains could clear the path for a move toward the 0.6620 resistance zone.
NZD/USD Technical Analysis
On the hourly chart of NZD/USD on FXOpen, the pair started a steady increase from the 0.5790 level. The New Zealand Dollar broke the 0.5820 resistance to start the recent increase against the US Dollar.
The pair settled above 0.5850 and the 50-hour simple moving average. It tested the 0.5915 zone and is currently consolidating gains above the 23.6% Fib retracement level of the upward wave from the 0.5788 swing low to the 0.5916 high.
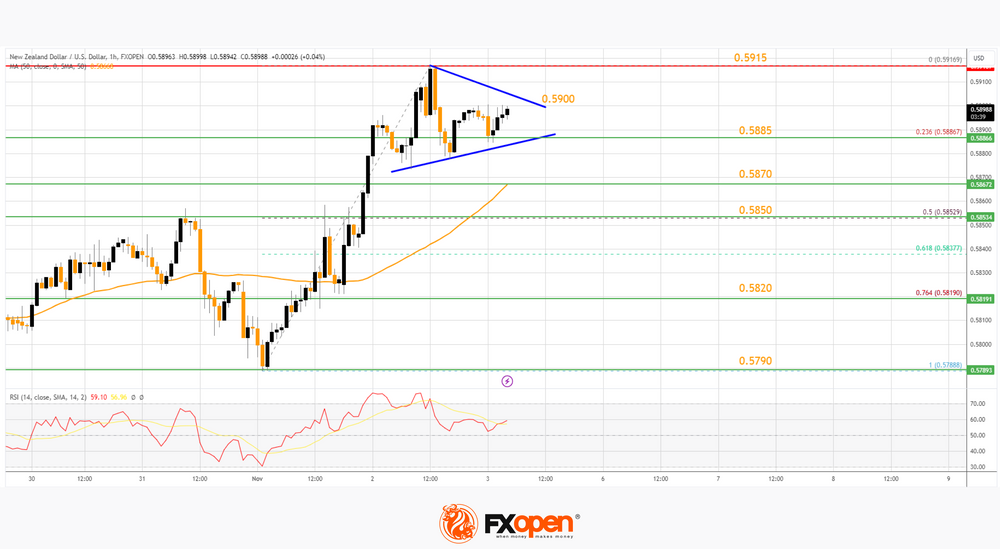
The NZD/USD chart suggests that the RSI is still above 50 and signaling more upsides. On the upside, the pair might struggle near 0.5900. The next major resistance is near the 0.5915 level.
A clear move above the 0.5915 level might even push the pair toward the 0.5950 level. Any more gains might clear the path for a move toward the 0.6000 resistance zone in the coming days.
On the downside, there is major support forming near a short-term contracting triangle at 0.5885. The next major support is near the 50-hour simple moving average at 0.5870, below which the pair might test the 50% Fib retracement level of the upward wave from the 0.5788 swing low to the 0.5916 high at 0.5850.
If there is a downside break below the 0.5850 support, the pair might slide toward the 0.5820 support. Any more losses could lead NZD/USD in a bearish zone to 0.5790.
This article represents the opinion of the Companies operating under the FXOpen brand only. It is not to be construed as an offer, solicitation, or recommendation with respect to products and services provided by the Companies operating under the FXOpen brand, nor is it to be considered financial advice.
DAX Doing 3 Wave Corrective Bounce From The Lows
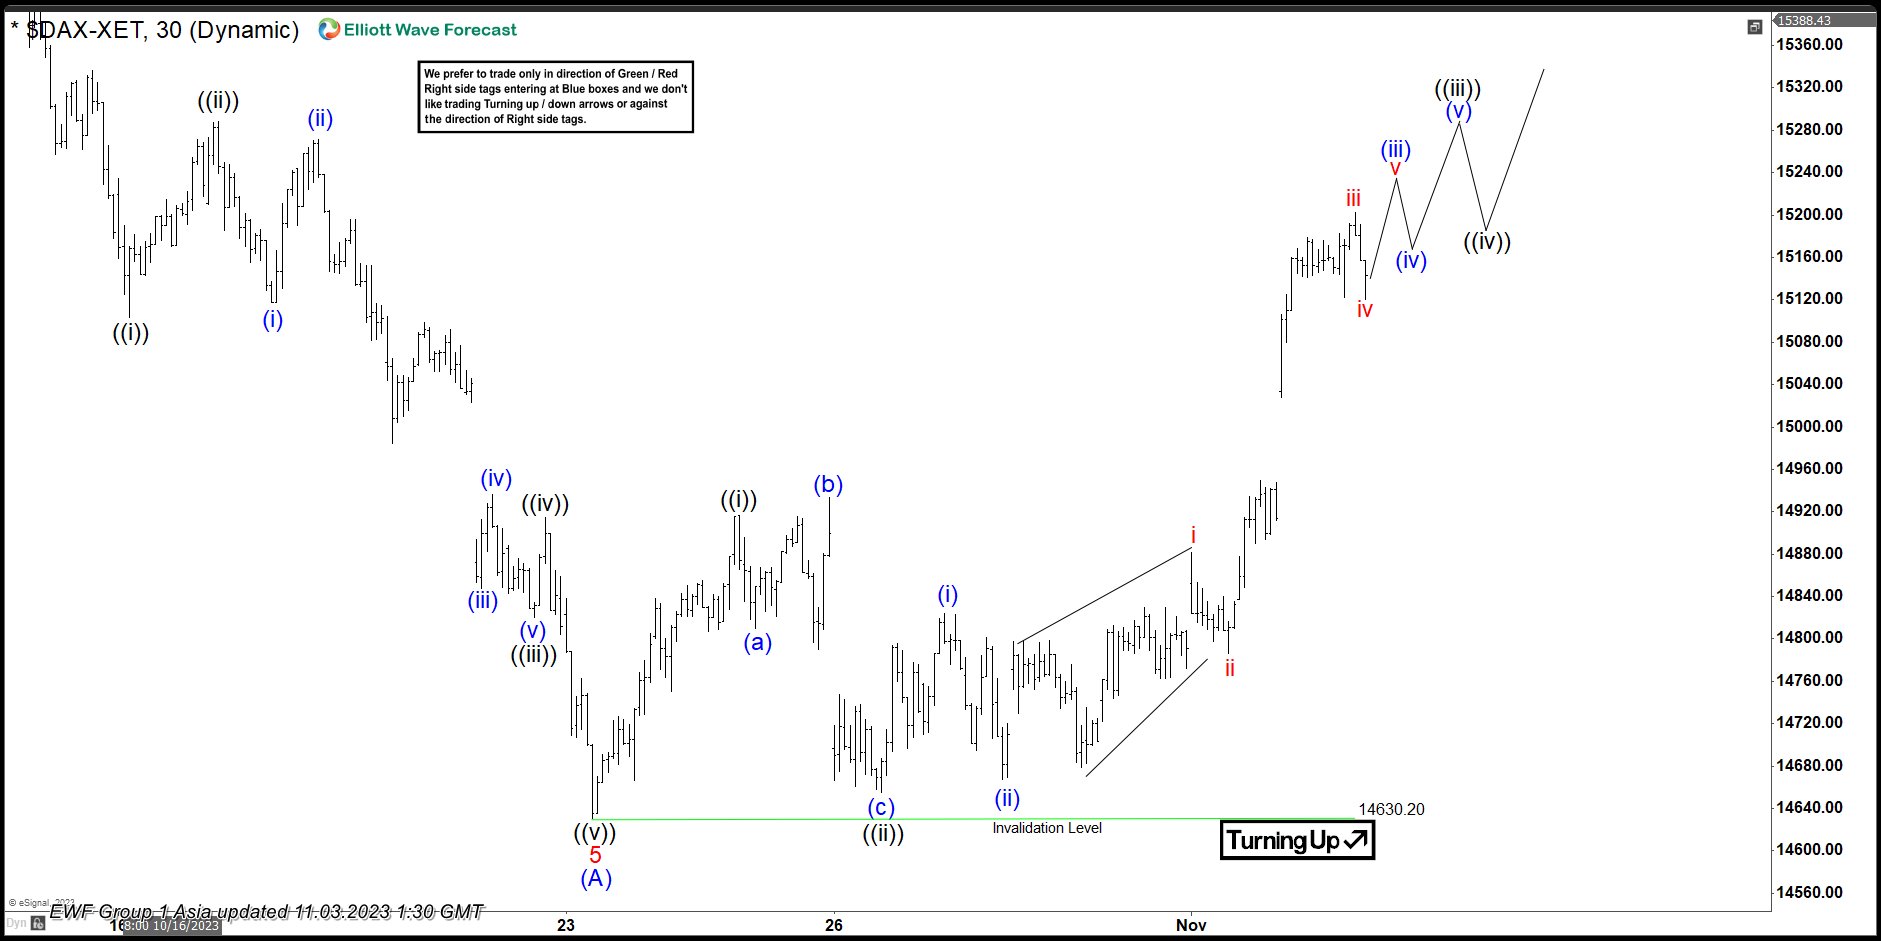
The short-term Elliott wave view in the DAX suggests that the index has ended the cycle from the 31 July 2023 peak as a leading diagonal structure in a higher degree corrective sequence. Whereas the decline to 15468 low ended wave 1, wave 2 ended at 16042 high. Wave 3 ended at 14948 low & wave 4 ended at 15575 high. Down from there, wave 5 unfolded in a lesser degree 5 waves structure where wave ((i)) ended at 15103 low. Wave ((ii)) ended at 15288 high, wave ((iii)) ended at 14820 low, wave ((iv)) ended at 14914 high and wave ((v)) ended at 14630 low. Thus ended wave 5 of (A) as a leading diagonal structure.
Up from there, the index is doing a 3-wave corrective bounce within the wave (B) bounce as an Elliott wave zigzag correction. While the initial rally to 14916 high has ended wave ((i)). Then a pullback in wave ((ii)) unfolded as a flat correction where lesser degree wave (a) ended at 14809 low. Wave (b) ended at 14933 high, and wave (c) ended at 14655 low. Above from there, the index is extending higher in wave ((iii)) as an impulse sequence. Near-term, as long as dips remain above 14630 low the index is expected to continue to extend higher for a few more highs. To complete the first leg of the bounce in wave A. Afterward, the index is expected to see a pullback in wave B. Then it should do another extension higher in wave C to complete the 3-wave corrective bounce.
DAX 1-Hour Elliott Wave Chart From 11.03.2023
DAX Elliott Wave Video
https://www.youtube.com/watch?v=NtPsbOnlnmw
Today’s Calendar Centers Around US Payrolls and Services ISM
Markets
The November rally in core bonds continued yesterday, but unlike Wednesday they closed off the intraday highs. A dovish hold by the Bank of England and disappointing US Q3 unit labour costs (-0.8% Q/Q with upward revision to Q2 figure: 3.2% from 2.2%) called the shots. Equity markets rallied in lockstep with key European indices ending 1.5% to 2% higher and main US benchmarks recording equal gains. EUR/USD went from an open at 1.0570 to a close of 1.0622. Daily changes on the US yield curve ranged between +4.6 bps (2-yr) and -12.7 bps (30-yr). The US 2-yr yield tested the October low (4.92%), which is the neckline of a double top formation, but bounced off this mark. Similar support in the US 10-yr yield stands at 4.58% (vs 4.66% close yesterday). German yield differences varied between +2 bps (2-yr) and -6.9 bps (30-yr). The German 10-yr yield tested a same double top formation (with October low of 2.68% as neckline), but a break lower didn’t happen. UK Gilts outperformed with yields ending 6.2 bps (2-yr) to 11.6 bps (7-yr) lower as the belly outperformed the wings. The Bank of England’s split decision to hold rates instead of hiking was less tight than in September (5-4 vs 6-3) with the updated Monetary Policy Report barely showing growth across the policy horizon. Sterling initially weakened from EUR/GBP 0.8690 towards 0.8735, but closed near unchanged around 0.87. From a technical point of view, the pair fails to really make headway beyond 0.87-0.8750.
Today’s calendar centers around US payrolls and services ISM. Consensus expects 180k net job growth, a stable unemployment rate (3.8%), wage growth of 0.3% M/M & 4% Y/Y and the ISM ticking back from 53.6 to 53. In light of the recent bond correction, we see asymmetric risks with markets rallying (& dollar softening) on weaker or in-line data. A huge upward surprise for both is likely needed to send bonds and stocks lower again. First Fed governors are scheduled to speak after this week’s FOMC meeting (Barkin, Kashkari, Bostic) and serve as a wildcard. ECB Schnabel already said that the central bank can’t close the door for further rate hikes. “After a long period of high inflation, inflation expectations are fragile and renewed supply-side shocks can destabilize them, threatening medium-term price stability.” She added that it took a year to get inflation from 10.6% to 2.9% currently, but that the ECB expects it to take about twice as long to get back to 2% from here.
News & Views
The Czech National Bank kept the policy rate unchanged at 7% yesterday in a 5 (hold) – 2 (cut) vote. Markets and analysts believed the central bank would have started the cutting cycle with a 25 bps move. The risk of unanchored inflation expectations persists, the CNB explained. “This risk could manifest itself in the results of the ongoing wage bargaining process and in stronger-than-expected repricing of goods and services at the start of next year.” Price pressures indeed eased dramatically but remain too high. Especially core inflation is cause for concern, with the outlook for 2024 at an average of 3%. The decision was made even as economic growth was cut. It’s overshadowing a weakening economy, which unexpectedly contracted in Q3. The CNB expects -0.4% this year before returning to growth of around 1.2% next year. The central bank added that the depreciation of the koruna delivered a slight easing of overall monetary conditions. It added to the case of keeping rates as they are. The Bank Board did discuss a strategy for a future reduction in rates and assumes that any decrease will initially be moderate and gradual. Since its internal models project a 50 bps cut by end this year, “the interest rate path will therefore most probably be higher than in the baseline scenario of the forecast in the coming quarters.” KBC Economics expects a 25 bps rate cut (to 6.75%) in December, though risks are tilted towards an even later easing start. The Czech crown rallied after the hawkish policy outcome. EUR/CZK dropped from 24.66 to 25.45. Czech swap yields disconnected from the global and local trend yesterday by adding 10 bps at the short end of the curve.
EUR/USD Daily Outlook
Daily Pivots: (S1) 1.0570; (P) 1.0619; (R1) 1.0672; More...
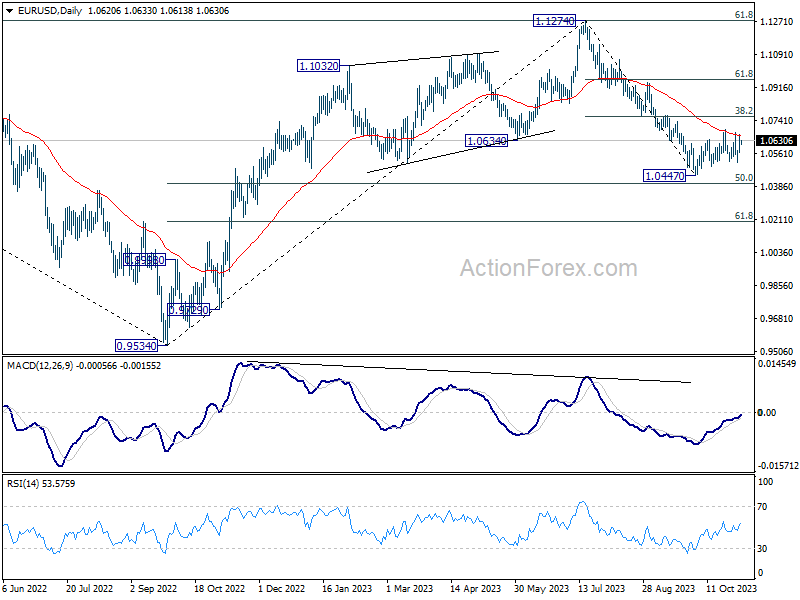
Intraday bias in EUR/USD stays neutral at this point. On the upside, break of 1.0693 will extend the rebound from 1.0447 to 1.0764 cluster resistance (38.2% retracement of 1.1274 to 1.0447 at 1.0763). However, break of 1.0515 will indicate that larger fall from 1.1274 is ready to resume through 1.0447 to 1.0199 fibonacci level.
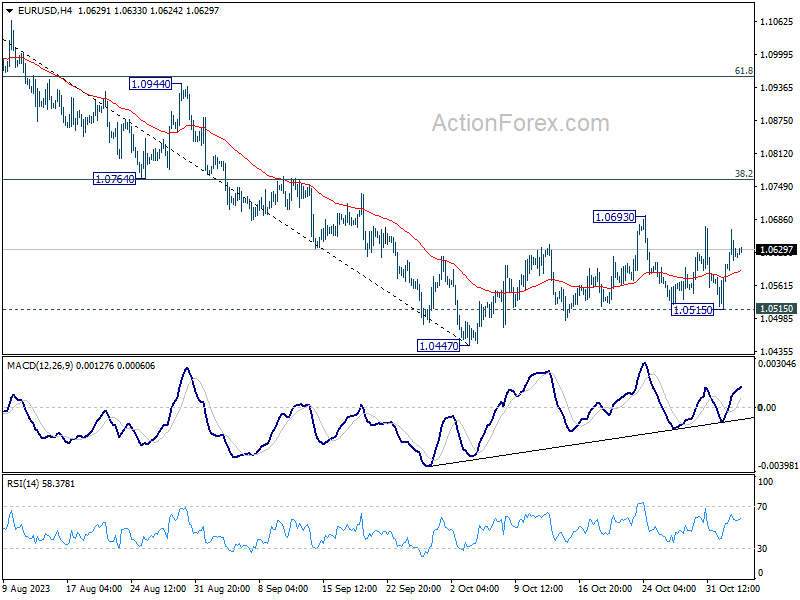
In the bigger picture, fall from 1.1274 medium term top could be viewed part of a correction to rise from 0.9534 (2022 low). An interim bounce from current level, as the second leg of the pattern, cannot be ruled out. But upside should be limited well below 1.1274 resistance to start the third level. The pattern would likely at least have a take on 61.8% retracement of 0.9534 to 1.1274 at 1.0199 before completion.
GBP/USD Daily Outlook
Daily Pivots: (S1) 1.2152; (P) 1.2189; (R1) 1.2240; More
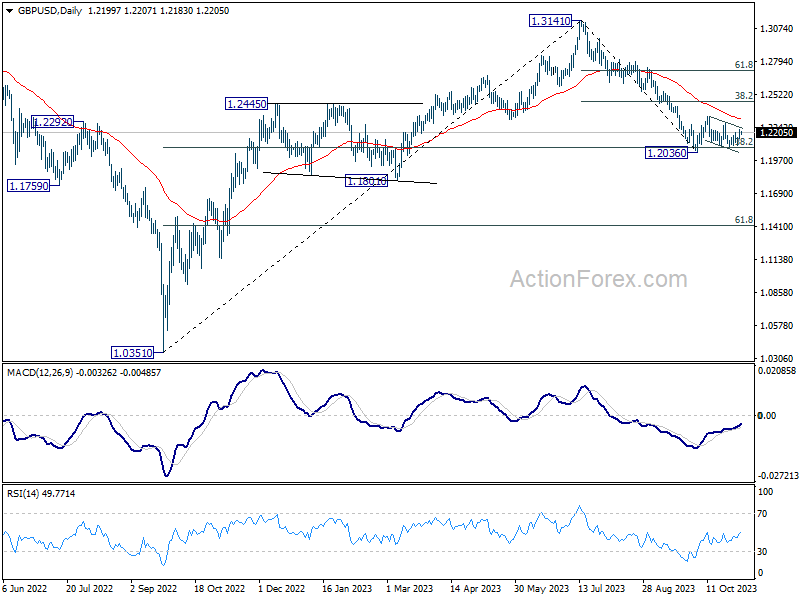
Intraday bias in GBP/USD remains neutral for the moment. On the upside, firm break of 1.2287 resistance will argue that rise from 1.2036 is resuming. Intraday bias will be turned back to the upside for 38.2% retracement of 1.3141 to 1.2036 at 1.2458. On the downside, decisive break of 1.2036 will resume whole decline from 1.3141 for 1.1801 support next.
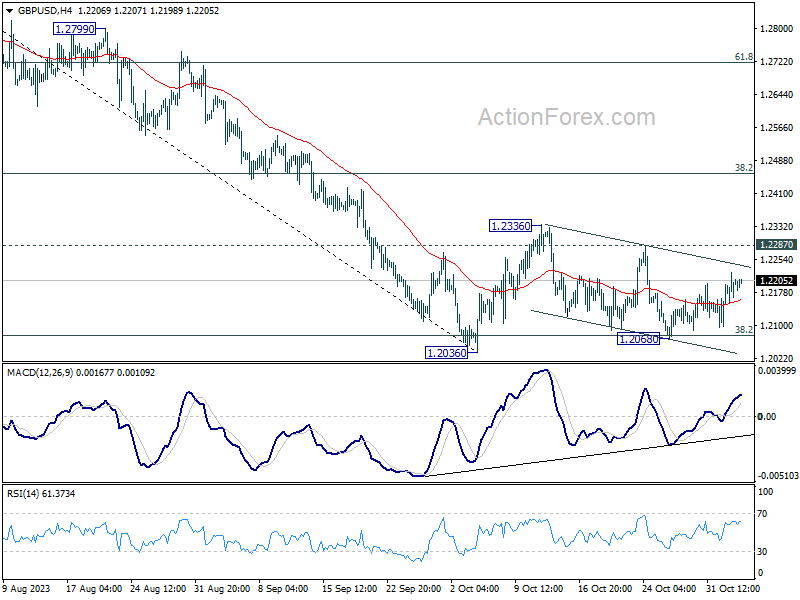
In the bigger picture, fall from 1.3141 medium term top could still be a correction to up trend from 1.0351 (2022 low) only. But risk of complete trend reversal is rising. Sustained break of 38.2% retracement of 1.0351 to 1.3141 at 1.2075 will pave the way to 61.8% retracement at 1.1417. For now, risk will stay on the downside as long as 55 D EMA (now at 1.2315) holds, in case of rebound.
USD/CHF Daily Outlook
Daily Pivots: (S1) 0.9023; (P) 0.9054; (R1) 0.9089; More....
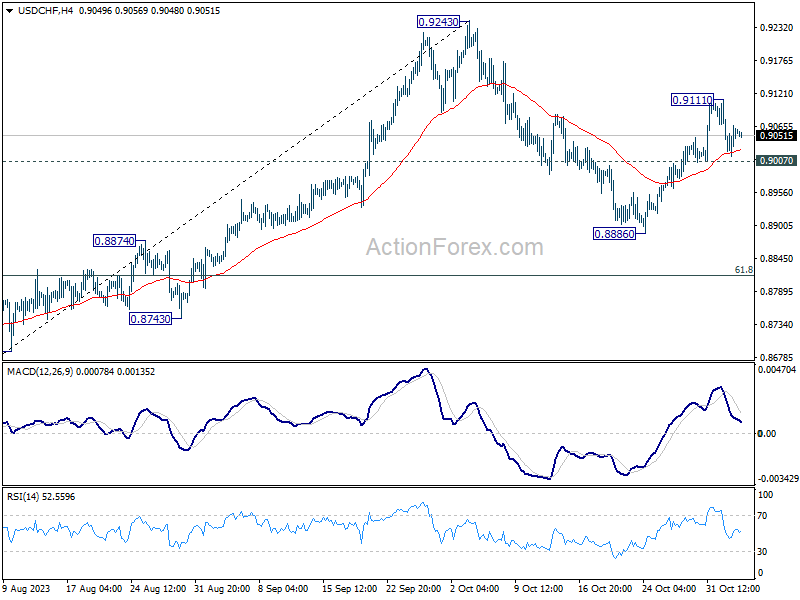
Intraday bias in USD/CHF remains neutral at this point. Further rally is mildly in favor with 0.9007 support intact. Above 0.9111 will resume the rebound from 0.8886 to retest 0.9243 resistance next. However, firm break of 0.9007 will turn bias to the downside for 0.8886 support instead.
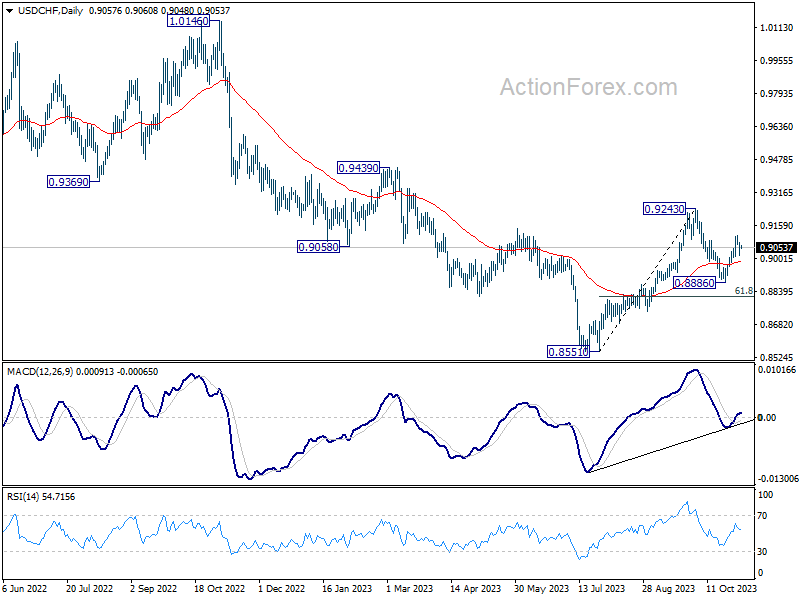
In the bigger picture, outlook is mixed up by the deeper than expected pull back from 0.9243. Yet there was no follow through selling after hitting 0.8886. On the upside, break of 0.9243 resistance will revive the case of medium term bottoming at 0.8851, and turn outlook bullish. However, sustained break of 61.8% retracement of 0.8551 to 0.9243 at 0.8815 will argue that larger decline from 1.0146 is ready to resume through 0.8551 low.
USD/JPY Daily Outlook
Daily Pivots: (S1) 149.89; (P) 150.43; (R1) 151.02; More...
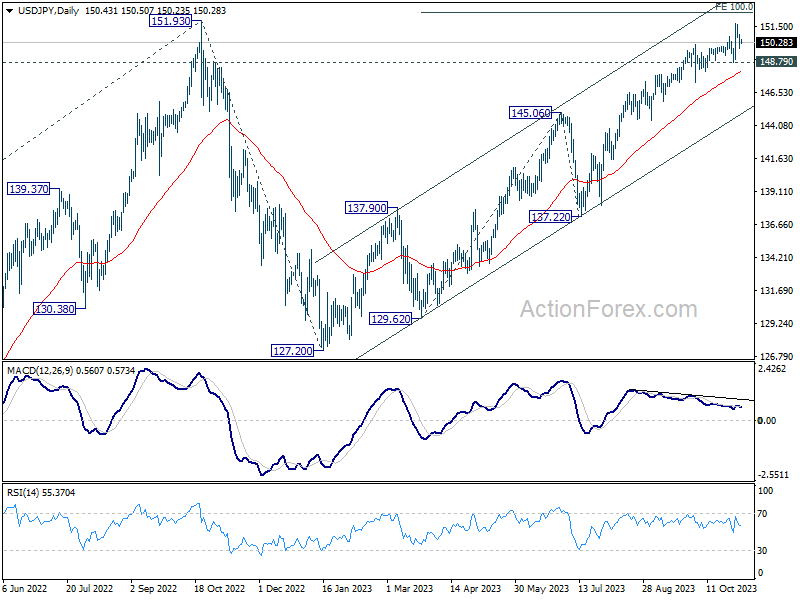
Intraday bias in USD/JPY remains neutral first and more consolidation would be seen below 151.69 resistance. Further rally is mildly in favor as long as 148.79 support holds. Decisive break of 151.93 will target 100% projection of 129.62 to 145.06 from 137.22 at 152.66. However, firm break of 148.79 will indicate rejection by 151.93, and bring deeper fall through 147.28 support.
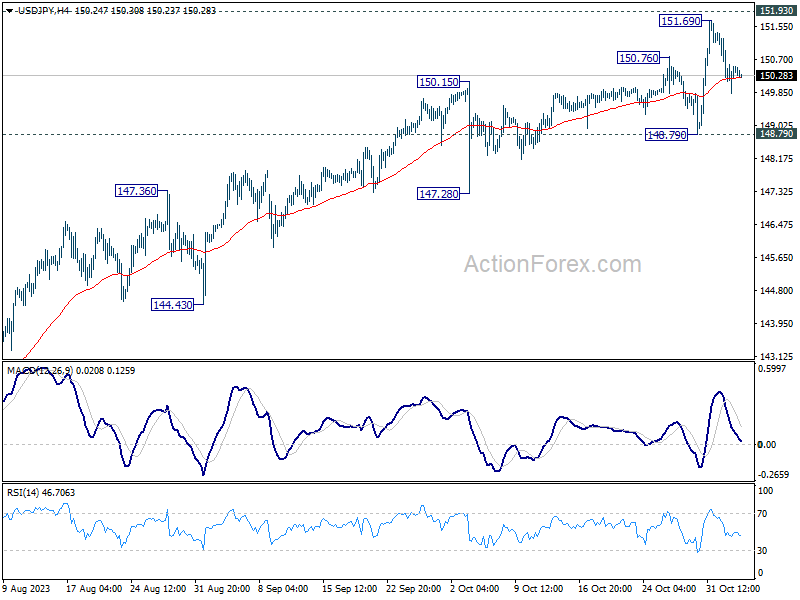
In the bigger picture, immediate focus is now on 151.93 resistance (2022 high). Rejection by 151.93, followed by sustained break of 145.06 resistance turned support will argue that rise from 127.20 has completed, and turn outlook bearish for 137.22 support and below. However, sustained break of 151.93 will confirm resumption of long term up trend. Next target will be 61.8% projection of 102.58 to 151.93 from 127.20 at 157.69.
USD/CAD Daily Outlook
Daily Pivots: (S1) 1.3695; (P) 1.3778; (R1) 1.3820; More...
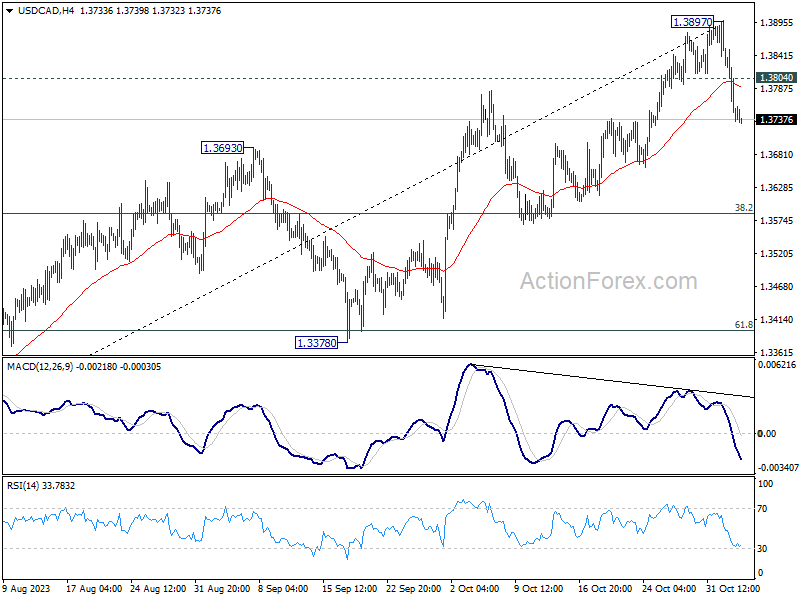
A short term top should be in place at 1.3897, on bearish divergence condition in 4H MACD. Intraday bias is mildly on the downside. Deeper fall would be seen towards 38.2% retracement of 1.3091 to 1.3897 at 1.3589. But strong support should be seen there to bring rebound. On the upside, above 1.3804 minor resistance will bring retest of 1.3897.
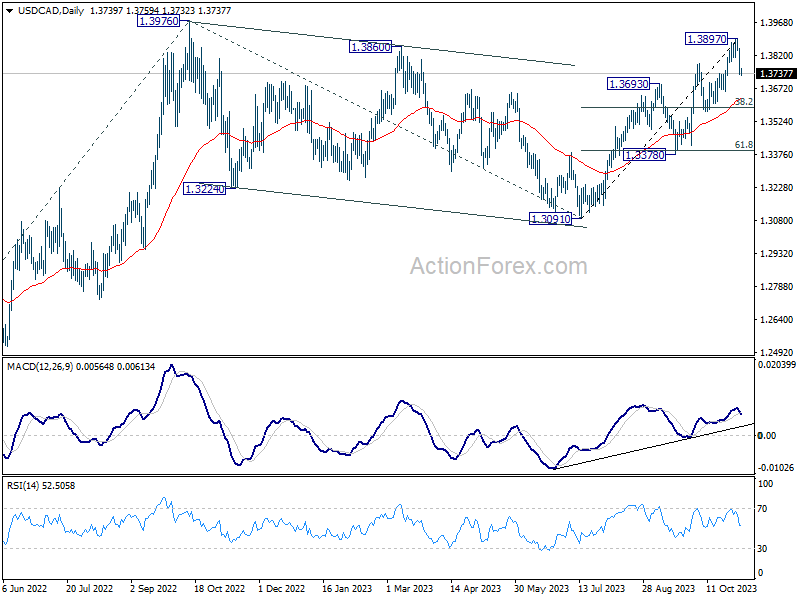
In the bigger picture, corrective pattern from 1.3976 (2022 high) should have completed with three waves down to 1.3091. Decisive break of 1.3976 high will confirm resumption of up trend from 1.2005 (2021 low). Next target will be 61.8% projection of 1.2401 to 1.3976 from 1.3091 at 1.4064. This will now remain the favored case as long as 1.3568 support holds.
Focus Turns to US Jobs Report
Market movers today
The main event today will be the US jobs report released an hour earlier than usual at 13:30 (CET), due to the shift to standard (winter) time. We expect jobs growth to cool back towards the pre-September trend at +180k, yet still continue to illustrate solid labour market conditions. Markets will also keep a close eye on the average hourly earnings growth, which slowed markedly through Q3.
In the US, we also get the ISM non-manufacturing data, which has been significantly stronger than S&P service PMIs recently. It will be interesting to see whether the divergence continues.
In the euro area, we get September unemployment data. The unemployment rate was 6.4% in August, an all-time low.
We also get service PMIs from Sweden and unemployment data from Norway.
The 60 second overview
Norges Bank: As widely expected, Norges Bank left monetary policy unchanged yesterday, but more importantly, it explicitly opened the door for keeping rates on hold in November as well, if underlying inflation continues to moderate. This is in line with our view, but was a dovish surprise for NOK markets. We think the markets could still underestimate the potential for Norges Bank to be among the first central banks to eventually turn towards cutting rates. Read our full review: Reading the Markets Norway: Norges Bank Review - Door for an 'unchanged' December decision is open, 2 November.
Bank of England (BoE): BoE left the Bank Rate unchanged yesterday in line with expectations. We still think BoE is already done with rate hikes as GDP growth is set to slow down and the unemployment rate could continue to edge higher. Governor Bailey tried to push back against markets pricing in rate cuts for next year, but short-end Gilt yields still declined and EUR/GBP ended the press conference at a higher level. See our Bank of England Review - BoE paves the way for more EUR/GBP topside, 2 November.
US Politics: Last night, the US House of Representatives passed a USD14.3bn funding package to support Israel. However, Senate majority leader Schumer quickly responded that he will not bring the bill up for a vote in Senate as even though the size of the support was in line with Biden's earlier proposal, the new spending was balanced with cuts to funding for Internal Revenue Service (IRS) and the bill omitted any aid to Ukraine. CBO estimated, that cutting IRS funding would reduce expected tax revenues, and that the bill would hence still increase the deficit by around USD 26.7bn. In any case, the proposal highlights how approving new funding for Israel and/or Ukraine aid - as well as avoiding the government shutdown - will not be an easy task even with the new House speaker Mike Johnson now in place.
Equities: Equities extended its rebound which turned into an outright rally at the end of the session. S&P 500 surged 1.9%, Stoxx 600 1.7% and Russell 2000 a full 2.7%(!). This takes US on track for almost 5% gain for the week. There was not a single trigger behind the rally, but as we have been arguing, the latest equity weakness should be treated as a correction and not the start of a bear market. Hence, oversold conditions on top of Fed relief is just enough for a rebound. It was a broad-based rally with real estate, consumer discretionary and financials sticking out in the top. Asia is catching up this morning but US futures are unchanged.
FI: The first half of yesterday's trading session was dominated by yields catching down to the strong US yield decline on Wednesday. On no particular news, yields started to drift higher in the afternoon, leading to EGB yields ending the day around 5-6bp lower, with the exception being BTPs which performed 9bp on the day. Markets added 3bp of rate cuts and are now pricing ECB to cut rates by 93bp through 2024. European curves flattened markedly from the long end with 2s10s EUR swap 5bp flatter to -29bp. We still expect steeper curves to prevail going forward.
FX: Risk on an as such all G10 gained against the USD, however only modestly. EUR/GBP traded lower towards 0.87 as BoE pushed back on talk of rate cuts. The NOK initially weakened as Norges Bank refrained from hiking but recovered some lost ground later in the session.
Credit: Credit markets took a massive leg tighter yesterday with iTraxx Xover tightening 21bp and Main 4.5bp. Activity also picked up in the primary market with several deals priced, including a hybrid transaction from APA Infrastructure, which was almost 10x oversubscribed despite the deal being tightened 75bp from IPT to final pricing.
Nordic macro
Norway: We expect that the NAV unemployment rate (seasonally adjusted) rose marginally to 2.0 % in October, as demand for labour seems to have slowed down during the month.