Sample Category Title
GBPJPY Buyers stay away but ready to step in
- GBPJPY resumes muted tone despite bullish breakout
- Nearby support levels keep the focus on the upside
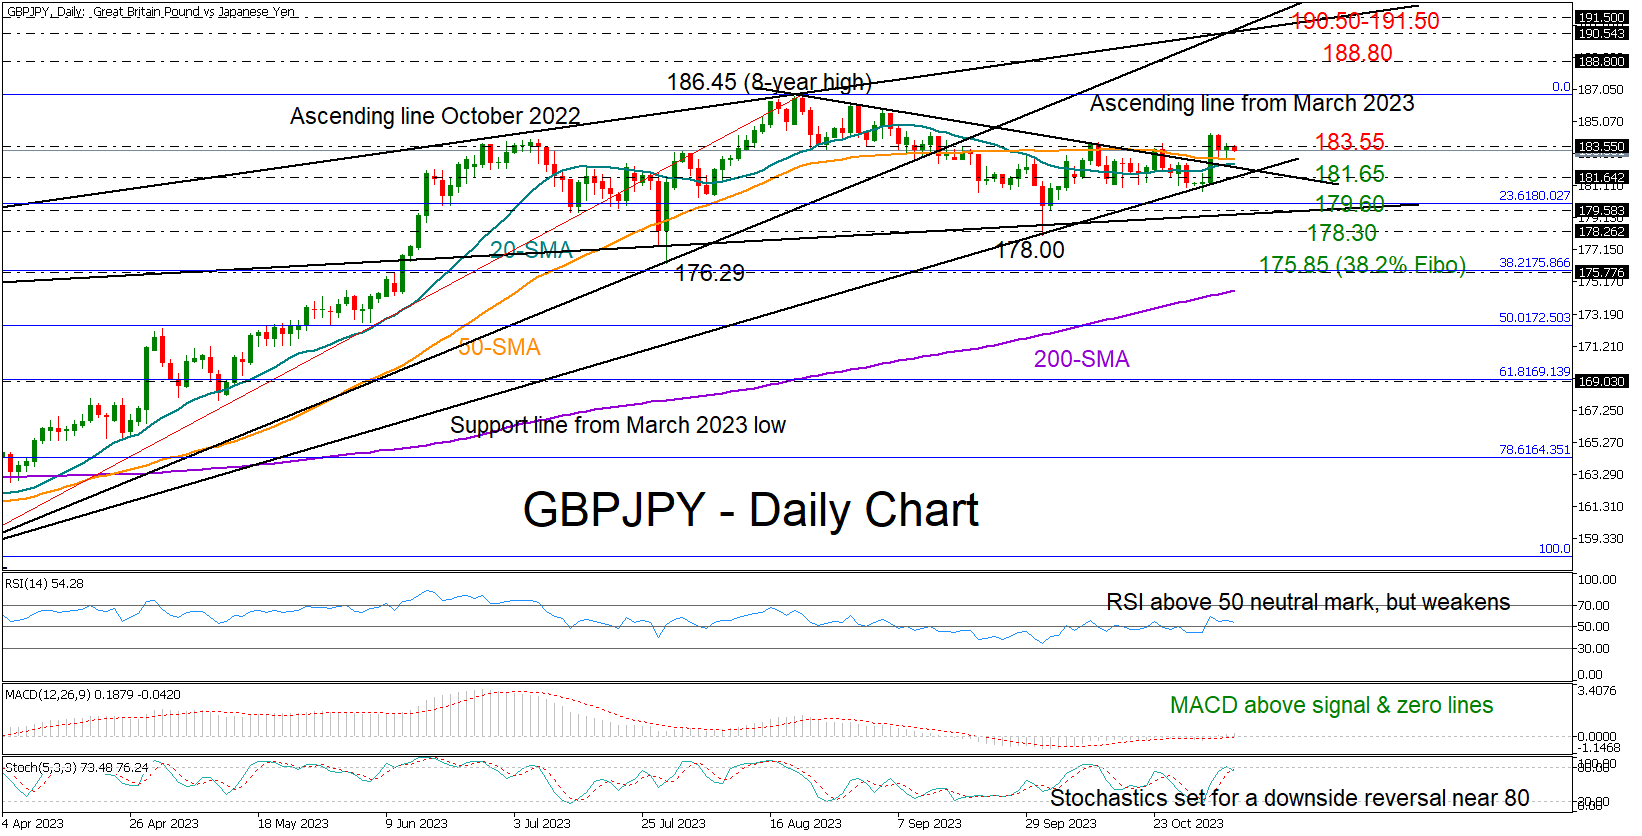
GBPJPY could not capitalize from Tuesday’s surge above the short-term resistance trendline, staying muted around the 183.55 area.
The RSI is above its 50 neutral mark, although weaker, and the MACD is keeping its footing above its red signal line and within the positive area, both reflecting that buyers are still active. Yet, with the stochastic oscillator looking for a downside reversal near its 80 overbought level, it’s uncertain if there is enough bullish power to boost the price towards the August top of 186.45.
Nevertheless, the pair has key levels underneath for protection against selling forces. The 50-day simple moving average (SMA) has been limiting downside movements over the past two days at 182.67, while the ascending trendline from March at 181.65 and the ascending line from April 2022 at 179.60 could also prevent a continuation lower. If the bears take the lead, the pair could plummet towards the 175.85 region, which overlaps with the 38.2% Fibonacci retracement of the 158.25-186.45 upleg, unless the 178.30 restrictive zone calms selling impulses beforehand.
In the event of an uptrend resumption above the eight-year high of 186.45, the bulls might take a breather near the November 2015 high of 188.80 before stretching towards the critical resistance line from October 2022 at 190.50. The broken ascending line from the March low might attract attention in the same region. Should it give way, the door will open for the 2015 ceiling of 195.30.
In brief, GBPJPY buyers are holding back despite the latest bullish trendline breakout. On the other hand, sellers cannot head up either, as important support levels remain intact. A close above 183.55 or below 179.60 could provide the next direction in the market.
Euro Calm Ahead of US Nonfarm Payrolls
- US nonfarm payrolls expected to ease to 170,000
The euro is showing limited movement on Friday after posting strong gains a day earlier. In the European session, EUR/USD is trading at 1.0633, up 0.10%.
All eyes on US nonfarm payrolls
The US dollar has been under broad pressure since the Federal Reserve decision on Wednesday. The Fed statement was pretty much a repeat of the one in September and Fed Chair Powell reiterated that rate hikes were still on the table. The markets didn’t buy into Powell’s comments and expectations are rising that the Fed is done with tightening. The ADP Employment Change report, which isn’t considered a reliable gauge for nonfarm payrolls but is still closely watched, posted a weak gain of 113,000 in October, well below the market consensus of 150,000 and following the September reading of 89,000.
Will nonfarm payrolls follow suit with a weaker-than-expected release? Nonfarm payrolls posted a massive gain of 336,000 in September but the market consensus for October is just 170,000. If nonfarm payrolls misses expectations, it would likely mean that the current tightening cycle is over and done with. Conversely, a surprise to the upside would add credibility to the Fed’s stance that the economy remains strong and that rate hikes remain on the table. I would expect the US dollar to post gains if nonfarm payrolls beats expectations.
The Fed will also be keeping an eye on wage growth, a driver of inflation. Wages rose 0.2% m/m in September and the market estimate for October stands at 0.3%. On an annualized basis, wage growth is expected to ease to 4.0% in October, down from 4.2% in September.
In the eurozone, today’s numbers were soft, yet another reminder of the weak economy. French Industrial Production declined 0.5% m/m in September, after a revised -0.1% reading in August and missing the market consensus of 0.0%. Spanish unemployment change jumped to 36,900 in October, up from 19,800 in September and the highest level since April.
EUR/USD Technical
- There is resistance at 1.0664 and 1.0764
- 1.0595 and 1.049509 are providing support
Eurozone unemployment rate rose to 6.5%, EU unchanged at 6.0%
Unemployment rate in Eurozone ticked up in September, rising to 6.5% from the previous month's 6.4%. This uptick defied market expectations that the unemployment rate would hold steady.
Despite the month-over-month increase, the broader picture shows a labor market that has seen a significant year-over-year improvement, with Eurozone unemployment shrinking by -212k compared to September 2022. However, the monthly rise in unemployment, with 69k more individuals without work in the Eurozone, suggests that the region's labor market might be facing new challenges as it enters the final quarter of the year.
The EU-wide unemployment rate remained constant at 6.0%, underscoring a more stable job market situation across the broader European Union. Nevertheless, the total number of unemployed persons in the EU rose by 95k month-over-month, bringing the number to approximately 13.026m, of which 11.017m are within the Eurozone.
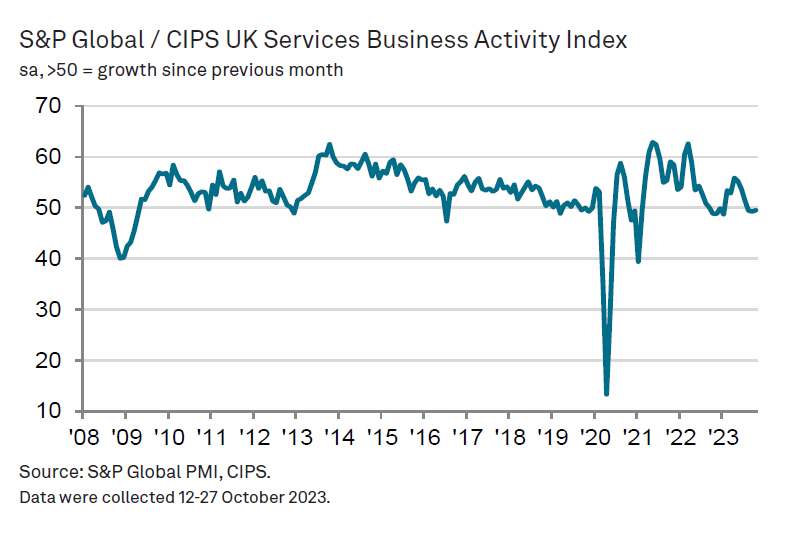
UK PMI services finalized at 49.5, shallow downturn persists
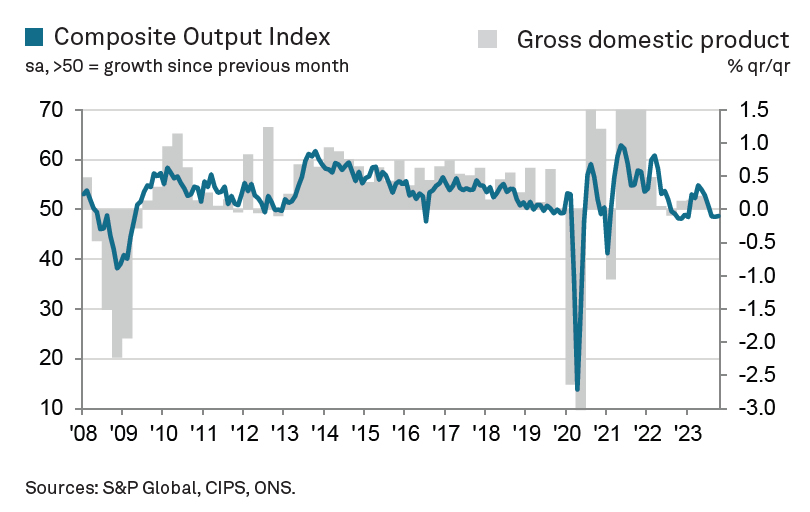
UK PMI Services index was finalized at to 49.5 in October up fractionally from 49.3 in September, lingering in contraction territory for the third consecutive month. PMI Composite showed a minor improvement to 48.7 from an 8-month nadir of 48.5
Economics Director at S&P Global Market Intelligence, Tim Moore, highlighted, "A shallow downturn in UK service sector activity persisted in October as businesses struggled to make headway against a backdrop of worsening domestic economic conditions and stretched household budgets."
The outlook remains cautious at best. "Forward-looking survey indicators suggested that service providers will continue to skirt with recession," said Moore, noting that business optimism has dipped to its lowest point of the year.
On the brighter side, there was a silver lining with a slight uptick in new export sales. Furthermore, input cost inflation showed signs of easing, reaching its softest point in over two years due to reduced raw material prices and supplier discounting.
Nevertheless, this hasn't stopped businesses from hiking prices. "Higher wages and fuel bills were still passed on to clients, which resulted in the strongest increase in average prices charged inflation for three months," Moore explained.
Central Banks Pause Rates. Markets Await NFP
The Federal Reserve decided unanimously to maintain interest rates at 5.25-5.50%, a highly anticipated move that retains significant implications for monetary policy's future course. Despite this decision, the FOMC refrained from definitively ruling out potential future rate hikes, leaving room for policy adjustments. During his press conference, Chair Jerome Powell expressed deep concerns about ongoing inflation, implying that the current policy might not be restrictive enough. Rising bond yields also captured the Fed's attention, contributing to tightening financial conditions.
On the other side of the Atlantic, the Bank of England (BOE) took a similar stance by holding existing interest rates, following a series of consecutive rate hikes from December 2021 to August 2022. The UK grapples with high inflation, which surged to 6.7% in September, significantly exceeding the BOE's 2% target, similar to the US and Europe. Core inflation, excluding volatile food and energy prices, remains uncomfortably high at 6.1% for the UK. The country maintains a 15-year high interest rate of 5.25%, and it remains to be seen how this would impact the NFP release.
USDCAD - H4 Timeframe
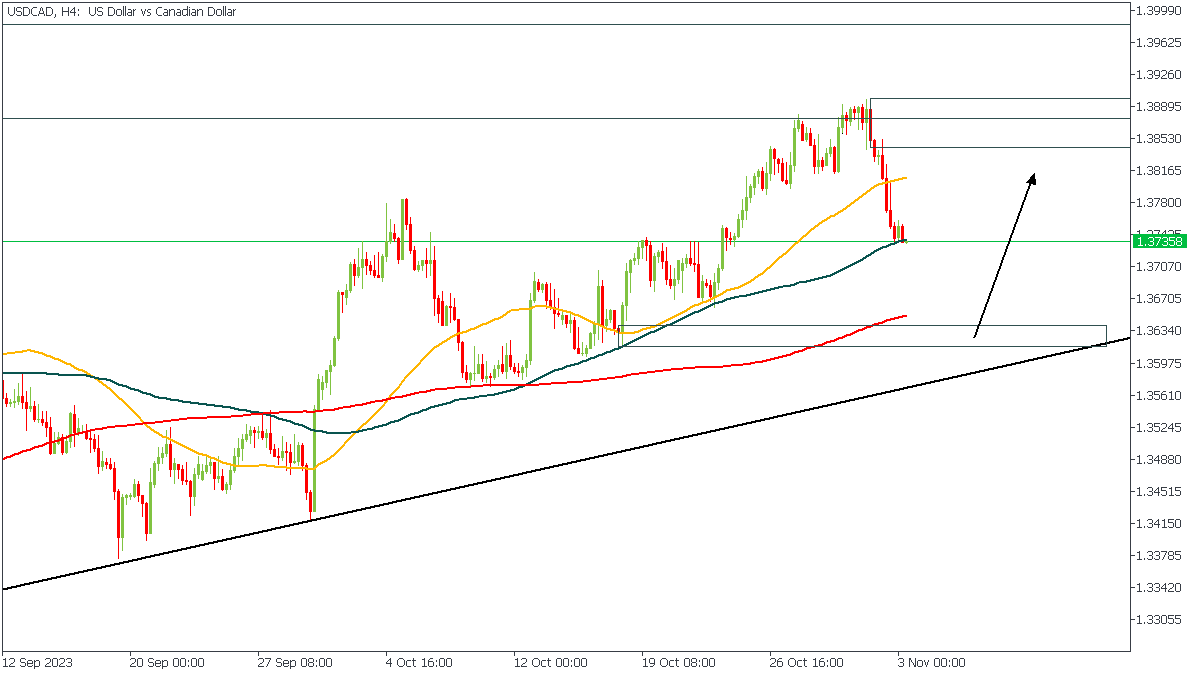
USDCAD began a steady decline a short while ago, and the drop is currently approaching a demand zone. When price reaches the demand zone, I expect to see a bullish rally because the demand zone overlaps with other confluences like; the 200-period moving average, trendline support, and the bullish array of the moving averages indicating a bullish trend is at play.
Analyst’s Expectations:
- Direction: Bullish
- Target: 1.38349
- Invalidation: 1.35614
EURUSD - H4 Timeframe
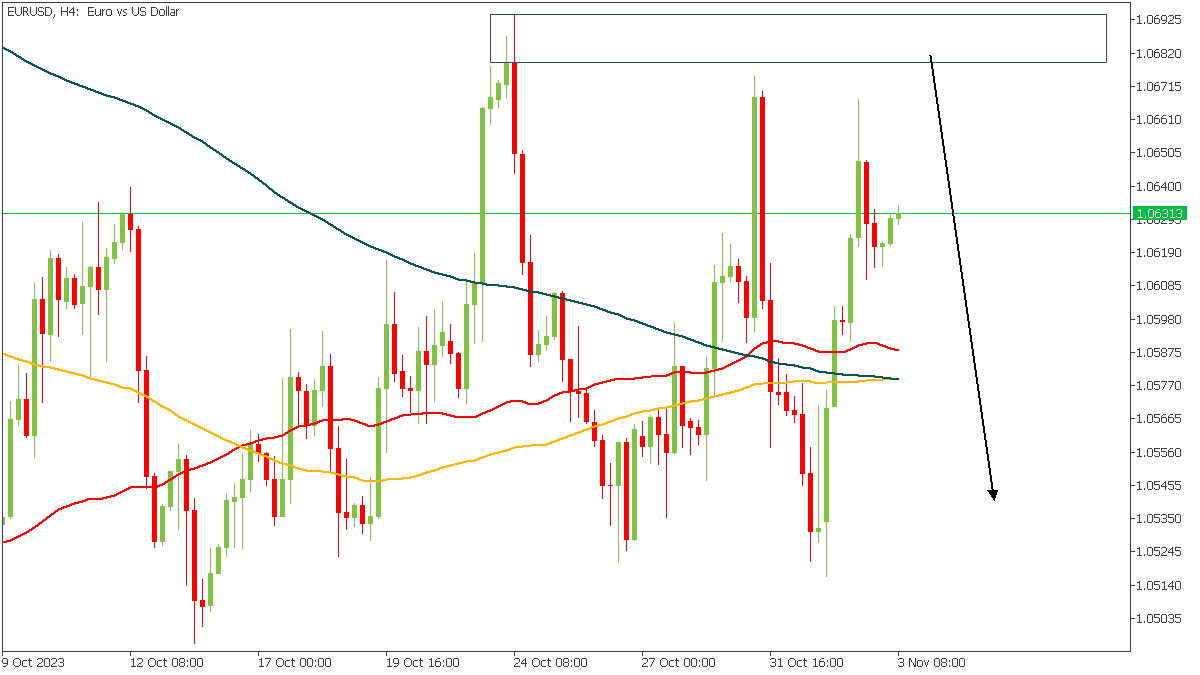
At this time, we can see the price action on the 4-Hour timeframe of the EURUSD chart returning to the previous high where we have a supply zone. My expectation is that the bullish move will be rejected from the supply zone, back to the 50-period moving average.
Analyst’s Expectations:
- Direction: Bearish
- Target: 1.06024
- Invalidation: 1.06968
GBPUSD - H4 Timeframe
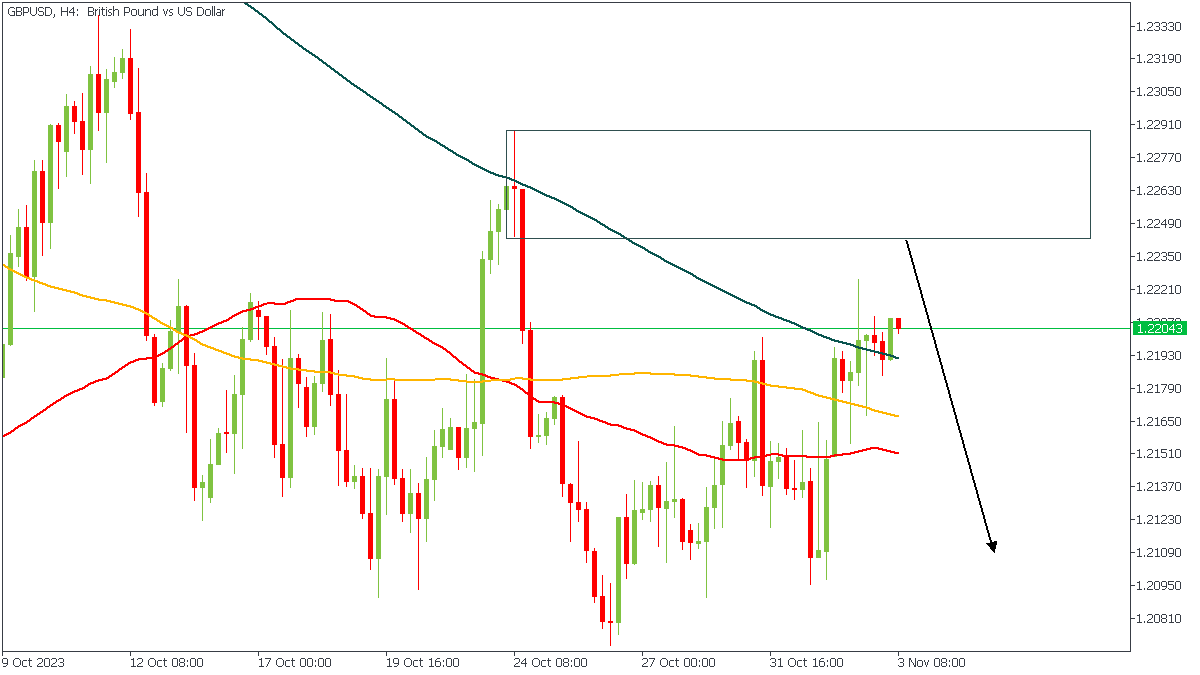
GBPUSD’s 4-Hour timeframe chart provides a much cleaner price action compared to the EURUSD chart of the same period. Here on GBPUSD we see the supply zone clearly at the 76% of the Fibonacci retracement as the price action slowly approaches it. The bearish moving average array is also quite clear.
Analyst’s Expectations:
- Direction: Bearish
- Target: 1.21124
- Invalidation: 1.22916
CONCLUSION
The trading of CFDs comes at a risk. To succeed, you have to manage risks properly. To avoid costly mistakes while you look to trade these opportunities, be sure to do your due diligence and manage your risk appropriately.
US Economy Expected to Have Added 180K New Nonfarm Jobs
The S&P500 jumped almost 2% to above its 200-DMA, and Nasdaq 100 gained 1.74% and tested its 50-DMA to the upside as the rally in the US sovereign bonds extended to another day.
Apple disappoints
Apple will likely slow the rally in major US indices. Apple shares dived up to 4% in the afterhours trading after announcing that the sluggish Chinese demand for iPhones dented revenue. The Mac computers sales also fell short of a billion USD. Apple sales fell for the fourth straight quarter, the longest such decline in 22 years. As a result, Apple stock could sink to $170 a share, the critical 38.2% Fibonacci retracement level, if taken out, would let Apple sink into the medium-term bearish consolidation zone. The only thing that could save Apple from falling into dark waters is… a further rally in US bonds, and a further fall in yields.
Falling yields are no good for Fed
The US bond rally popped this week because the US Treasury said that it would borrow slightly less than previously thought and slightly less 3-, 10- and 30-year papers. The Federal Reserve (Fed) hinted that the rate hikes could be coming to an end because the recent surge in US long term yields helped them tighten the financial conditions without the need for another rate hike.
But if the yields fall at this speed, the Fed expectations will become hawkish very quickly, and depending on how far the market will go, the Fed could be obliged to hike rates again in December, or in January to keep financial conditions tight enough.
Jobs day
US growth is strong, and the jobs market remains healthy. The Fed thinks that solid labour-force participation and immigration explain the resilience of the jobs market. According to the consensus of analyst estimates on Bloomberg, the US economy is expected to have added 180K new nonfarm jobs, the unemployment rate is seen steady at around 3.8% and the wages growth may have slowed from 4.2% to 4% on an annual basis. Any strength in job additions or wages growth data could bring bond trades back to earth and remind them that if the US jobs market - and the economy - remains this strong, the Fed could turn hawkish again. But strong jobs data in a context of higher supply is not necessarily inflationary.
Gloomy UK outlook
The Bank of England (BoE) kept its interest rate unchanged for the second straight month yesterday. Some MPC members still voted for a 25bp hike to make sure that the pause is not premature, but they all said the same thing: it’s too early to talk about rate cuts.
Good news is that inflation may fall below 5% in October and somewhere near 4.5% by the year end. But at 4.5-5%, inflation is still more than twice the BoE’s policy target. Therefore, the BOE can’t promise that it’s done hiking. It could only hope that the cumulative impact of higher rates on the economy would do the rest of the heavy lifting.
In the best-case scenario, the UK’s gloomy economic outlook - which seems to become gloomier as months go by - weighs on demand and brings inflation lower. In the worst-case scenario, inflation remains sticky while the economy sinks into a recession. In both cases, the BoE wouldn’t hike. The expectation of another hike is down to 1 in 3 and markets now fully price in 3 quarter-point cuts by the end of 2024. The softer economic outlook and softening BoE expectations are threatening for sterling bulls both against the US dollar and the euro.
Has USDCAD’s Recent Rally Run Its Course?
- USDCAD in the red after reaching 3-year high
- Aggressive rally since the July 14 low of 1.3091
- Momentum indicators appear to support the current downleg
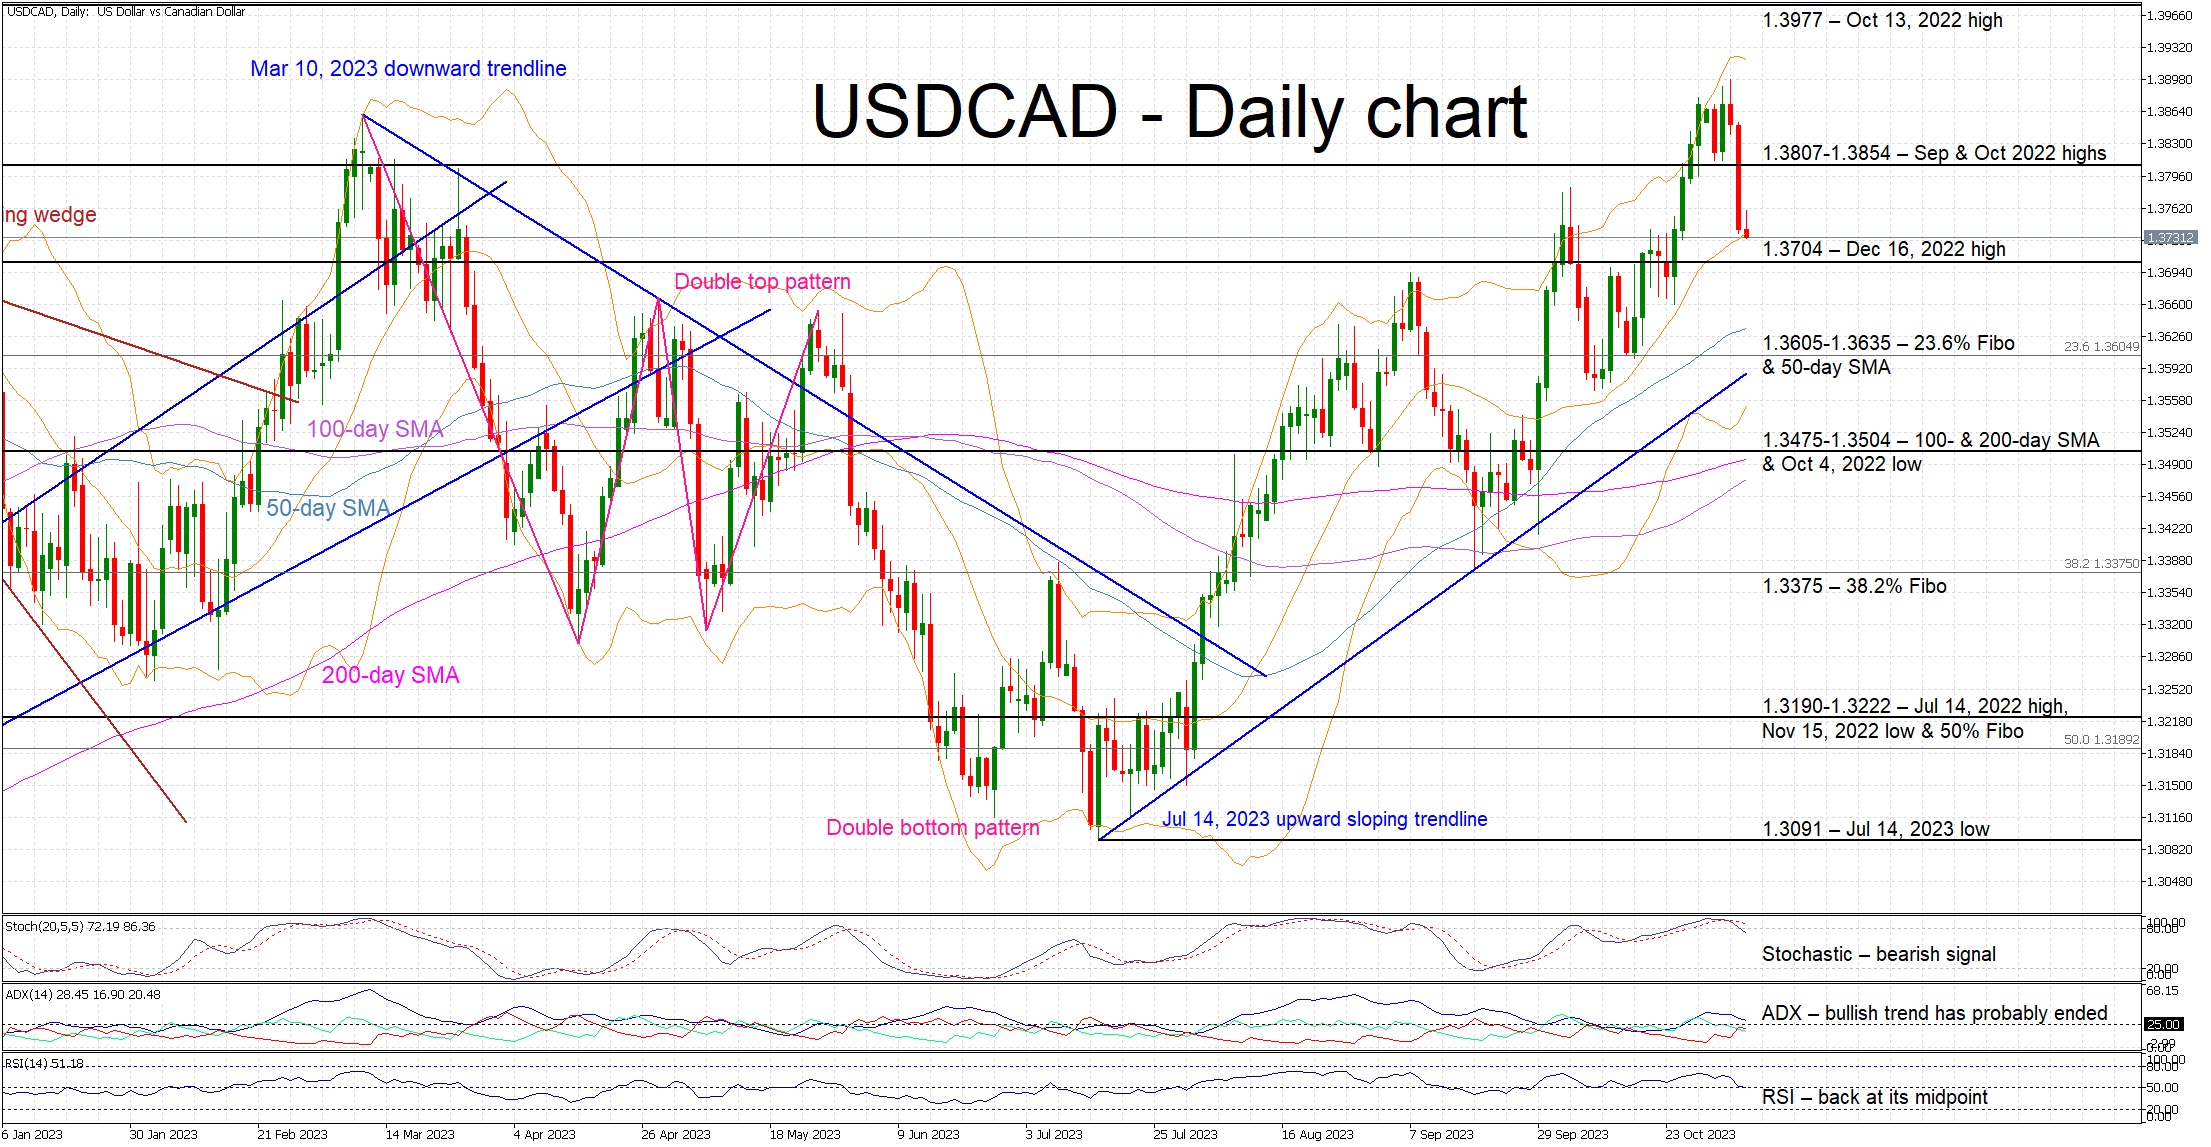
USDCAD is moving lower today, registering its third consecutive red candle after trading at a 3-year high of 1.3898. It has been an aggressive rally from the July 14 low with the bulls potentially staying on the sidelines this week due to numerous key events. In the meantime, the bullish series of higher highs and higher lows remains intact but a possible shooting star doji today could complicate the outlook.
Amidst this price action, the momentum indicators appear to be favouring the current correction. The RSI is hovering a tad above its midpoint, and the Average Directional Movement Index (ADX) is pointing to an aggressively weakening bullish trend in the market. Interestingly, the stochastic oscillator has crossed below both its moving average and overbought territory, signaling that the current downleg could have legs.
Should the bulls remain in control of the market, they could try to keep USDCAD above the December 16, 2022 high at 1.3704. They could then have a go at overcoming the 1.3807-1.3854 area. If successful, they could have the chance to record a new 2023 high and potentially set their course for the October 13, 2022 peak at 1.3977.
On the flip side, the bears appear determined for the current correction to pick up pace and they could first try to push USDCAD below the 1.3704 level. They could attempt to stage a sell-off towards the 1.3605-1.3635 region that is defined by the 23.6% Fibonacci retracement of the April 5, 2022 – October 13, 2022 uptrend and the 50-day simple moving average (SMA). Lower, the support set by the July 14, 2023 ascending trendline could be stronger than currently anticipated.
To sum up, USDCAD bears are trying to recoup lost ground after the recent strong bullish run, potentially capitalizing on the increasingly negative momentum.
EUR/JPY Daily Outlook
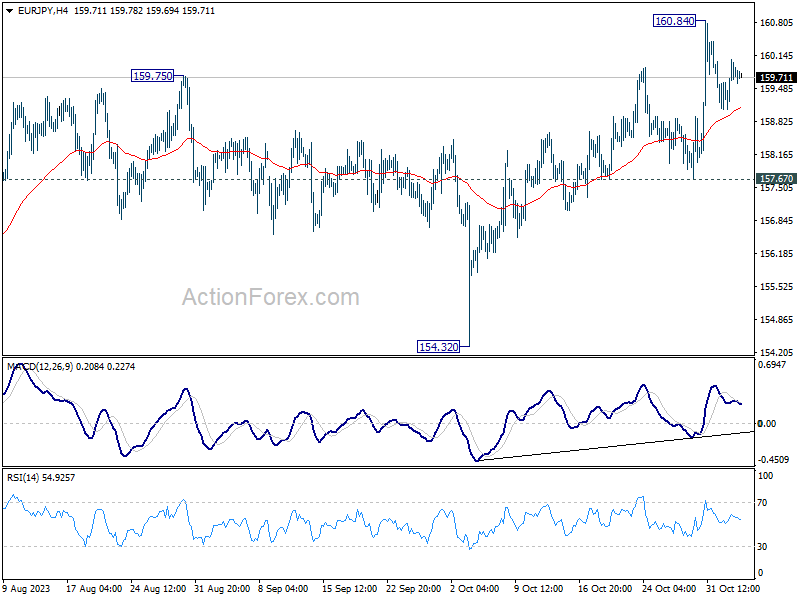
Daily Pivots: (S1) 159.25; (P) 159.66; (R1) 160.26; More....
Intraday bias in EUR/JPY remains neutral for consolidation below 160.84. Outlook stay bullish as long as 157.67 support holds. Break of 160.84 will resume larger up trend to 163.06 projection level next.
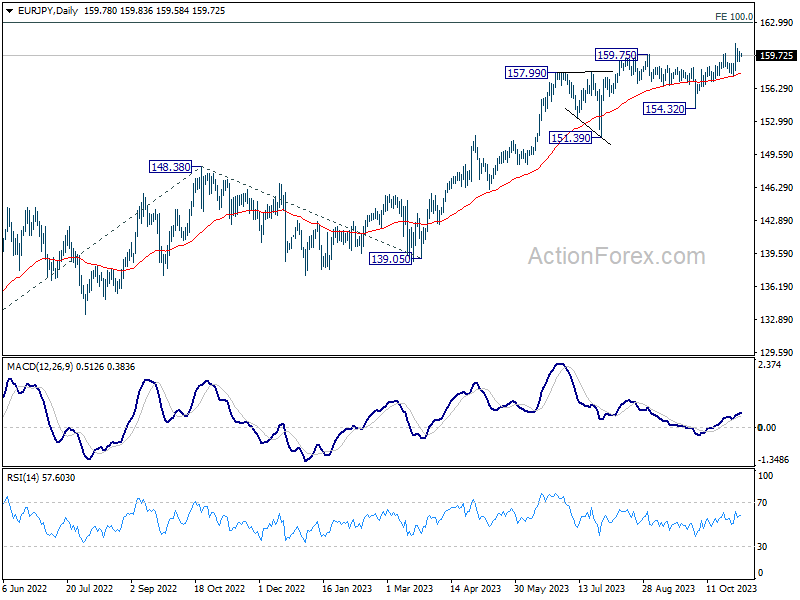
In the bigger picture, rise from 114.42 (2020 low) is in progress. Next target is 100% projection of 124.37 to 148.38 from 139.05 at 163.06. On the downside, break of 154.32 support is needed to be the first sign of medium term topping. Otherwise, outlook will remain bullish even in case of deep pullback.
EUR/AUD Daily Outlook
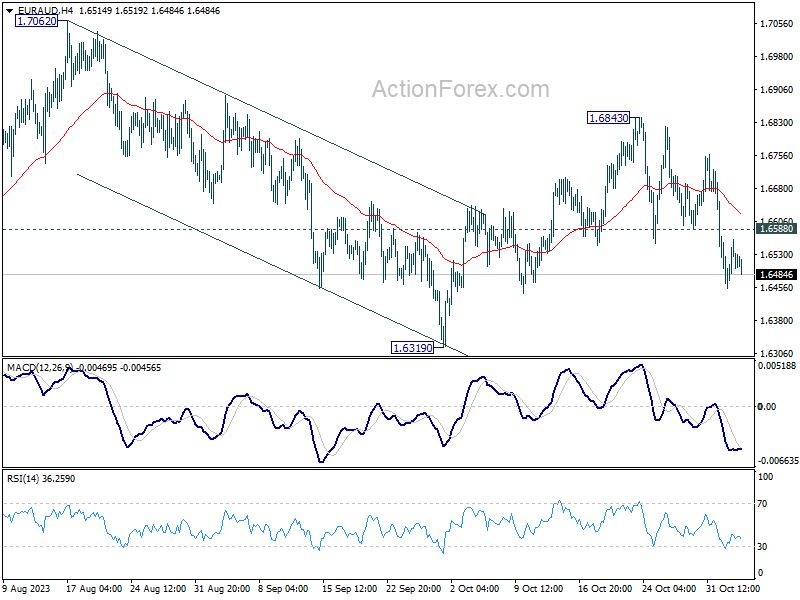
Daily Pivots: (S1) 1.6448; (P) 1.6587; (R1) 1.6671; More...
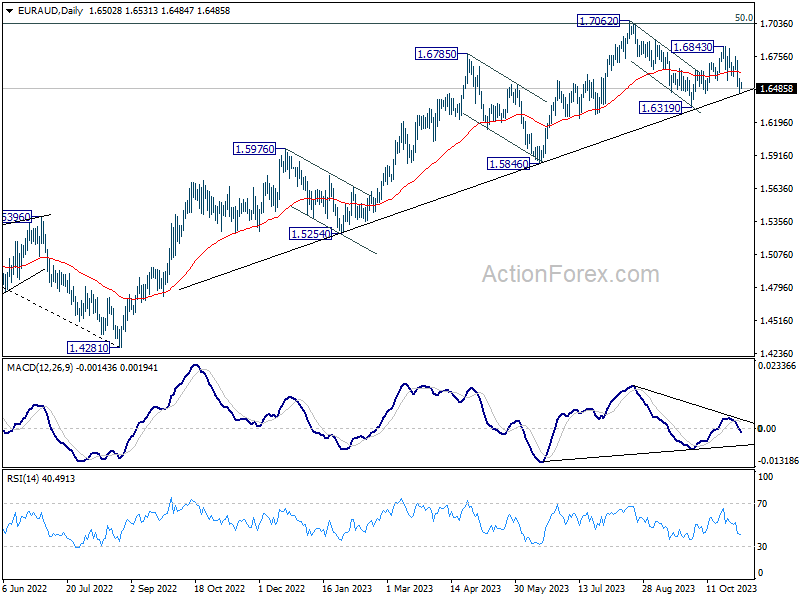
Intraday bias in EUR/AUD remains on the downside at this point. Corrective rebound from 1.6319 could have completed at 1.6843 already. Deeper fall would be seen to retest 1.6319 support. On the upside, above 1.6588 minor resistance will turn intraday bias neutral first.
In the bigger picture, the strong support from medium term rising trend line indicates that rise from 1.4281 (2022 low) is still in progress. Sustained break of 1.7062 will pave the way to 61.8% retracement of 1.9799 (2020 high) to 1.4281 at 1.7691. In any case, outlook will stay bullish as long as 1.6319 support holds. However, decisive break of 1.6319 will confirm medium term topping at 1.7062, and bring deeper fall to 1.5846 support.
EUR/GBP Daily Outlook
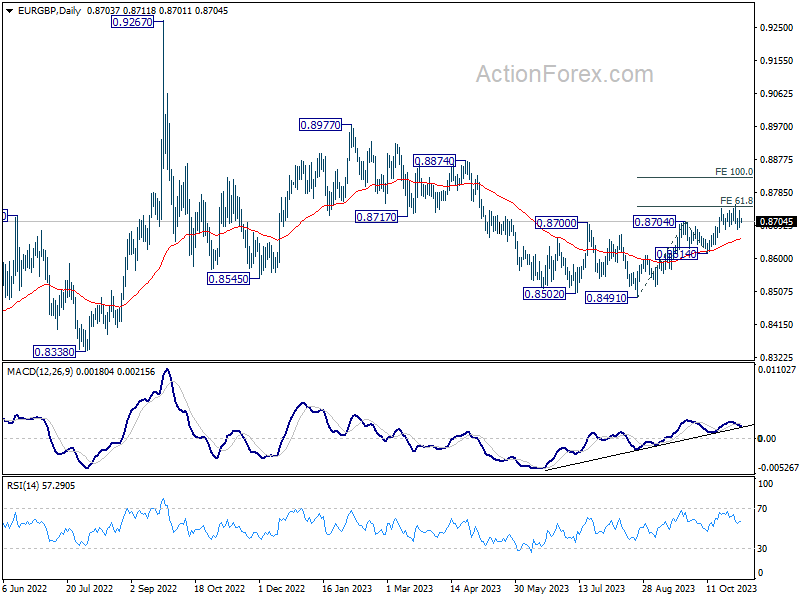
Daily Pivots: (S1) 0.8684; (P) 0.8698; (R1) 0.8714; More....
Intraday bias in EUR/GBP remains neutral and outlook is unchanged. Consolidation from 0.8752 could extend further. Downside should be contained by 55 D EMA (now at 0.8656). Firm break of 0.8752 will resume the whole rise from 0.8491, and target 100% projection of 0.8491 to 0.8704 from 0.8614 at 0.8827 next. However, sustained break of 55 D EMA will argue that whole rebound from 0.8491 has completed, and bring deeper fall to 0.8614 support.
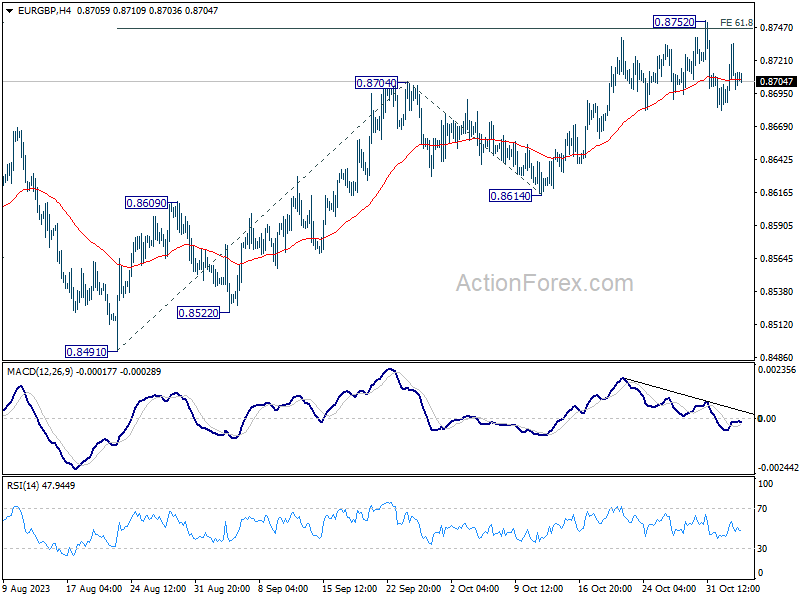
In the bigger picture, current development suggests that whole down trend from 0.9267 (2022 high) has completed with three down to to 0.8491. Rise from 0.8491 is seen as another leg inside that pattern from 0.9499 (2020 high). Further rally should be seen to 0.8977 resistance and above. This will now remain the favored case as long as 0.8614 support holds.