Sample Category Title
Forex and Cryptocurrencies Forecast
EUR/USD: No Interest Rate Hikes from the Fed and ECB in the Near Future?
Starting from the last days of September, the U.S. Dollar Index (DXY) has been trading within a sideways channel. Macroeconomic data released last week did not provide a clear advantage to either the U.S. or the European currency. On Tuesday, October 17, U.S. retail sales data was published, showing a monthly increase of 0.7%. Although this figure was lower than the previous 0.8%, it substantially exceeded the market's average forecast of 0.3%. On the same day, the ZEW Economic Sentiment Index for the Eurozone was also released, outperforming expectations with a reading of 2.3, considerably better than the forecast of -8, and marking a full rebound from the previous negative figure of -8.9.
On Wednesday, October 18, revised data on consumer inflation in the Eurozone was released. The September Consumer Price Index (CPI) matched the forecast and was ultimately assessed at 4.3% year-on-year (YoY), compared to 5.2% the previous month. On Thursday, October 19, the number of initial jobless claims in the U.S. came in at 198K, surpassing expectations and falling below both the prior figure of 211K and the market forecast of 212K.
Taking a broader view of the U.S. economy, we generally observe strong employment and GDP growth rates, a deceleration in inflation, increased consumer activity, and a real estate market that remains relatively stable despite rising mortgage rates. All these factors point to the appropriateness of another rate hike, which should, in turn, push the DXY higher. However, based on statements from Federal Reserve officials, it seems unlikely that a rate hike will occur at the upcoming Federal Open Market Committee (FOMC) meeting on November 1.
Specifically, Patrick Harker, President of the Federal Reserve Bank of Philadelphia, stated that economic pressure should not be created by increasing borrowing costs. Echoing Harker's sentiments, Lorie Logan, President of the Federal Reserve Bank of Dallas, noted that although "desired progress is being observed in the fight against inflation, it is still too high." She added that "the economy continues to demonstrate strong performance, and labour markets remain tight," yet "the Fed still has some time to observe the economy and markets before making a decision on monetary policy.".
Jerome Powell's speech at the New York Economic Club on Thursday, November 19, did not meet the expectations of dollar hawks, leading EUR/USD to rise above 1.0615. According to economists at Rabobank, the Federal Reserve Chairman attempted to keep the door open for various options while maintaining a neutral stance. Rabobank believes that U.S. economic indicators are likely to sustain the possibility for further rate hikes. However, with less than a week and a half remaining until the next FOMC meeting, the current "neutral dynamics provide no basis to expect a rate hike on November 1st." Nonetheless, they note that "this option remains open for the December meeting." Despite that, economists at the bank still expect "the bond market to do the Fed's job, making further rate hikes redundant. However, if economic data remain strong, the FOMC will eventually have to resume the rate hike cycle at some point."
Analysts at the Netherlands' largest banking group, ING, opined that while the Fed Chairman's comments were perceived as dovish and led to some weakening of the U.S. currency, the dollar appears more inclined to rise than to further fall in the short term. Economists at Germany's Commerzbank characterized the mood among Fed officials as cautiously hawkish rather than dovish. They also see little chance for another rate hike in the current climate. "Indeed, it seems that the Fed has reached its peak, although Jerome Powell did not rule out the possibility of another rate hike depending on incoming data. However, monetary policy currently plays a secondary role for the market. Geopolitical risks have taken the forefront, and the dollar continues to be in demand as a safe haven," they commented. The bank's experts forecast that although it may be challenging for the dollar to continue rising in such a scenario, high oil prices will provide support.
At France's Societe Generale, it is believed that "the narrative about a higher rate over a longer term, both from the Fed and the ECB, points to a gradual decline of the euro." According to the bank's experts, "data from the Eurozone is not brilliant, and the divergence between growth forecasts in the U.S. and the Eurozone suggests that a slow movement toward parity [1.000], but not beyond it, appears likely.".
As of the time of writing this review, EUR/USD has evidently not reached parity and concluded the past week at 1.0593. Expert opinions on its near-term future are divided as follows: 50% voted for a stronger dollar, 35% foresee the pair trending upward, and 15% have adopted a neutral stance.
Turning to technical analysis, the outlook is also mixed. Among the trend indicators on the D1 chart, the ratio stands at 1:1: 50% in favour of reds (bearish) and 50% on the side of greens (bullish). Oscillators show 40% siding with the European currency, a mere 15% in favour of the dollar, with the remaining 45% taking a neutral position. The immediate support levels for the pair are situated around 1.0550, followed by 1.0485-1.0510, 1.0450, 1.0375, 1.0255, 1.0130, and 1.0000. Bulls will encounter resistance in the 1.0600-1.0620 zone, then at 1.0670-1.0700, 1.0740-1.0770, 1.0800, 1.0865, and 1.0945-1.0975.
The upcoming week promises to be highly eventful. On Tuesday, October 24, a slew of Purchasing Managers' Index (PMI) data will be released across various sectors of the German, Eurozone, and U.S. economies. The following day, October 25, will bring U.S. housing market data, along with remarks from Federal Reserve Chair Jerome Powell. On Thursday, the European Central Bank (ECB) will hold its meeting where Governing Council members are expected to make a decision on the euro interest rate, which according to consensus forecasts, is likely to remain at its current level of 4.50%. Importantly, not only the decision itself but also subsequent statements and comments from the ECB leadership will be of significance. On the same day, the U.S. will release durable goods orders data as well as preliminary GDP figures for Q3 of the current year. The workweek will conclude on October 27 with the release of U.S. personal consumption expenditure data.
GBP/USD: Will the BoE Rate Remain Unchanged as Well?
At the beginning of this month, specifically on October 4, GBP/USD trended upwards, moving from a level of 1.2037 to reach 1.2337 within a week. However, resistance around the 1.2320 zone and a trendline clearly visible on the D1 and W1 timeframes halted the bullish momentum, sending the pair back downwards. As a result, the British currency has lost approximately 7.5% against the dollar since mid-July. The driving factors behind this are not merely technical analysis but also the prevailing economic and geopolitical landscape.
Amid tensions in the Middle East and the ongoing escalation of armed conflict between Israel and Hamas, investors are turning back to the dollar, viewing it as a safe-haven currency. Naturally, the rising cost of energy commodities is also affecting prices in the United Kingdom, which will undoubtedly put pressure on the country's economy and its currency, often considered by investors to be a riskier asset.
It's worth noting that at the beginning of the year, experts predicted that the United Kingdom would slide into a recession. So far, those forecasts have not materialized, although the economy is teetering on the edge, with the current annual GDP growth rate at 0.6% (compared to 2.1% in the United States). The situation could deteriorate by year-end, as high energy prices amid winter cold spells could further fuel inflation. It's already observable that the country's inflation slowdown has stalled, and the Consumer Price Index (CPI) has been hovering around 6.8-6.7% year-on-year for the third consecutive month.
In such a scenario, the Bank of England (BoE) might very well opt to focus on supporting the economy over combating inflation. Although some representatives of the central bank have stated that the issue of raising interest rates remains open, the recent interview given by BoE Governor Andrew Bailey to the Belfast Telegraph appeared rather dovish, neutralizing the effect of Jerome Powell's similarly dovish comments. Mr. Bailey indicated that he expects "a noticeable decrease" in inflation in the coming month. "Looking at September's inflation data, we can say that core inflation has dropped a bit compared to our expectations, which is quite encouraging," added Bailey, sending GBP/USD into a minor knockdown.
Pressure on the pound was also exerted by the UK retail sales data released on Friday, October 20. According to the Office for National Statistics, retail sales declined by -0.9% month-on-month in September, significantly below the -0.1% forecast and the previous 0.4% value.
At the moment, the situation for the pound remains complicated. It's unclear how the BoE will react to the latest data. Most likely, until the upcoming meeting on November 2, the central bank will adopt a "close your eyes and hope for the best" approach. Meanwhile, analysts from Bank of America, Deutsche Bank, Goldman Sachs, and RBC are in agreement that the rate hike cycle in the United Kingdom has likely come to an end. At the very least, the probability of a rate hike in the upcoming BoE meeting is estimated to be below 50%.
The weekly low for GBP/USD was recorded at 1.2089, while the week closed at 1.2163. When polled about the near-term future of the pair, 40% of analysts voted for its rise. The majority (60%), however, believe that the pair will continue its move toward the 1.2000 target. On the D1 timeframe, trend indicators are unanimously (100%) pointing to a decline, displayed in red. Oscillators are less decisive: 65% indicate a decline, 15% point to a rise, and the remaining 20% are neutral.
In terms of support levels and zones, if the pair continues to move southward, it will encounter 1.2085-1.2130, 1.2040, 1.1960, and 1.1800. On the flip side, if the pair rises, it will face resistance at 1.2190-1.2215, 1.2270, 1.2330, 1.2450, 1.2510, 1.2550-1.2575, and 1.2690-1.2710 levels.
Tuesday, October 24 is noteworthy in the economic calendar for the upcoming week. Data on the UK labor market and business activity will be released on this day.
USD/JPY: Amidst Prolonged Uncertainty
Many times have we heard these reassuring statements from Japanese officials about everything and... nothing! Let's take, for example, some quotes from Friday, October 20. First, from Bank of Japan (BoJ) Governor Kazuo Ueda: "The Japanese economy is recovering at a moderate pace. […] Uncertainty regarding Japan's economy is very high. […] Inflation rates will likely slow down and then pick up again. [But] overall, Japan's financial system remains stable."
Next, from Finance Minister Shunichi Suzuki: "It is important for currencies to move stably and reflect fundamental indicators. […] Exchange rates are influenced by various factors. [I] will not comment on currency levels in the Forex market. [And] I will not comment on our response to the currency market situation."
And, as the cherry on top, a quote from the Bank of Japan's latest report, also published on October 20: "Although the country's financial system is generally stable, the 'stress period may be further prolonged due to the ongoing tightening of central banks' monetary policy and concerns about slowing economic growth rates in foreign countries." In summary, Japan, on one hand, is doing well, but on the other, is experiencing stress caused by other central banks that are tightening their monetary policy and raising interest rates.
As experts note, the BoJ continues to maintain an ultra-accommodative monetary policy, persistently ignoring the risks of rising inflationary pressures in the country. On Tuesday, October 17, Bloomberg reported that the Bank of Japan's new core CPI forecast for the 2023 fiscal year is likely to approach 3.0%, compared to 2.5% previously.
The fact that interest rates in Japan remain very low due to yield curve control policy should lead to a further decline in the yen against the dollar. This decline could cease under two conditions: if the dollar interest rates decline or if the Bank of Japan abandons its YCC (Yield Curve Control) policy. Both could potentially begin to happen as early as mid-2024, but certainly not now. (Although one should not forget the possibility of currency interventions by the Japanese Ministry of Finance).
According to strategists at Societe Generale, "if we see further increases in yields in the U.S. and no more than a change in the inflation forecast by the Bank of Japan at its meeting on October 31, then another surge [in USD/JPY] above 150.00 is practically inevitable." "The yen has every chance of becoming one of the most successful currencies in 2024," Societe Generale believes, "but predicting when USD/JPY will peak is as easy or difficult as determining when the yield on 10-year U.S. Treasury bonds will peak."
Amid a prolonged atmosphere of uncertainty, USD/JPY ended the previous trading week at 149.85. When it comes to the pair's short-term outlook, a mere 15% of experts foresee a renewed push towards the 150.00 mark. An additional 20% predict a downward correction, while the majority, 65%, remain noncommittal. On the D1 timeframe, all trend indicators are unanimously signalling 'buy' with a green coloration. Likewise, 100% of oscillators are green, although 40% indicate that the pair may be overbought. Immediate support can be found in the 149.60 area, followed by zones at 148.30-148.65, 146.85-147.25, 145.90-146.10, 145.30, 144.45, 143.75-144.05, and finally 142.20. On the upside, resistance is present at 150.00-150.15, then at 150.40, followed by the October 2022 high of 151.90, and 153.15.
No significant economic data concerning the state of the Japanese economy is scheduled for release in the upcoming week. The only noteworthy item is the publication of the Tokyo Consumer Price Index on Friday, October 27.
CRYPTOCURRENCIES: The Real Market Surge Triggered by Fake News About BTC-ETF
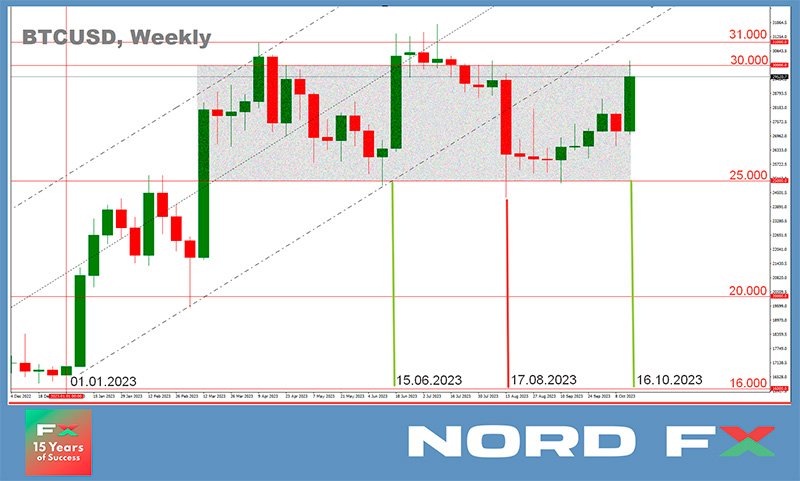
Undoubtedly, the most significant day of the past week was Monday, October 16. On this day, the bitcoin price soared to $30,102 before plummeting to $27,728. Following BTC, other digital assets also saw a sharp price increase, followed by a steep decline. According to Coinglass data, the price surge led to the liquidation of over 33,000 trading positions, with traders incurring losses totalling $154 million. Of this amount, bitcoin accounted for $92.0 million in losses, Ethereum for $22.7 million, and Solana for $4.6 million.
The surge in quotations occurred after Cointelegraph published news that the U.S. Securities and Exchange Commission (SEC) had approved BlackRock's application for a spot bitcoin exchange-traded fund (ETF). It was later revealed that the news was fake. Cointelegraph's editorial team apologized for publishing the false news. The publication clarified that one of their staff had seen the news about the SEC's approval of the BTC-ETF on Platform X (previously Twitter) and decided to publish it as quickly as possible without fact-checking or obtaining editorial approval. Representatives from the Commission also noted that "the best source of information about the SEC is the SEC itself" and advised users to "be cautious about what they read online.".
To understand this issue more deeply, it's helpful to look back to its origins in 2021. That year, a series of companies submitted applications to create such funds. Three years ago, Bitwise Chief Investment Officer Matt Hougan explained that cryptocurrency futures ETFs are not particularly suitable for long-term investors due to high ancillary costs. It is only when spot bitcoin exchange-traded funds become available that institutional investors will begin large-scale capital inflows.
For clarification: A spot BTC-ETF is a fund whose shares are traded on an exchange, and which tracks the market, or spot price, of bitcoin. The primary idea behind such ETFs is to give institutional investors access to bitcoin trading without physically owning the asset, through a regulated and financially familiar product.
All applications submitted to the SEC in 2021 were rejected, leading to a hiatus that was interrupted on June 15, 2023. On that day, the situation dramatically changed: the financial world was abuzz with the news that investment giant BlackRock had submitted its application for a spot bitcoin trust. In an interview with Bloomberg, Hougan heralded the dawn of a new era. He stated, "We now have BlackRock raising the flag and declaring that bitcoin matters: that it is an asset institutional investors want to invest in. I believe we have entered a new era in cryptocurrency, which I call the foundational era, and I expect a multi-year bull trend that is just beginning."
Under the banner raised by BlackRock, seven more leading financial institutions also submitted similar applications to the SEC. Among them were global asset managers like Invesco and Fidelity, who, experts believe, have the capacity to absorb trillions of dollars. The ninth on the list was the asset management company GlobalX. They, along with several other financial giants, had entered the ETF race back in 2021, but were then thwarted by the SEC. Now, in August 2023, GlobalX made another attempt.
Owing to the initiatives of these investment titans, bitcoin experienced a meteoric rise starting in the latter half of June. It shattered the $25,000 resistance barrier, soared beyond $30,000, and peaked at $31,388 on June 23. This resulted in a weekly gain exceeding 26%. Following bitcoin's lead, altcoins like Ethereum also saw significant upward movement, registering approximately a 19% increase during the same period. However, due to subsequent regulatory pressures from the SEC and actions by the U.S. Federal Reserve, along with other negative news, the BTC/USD trading pair began to decline. It reached a low point of $24,296 on August 17.
And now, two months later, we see another surge and subsequent drop. What's next? It's a pertinent question, as the approval of spot bitcoin ETFs is expected to unleash a significant wave of adoption of this asset class by institutional investors. According to analysts at CryptoQuant, this could quickly propel the market capitalization of the crypto space by $1 trillion. In their opinion, the odds of this happening have significantly increased following the legal victories of Ripple and Grayscale against the SEC. Bloomberg analysts currently estimate these odds at 90%.
It's worth noting that the deadline for the SEC's decisions on the applications from BlackRock and other companies will arrive in March 2024. However, Mike Novogratz, the CEO of Galaxy Investment, believes that spot bitcoin ETFs could become a reality as early as this year. Larry Fink, the head of BlackRock, declined to comment on the status of their application but added that the October 16 rally was driven not so much by rumours of its approval but rather by a desire among people to use quality assets, which he believes includes bitcoin, gold, and Treasury bonds.
Anthony Scaramucci, founder of SkyBridge Capital and former White House Communications Director, believes that the leading cryptocurrency is "in many ways even more valuable than gold," and could "easily" achieve a market capitalization of $15 trillion. According to his calculations, such a capitalization would propel the price of bitcoin to approximately $700,000.
Scaramucci asserts that the current financial system is "broken." "Strange things could happen when you see countries that are hostile to the U.S. trading in bitcoin or other assets to distance themselves from the dollar. This is because the United States has used its currency to assert its own geopolitical will," he said.
Opinions within the crypto industry regarding the near-term future of bitcoin (BTC) are divided. A study conducted by Finbold revealed that a substantial number of experts do not rule out the possibility of BTC/USD climbing to $100,000 or even $200,000. Finbold specialists also sought forecasts from the artificial intelligence PricePredictions. According to AI calculations, after the approval of a bitcoin ETF, the flagship crypto asset could swiftly reach the $100,000 range. PricePredictions noted that additional factors like mainstream bitcoin adoption, institutional investor actions, regulatory activity, and overall macroeconomic conditions will be significant.
Trader, analyst, and founder of venture firm Eight, Michael Van De Poppe, believes that the October 16th fake news will not hinder the cryptocurrency's growth. According to his observations, the coin has already entered a phase of positive momentum. "The trend is already upward. The lows we're seeing now offer a buying opportunity. A bitcoin ETF will eventually enter the market; it's just not happening today," said the Eight CEO.
Authors of the analytical channel Root in X (formerly known as "Twitter") also think that the fake news did not exert significant pressure on the cryptocurrency. In their opinion, the coin's pump, despite the subsequent correction, has actually helped improve its position. However, there is also a sizable portion of the crypto community that supports a bearish outlook, suggesting the coin could drop to the $19,000-$23,000 range.
On Friday, October 20, BTC/USD made another attempt to breach the $30,000 mark, reaching a high of $30,207 before retreating. At the time of writing this overview, it is trading at $29,570. The overall market capitalization of the crypto market stands at $1.120 trillion, up from $1.046 trillion a week ago. The Crypto Fear & Greed Index has risen over the week from 44 to 53 points, moving from the 'Fear' zone into the 'Neutral' zone.
Geopolitical Conflicts Unravel A Week of Turmoil and its Domino Repercussions
As geopolitical tensions rise, the financial markets are inundated with heightened volatility and uncertainty. The bond market is particularly sensitive, evidenced by the 10-year Treasury yield soaring to 5% for the first time since 2007. This spike is multifaceted, driven in large part by a ballooning bond supply and the persistent geopolitical crises.
Amidst these turbulent times, US yield curve continues to undergo a rapid normalization, echoing the historical pattern where bear steepening of yield curve precedes a recession. This ominous signal is being corroborated by the prevailing bearish sentiment sweeping across global stock markets. Gold's strong rally is also a result of increasing uncertainties.
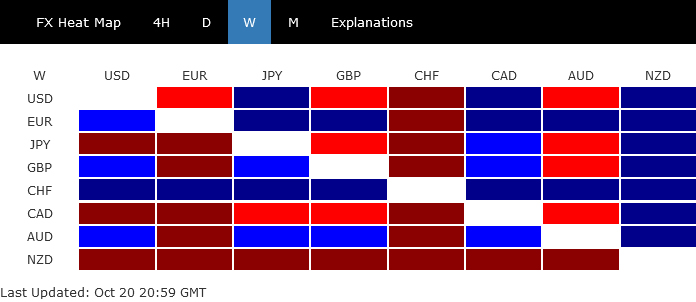
In the currency realm, Dollar didn't capitalize on the prevailing risk-off sentiment and surging yield, and ended the week just mixed. While Dollar Index's near term consolidation could extend, overall bullish outlook is maintained, with rising yields and market risks fortifying, not undermining, its standing.
Swiss Franc asserted its dominance as a safe-haven asset and ended as the best performer of the week. However, that also places SNB at a pivotal juncture that could prompt a rethink of its intervention strategy. Euro followed as the second strongest, despite being pushed to an important support by the Franc.
Australian Dollar clinched the title of the third strongest currency, aided in part by its performance against New Zealand Dollar. Kiwi found itself at the opposite end of the spectrum, bearing the brunt of disappointing Q3 inflation data that dampened the urgency for another imminent rate hike by RNBZ. Canadian Dollar and Yen didn't fare much better, while Sterling found its place in the middle ground, showcasing a mixed performance as the week wound to a close.
Treasury yields surge amid surging bond supply and geopolitical tensions
The fervent rally in long-dated US Treasury yields surged anew last week. In a significant movement, the 10-year Treasury yield pierced the 5% mark for the first time since 2007, although it later receded to close the week at 4.924%. Current market dynamics suggest that this rally is far from over, with increasing evidence indicating a supply-demand imbalance as a principal factor behind the recent dramatic selloff in US government bonds.
Diving into the details, the supply of bonds has seen an explosive rise, with some market watchers likening it to a "tsunami of issuances". This surge is attributed to the expanding US government budget deficit, which ballooned to a whopping USD 1.695T in fiscal 2023, reflecting a 23% increase from the previous year. Further compounding the situation, the federal government rolled out USD 15.7T in new securities this year, marking a 26% ascent compared to the same duration last year. Amplifying these figures, the Fed's aggressive tightening stance has consequently elevated debt-servicing costs.
Global geopolitical tensions add another layer to this complex scenario. With escalating conflicts in the Middle East and the ongoing Ukraine-Russia confrontation, the US is being pulled into multiple fronts of tension. In a televised address last week, US President Joe Biden rallied the nation around fortifying the "arsenal of democracy" and championing the "cause of freedom". He further noted intentions to allocate an additional USD 100B towards new foreign aid and security spending. This funding is earmarked for multiple regions, including Ukraine, Israel, Indo-Pacific, and border security initiatives. The deficit, and by extension the bond supply, could burgeon further if new conflict zones emerge.
Balancing this overwhelming supply, the purchase of US securities by international holders isn't catching up. While countries like Japan and financial powerhouses such as London, Belgium, Luxembourg, Switzerland, the Cayman Islands, and Ireland continue to bolster their holdings, China and Hong Kong - the second-largest US creditors - appear to be trimming their positions. This shift is particularly significant as the Fed is concurrently embarking on a quantitative tightening journey.
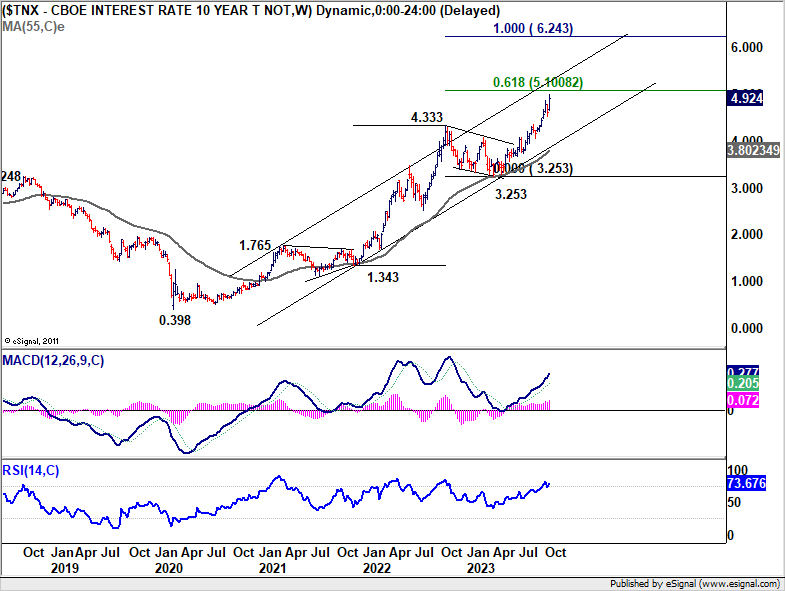
From a technical perspective, the current levels of 10-year yield were barely conceivable six months ago when rates were languishing below 3.5%. But today, the reality is different. TNX's up trend is now in progress to 61.8% projection of 1.343 to 4.333 from 3.253 at 5.100. A break there is likely, based on current momentum.
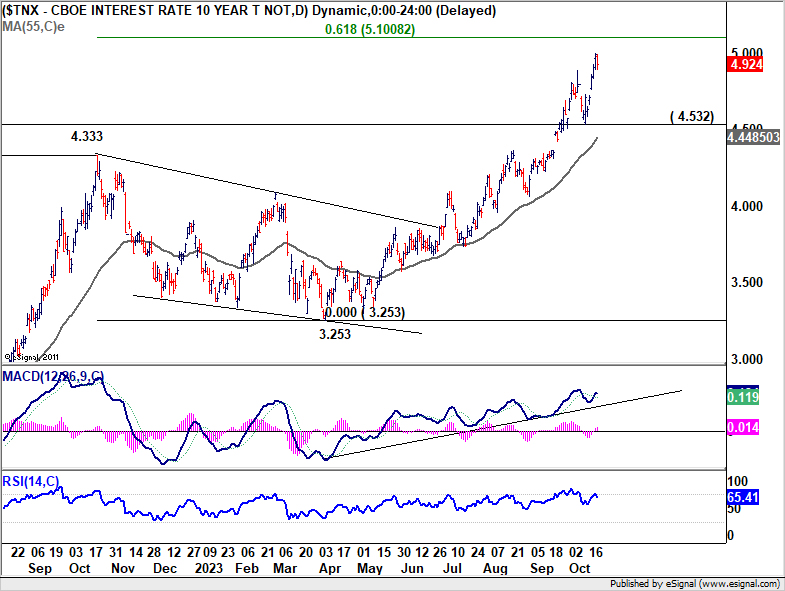
What remains to be seen is how the market will respond to the long-term channel resistance, currently approximated at around 5.25%. If this resistance proves robust and rejects further advances, it could indicate a stabilization of sorts for the US bond markets, suggesting the formation of a yield top. Conversely, if TNX manages to break through this critical resistance decisive, it could herald further upward acceleration, altering market dynamics and expectations profoundly.
Bear steepening of yield curve, while global stock markets reflect rising concerns
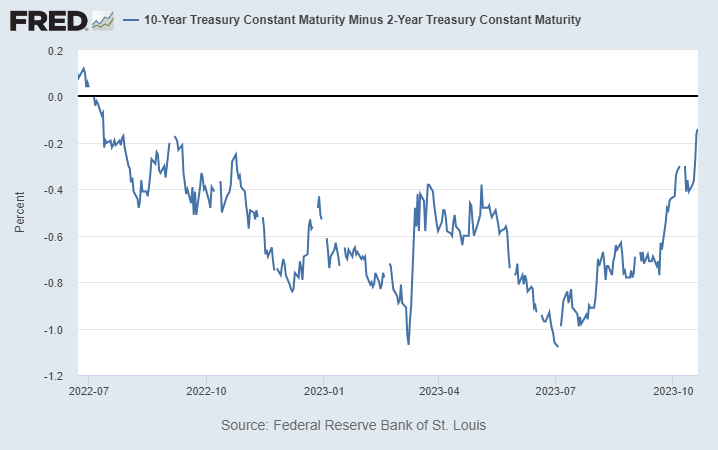
Another significant development must also be mentioned again. Some called it yield curve's "bear steepening", some call it "de-inverting." What ever it's called, US yield curve normalized swiftly again, with 10- to 2-yr spread narrowing to just -0.14, comparing to as much as -1.08 just in July.
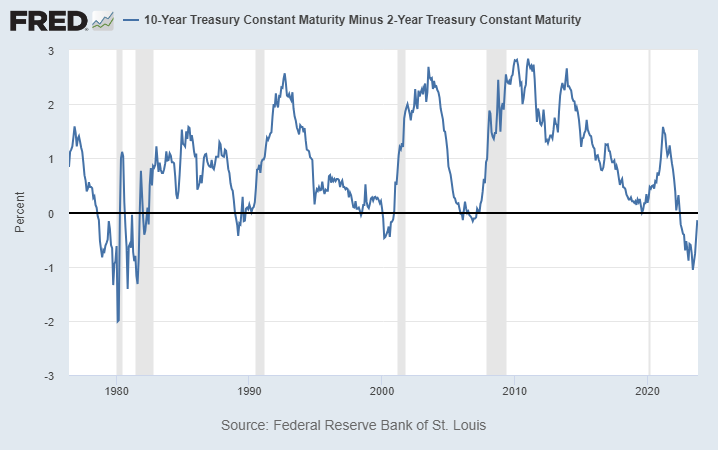
In the past four recessions in the US, before the recession begins, every single time, you see the un-inversion happening. That is the steepening occurs before the beginning of the recession.
A look at the global stock markets indicate bearish sentiment in brewing, which is inline with an upcoming recession in the US, and possibly a global one.
S&P 500's steep decline last week confirms rejection by falling 55 D EMA (now at 4367.44), keeping near term outlook bearish. Break of 4216.45 support should be seen very soon as fall from 4607.07 resumes. The key support level is in 38.2% retracement of 3491.58 to 4607.07 at 4180.95. Strong rebound from there would keep the up trend from 3491.58 intact. However, sustained break of 4180.95 would strengthen the case of trend reversal, and trigger downside acceleration to 61.8% retracement at 3917.70 next.
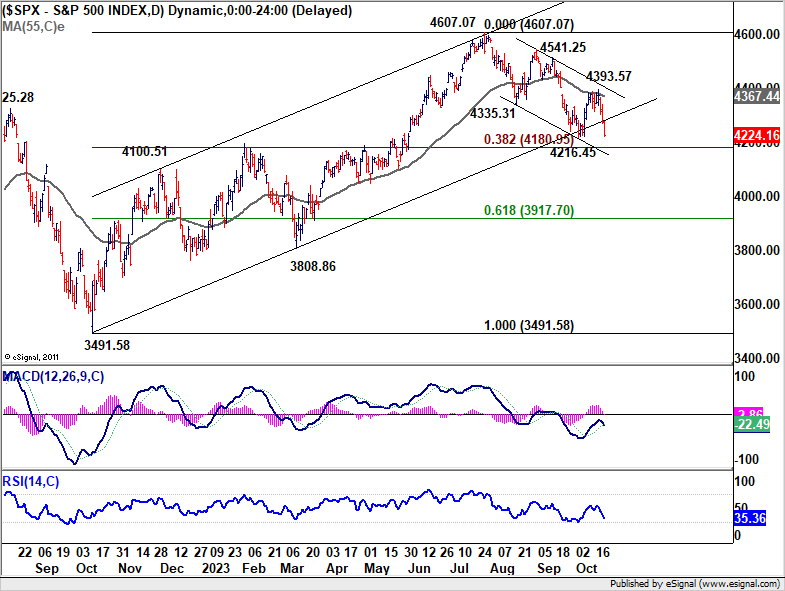
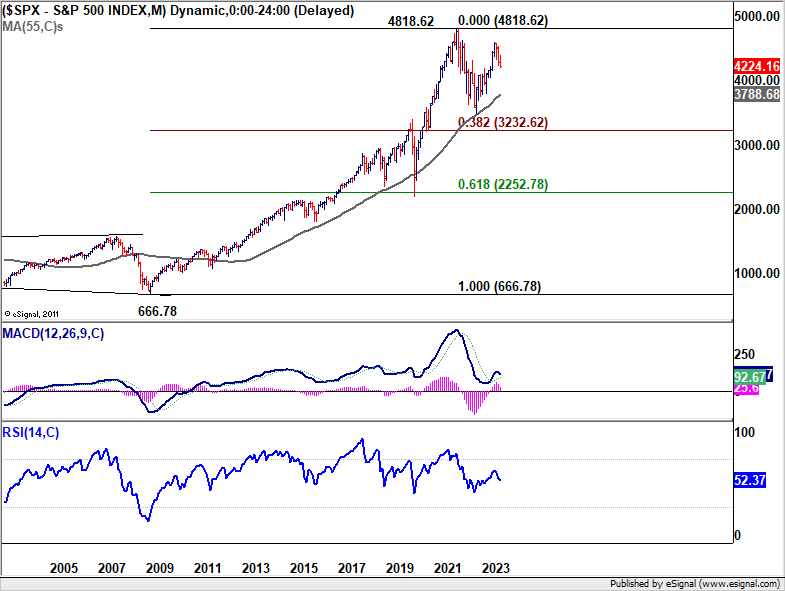
More importantly, if it turns out that the fall from 4670.07 is a medium term down trend, it could then be seen as the third leg of the long term corrective pattern from 4818.62 (2022 high). Next line of defense will be 55 M EMA (now at 3788.68). But SPX might need to take on 38.2% retracement of 666.78 (2009 low) to 4818.62 at 3232.62 before completing the pattern.
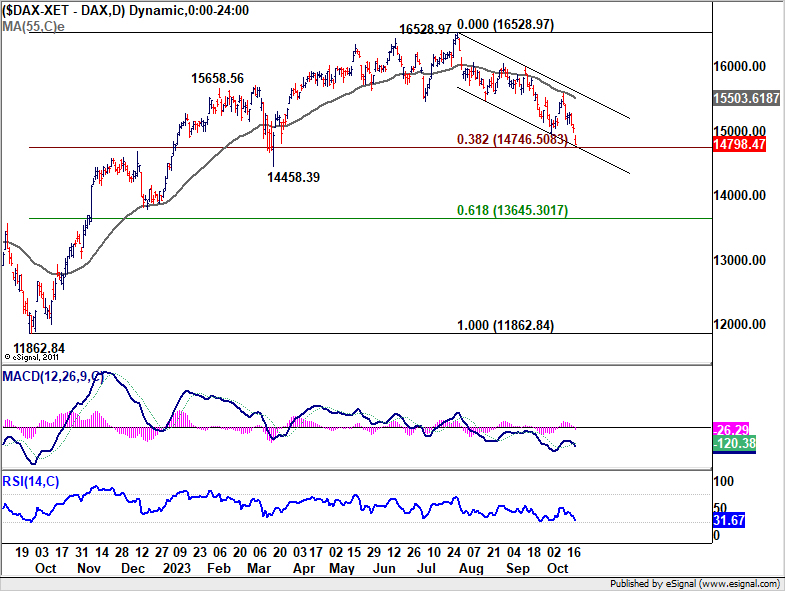
DAX resumed the decline from 16528.97 last week. Near term outlook is kept bearish with prior rejection by falling 55 D EMA (now at 15503.61). Immediate focus is now on 38.2% retracement of 11862.84 to 16528.97 at 14746.50. Strong rebound from this level will keep the up trend from 11862.84 intact. However, sustained break will raise the chance of trend reversal and target 61.8% retracement at 13645.30.
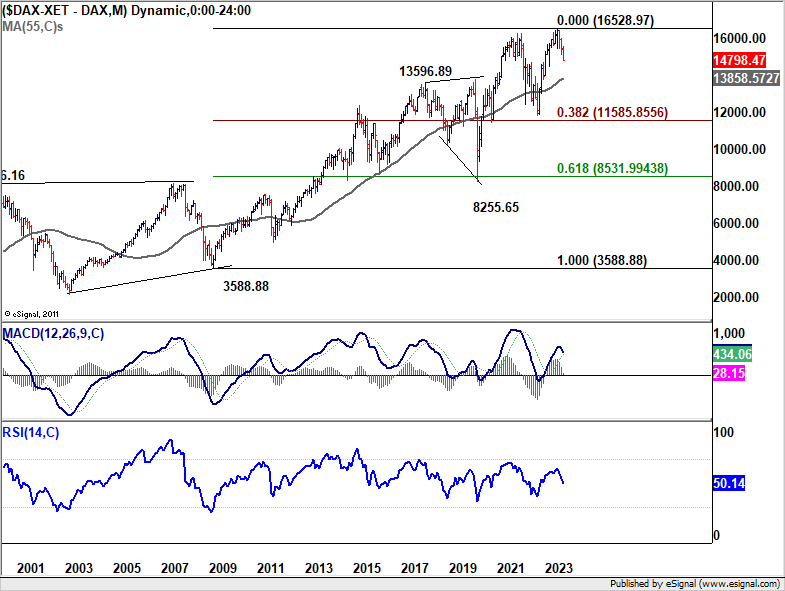
In the bearish case for DAX, fall from 16528.97 could extend to 38.2% retracement of 3588.88 (2009 low) to 16528.97 at 11585.85), which is close to 11862.84 support, before finding a bottom.
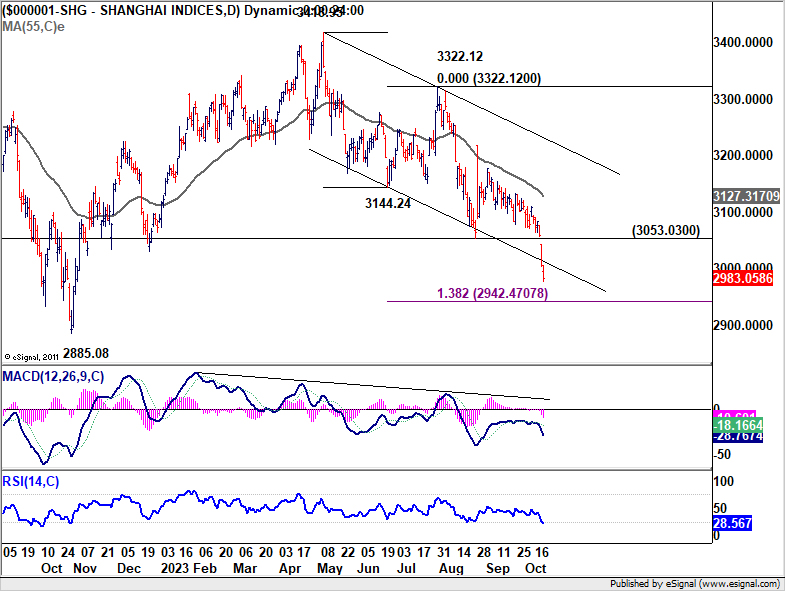
The selloff in Chinese stocks was even worse as Shanghai SSE broke below 3000 psychological level for the first time in nearly a year. Ongoing troubles in the real estate sector have affected the risk appetite. Rising bond yields around the world weighed on the Chinese market as well. Morgan Stanley also issued a noted advising investors against buying the dip in Chinese stock. It pointed out that foreign investors' outflow has entered "an unprecedented stage."
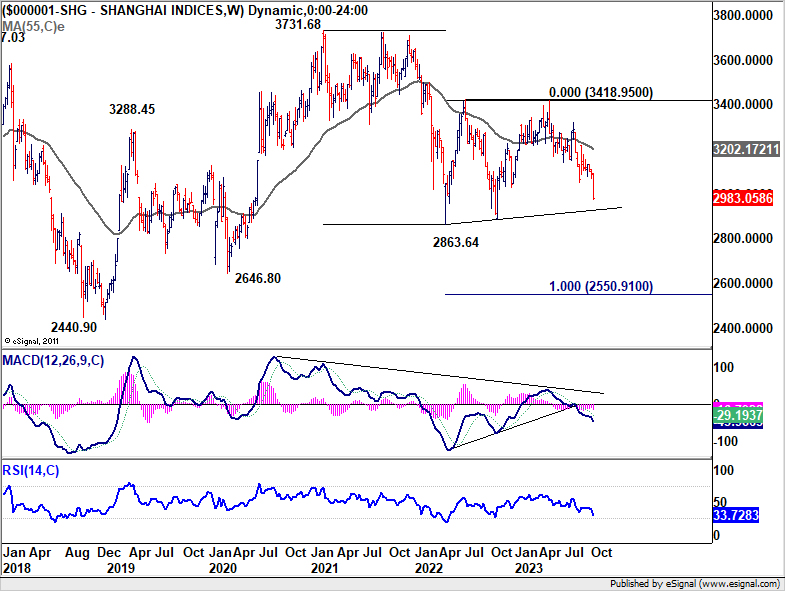
Technically, the break of medium term channel support in SSE indicates downside acceleration. Near term outlook will remain bearish as long as 3053.03 support turned resistance holds. Next target is 138.2% projection of 3418.95 to 3144.24 from 3322.12 at 2942.47.
More importantly, it's possible that fall from 3148.95 is resuming whole down trend from 3731.68. Firm break could 2863.63 support could set the stage for deeper medium term decline to 100% projection of 3731.68 to 2863.64 from 3418.95 at 2550.91.
Dollar index continued near term consolidations, but stays bullish
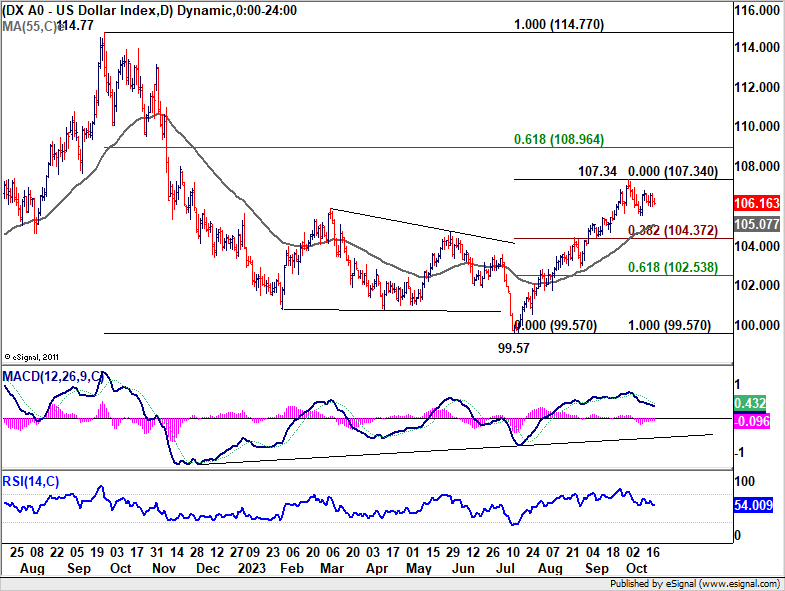
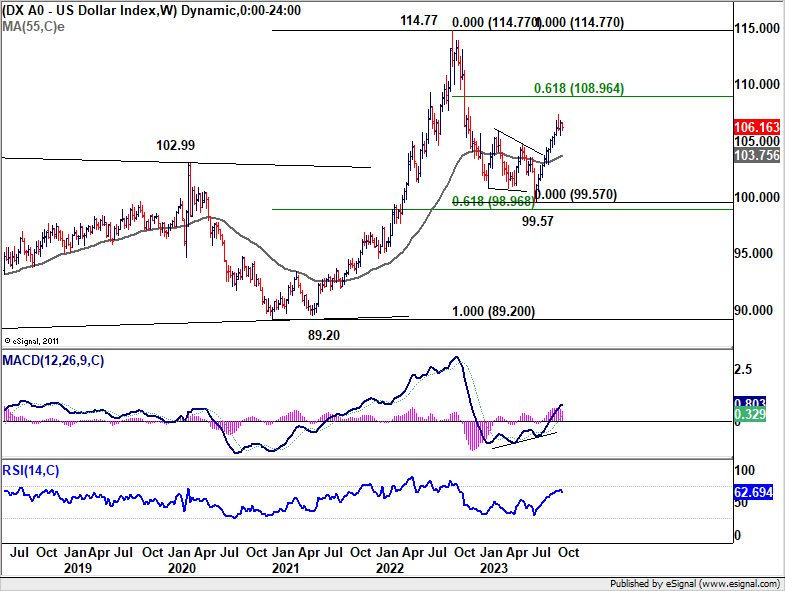
Despite the tumultuous nature of last week's financial markets characterized by escalating yields and intensifying risk aversion, Dollar Index remained relatively unmoved, just engaged in sideway trading below 107.34 short term top.
This inertia, however, isn't an indication of weakened prospects. The bullish outlook on Dollar Index remains steadfast. Rising yields and heightened sense of market trepidation are anticipated to floor Dollar's retreat and could potentially underpin a resurgence in its value at a subsequent stage.
While deeper pull back cannot be ruled out, downside should be contained by 38.2% retracement of 99.57 to 107.34 at 104.37 to bring rebound. On the other hand, above 107.34 will resume the rise from 99.57 to 61.8% retracement of 114.77 to 99.57 at 108.96.
Will Swiss Franc's safe haven allure challenge SNB's intervention approach?
Swiss Franc magnified its allure as the safe-haven asset of choice last week, outperforming even the resilient Euro.
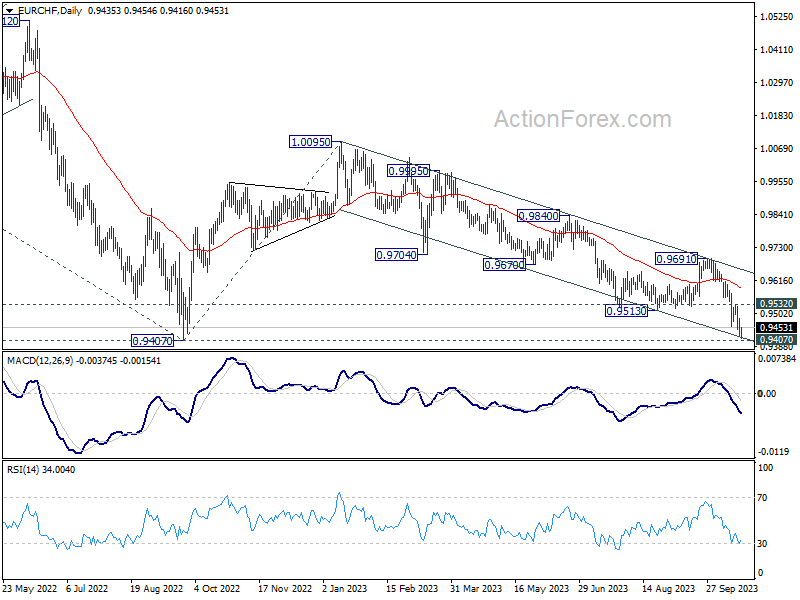
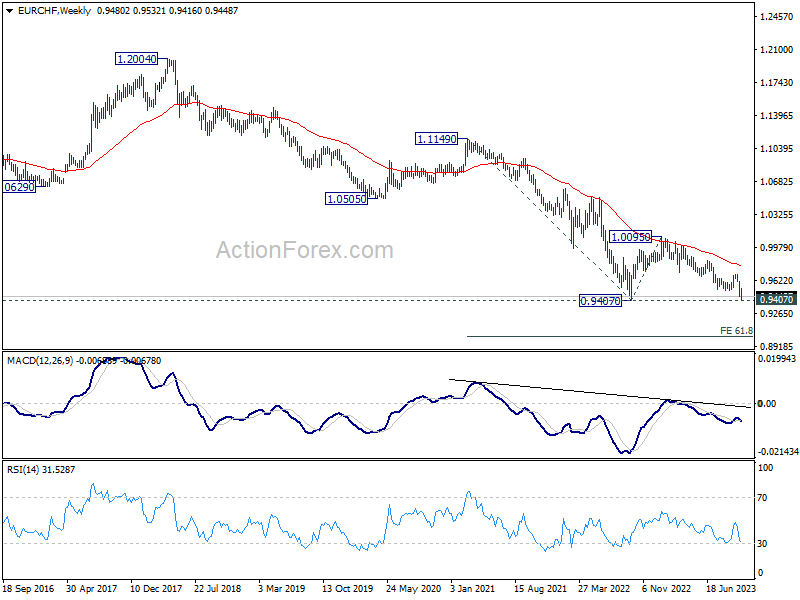
EUR/CHF resumed the down trend from 1.0095 and it's now pressing 0.9407 key support level. Strong bounce from the current level, followed by break of 0.9532 resistance, will temporarily neutralize bearishness and indicates stabilization in the cross.
However, decisive break of 0.9407 will confirm resumption of whole down trend from 1.2004 (2018 high). Next target will be 61.8% projection of 1.1149 to 0.9407 from 1.0095 at 0.9018.
A pivotal aspect deserving of meticulous attention in this unfolding narrative is SNB's strategic posture. The institution has consistently signaled its intention to remain "active" in the foreign exchange arena.
Interestingly, SNB's current activities focus on selling foreign assets, effectively "purchasing" the Franc. This strategy is primarily aimed at mitigating impact of imported inflation. This is a marked departure from their approach during the global financial crisis when the emphasis was on offloading the Franc to stem its appreciation.
It's noteworthy that a reversal in SNB's strategy, especially in light of break of 0.9407 support in EUR/CHF and further downside acceleration, could send clear signals to the market that something more substantial is happening, globally.
EUR/USD Weekly Outlook
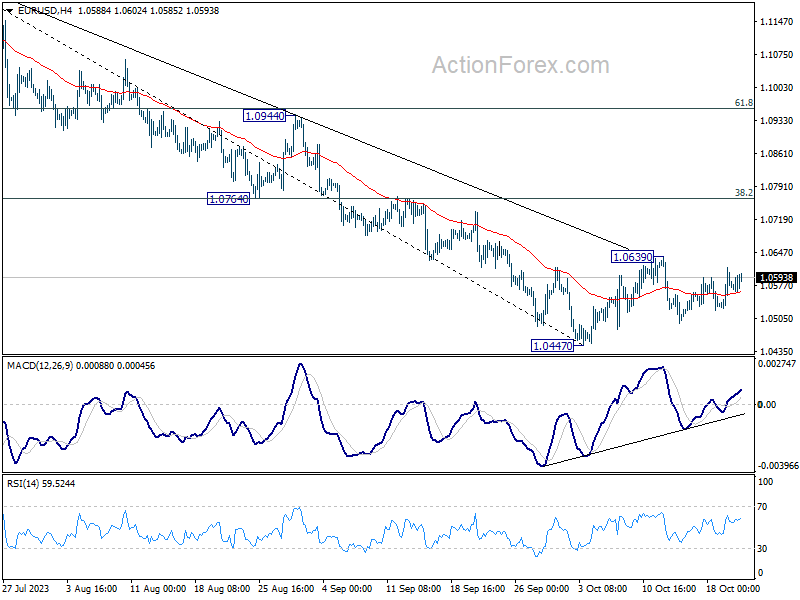
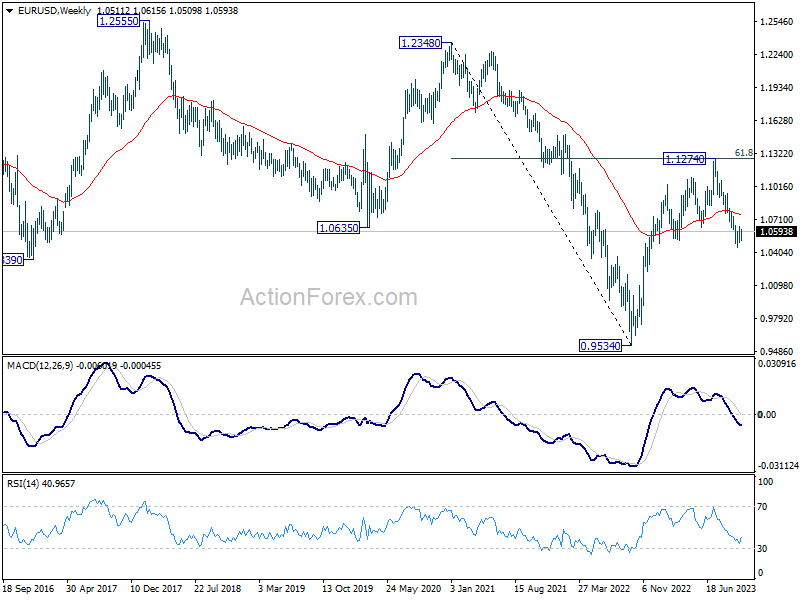
EUR/USD continued to engage in sideway trading last week and outlook is unchanged. Initial bias remains neutral this week first, and downside breakout is in favor. On the downside, firm break of 1.0447 will resume whole fall from 1.1274 and target 1.0199 fibonacci level. On the upside, however, break of 1.0639 turn bias to the upside for 1.0764 cluster resistance (38.2% retracement of 1.1274 to 1.0447 at 1.0763).
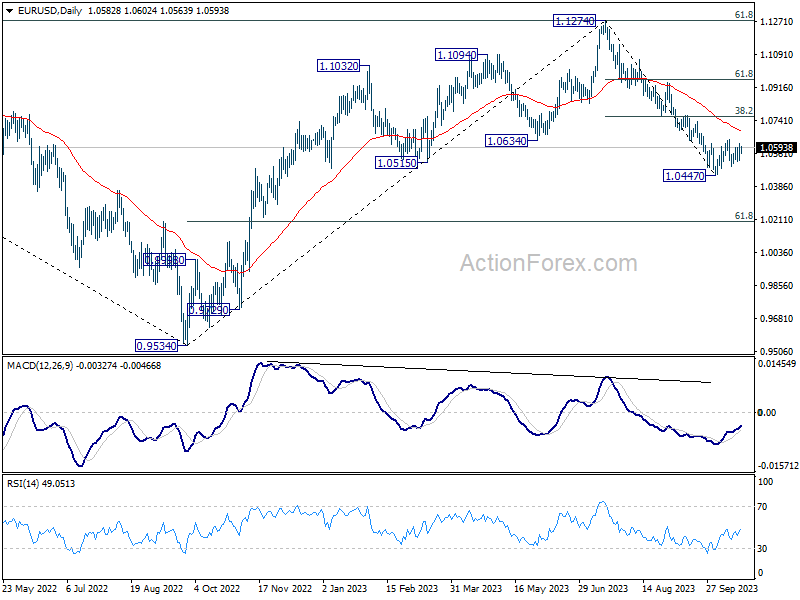
In the bigger picture, fall from 1.1274 medium term top could still be a correction to rise from 0.9534 (2022 low). But chance of a complete trend reversal is rising. In either case, current fall should target 61.8% retracement of 0.9534 to 1.1274 at 1.0199 next. For now, risk will stay on the downside as long as 55 D EMA (now at 1.0684) holds, in case of rebound.
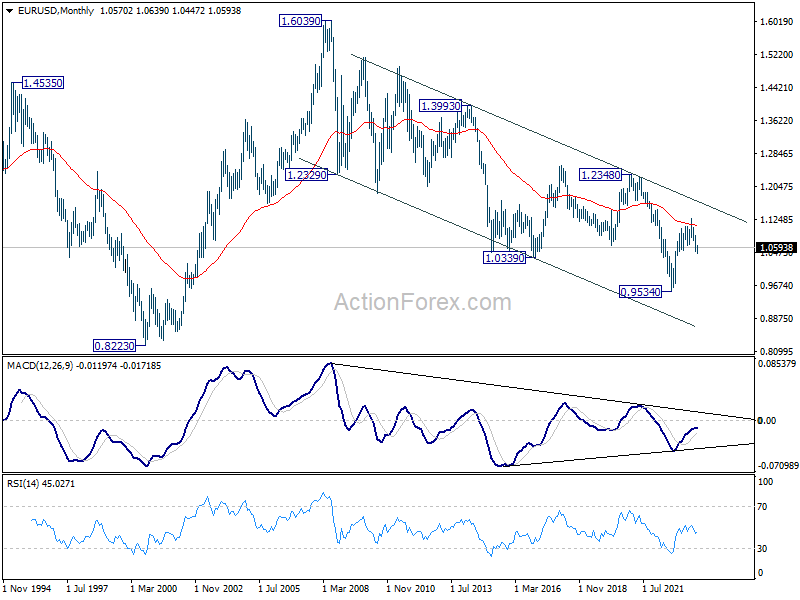
In the long term picture, there is no clear sign of trend reversal yet. That is, down trend from 1.6039 (2008 high) might still be in progress. Rejection by 55 M EMA (now at 1.1087) will retain long term bearishness, for another fall through 0.9534 at a later stage.
EUR/USD Weekly Outlook
EUR/USD continued to engage in sideway trading last week and outlook is unchanged. Initial bias remains neutral this week first, and downside breakout is in favor. On the downside, firm break of 1.0447 will resume whole fall from 1.1274 and target 1.0199 fibonacci level. On the upside, however, break of 1.0639 turn bias to the upside for 1.0764 cluster resistance (38.2% retracement of 1.1274 to 1.0447 at 1.0763).
In the bigger picture, fall from 1.1274 medium term top could still be a correction to rise from 0.9534 (2022 low). But chance of a complete trend reversal is rising. In either case, current fall should target 61.8% retracement of 0.9534 to 1.1274 at 1.0199 next. For now, risk will stay on the downside as long as 55 D EMA (now at 1.0684) holds, in case of rebound.
In the long term picture, there is no clear sign of trend reversal yet. That is, down trend from 1.6039 (2008 high) might still be in progress. Rejection by 55 M EMA (now at 1.1087) will retain long term bearishness, for another fall through 0.9534 at a later stage.
USD/JPY Weekly Outlook
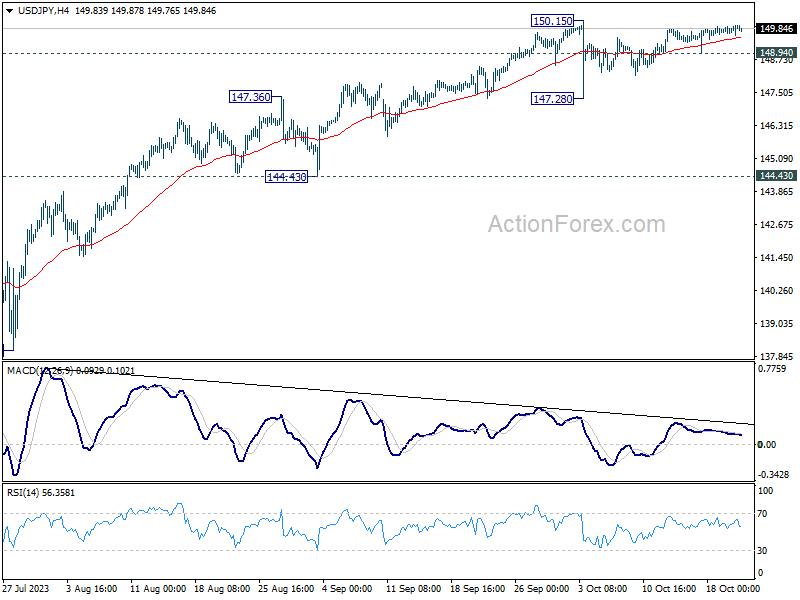
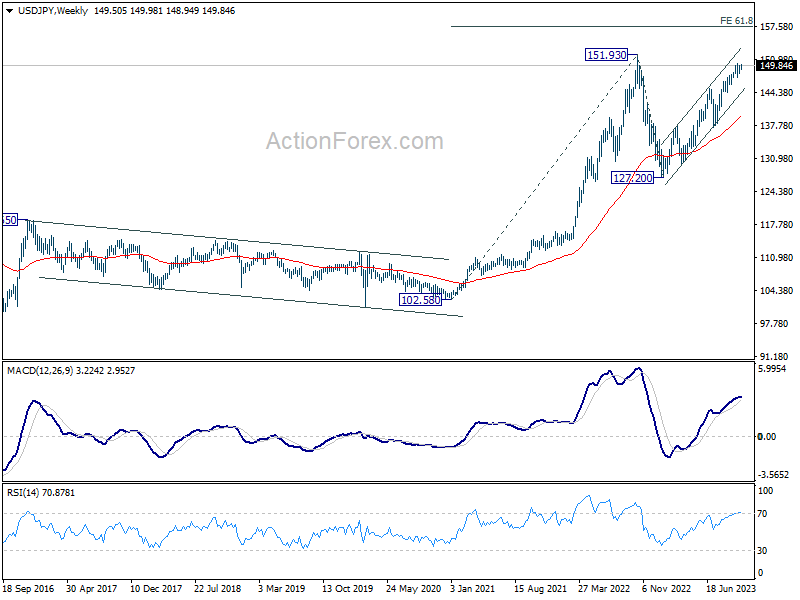
USD/JPY gyrated higher last week but stayed in range below 150.15 resistance. Initial bias remains neutral this week first. On the downside, below 148.94 minor support will turn bias to the downside for another down leg towards 147.28. On the upside, firm break of 150.15 will resume larger up trend to test 151.93 high.
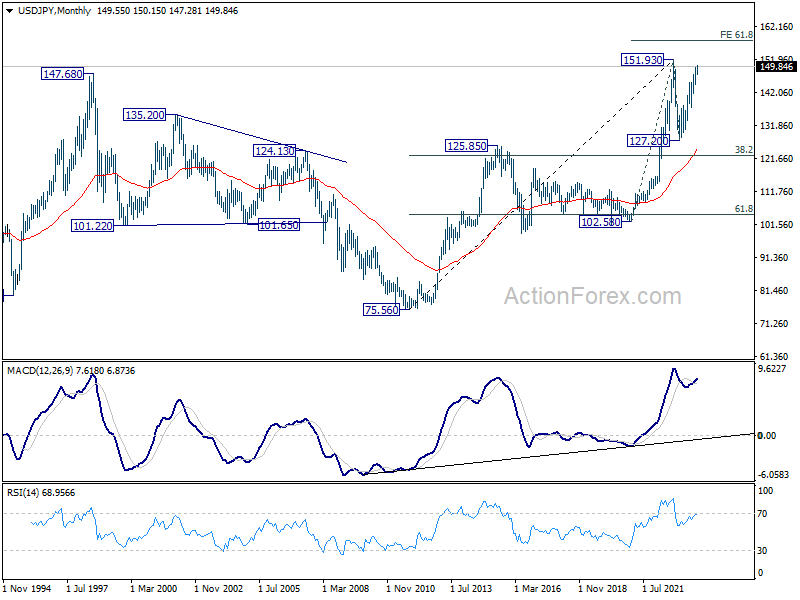
In the bigger picture, while rise from 127.20 is strong, it could still be seen as the second leg of the corrective pattern from 151.93 (2022 high). Rejection by 151.93, followed by sustained break of 145.06 resistance turned support will be the first sign that the third leg of the pattern has started. However, sustained break of 151.93 will confirm resumption of long term up trend.
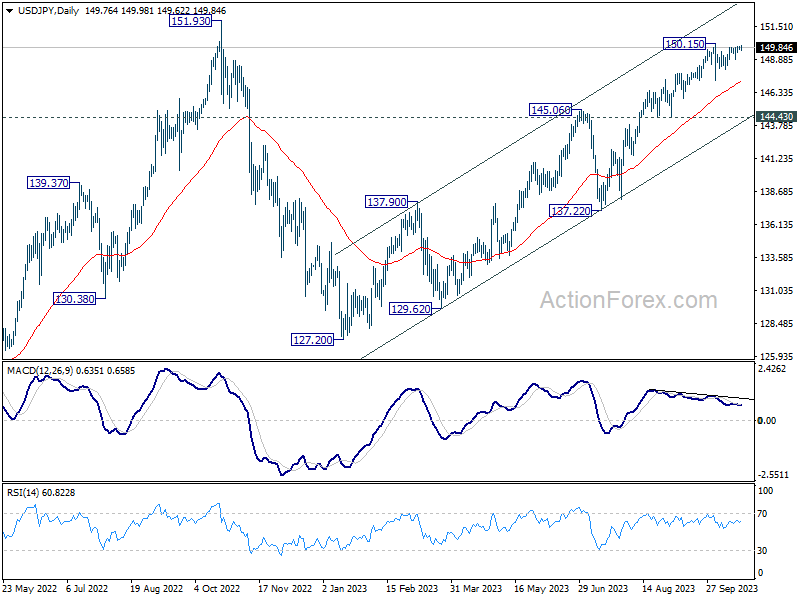
In the long term picture, price action from 151.93 is seen as developing into a corrective pattern to up trend from 75.56 (2011 low). Another falling leg could be seen, but in that case, downside should be contained by 38.2% retracement of 75.56 to 151.93 at 122.75. On resumption, next target would be 61.8% projection of 102.58 to 151.93 from 127.20 at 157.69.
GBP/USD Weekly Outlook
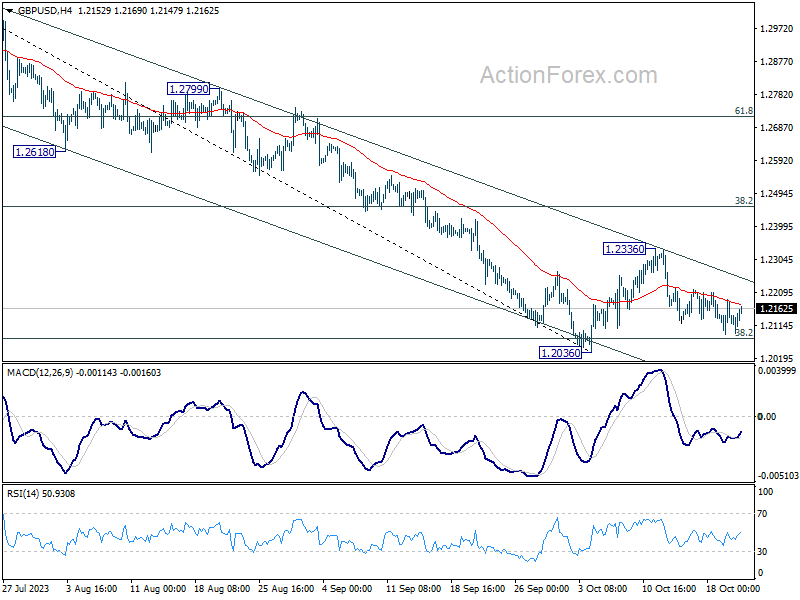
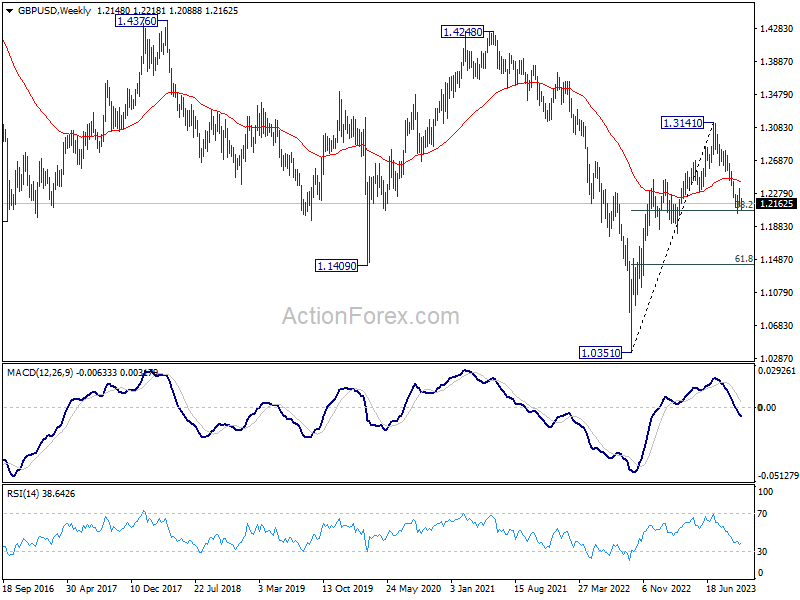
GBP/USD extended the consolidation pattern from 1.2036 last week and outlook is unchanged. Initial bias remains neutral this week first and downside breakout is in favor. Break of On the downside, decisive break of 1.2036 will resume whole decline from 1.3141 for 1.1801 support next. However, break of 1.2336 will turn bias back to the upside for 38.2% retracement of 1.3141 to 1.2036 at 1.2458.
In the bigger picture, fall from 1.3141 medium term top could still be a correction to up trend from 1.0351 (2022 low) only. But risk of complete trend reversal is rising. Sustained break of 38.2% retracement of 1.0351 to 1.3141 at 1.2075 will pave the way to 61.8% retracement at 1.1417. For now, risk will stay on the downside as long as 55 D EMA (now at 1.2384) holds, in case of rebound.
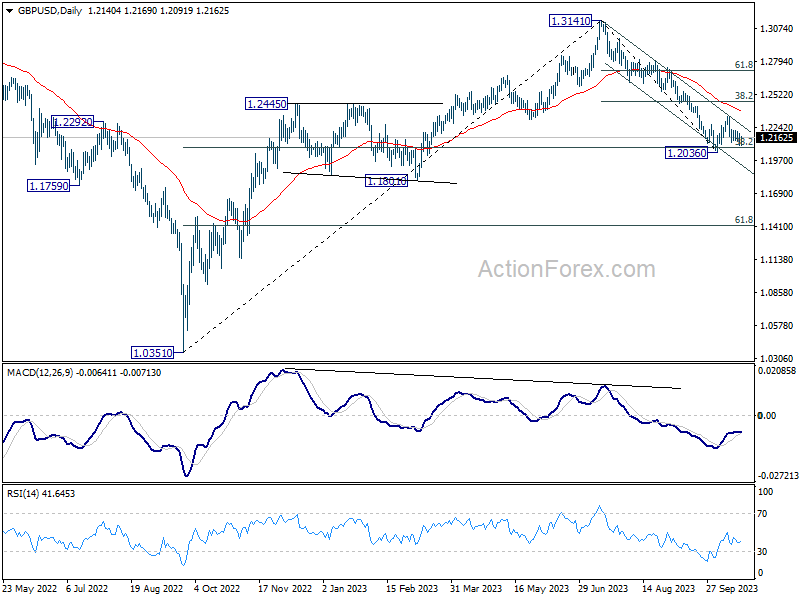
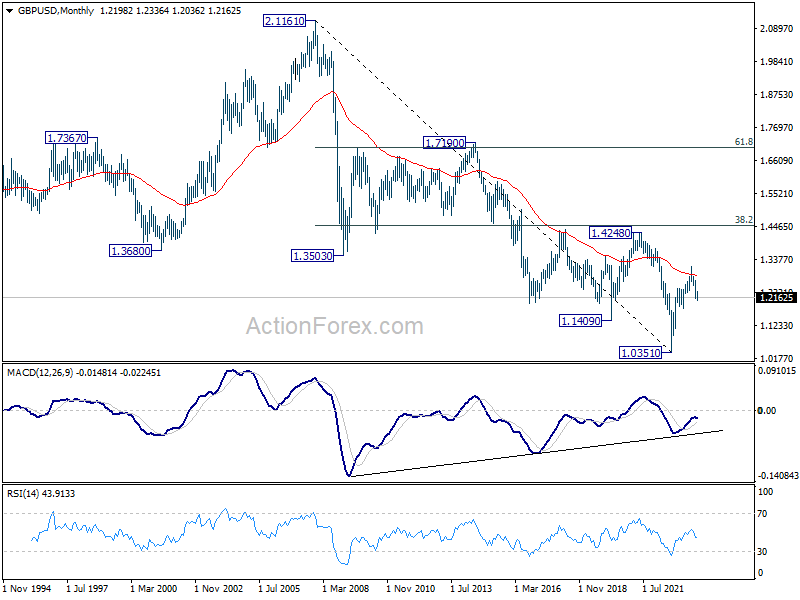
In the long term picture, there is no clear sign of trend reversal yet. Rise from 1.0351 could be part of a consolidation pattern to down trend from 2.1161 (2007 high). Rejection by 55 M EMA (now at 1.2900) will retain long term bearishness for extending the down trend at a later stage.
USD/CHF Weekly Outlook
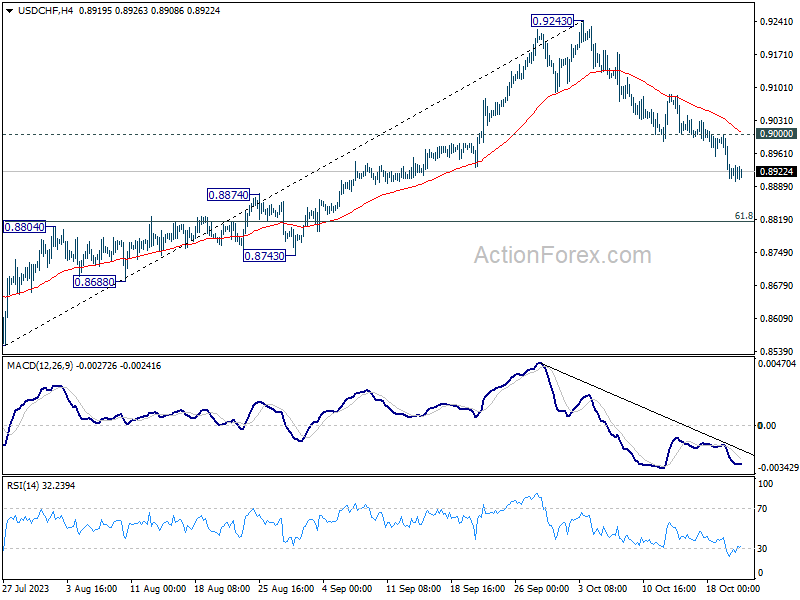
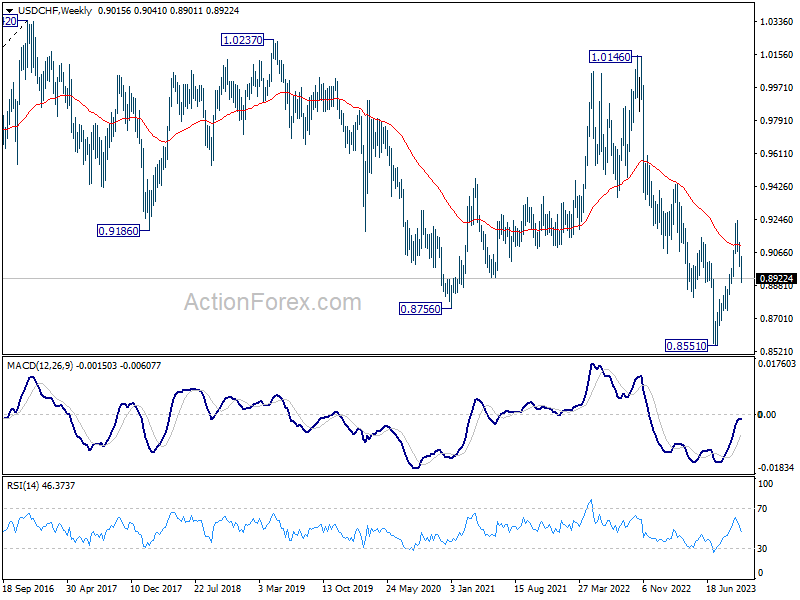
USD/CHF's fall from 0.9243 extended lower last week and the development raises the chance that rise from 0.8551 has completed. In any case, deeper decline is now in favor as long as 0.9000 resistance holds. Next target is 61.8% retracement of 0.8551 to 0.9243 at 0.8815 next. Sustained break there will pave the way to retest 0.8551 low.
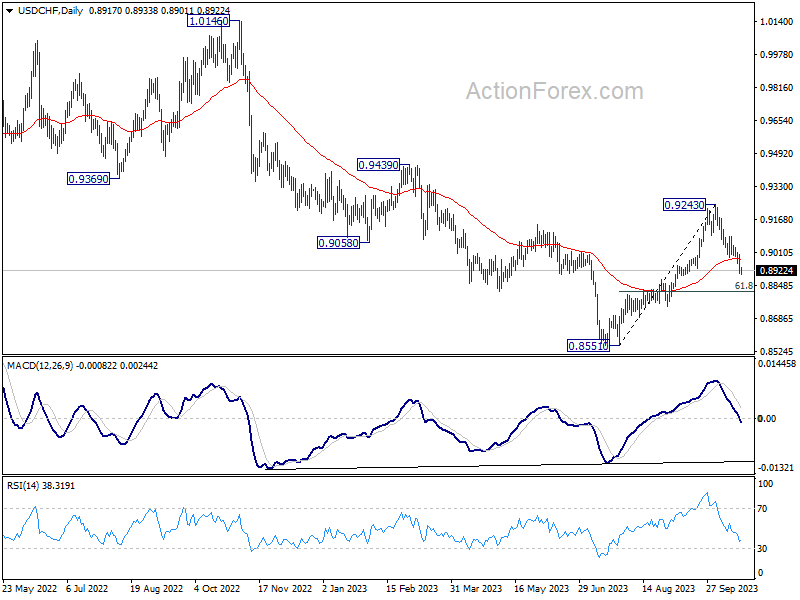
In the bigger picture, the firm break of 55 D EMA (now at 0.8974) argues that rebound from 0.8551 might be completed as a correction at 0.9243. In other words, larger fall from 1.0146 (2022 high) is possibly not over yet. Risk will now stay on the downside as long as 0.9243 resistance holds. Firm break of 0.8551 will confirm down trend resumption.
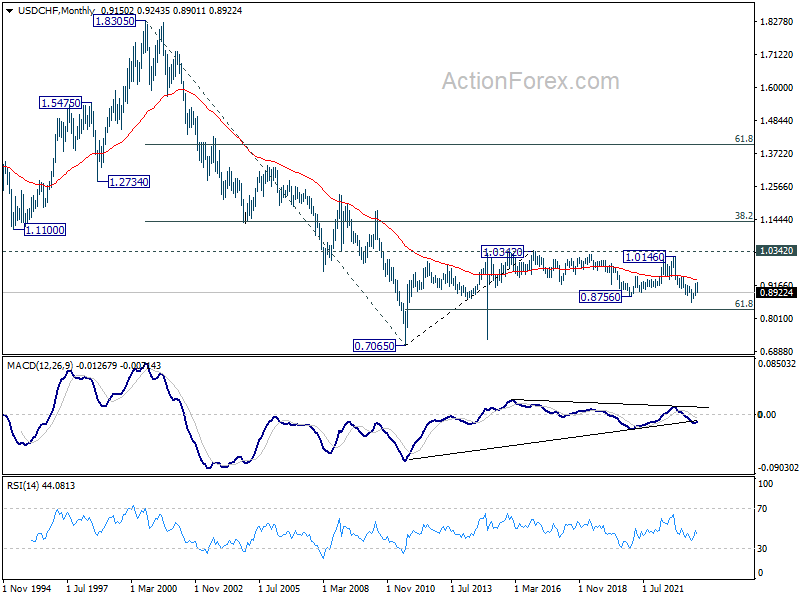
In the long term picture, there is no clear sign that down trend from 1.8305 (2000 high) has completed. With 38.2% retracement of 1.8305 to 0.7065 at 1.1359 intact, outlook is neutral at best.
AUD/USD Weekly Report
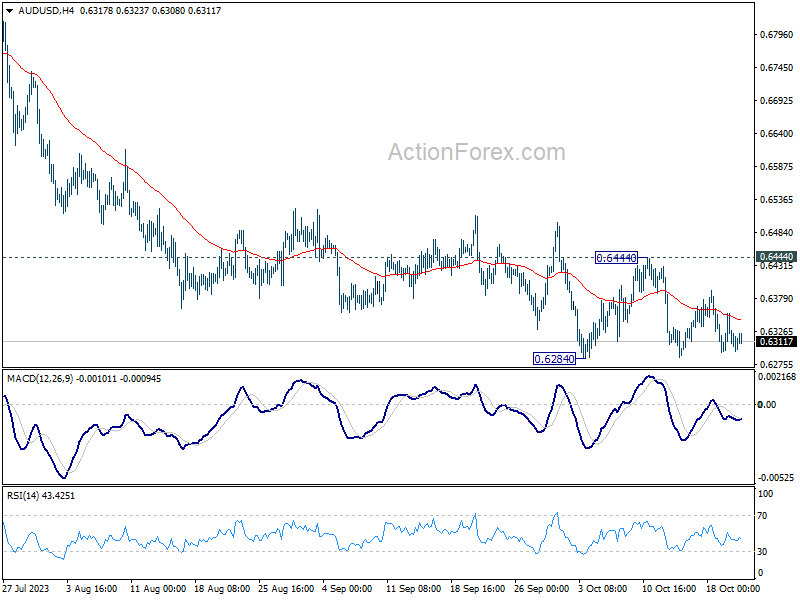
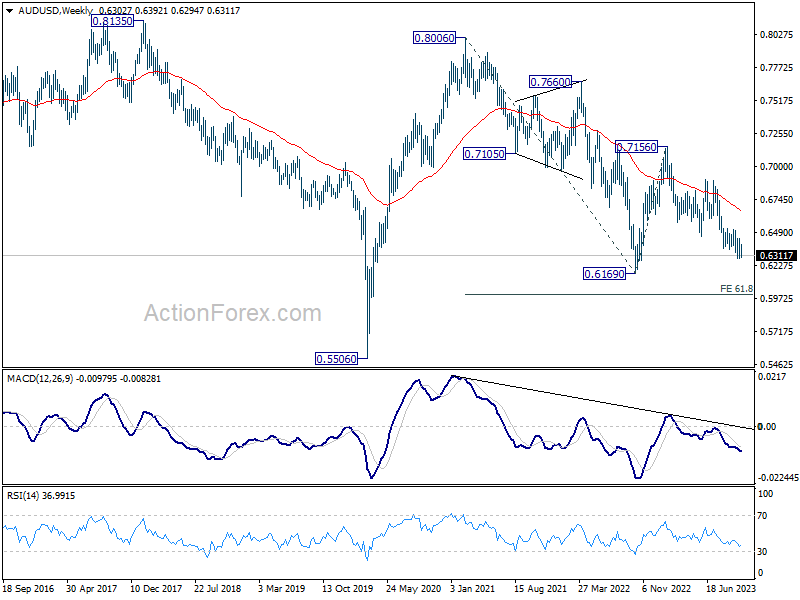
AUD/USD stays in consolidation from 0.6284 last week and outlook is unchanged. Initial bias remains neutral this week and further fall is expected. Break of 0.6284 will resume whole fall from 0.7156. Next target is 100% projection of 0.7156 to 0.6457 from 0.6894 at 0.6195, which is close to 0.6169 medium term support.
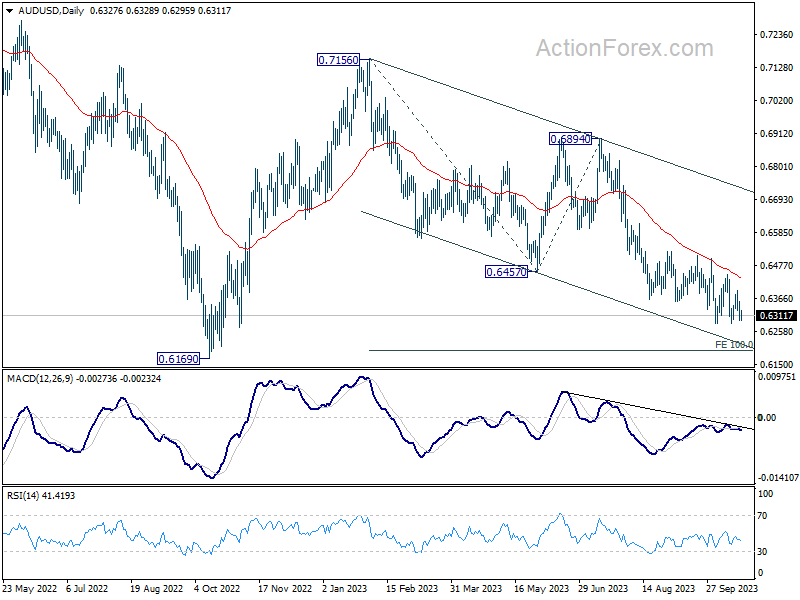
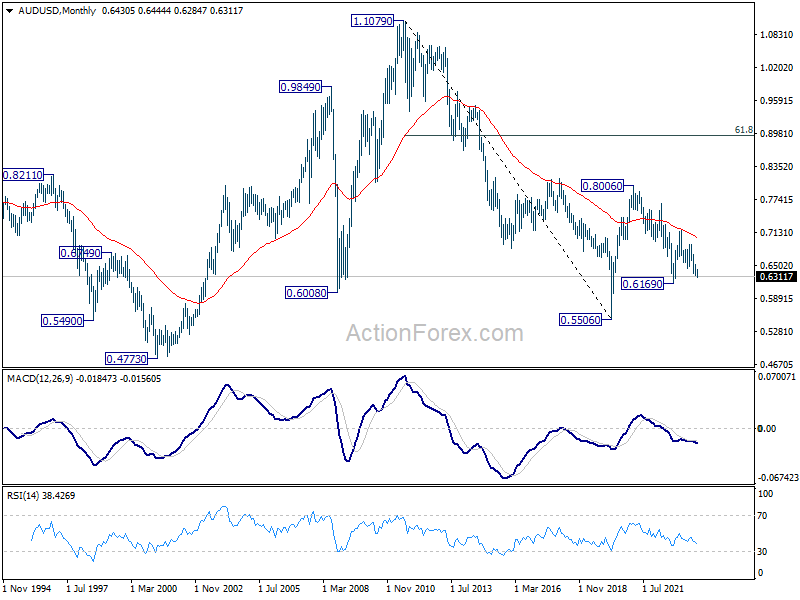
In the bigger picture, down trend from 0.8006 (2021 high) is possibly still in progress. Decisive break of 0.6169 will target 61.8% projection of 0.8006 to 0.6169 to 0.7156 at 0.6021. This will now remain the favored case as long as 0.6894, in case of strong rebound.
In the long term picture, while fall from 0.8006 might extend lower, the structure argues that it's merely a correction to rise from 0.5506 (2020 low). In case of downside extension, strong support should emerge above 0.5506 to bring reversal. But still, momentum of the next move will be monitored to adjust the assessment.
USD/CAD Weekly Outlook
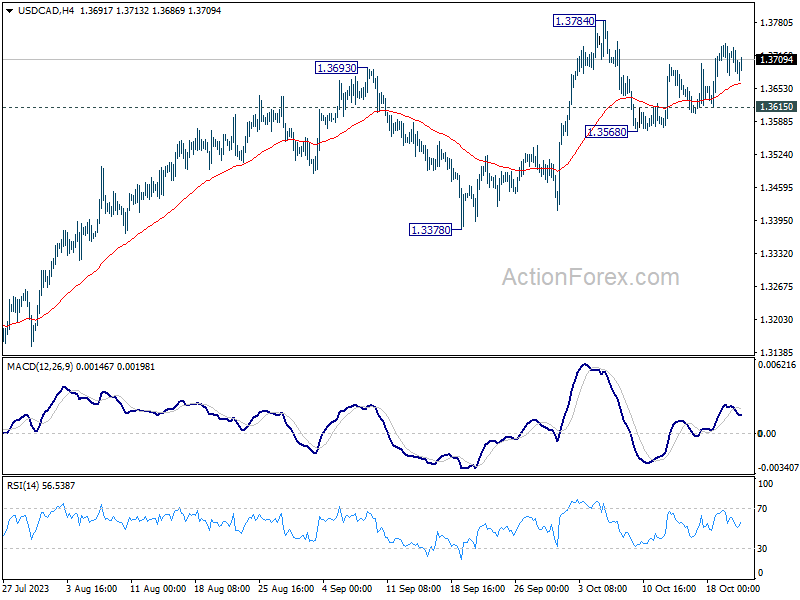
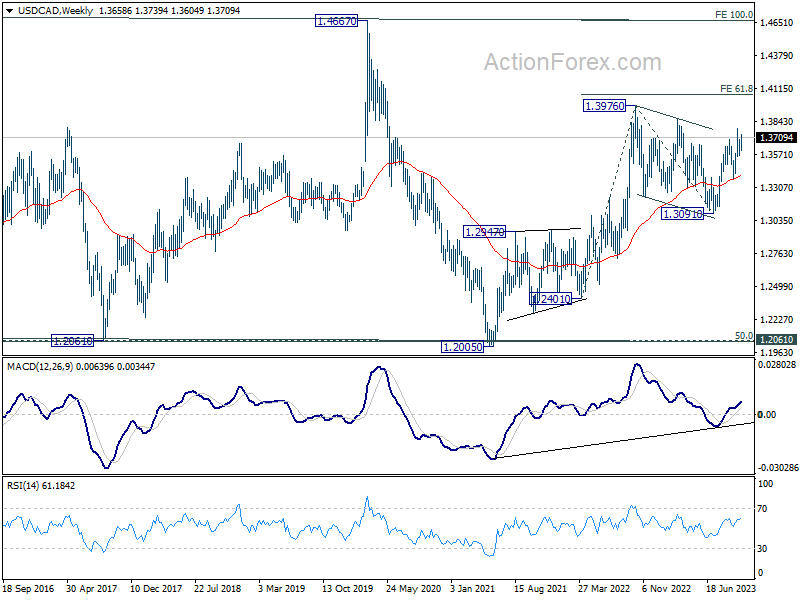
USD/CAD's recovery from 1.3680 extended higher last but quickly lost momentum. Initial bias is turned neutral this week first. On the upside, decisive break of 1.3784 resistance will resume the rise from 1.3091 to retest 1.3976 high. On the downside, however, break of 1.3615 support will bring another falling leg to extend the near term corrective pattern from 1.3784.
In the bigger picture, current development revives the case that corrective pattern from 1.3976 (2022 high) has completed with three waves down to 1.3091. Decisive break of 1.3976 high will confirm resumption of up trend from 1.2005 (2021 low). Next target will be 61.8% projection of 1.2401 to 1.3976 from 1.3091 at 1.4064. This will now remain the favored case as long as 1.3378 support holds.
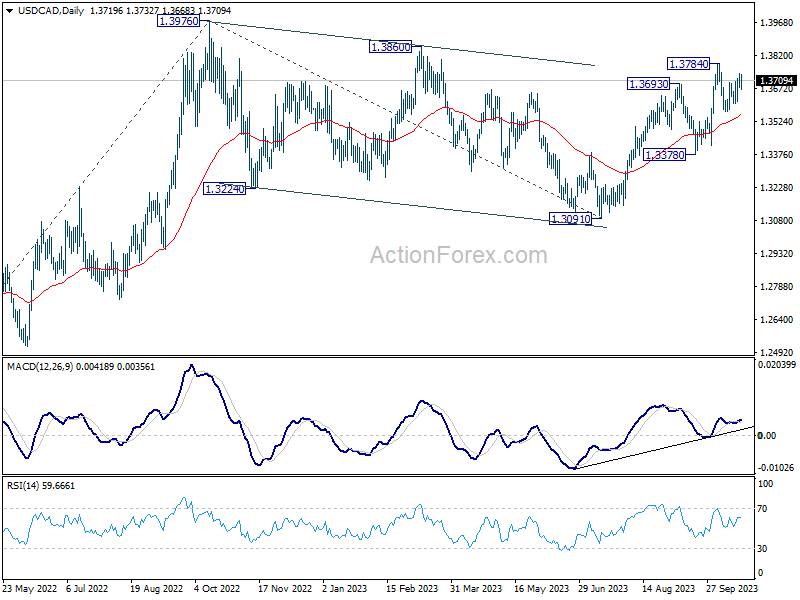
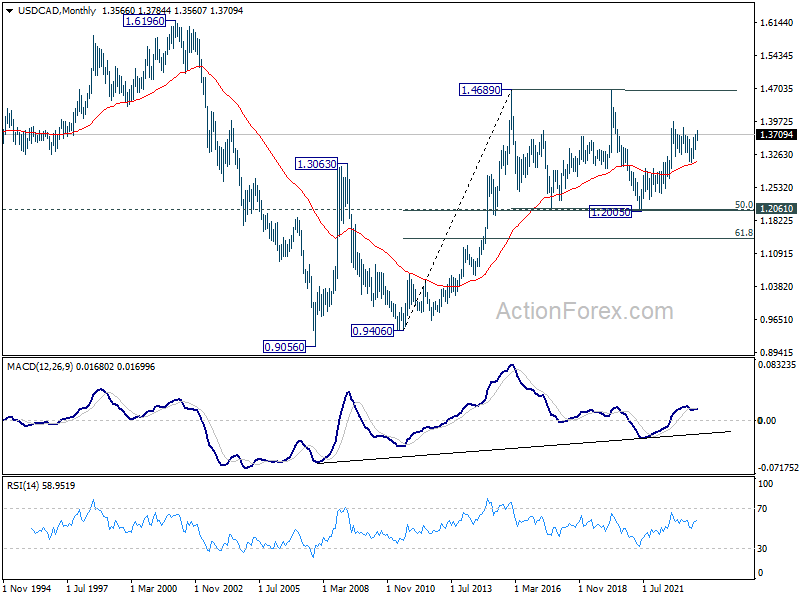
In the longer term picture, price actions from 1.4689 (2016 high) are seen as a consolidation pattern only, which might have completed at 1.2005. That is, up trend from 0.9506 (2007 low) is expected to resume at a later stage. This will remain the favored case as 55 M EMA (now at 1.3100) holds.
GBP/JPY Weekly Outlook
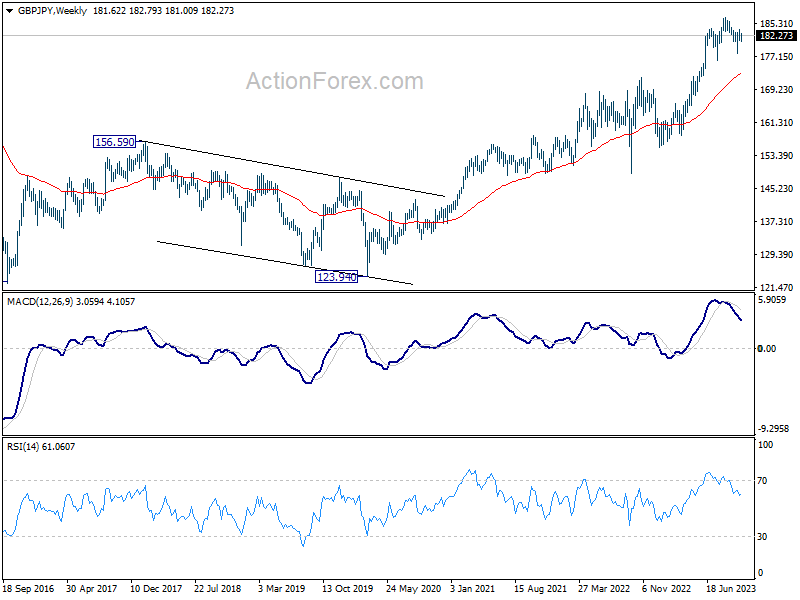
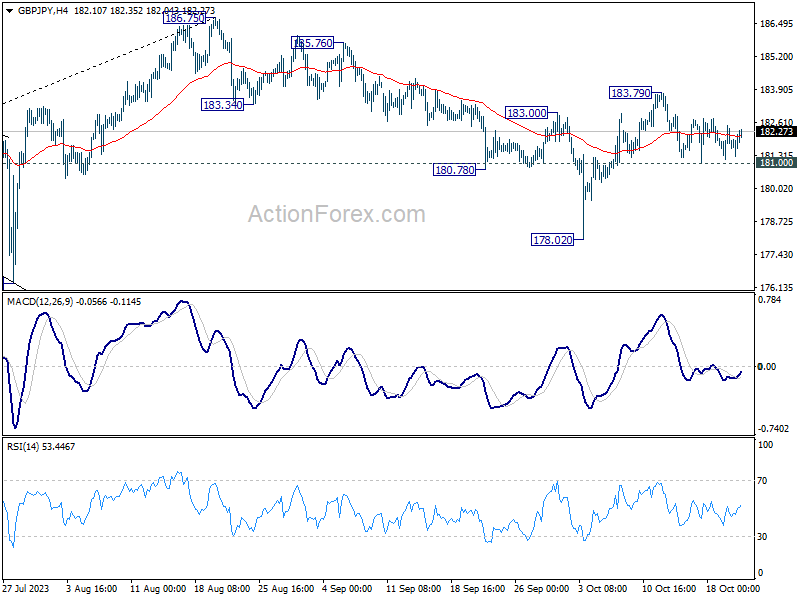
GBP/JPY stays in sideway trading below 183.79 last week and outlook is unchanged. Initial bias remains neutral this week first. The favored case is still that correction from 186.75 has completed at 178.02. Above 183.79 will resume the rise from 178.02 to retest 186.75 high. However, break of 181.00 will dampen this view, and turn bias back to the downside for 178.02 instead.
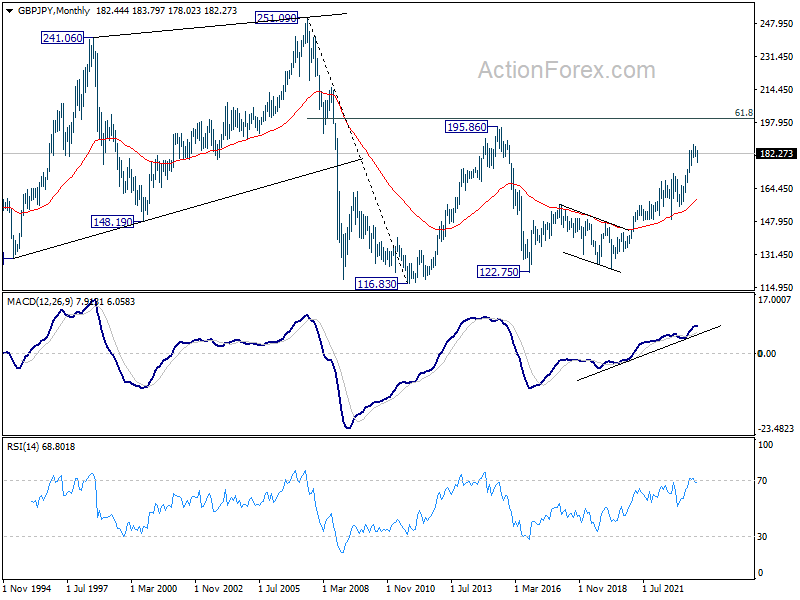
In the bigger picture, fall from 186.75 is seen as a corrective move only. As long as 176.29 support holds, larger up trend from 123.94 (202 low) should still be in progress. Break of 186.75 will target 195.86 (2015 high). Nevertheless, firm break of 176.29 will confirm medium term topping, and bring lengthier and deeper consolidations.
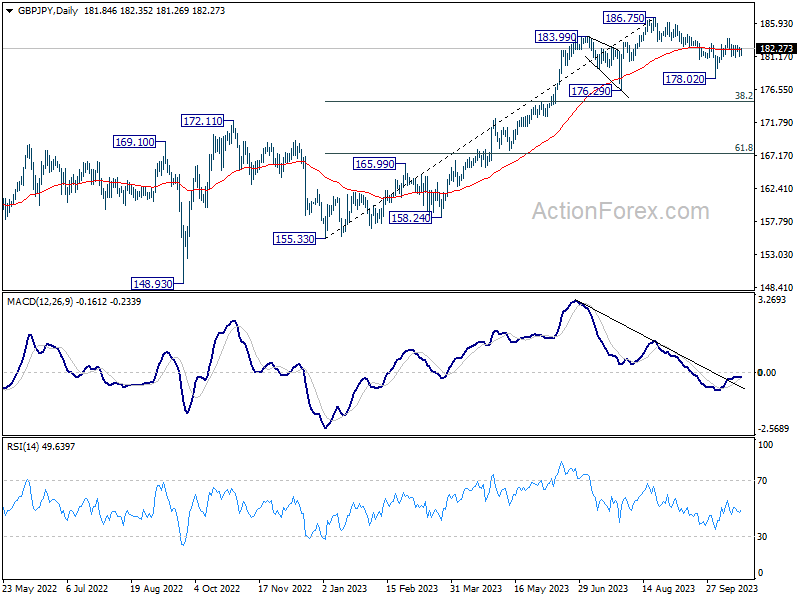
In the longer term picture, rise from 122.75 (2016 low) in still in progress but started losing upside momentum as seen in W MACD. Further rise will remain in favor, though, as long as 176.29 support holds, to retest 195.86 (2015 high).