Sample Category Title
EUR/JPY Daily Outlook
Daily Pivots: (S1) 158.30; (P) 158.62; (R1) 159.05; More....
Intraday bias in EUR/JPY stays mildly on the upside for the moment. Further rise would be seen to retest 159.75 resistance. Decisive break there will resume larger up trend. On the downside, break of 157.03 support is needed to signal completion of the rebound. Otherwise, further rally will remain in favor in case of retreat.
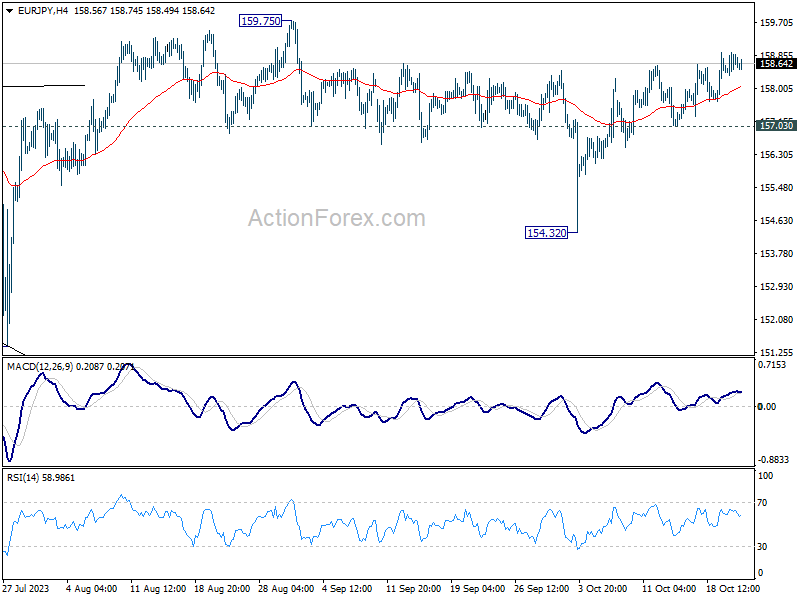
In the bigger picture, price actions from 159.75 are views as a corrective pattern. As long as 151.39 support holds, rise from 114.42 (2020 low) is expected to continue through 159.75. Next target will be 100% projection of 124.37 to 148.38 from 139.05 at 163.06.
GBP/JPY Daily Outlook
Daily Pivots: (S1) 181.60; (P) 181.98; (R1) 182.67; More...
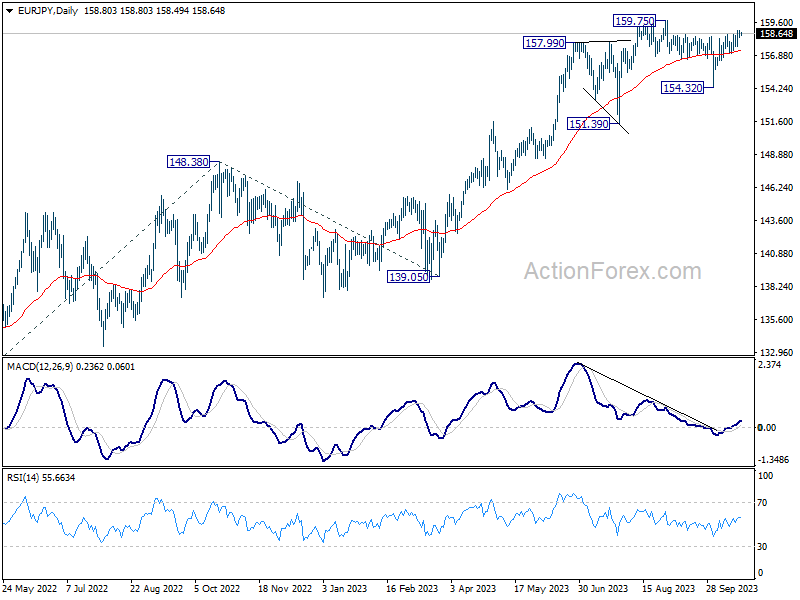
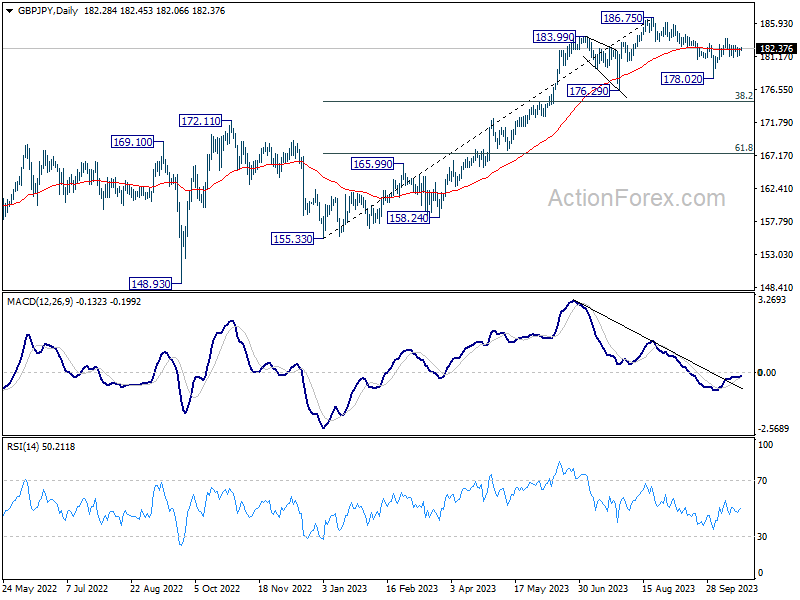
Intraday bias in GBP/JPY remains neutral for the moment. The favored case is still that correction from 186.75 has completed at 178.02. Above 183.79 will resume the rise from 178.02 to retest 186.75 high. However, break of 181.00 will dampen this view, and turn bias back to the downside for 178.02 instead.
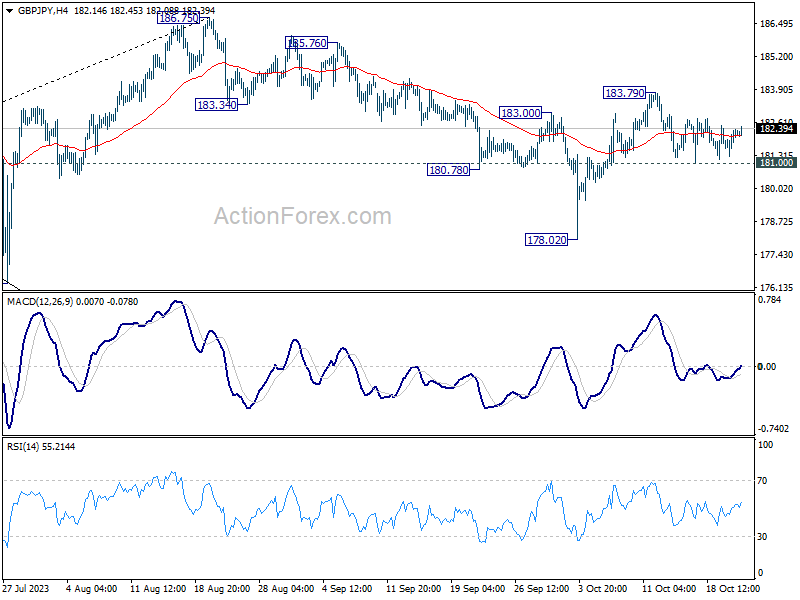
In the bigger picture, fall from 186.75 is seen as a corrective move only. As long as 176.29 support holds, larger up trend from 123.94 (202 low) should still be in progress. Break of 186.75 will target 195.86 (2015 high). Nevertheless, firm break of 176.29 will confirm medium term topping, and bring lengthier and deeper consolidations.
GBP/USD Attempts Recovery, USD/CAD Grinds Higher
GBP/USD is attempting a recovery wave from 1.2090. USD/CAD is rising and might aim for a move above the 1.3720 resistance zone.
Important Takeaways for GBP/USD and USD/CAD Analysis Today
- The British Pound is struggling to gain pace for a move above the 1.2200 region.
- There is a key bearish trend line forming with resistance near 1.2170 on the hourly chart of GBP/USD at FXOpen.
- USD/CAD is showing positive signs above the 1.3670 support zone.
- There is a bullish flag pattern forming with resistance near 1.3720 on the hourly chart at FXOpen.
GBP/USD Technical Analysis
On the hourly chart of GBP/USD at FXOpen, the pair started a fresh decline from the 1.2200 zone. The British Pound traded below the 1.2140 support to move into further a bearish zone against the US Dollar, as mentioned in the previous analysis.
The pair even traded below 1.2115 and the 50-hour simple moving average. Finally, the bulls appeared near the 1.2090 level. A low was formed near 1.2093 and the pair is now attempting a short-term recovery wave.
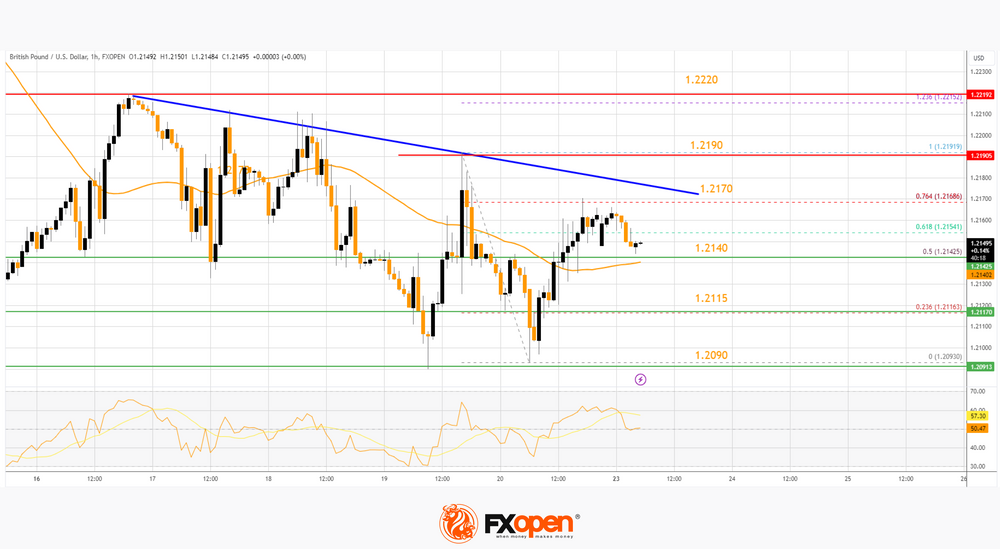
There was a fresh upside above the 50-hour simple moving average. The pair climbed above the 50% Fib retracement level of the downward move from the 1.2191 swing high to the 1.2093 low.
Immediate resistance on the upside is near a key bearish trend line at 1.2170. It is close to the 76.4% Fib retracement level of the downward move from the 1.2191 swing high to the 1.2093 low. The first major resistance on the GBP/USD chart is near the 1.2190 level.
A close above the 1.2190 resistance might spark a decent recovery wave. The next major resistance is near the 1.2220 level. Any more gains could lead the pair toward the 1.2300 resistance in the near term.
Initial support sits near 1.2140. The next major support sits at 1.2115, below which there is a risk of another sharp decline. In the stated case, the pair could drop toward 1.2020.
USD/CAD Technical Analysis
On the hourly chart of USD/CAD at FXOpen, the pair formed a strong support base above the 1.3600 level. The US Dollar started a fresh increase above the 1.3670 resistance against the Canadian Dollar.
The pair cleared the 50-hour simple moving average and climbed above 1.3720. Finally, it tested the 1.3735 zone before there was a drop toward 1.3670. The pair traded as low as 1.3669 and it is again moving higher.
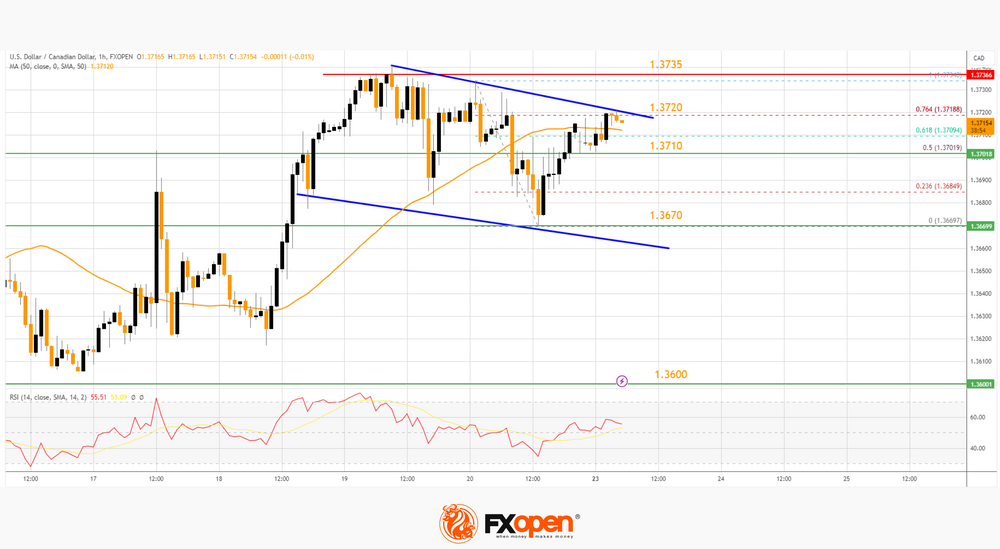
There was a move above the 50% Fib retracement level of the downside correction from the 1.3734 swing high to the 1.3669 low. There is also a bullish flag pattern forming with resistance near 1.3720.
Initial resistance sits near the 76.4% Fib retracement level of the downside correction from the 1.3734 swing high to the 1.3669 low at 1.3720. A clear upside break above 1.3720 could start another steady increase.
The next major resistance is the 1.3735 level. A close above the 1.3735 level might send the pair toward the 1.3800 level. Any more gains could open the doors for a test of the 1.3840 level.
Conversely, the pair could start another decline. Initial support is near the 1.3710 level on the same USD/CAD chart. The next major support is near 1.3670. A downside break below the 1.3670 level could push the pair further lower. The next major support is near the 1.3600 support zone, below which the pair might visit 1.3550.
Trade global forex with the Innovative Broker of 2022*. Choose from 50+ forex markets 24/5. Open your FXOpen account now or learn more about trading forex with FXOpen.
* FXOpen International, Innovative Broker of 2022, according to the IAFT
This article represents the opinion of the Companies operating under the FXOpen brand only. It is not to be construed as an offer, solicitation, or recommendation with respect to products and services provided by the Companies operating under the FXOpen brand, nor is it to be considered financial advice.
Bank of Japan Officials Considering New Changes to Yield Curve Control
Markets
Risk aversion was name of the game last Friday as weekend uncertainty loomed over the Israeli-Hamas conflict. European stock markets lost over 1.5% with new sell-off lows for the likes of the EuroStoxx 50. Key US benchmarks shed 0.85% (Dow) to 1.5% (Nasdaq). Both the S&P 500 and Nasdaq tested the early October lows with technical pictures at risk of deteriorating further. Core bonds rallied after a week of slaughter with US yields correcting 3.4 bps (30-yr) to 9.7 bps (5-yr) lower. German yields lost 1 bp (30-yr) to 8.1 bps (2-yr). The dollar again failed to cash on the situation with the trade-weighted greenback ending at 106.07 from an open at 106.23. EUR/USD closed at 1.0594, from 1.0582. Sterling’s descent initially accelerated on the combination of disappointing and weak UK retail sales and a technical break above the 0.87 resistance area, but EUR/GBP in the end returned most of the intraday gains to close at 0.8710.
It’s back to “normal” at bond markets this morning as US Treasuries resume sell-off mode. Both the US 5-yr and 10-yr yields are attracted by the psychologic 5%-mark. The US government reported deficit data after Friday’s close showing a $1.7tn deficit by the end of September, equaling 6.3% of GDP and compared to $1.4tn or 5.4% of GDP a year earlier. Without accounting changes related to forgiveness of student loans, the deficit would have clocked in around $2tn. We stressed before that fiscal policy (twin deficits) might become the next structural market driver with central bank’s hands tied in the inflation fight and governments on a spending spree. In this respect, the US is on a worse road than Europe (expected deficits above 7% this year and next vs above 3% in EMU). It could be a factor holding back the dollar from exploiting additional gains in the traditionally beneficial context of higher real rates, rising volatility and a risk-off market setting.
The Japanese newspaper Nikkei reported this weekend that Bank of Japan officials are considering new changes to their yield curve control as domestic bond yields move higher in tandem with those in the US. The Japanese 10y bond yield sets a new high at 0.87% this morning, approaching the maximum tolerable 100 bps around the 0% BoJ-target. Earlier this month, sources suggested that inflation forecasts for fiscal years 2023 and 2024 would be increased (further) above the 2% target, providing more backing for a next gentle normalization step at the October 31 meeting. The Japanese yen could give the final push in the back. USD/JPY in illiquid Asian dealings temporarily breached the USD/JPY 150 level; generally seen as line in the sand for the BoJ. We questioned before whether FX interventions can structurally fend off the danger. Only a true (monetary) policy turn can come to JPY’s rescue.
News and views
Rating agency S&P upgraded Greece’s credit rating from BB+ to BBB- with a stable outlook, lifting the country out of junk territory back into investment grade. It’s the first of the three big rating agencies to do so since the debt crisis hit Greece more than a decade ago. Greece needs one more investment grade rating from either Moody’s or Fitch for its debt to be allowed in these particular indices. S&P hailed Greece’s budgetary consolidation which put the fiscal trajectory onto a firmly improving track while a clear mandate for the New Democracy party earlier this year allows the government to build upon past reform efforts. S&P expects the general government budget deficit to average just 0.5% over 2023-2026 with primary surpluses of (at least) 1.2% of GDP seen for this year and 2.3% over 2024-2026. Greek debt should fall to 139% of GDP by 2026, down from a 207% peak in 2020. This reflects an inflation dividend, S&P said, but it’s also due to a rapid post-pandemic expansion. Real growth is expected at 2.5% for this year while remaining “robust” in the years thereafter, in part thanks to EU fund inflows and tourism. Inflation would still average to 4% this year before easing to 2.1% in 2024-2026.
S&P kept the Italian rating unchanged at BBB with a stable outlook. The latter balances a slower budgetary consolidation against the significant economic stimulus the EU Next Gen funds should provide. Growth is projected to slow to 0.9% in 2023 and just 0.7% in 2024 before picking up to 1% again in 2025. These bleak forecasts as well as rising interest payments lead to deficits of 5.5% this year and 4.7% in 2024. The pace of government debt reduction will slow and should still amount to 132% of GDP in 2026, compared to 133% in 2023.
USD/CAD Daily Outlook
Daily Pivots: (S1) 1.3679; (P) 1.3706; (R1) 1.3743; More....
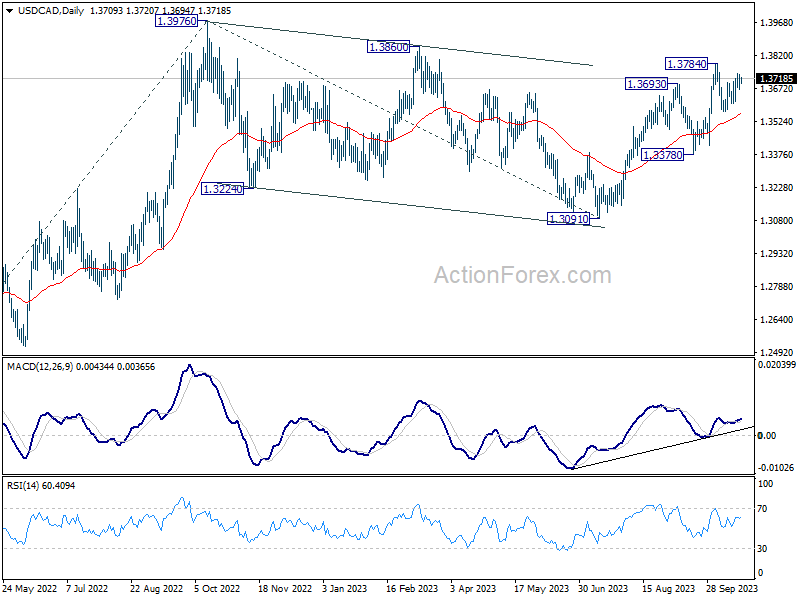
Intraday bias in USD/CAD remains neutral at this point, and consolidation from 1.3784 could extend further. On the upside, decisive break of 1.3784 resistance will resume the rise from 1.3091 to retest 1.3976 high. On the downside, however, break of 1.3615 support will bring another falling leg to extend the near term corrective pattern from 1.3784.
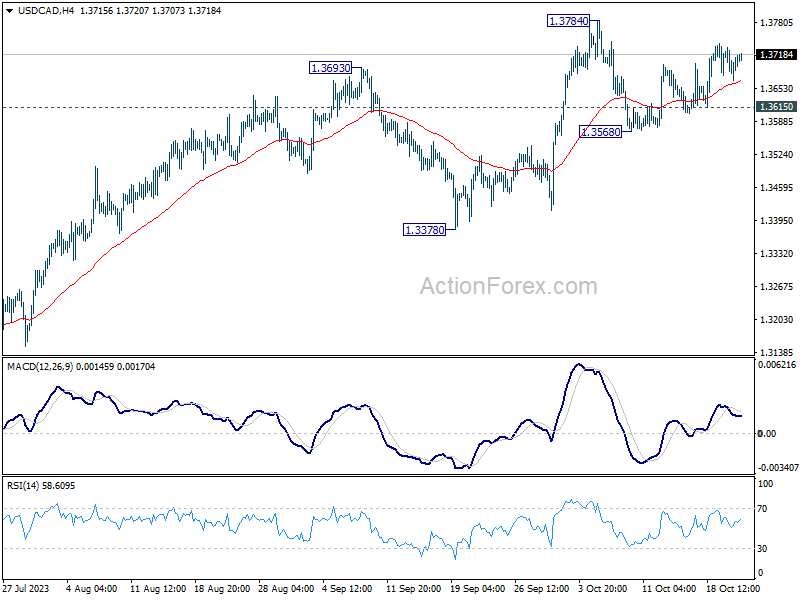
In the bigger picture, current development revives the case that corrective pattern from 1.3976 (2022 high) has completed with three waves down to 1.3091. Decisive break of 1.3976 high will confirm resumption of up trend from 1.2005 (2021 low). Next target will be 61.8% projection of 1.2401 to 1.3976 from 1.3091 at 1.4064. This will now remain the favored case as long as 1.3378 support holds.
AUD/USD Daily Report
Daily Pivots: (S1) 0.6296; (P) 0.6315; (R1) 0.6332; More...
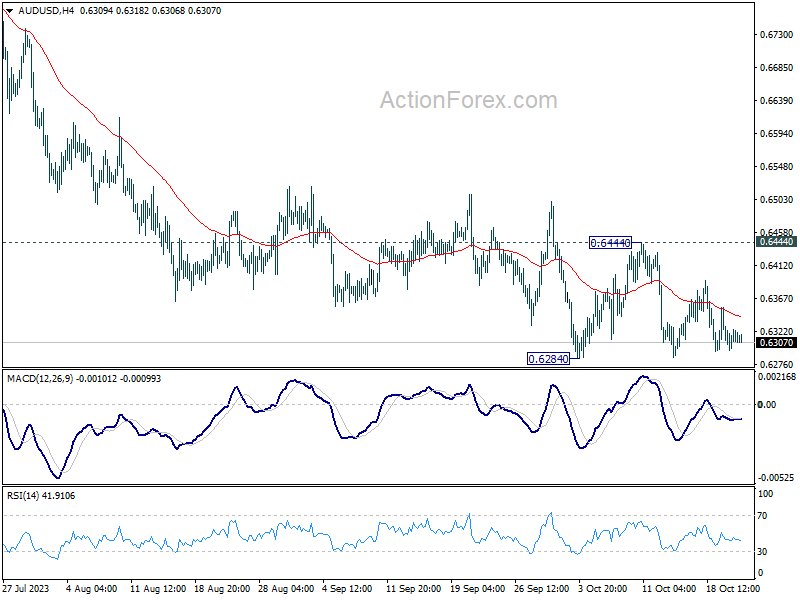
Intraday bias in AUD/USD remains neutral as consolidation form 0.6284 could extend further. But downside breakout is expected with 0.6444 resistance intact. ON the downside, firm break of 0.6284 will resume whole fall from 0.7156. Next target is 100% projection of 0.7156 to 0.6457 from 0.6894 at 0.6195, which is close to 0.6169 medium term support.
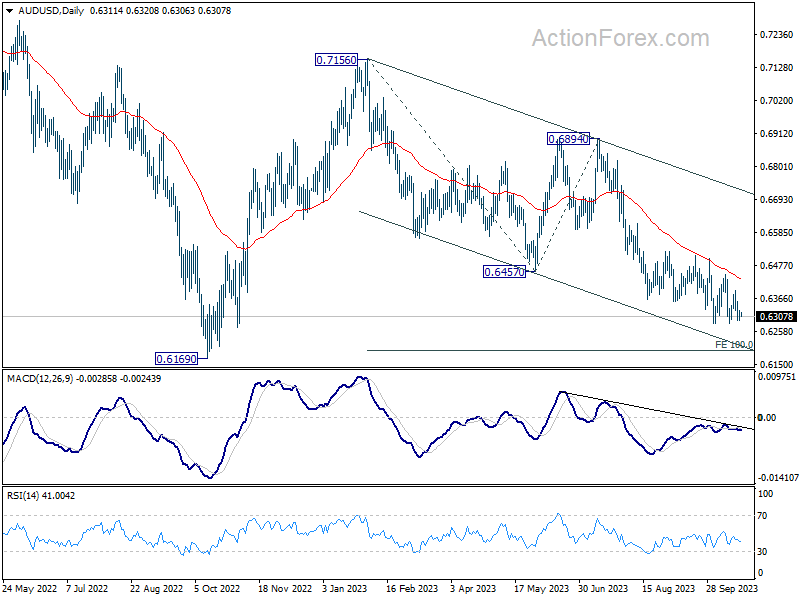
In the bigger picture, down trend from 0.8006 (2021 high) is possibly still in progress. Decisive break of 0.6169 will target 61.8% projection of 0.8006 to 0.6169 to 0.7156 at 0.6021. This will now remain the favored case as long as 0.6894, in case of strong rebound.
EUR/USD Daily Outlook
Daily Pivots: (S1) 1.0571; (P) 1.0588; (R1) 1.0610; More...
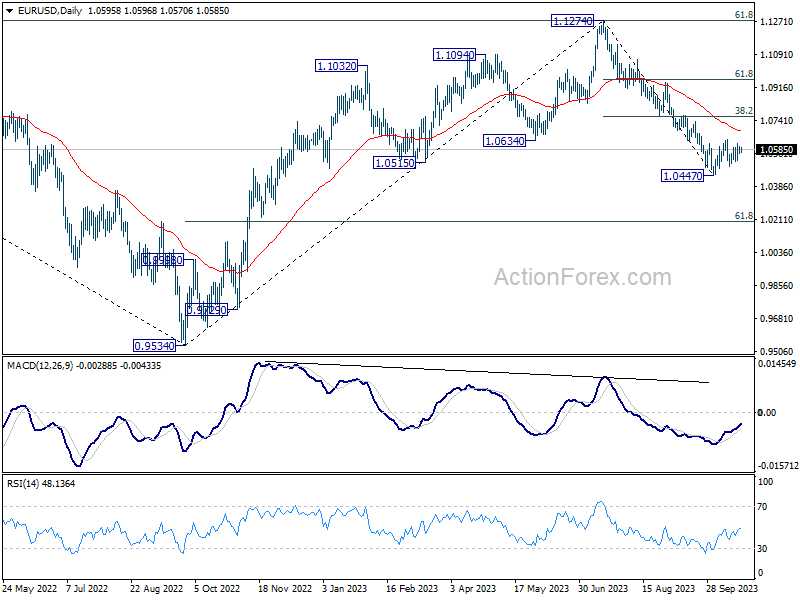
Intraday bias in EUR/USD remains neutral as consolidation from 1.0447 could extend further. But downside breakout remains in favor with 1.0539 resistance intact. On the downside, firm break of 1.0447 will resume whole fall from 1.1274 and target 1.0199 fibonacci level. On the upside, however, break of 1.0639 turn bias to the upside for 1.0764 cluster resistance (38.2% retracement of 1.1274 to 1.0447 at 1.0763).
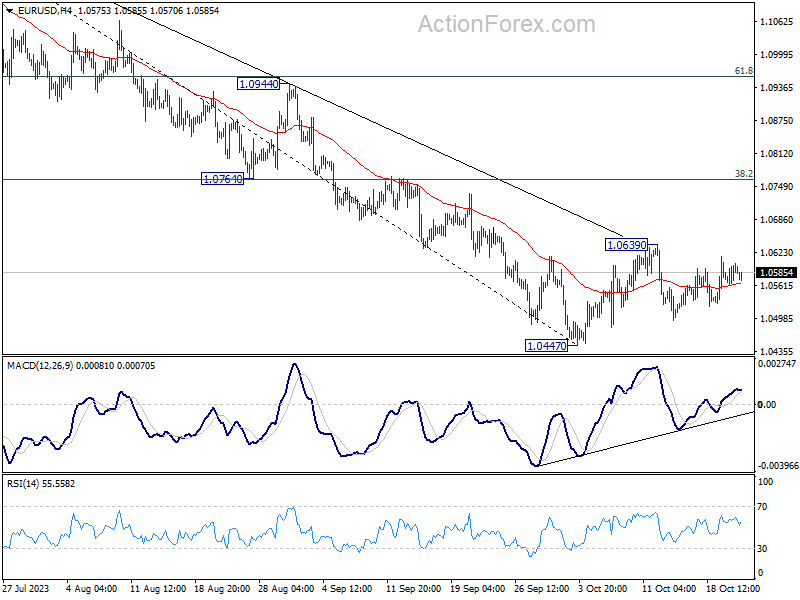
In the bigger picture, fall from 1.1274 medium term top could still be a correction to rise from 0.9534 (2022 low). But chance of a complete trend reversal is rising. In either case, current fall should target 61.8% retracement of 0.9534 to 1.1274 at 1.0199 next. For now, risk will stay on the downside as long as 55 D EMA (now at 1.0684) holds, in case of rebound.
GBP/USD Daily Outlook
Daily Pivots: (S1) 1.2115; (P) 1.2143; (R1) 1.2192; More
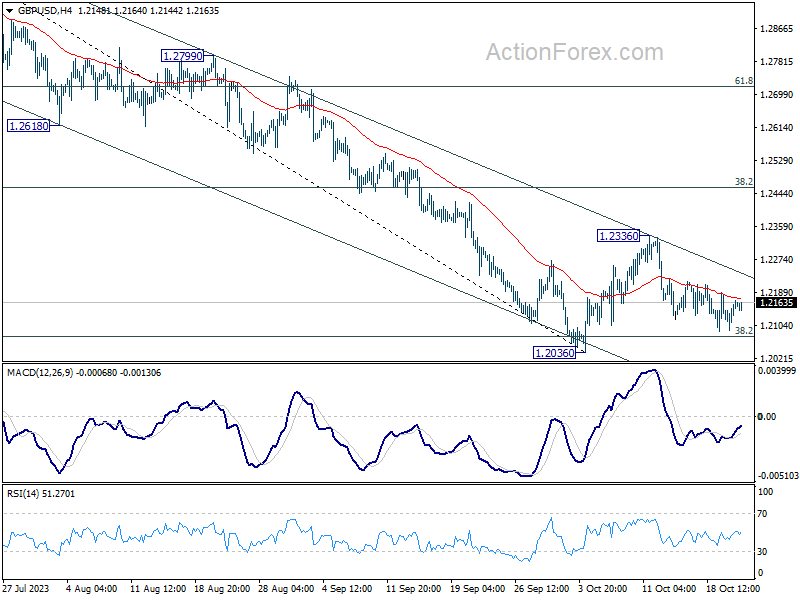
Intraday bias in GBP/USD stays neutral as consolidation from 1.2036 is extending. Downside breakout is in favor with 1.2336 resistance intact. On the downside, decisive break of 1.2036 will resume whole decline from 1.3141 for 1.1801 support next. However, break of 1.2336 will turn bias back to the upside for 38.2% retracement of 1.3141 to 1.2036 at 1.2458.
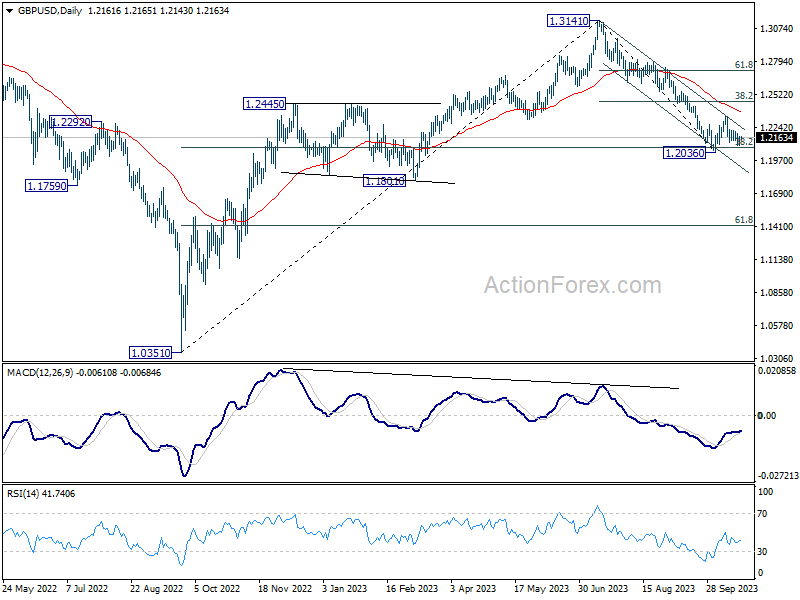
In the bigger picture, fall from 1.3141 medium term top could still be a correction to up trend from 1.0351 (2022 low) only. But risk of complete trend reversal is rising. Sustained break of 38.2% retracement of 1.0351 to 1.3141 at 1.2075 will pave the way to 61.8% retracement at 1.1417. For now, risk will stay on the downside as long as 55 D EMA (now at 1.2384) holds, in case of rebound.
USD/JPY Daily Outlook
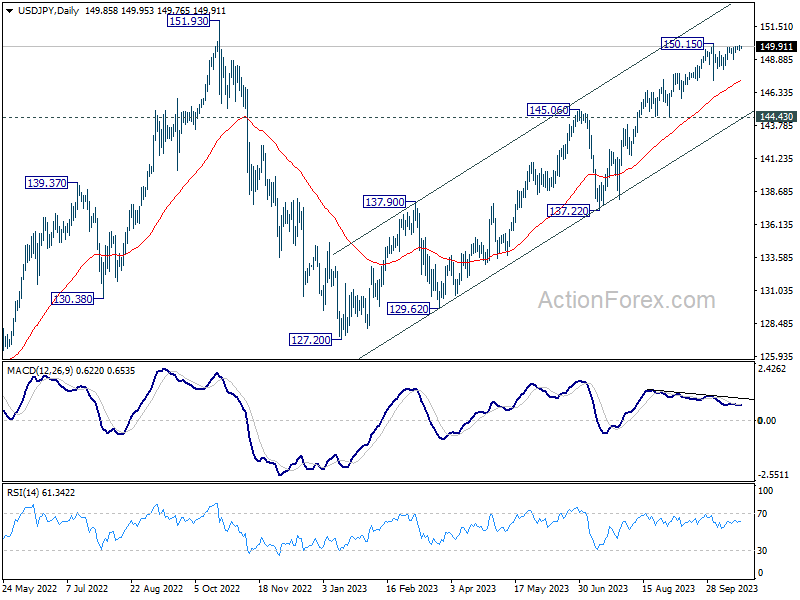
Daily Pivots: (S1) 149.68; (P) 149.83; (R1) 150.01; More...
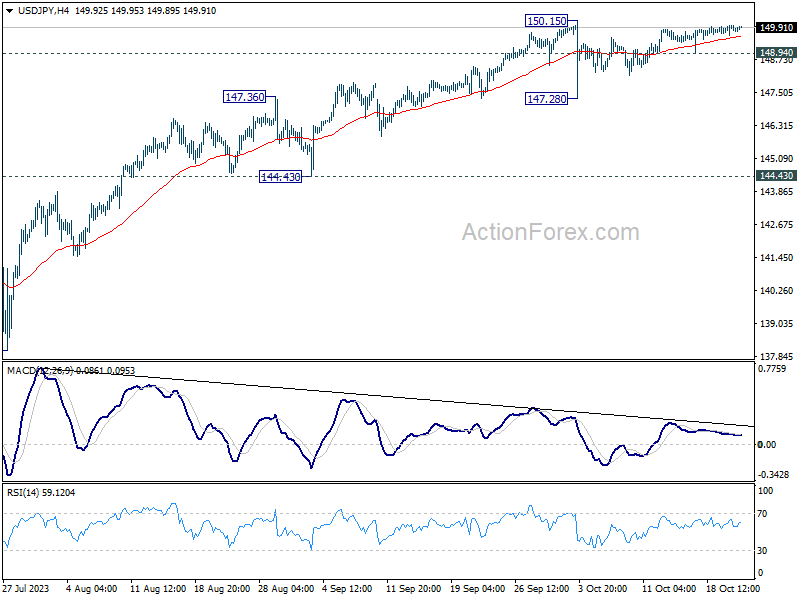
Intraday bias in USD/JPY stays neutral and outlook is unchanged. Consolidation pattern from 150.15 could extend further. On the downside, below 148.94 minor support will turn bias to the downside for another down leg towards 147.28. On the upside, firm break of 150.15 will resume larger up trend to test 151.93 high.
In the bigger picture, while rise from 127.20 is strong, it could still be seen as the second leg of the corrective pattern from 151.93 (2022 high). Rejection by 151.93, followed by sustained break of 145.06 resistance turned support will be the first sign that the third leg of the pattern has started. However, sustained break of 151.93 will confirm resumption of long term up trend.
USD/CHF Daily Outlook
Daily Pivots: (S1) 0.8906; (P) 0.8921; (R1) 0.8938; More....
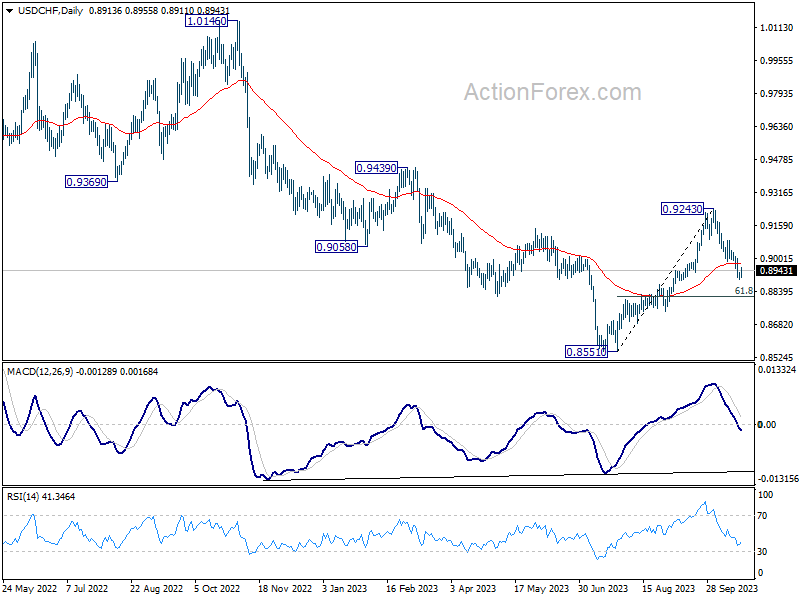
Intraday bias in USD/CHF is turned neutral first with today's recovery. But further decline is still expected as long as 0.9000 resistance holds. Below 0.8901 will resume the fall from 0.9243 to 61.8% retracement of 0.8551 to 0.9243 at 0.8815 next. Sustained break there will pave the way to retest 0.8551 low. Nevertheless, break of 0.9000 will turn bias back to the upside for stronger rebound.
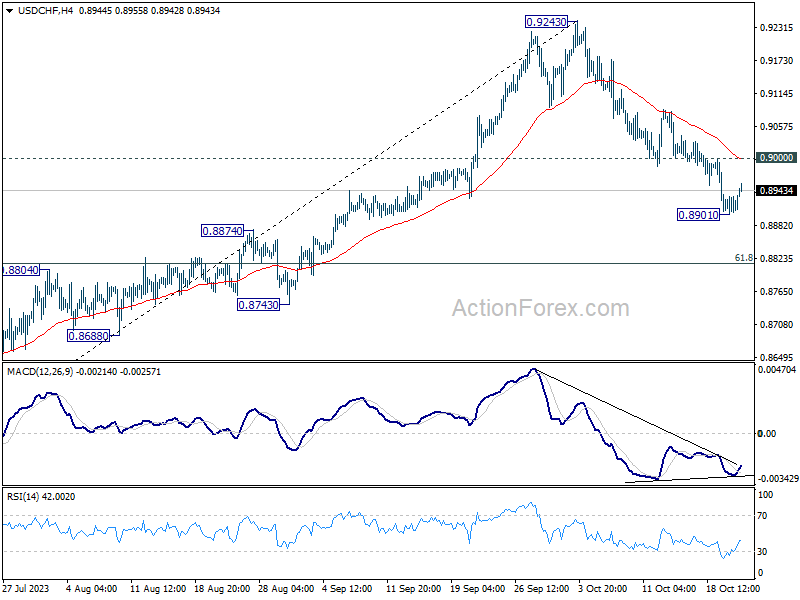
In the bigger picture, the firm break of 55 D EMA (now at 0.8974) argues that rebound from 0.8551 might be completed as a correction at 0.9243. In other words, larger fall from 1.0146 (2022 high) is possibly not over yet. Risk will now stay on the downside as long as 0.9243 resistance holds. Firm break of 0.8551 will confirm down trend resumption.