

Sample Category Title
USD/CHF Mid-Day Outlook
Daily Pivots: (S1) 0.8906; (P) 0.8921; (R1) 0.8938; More....
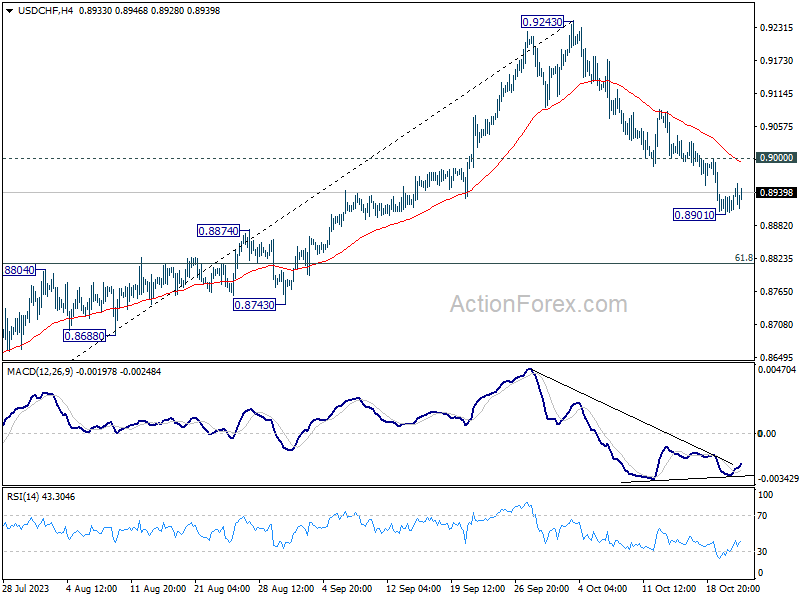
Intraday bias in USD/CHF stays neutral, but further decline is still expected as long as 0.9000 resistance holds. Below 0.8901 will resume the fall from 0.9243 to 61.8% retracement of 0.8551 to 0.9243 at 0.8815 next. Sustained break there will pave the way to retest 0.8551 low. Nevertheless, break of 0.9000 will turn bias back to the upside for stronger rebound.
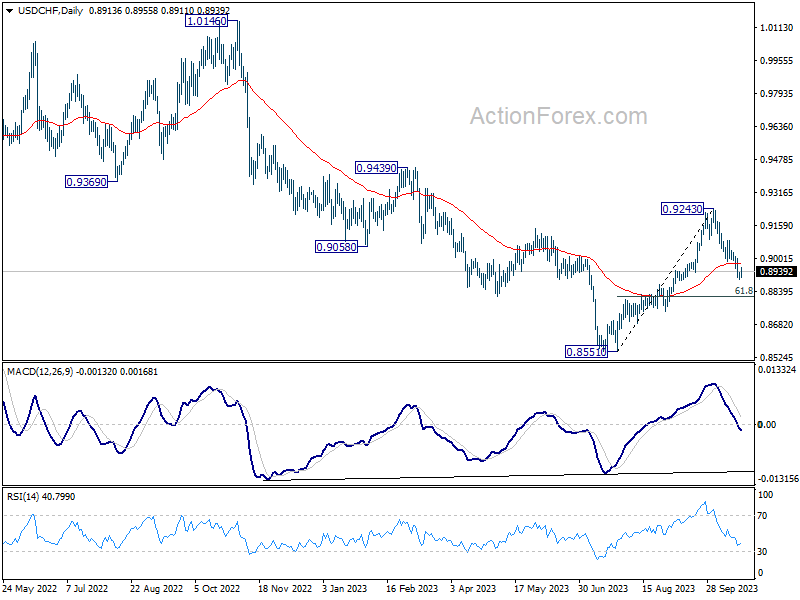
In the bigger picture, the firm break of 55 D EMA (now at 0.8974) argues that rebound from 0.8551 might be completed as a correction at 0.9243. In other words, larger fall from 1.0146 (2022 high) is possibly not over yet. Risk will now stay on the downside as long as 0.9243 resistance holds. Firm break of 0.8551 will confirm down trend resumption.
GBP/USD Mid-Day Outlook
Daily Pivots: (S1) 1.2115; (P) 1.2143; (R1) 1.2192; More
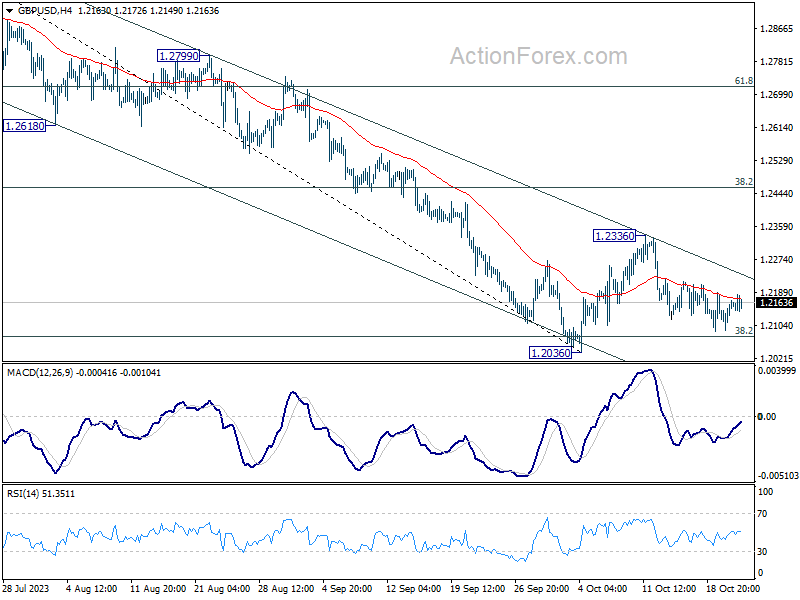
Sideway trading continues in GBP/USD and intraday bias remains neutral. Downside breakout is in favor with 1.2336 resistance intact. On the downside, decisive break of 1.2036 will resume whole decline from 1.3141 for 1.1801 support next. However, break of 1.2336 will turn bias back to the upside for 38.2% retracement of 1.3141 to 1.2036 at 1.2458.
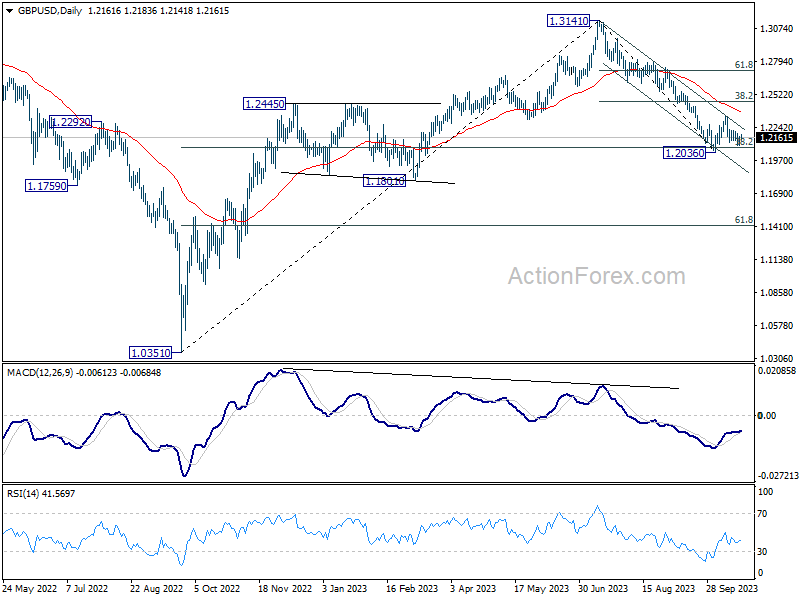
In the bigger picture, fall from 1.3141 medium term top could still be a correction to up trend from 1.0351 (2022 low) only. But risk of complete trend reversal is rising. Sustained break of 38.2% retracement of 1.0351 to 1.3141 at 1.2075 will pave the way to 61.8% retracement at 1.1417. For now, risk will stay on the downside as long as 55 D EMA (now at 1.2384) holds, in case of rebound.
EUR/USD Mid-Day Outlook
Daily Pivots: (S1) 1.0571; (P) 1.0588; (R1) 1.0610; More...
EUR/USD recovers further today but stays below 1.0639. Intraday bias remains neutral and outlook stays bearish. On the downside, firm break of 1.0447 will resume whole fall from 1.1274 and target 1.0199 fibonacci level. On the upside, however, break of 1.0639 turn bias to the upside for 1.0764 cluster resistance (38.2% retracement of 1.1274 to 1.0447 at 1.0763).
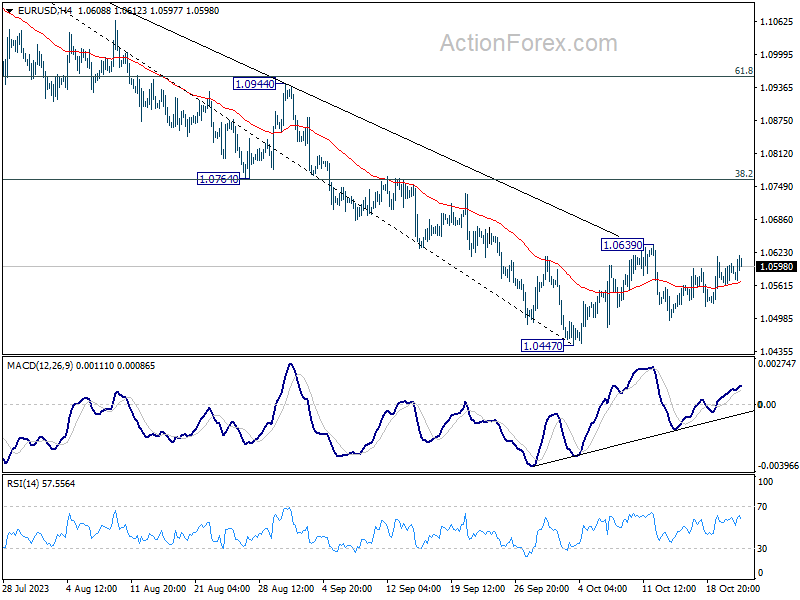
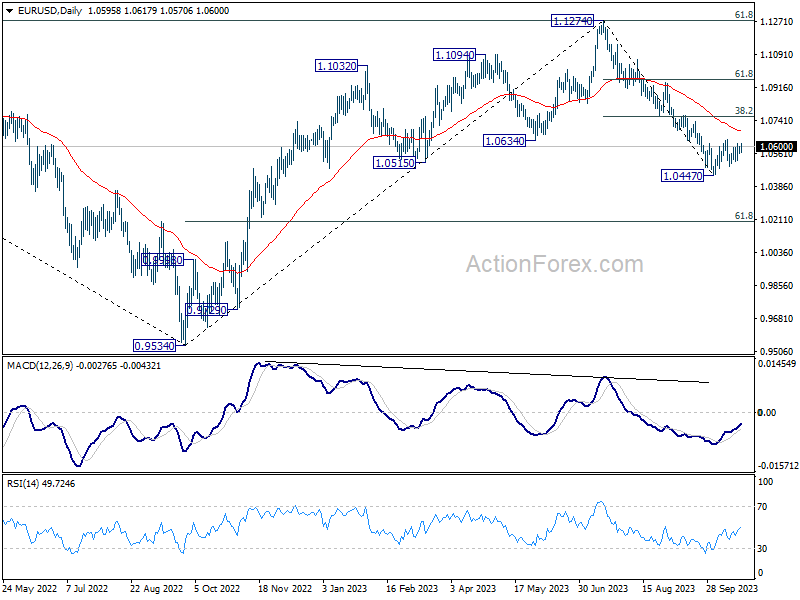
In the bigger picture, fall from 1.1274 medium term top could still be a correction to rise from 0.9534 (2022 low). But chance of a complete trend reversal is rising. In either case, current fall should target 61.8% retracement of 0.9534 to 1.1274 at 1.0199 next. For now, risk will stay on the downside as long as 55 D EMA (now at 1.0684) holds, in case of rebound.
Markets Tread Cautiously: Euro Leads, Oil Retreats
Euro emerged as the frontrunner in today's forex markets, establishing itself as the strongest performer. However, the overall momentum in the currency arena seems relatively restrained. Following closely behind Euro, Canadian Dollar is occupying the spot of the second strongest, with Sterling and Dollar not far behind. Contrarily, Swiss Franc, Yen, and Australian Dollar demonstrated softer dynamics.
European stock markets are showcasing a stable sentiment, with FTSE and DAX experiencing only mild losses. Across the Atlantic, US futures are indicating a lower open. However, absent any significant geopolitical shocks, investors are anticipated to reserve their major plays for the post-earnings period of tech giants Microsoft, Alphabet, Meta, and Amazon later this week. At the same time, US 10-year yield is gaining traction, and a resurgence to have another take on the 5% level is on the cards.
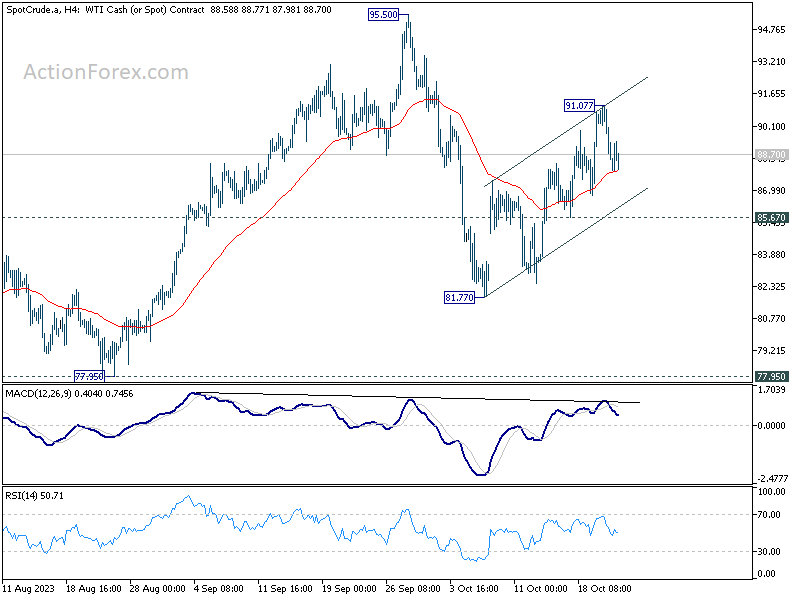
From a technical standpoint, WTI crude oil's rebound from 81.77 is still in favor to continue as long as 85.67 support holds. Nevertheless, the structure of the rise argues that it's a corrective move, as the second leg of the pattern from 95.50. Hence, while break of 9.107 will resume the rebound, upside should be limited below 95.50. Break of 85.67 will indicate the start of the third leg to 81.77 and below. Nevertheless, given the susceptibility of oil prices to geopolitical fluctuations, staying adaptable to evolving scenarios is prudent.
In Europe, at the time of writing, FTSE is down -0.42%. DAX is down -0.58%. CAC is flat. Germany 10-year yield is up 0.0302 at 2.923. Earlier in Asia, Nikkei fell -0.83%. China Shanghai SSE fell -1.47%. Singapore Strait Times fell -0.76%. Japan 10-year JGB yield rose 0.0301 to 0.874.
Gold and Silver consolidating last week's gains
Following a robust rally last week, both Gold and Silver seem to be taking a breather, moving into a consolidation phase in today's trading session.
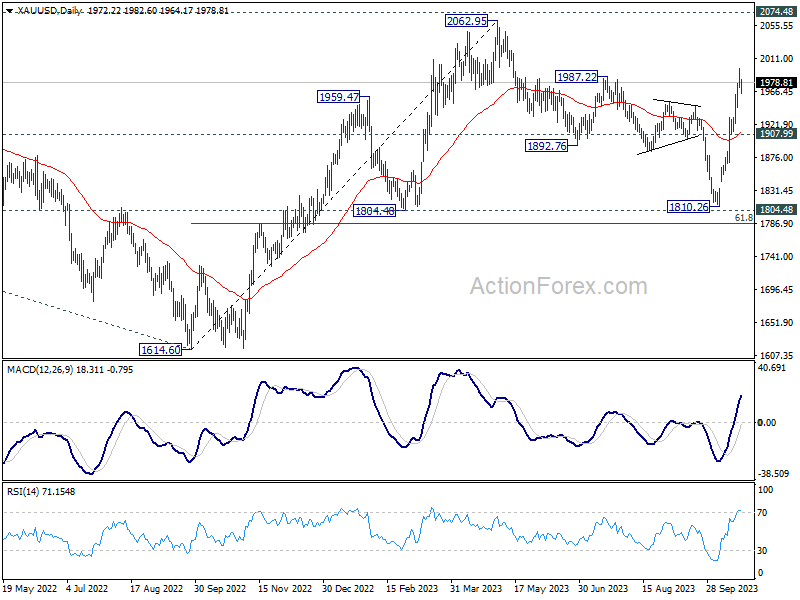
Gold, in particular, seems to be encountering resistance around the much-watched 2000 psychological mark. But still, as long as 1907.99 support holds, bullish outlook is unchanged. That is, corrective fall from 2062.95 has completed with three waves down to 1810.26. Break of 1997.00 will resume the rise from there to retest 2062.95 resistance.
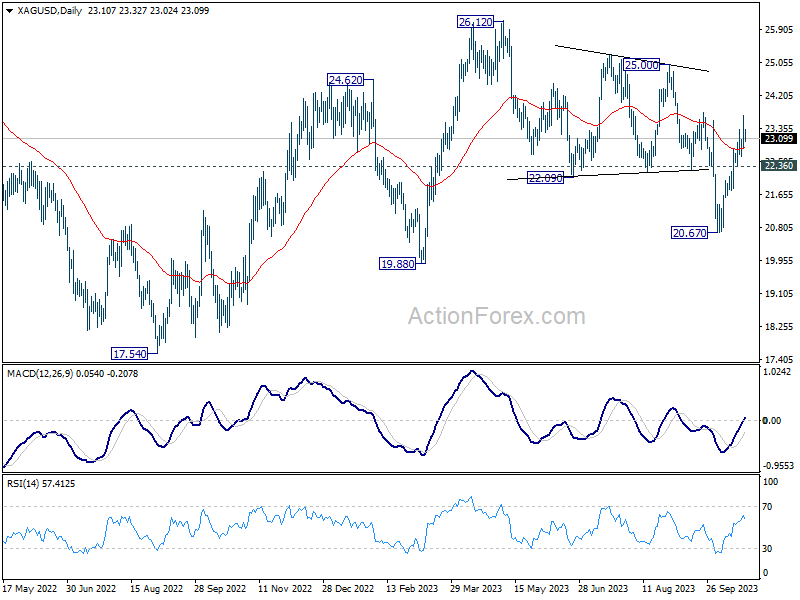
Meanwhile, Silver's ascent last week was somewhat tempered compared to Gold's. Nevertheless, the favored case is that corrective fall from 26.12 has completed with three waves down to 20.67 already. Further rise is expected as long as 22.26 support holds, to 25.00 structural resistance next. Firm break there will bring retest of 26.12 high.
Bundesbank's monthly report paints a bleak picture of Germany's economy
Bundesbank's latest monthly report revealed a likely contraction in Germany's real GDP during Q3, attributing this slump to dwindling foreign demand for industrial goods. Elevated financing costs have not only hampered investments but also stymied domestic demand, particularly in the construction and industrial sectors.
Despite these economic headwinds, German job market has shown resilience, with pronounced wage increases amidst declining inflation offering a silver lining. However, this positive spin has yet to translate into increased consumer spending. Data suggests that private households are opting for caution, channeling additional funds into savings rather than expenditure, a trend underscored by diminished real sales in the retail and hospitality industries.
Inflation dynamics in September offer a mixed bag. The report highlighted a moderate uptick in energy and food prices, whilst services experienced an above-average increase. Bundesbank anticipates a deceleration in inflation in the forthcoming months.
EUR/USD Mid-Day Outlook
Daily Pivots: (S1) 1.0571; (P) 1.0588; (R1) 1.0610; More...
EUR/USD recovers further today but stays below 1.0639. Intraday bias remains neutral and outlook stays bearish. On the downside, firm break of 1.0447 will resume whole fall from 1.1274 and target 1.0199 fibonacci level. On the upside, however, break of 1.0639 turn bias to the upside for 1.0764 cluster resistance (38.2% retracement of 1.1274 to 1.0447 at 1.0763).
In the bigger picture, fall from 1.1274 medium term top could still be a correction to rise from 0.9534 (2022 low). But chance of a complete trend reversal is rising. In either case, current fall should target 61.8% retracement of 0.9534 to 1.1274 at 1.0199 next. For now, risk will stay on the downside as long as 55 D EMA (now at 1.0684) holds, in case of rebound.
Economic Indicators Update
| GMT | Ccy | Events | Actual | Forecast | Previous | Revised |
|---|---|---|---|---|---|---|
| 10:00 | EUR | German Buba Monthly Report | ||||
| 14:00 | EUR | Eurozone Consumer Confidence Oct P | -18 | -18 |
Gold and Silver consolidating last week’s gains
Following a robust rally last week, both Gold and Silver seem to be taking a breather, moving into a consolidation phase in today's trading session.
Gold, in particular, seems to be encountering resistance around the much-watched 2000 psychological mark. But still, as long as 1907.99 support holds, bullish outlook is unchanged. That is, corrective fall from 2062.95 has completed with three waves down to 1810.26. Break of 1997.00 will resume the rise from there to retest 2062.95 resistance.
Meanwhile, Silver's ascent last week was somewhat tempered compared to Gold's. Nevertheless, the favored case is that corrective fall from 26.12 has completed with three waves down to 20.67 already. Further rise is expected as long as 22.26 support holds, to 25.00 structural resistance next. Firm break there will bring retest of 26.12 high.
November Flashlight for the FOMC Blackout Period
Summary
- We expect that the Federal Open Market Committee (FOMC) will leave the target range for the federal funds rate unchanged at 5.25%-5.50% at the conclusion of its next meeting on November 1. Financial markets are essentially priced for no change as well.
- Although the rate of real GDP growth in the U.S. economy remains strong, inflation is moving back toward the FOMC's target of 2%. That noted, we believe that the post-meeting statement will continue to characterize inflation as “elevated”, while also noting that recent geopolitical events add uncertainty to the outlook.
- Recent comments by Fed officials suggest that most Committee members are comfortable leaving the stance of monetary policy unchanged at the upcoming meeting. That said, most policymakers indicated at the September FOMC meeting that they thought another 25 bps rate hike would be appropriate by the end of this year.
- We believe the FOMC will want to keep its options open for further tightening. Therefore, we think the post-meeting statement will maintain the language that signals some additional policy tightening may be appropriate.
- We do not expect the FOMC will make any changes to the pace at which it is allowing Treasury securities and mortgage-backed securities (MBS) to run off the Fed's balance sheet.
We Expect the FOMC Will Leave Rates Unchanged on November 1
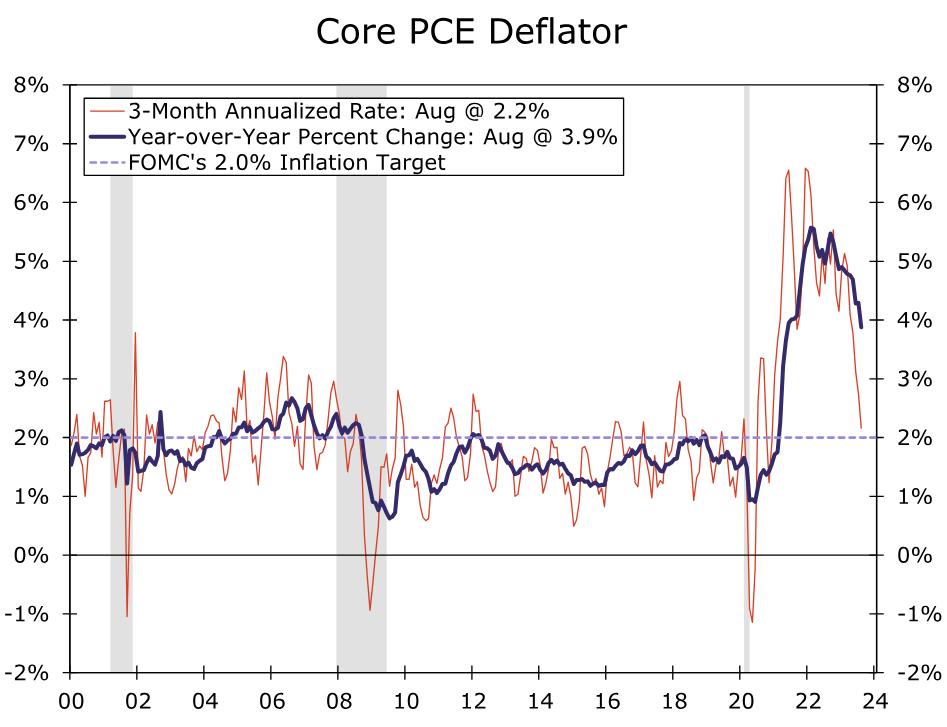
We share the widespread expectation that the Federal Open Market Committee (FOMC) will leave the target range for the federal funds rate unchanged at its upcoming meeting on October 31-November 1. Since the Committee last met, underlying inflation has shown continued signs of slowing. The core PCE deflator, which is the FOMC's preferred measure of consumer price inflation, edged up just 0.1% in August relative to the previous month. Over the three-month period ending in August, core PCE inflation rose at a 2.2% annualized rate, not far from the Committee's 2% target (Figure 1). Over the 12-month period ending in August, core PCE inflation was 3.9%, its first reading below 4% since June 2021.
These are welcome developments for a Committee that has been fighting to combat high inflation since early 2022. That said, it remains far from certain that inflationary pressures are fully in check. Data for PCE inflation in September are not yet available and will be released on October 27. Recently released data on the Consumer Price Index (CPI) and Producer Price Index (PPI) suggest that core PCE inflation strengthened a bit in September. As we wrote in our most recent CPI report, we think this monthly bounce is more noise than signal, and we believe the downward trend in inflation remains in place despite the periodic bumps in the road. However, we think the Committee will be sensitive to any upward surprises on the inflation front, and the September inflation data argue for the FOMC remaining cautious about how quickly inflation can return to target on a sustained basis.
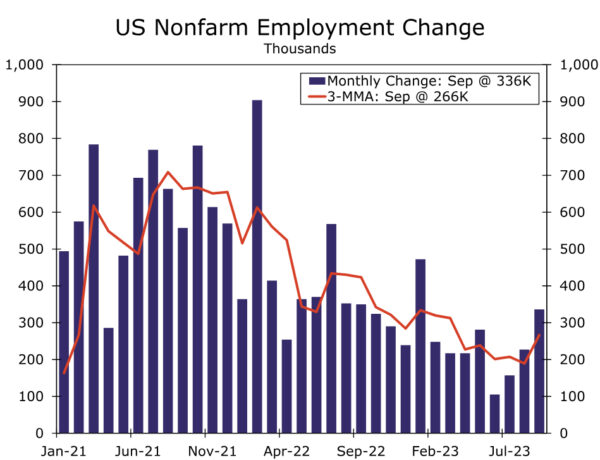
Data on economic output and employment have remained rock solid. Real GDP appears to have grown at roughly a 5% annualized rate in Q3-2023. A pickup in employment growth—nonfarm payrolls rose at an average monthly rate of 266K in Q3 relative to the average monthly rate of 201K in the second quarter—is consistent with this acceleration in real GDP (Figure 2). Moreover, the drivers of economic growth appear to have been broad-based in the third quarter.
Another Pause on November 1 Appears to be the Consensus View on the FOMC
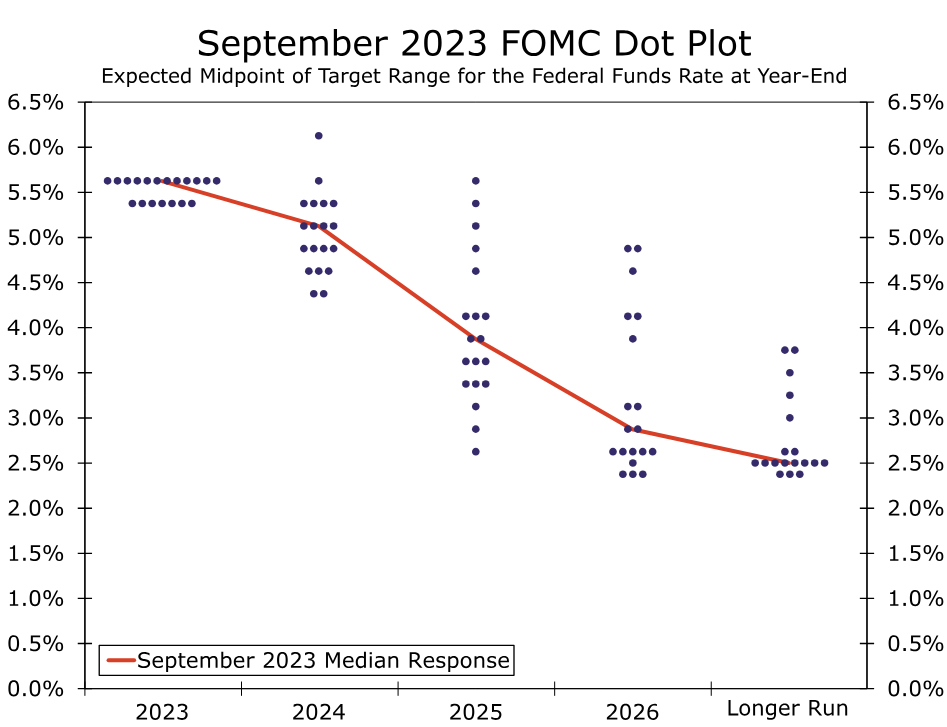
The dot plot from the September FOMC meeting indicated that the median participant supported one more 25 bps rate hike by the end of the year (Figure 3). However, recent comments from Federal Reserve officials suggest that another hold on November 1 is the consensus view. On October 18, Governor Waller stated the following: “I believe we can wait, watch and see how the economy evolves before making definitive moves on the path of the policy rate.” Patrick Harker, who is the president of the Federal Reserve Bank of Philadelphia and a voting member of the FOMC this year, sounded even more dovish on October 13 when stating that “I believe that we are at the point where we can hold rates where they are.” Financial markets appear to have gotten the memo. Fed funds futures heading into the blackout period were priced for essentially no chance of a 25 bps rate hike on November 1.
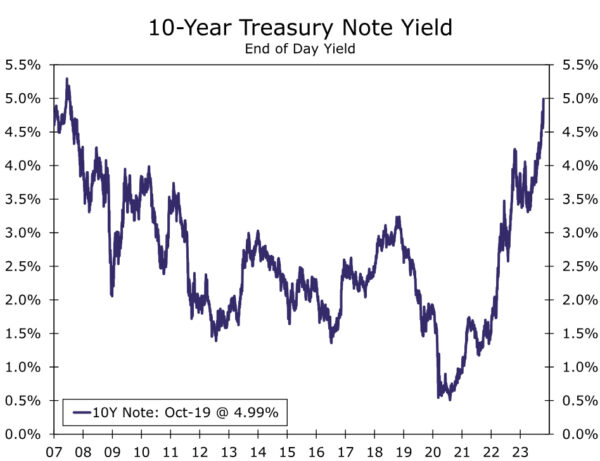
Other Committee members have pointed to the rise in long-term Treasury yields in recent months as another form of tightening that, if sustained, will likely restrain economic activity and inflation (Figure 4). The yield on the 10-year Treasury note has climbed from about 4% at the end of July to nearly 5% today. Vice Chair Philip Jefferson expressed this sentiment on October 9, saying that “I will remain cognizant of the tightening in financial conditions through higher bond yields and will keep that in mind as I assess the future path of policy.” In a speech shortly before the blackout period, Chair Powell similarly noted that “financial conditions have tightened significantly in recent months” and that “we remain attentive to these developments because persistent changes in financial conditions can have implications for the path of monetary policy.”
Current Rate of QT Should Remain in Place
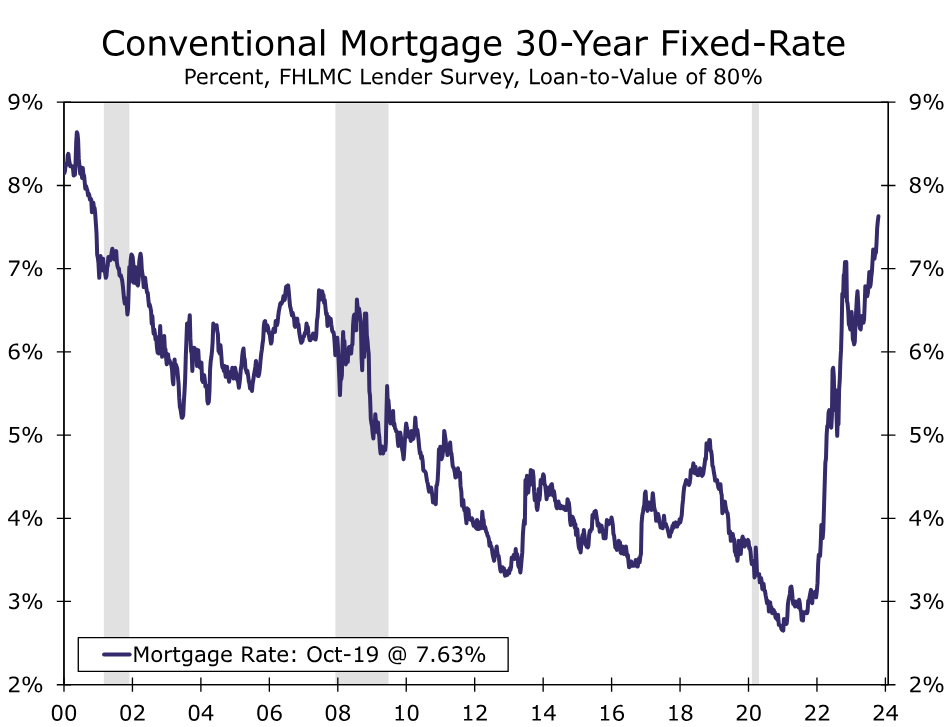
We also expect the FOMC will once again reaffirm the current pace of balance sheet runoff, commonly known as quantitative tightening (QT). As we wrote in a recent report, QT is serving its role as a secondary form of policy tightening. As the central bank reduces its holdings of Treasury bills, notes and bonds and mortgage-backed securities, the additional supply of these securities puts upward pressure on intermediate and longer-term bond yields, all else equal. This in turn leads to higher borrowing costs for households and businesses and restrains economic activity. As an example, the 30-year fixed rate mortgage is currently approaching 8% (Figure 5). QT is far from the only contributor to the recent run-up in longer-term yields, but it is important to remember that even if the Committee maintains the fed funds rate at current levels for the foreseeable future, policy tightening via QT is still running in the background.
Given that some members likely still favor a rate hike before year-end, we do not anticipate any material changes to the post-meeting statement. We think the Committee will continue to refer to inflation as "elevated" and will maintain the language that signals some additional policy tightening may be appropriate. The latter line affords the Committee maximum flexibility should it determine an additional rate hike may be needed at its next meeting on December 12-13. We also expect the statement to note that the recent geopolitical events in the Middle East add additional uncertainty to the outlook.
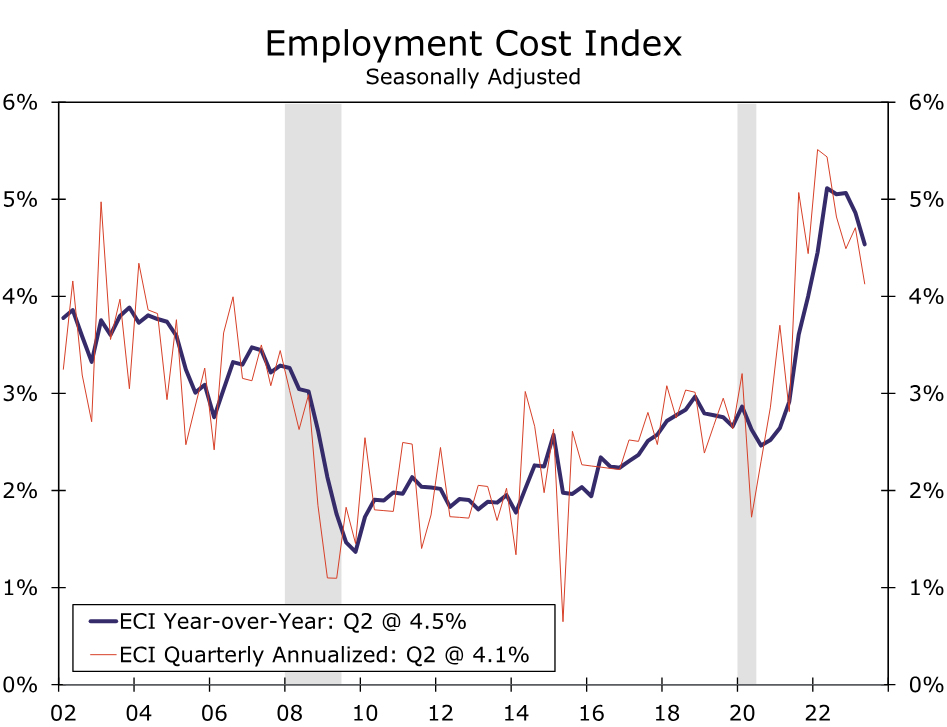
What will the Committee members be watching over the next week or so while in the blackout period? In our view, the biggest remaining data releases until the meeting are the advance release of Q3 GDP (October 26), the September personal income & spending report, which includes monthly PCE inflation (October 27) and the Q3 report on the Employment Cost Index (October 31). The Employment Cost Index (ECI) is the Fed's preferred measure of labor cost growth. As Figure 6 illustrates, labor costs have been decelerating amid moderating labor demand growth and robust labor supply growth. The Committee will be watching closely for additional evidence that this slowdown in labor costs remains in place despite strong job growth in recent months.
Equity Sell-off Could Intensify
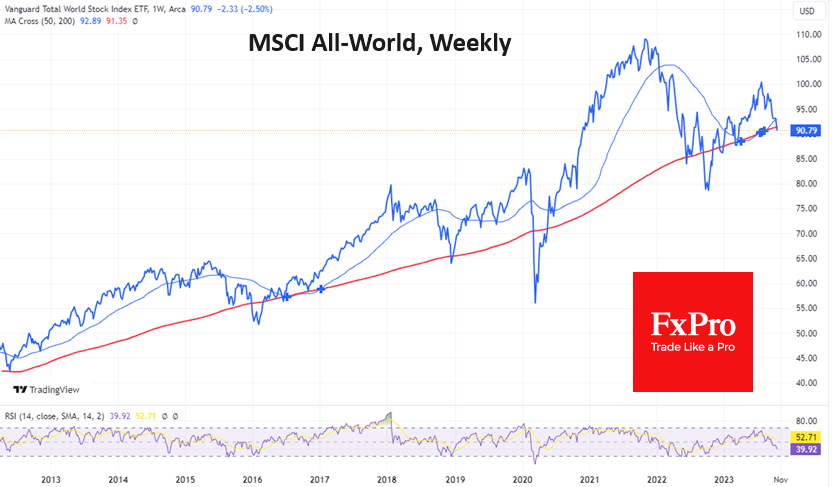
Markets had a heavy end to last week and continued to give up ground at the start of this week. The MSCI All-World Global Equity Index returned to its March lows, and US indices gave bear signals.
The index of global equities fell below the local lows of early October and May to its lowest level since March. The sell-off intensified when the index broke below its 200-day moving average. The last time global equities traded at such a low was at the height of the US regional banking crisis. At the start of the month, the last time the index fell below this curve, equities had accumulated significant oversold conditions. The bounce and subsequent consolidation allowed sellers to build liquidity for a new, sharper attack.
The weekly timeframe now shows a tug-of-war near the 200-week moving average. Over the past decade, a break below this line has accelerated the sell-off, with losses of 11% in September 2022, over 23% in March 2020 and around 9.5% in January 2016. This was the most dramatic but relatively short-lived phase. Less than a month later, we saw a sharp rebound. Will that happen this time?
The major US stock indices closed lower last week, sending an important signal of buyer weakness that could trigger a more substantial sell-off in the new week.
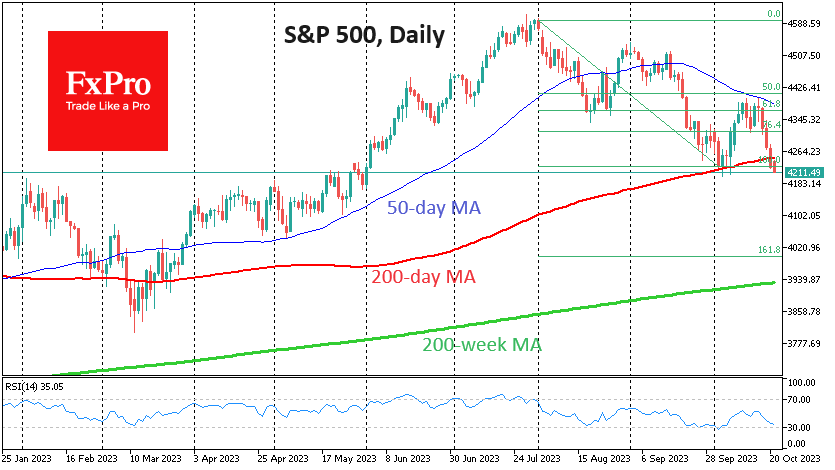
The S&P500 ended last week below its 200-day moving average and started the new week close to the October lows near 4200. After rallying to nearly 4400 in early October, the S&P500 temporarily recovered almost half of its losses since the sell-off began in August. However, it then encountered strong resistance in the form of the round level and the 50-day moving average.
Developing this Fibonacci pattern opens a 5% downside potential to 4000. Still, we also look to the 200-week average (now at 3945, or -6%), which could be a centre of gravity for the bears.
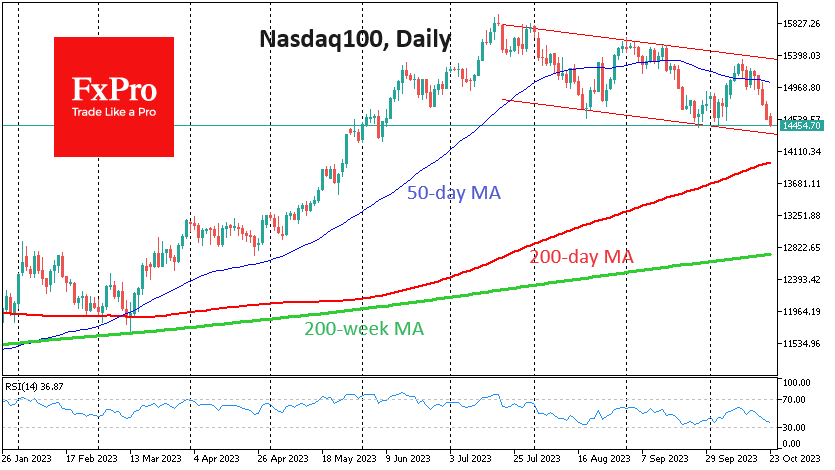
The Nasdaq100 is decisively looking for a bottom, having returned to 14500, where it stayed briefly in early October. Previously, we saw a sharp reversal to the downside as it approached the upper boundary of the descending range, confirming its strength.
Building on the pessimistic picture in the broader indices, we are preparing for an intensified sell-off in the Nasdaq100 with a potential target in the 13700-14000 area. The lower boundary is the pivot point from August last year, while the upper boundary is the 200-day average. A deeper target for the bears is seen in the 12700 area, where the 200-week average runs through.
Nasdaq 100 Technical: Further Potential Downside Pressure as Key Support Broke
- Broke below a key ascending trendline on last Friday, 20 October that has acted as support for prior down moves since December 2022.
- Implied volatility of Nasdaq 100 measured by the CBOE VXN Index has staged a significant bullish breakout and rallied to a 7-month high of 25.31.
- Key short-term resistance to watch will be at 14,615.
- Nasdaq 100’s key component stocks Q3 earnings releases to take note of; Microsoft & Alphabet (Tuesday, 24 October) followed by Meta (Wednesday, 25 October), and Amazon (Thursday, 26 October).
The US Nas 100 Index (a proxy for the Nasdaq 100 futures) has shaped the expected bearish reversal below the 15,355 key short-term resistance on 12 October and tumbled by -6% to print a current intraday low of 14,425 in today, 23 October (European session) at this time of the writing.
Two key medium-term technical developments have occurred that suggest rising odds that the ongoing decline from its 19 July 2023 high of 15,938 may morph into a potential multi-month major bearish downtrend phase.
Implied volatility of Nasdaq 100 has hit a 7-month high
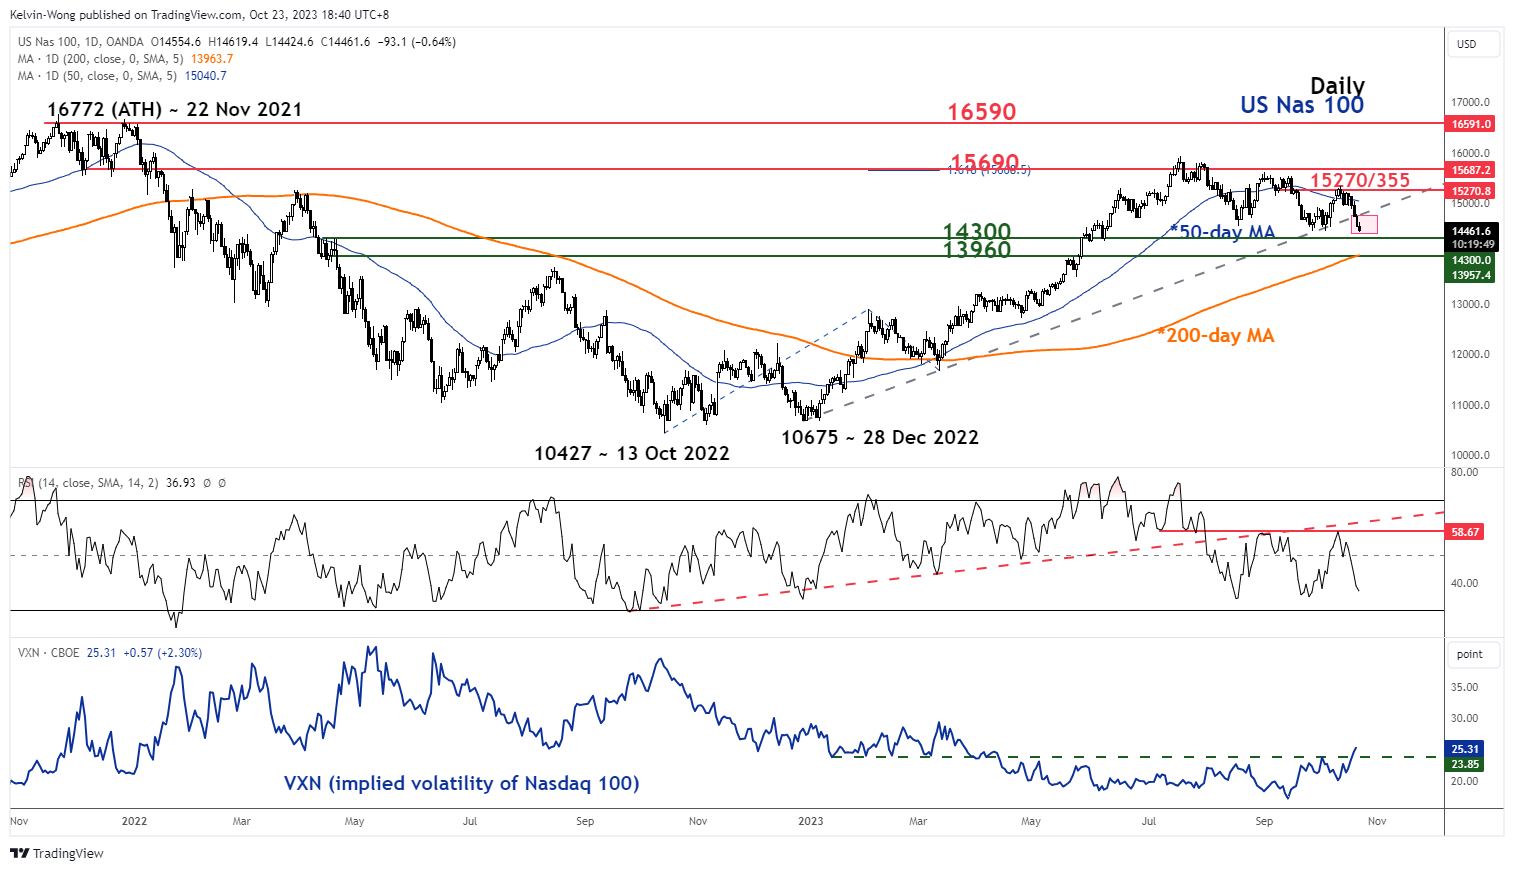
Fig 1: US Nas 100 medium-term trend as of 23 Oct 2023 (Source: TradingView, click to enlarge chart)
Firstly, price actions of the US Nas 100 Index have staged a clear bearish breakdown below its former major ascending trendline from the 28 December 2022 low of 10,675 with a daily close below it last Friday, 20 October 2023. These observations suggest that its 2023 year-to-date rally may be a bearish corrective up move sequence rather than a bullish impulsive one that could propel it to a fresh all-time high level.
Secondly, the implied volatility of the Nasdaq 100 as measured by the CBOE VXN Index has increased significantly in the past three weeks. It cleared above its 23.85 key medium-term resistance and traded at a seven-month high of 25.31 last Friday, 20 October after being compressed to a depressed zone of 18.45 to 17.25 during the summer months of 2023. Higher levels of implied volatility tend to suggest a likely more pronounced down move sequence in the price actions of the Nasdaq 100.
Watch the key short-term resistance at 14,615
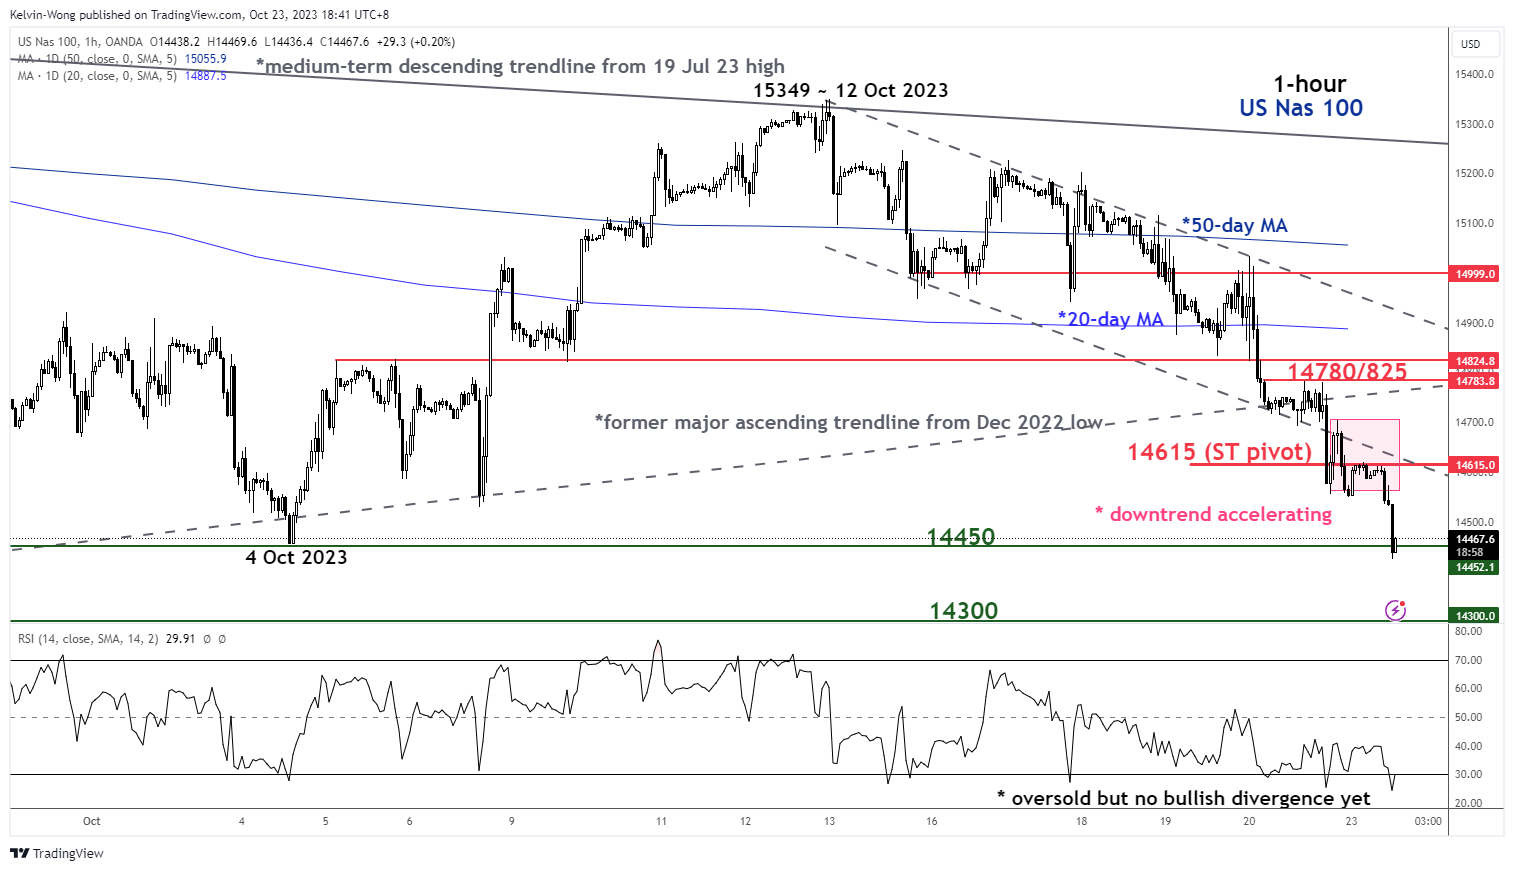
Fig 2: US Nas 100 minor short-term trend as of 23 Oct 2023 (Source: TradingView, click to enlarge chart)
In today’s European session, the short-term price actions of the US Nas 100 Index as seen on its 1-hour chart have failed to reintegrate back into the minor descending channel’s lower boundary that was broken down during last Friday, 20 October (US session) now turns into a pull-back resistance at 14,615.
Also, the hourly RSI indicator has dipped into its oversold region (below 30) but without any clear bullish divergence condition which suggests a potential minor snap-back in price actions may occur towards the 14,530 near-term resistance rather than a more pronounced bullish reversal.
The next intermediate support to watch will be at 14,300 and a break below it exposes the key 200-day moving average now acting as a support at 13,960 (see daily chart).
However, a clearance above 14,615 key short-term pivotal resistance negates the bullish tone for a deeper snap-back towards the next intermediate resistance zone of 14,780/14,825 (the former major ascending trendline from December 2022 low and the 50% Fibonacci retracement of the current downside acceleration from 17 October 2023 minor high to today’s current intraday low of 14,425 at this time of the writing.)
Japanese Yen Flirts with 150, PMIs Next
- USD/JPY briefly pushes below 150
- Japan releases PMIs on Tuesday
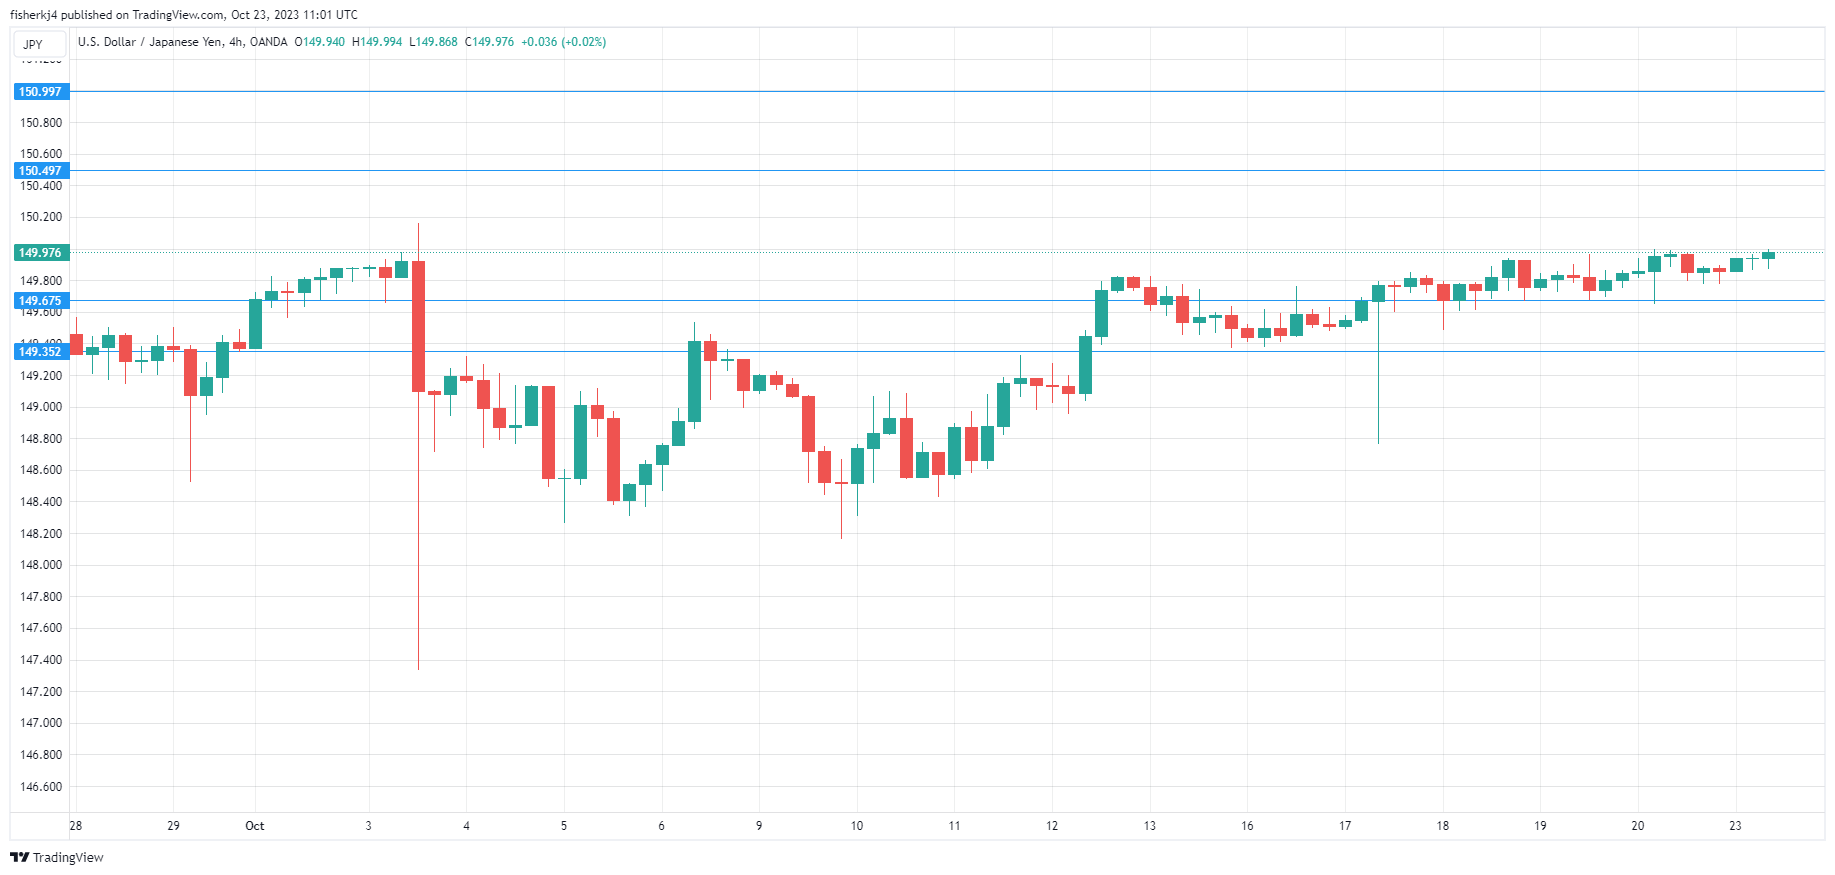
The Japanese yen is trading quietly on Monday. In the European session, USD/JPY is trading at 149.98, up 0.07%.
The yen showed little movement last week, hovering just shy of the symbolic 150 line. The lack of movement has continued today, but dollar-yen broke above 150 very briefly in the Asian session, during hours with low liquidity.
The US/Japan rate differential has been the driver of the yen’s rapid depreciation in the past few months. US Treasury 10-year yields have pushed above 5.0% on Monday, while Japanese 10-year yields are only 0.87%. Despite this gap, which is widening, the Bank of Japan is standing firm with its ultra-loose monetary policy. Governor Ueda said on Friday that the central bank would “patiently” maintain policy but warned that the economic outlook was highly uncertain.
The BoJ meets on Oct. 30-31 and is expected to maintain policy settings. Traders should be on alert nevertheless, as the BoJ has tweaked policy in the past with no prior warning, which has triggered significant volatility from the yen. The Bank will release new quarterly growth and inflation forecasts, which could affect the yen’s direction. There are growing expectations that the BoJ will shift policy in 2024, first with a shift in yield curve control, followed by a rate increase later in the year.
Japan will release PMI reports on Tuesday. The manufacturing sector remains depressed, with four consecutive months of contraction. Exports have fallen due to weak global demand and China’s slowdown has only made matters worse. The October print is expected at 49.0, compared to 48.5 in September.
The services sector is in better shape, and the September reading of 53.8 (revised upwards) marked 13 straight months of growth. However, growth weakened compared to the 54.3 reading in August, as employment and foreign demand fell. The downtrend is expected to continue in October, with a market consensus of 52.9.
USD/JPY Technical
- There is resistance at 150.49 and 150.99
- 149.67 is a weak support level, followed by 149.35
Bundesbank’s monthly report paints a bleak picture of Germany’s economy
Bundesbank's latest monthly report revealed a likely contraction in Germany's real GDP during Q3, attributing this slump to dwindling foreign demand for industrial goods. Elevated financing costs have not only hampered investments but also stymied domestic demand, particularly in the construction and industrial sectors.
Despite these economic headwinds, German job market has shown resilience, with pronounced wage increases amidst declining inflation offering a silver lining. However, this positive spin has yet to translate into increased consumer spending. Data suggests that private households are opting for caution, channeling additional funds into savings rather than expenditure, a trend underscored by diminished real sales in the retail and hospitality industries.
Inflation dynamics in September offer a mixed bag. The report highlighted a moderate uptick in energy and food prices, whilst services experienced an above-average increase. Bundesbank anticipates a deceleration in inflation in the forthcoming months.