Sample Category Title
USD/CHF Daily Outlook
Daily Pivots: (S1) 0.8892; (P) 0.8925; (R1) 0.8945; More....
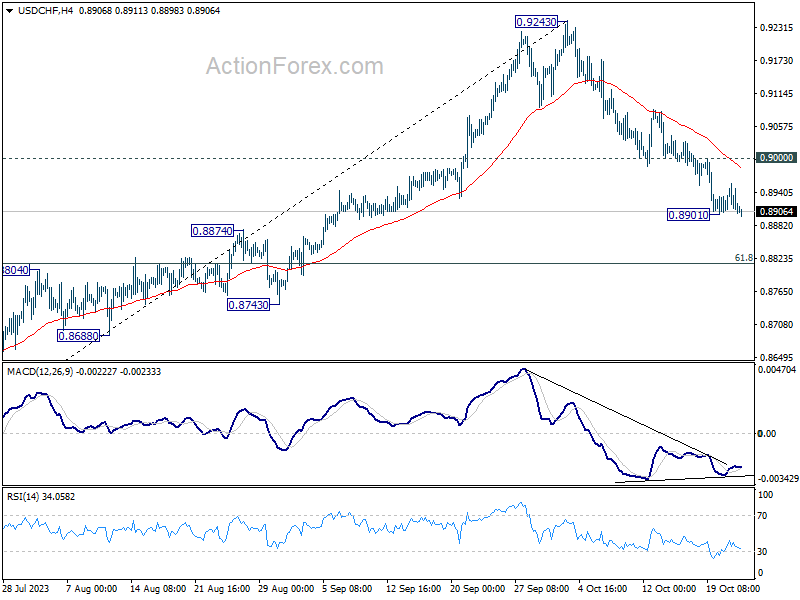
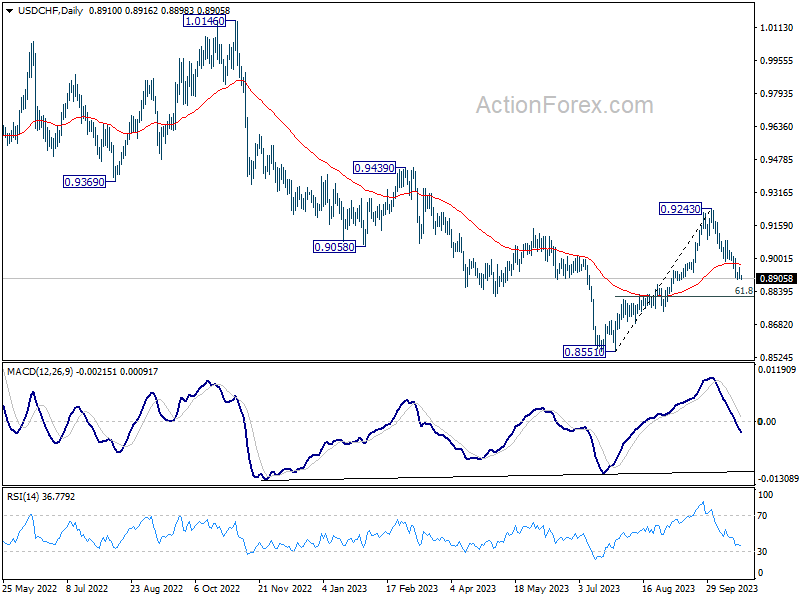
Intraday bias in USD/CHF remains neutral for the moment, and but further decline is expected as long as 0.9000 resistance holds. Below 0.8901 will resume the fall from 0.9243 to 61.8% retracement of 0.8551 to 0.9243 at 0.8815 next. Sustained break there will pave the way to retest 0.8551 low. Nevertheless, break of 0.9000 will turn bias back to the upside for stronger rebound.
In the bigger picture, the firm break of 55 D EMA (now at 0.8974) argues that rebound from 0.8551 might be completed as a correction at 0.9243. In other words, larger fall from 1.0146 (2022 high) is possibly not over yet. Risk will now stay on the downside as long as 0.9243 resistance holds. Firm break of 0.8551 will confirm down trend resumption.
GBP/USD Daily Outlook
Daily Pivots: (S1) 1.2174; (P) 1.2216; (R1) 1.2290; More
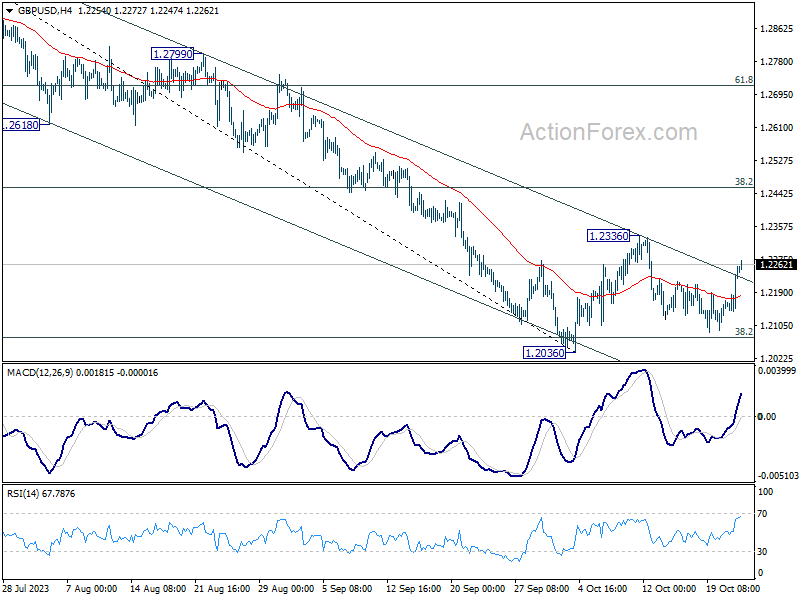
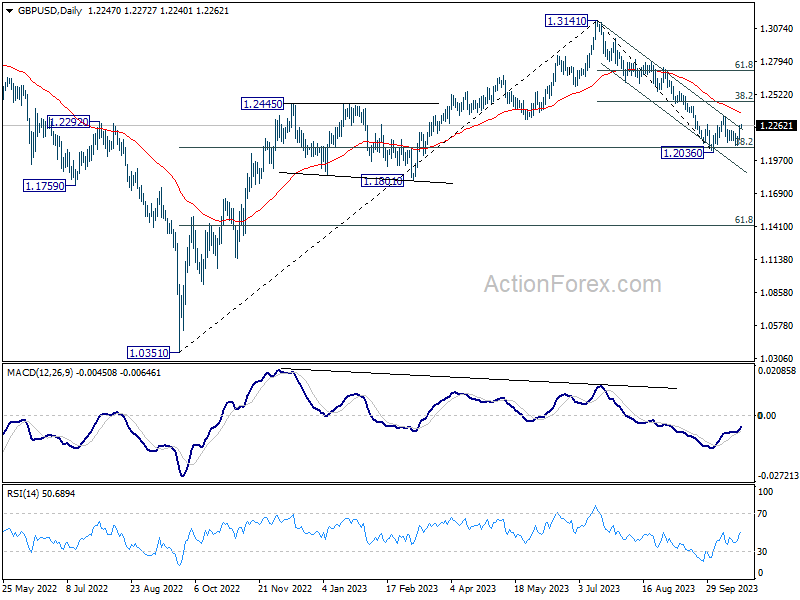
GBP/USD is staying in range of 1.2036/2336 despite current recovery. Intraday bias remains neutral for the moment, and downside breakout is mildly in favor. On the downside, decisive break of 1.2036 will resume whole decline from 1.3141 for 1.1801 support next. However, break of 1.2336 will turn bias back to the upside for 38.2% retracement of 1.3141 to 1.2036 at 1.2458.
In the bigger picture, fall from 1.3141 medium term top could still be a correction to up trend from 1.0351 (2022 low) only. But risk of complete trend reversal is rising. Sustained break of 38.2% retracement of 1.0351 to 1.3141 at 1.2075 will pave the way to 61.8% retracement at 1.1417. For now, risk will stay on the downside as long as 55 D EMA (now at 1.2384) holds, in case of rebound.
EUR/USD Daily Outlook
Daily Pivots: (S1) 1.0601; (P) 1.0640; (R1) 1.0707; More...
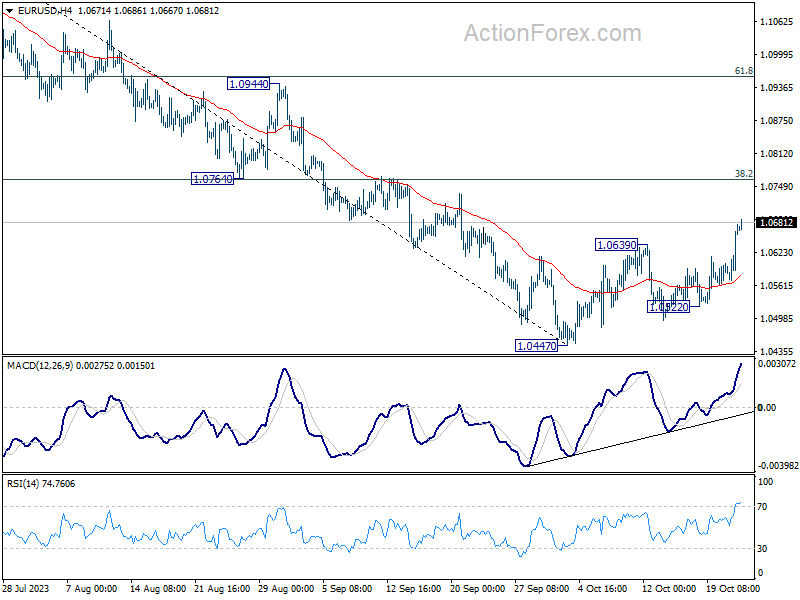
EUR/USD's solid break of 1.0639 resistance short term bottoming at 1.0447, on bullish convergence condition in 4H MACD. Intraday bias is back on the upside for 1.0764 cluster resistance (38.2% retracement of 1.1274 to 1.0447 at 1.0763). Rejection by this level, followed by break of 1.0522 support, will retain near term bearishness for resuming the whole decline from 1.1274. However, sustained break of 1.0763/4 will pave the way to 61.8% retracement at 1.0958.
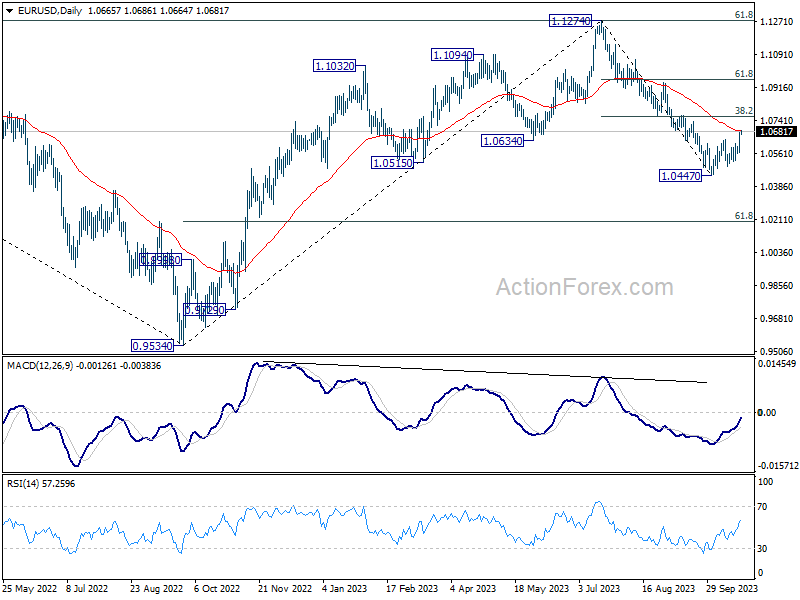
In the bigger picture, fall from 1.1274 medium term top could still be a correction to rise from 0.9534 (2022 low). But chance of a complete trend reversal is rising. In either case, current fall should target 61.8% retracement of 0.9534 to 1.1274 at 1.0199 next. For now, risk will stay on the downside as long as 55 D EMA (now at 1.0684) holds, in case of rebound.
Euro Rides High on Technicals, Yet Fundamental Proof Awaits
In a surprising twist, Euro experienced a significant surge overnight, powering through a short-term resistance level when matched up against Dollar. Euro in also a position to resume its long-term up trend versus Yen. he factors fuelling this surge, however, remain a subject of speculation. On one hand, recent economic indicators have been less than stellar, and there's a strong expectation that ECB will keep interest rates unchanged this week.
One plausible explanation for Euro's rally could be the dip in US benchmark yield, but with Germany's yields also taking a dip, the exact impetus remains elusive. The question lingers: is this newfound Euro strength stemming from an underlying fundamental factor, or is it merely a corrective rebound after exhausting the pronounced selloff against Dollar and Swiss Franc?
Looking at the broader currency markets, Sterling closely tails Euro as the second-best performer for the week thus far, succeeded by Aussie and subsequently Kiwi. Contrarily, Dollar lags as this week's weakest link, followed closely by Yen and Swiss Franc. The slackening of these traditionally safe-haven currencies might suggest a diminishing risk-off sentiment. Yet, this interpretation doesn't seem to correlate with the ongoing stasis in stocks or the sustained resilience in Gold.
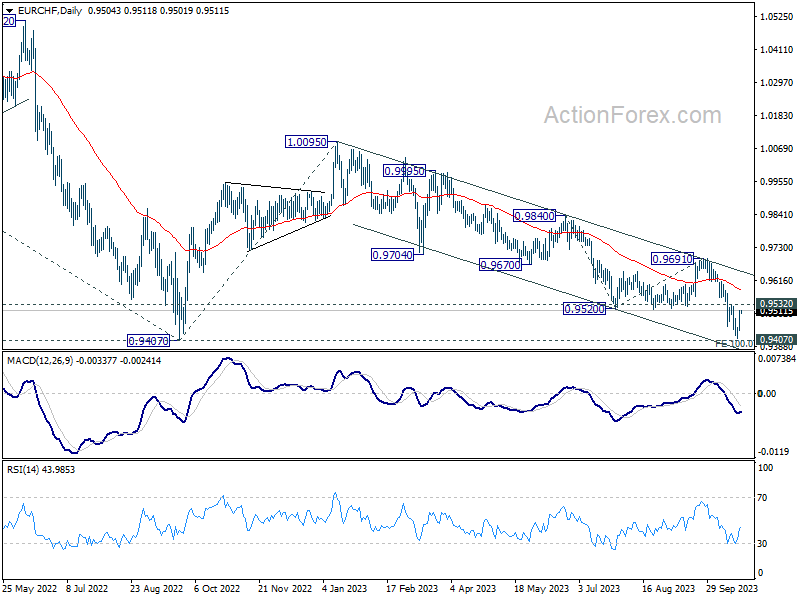
On the technical front, for the Euro to validate its newfound vigor, it would need to convincingly surpass the 0.9532 resistance against Swiss Franc, confirming short term bottoming. More critically, such a move would demonstrate a successful defense of the pivotal 0.9407 support level by EUR/CHF. An assertive advance through 0.9532 could potentially act as a tailwind, elevating Euro's stance elsewhere. Conversely, if 0.9532 resistance stands firm, it could dampen short-term prospects for EUR/CHF, consequently restraining Euro's surge against other currencies.
In Asia, at the time of writing, Nikkei is down -0.55%. Hong Kong HSI is down -0.87%. China Shanghai SSE is up 0.38%. Singapore Strait Times is up 0.45%. Japan 10-year JGB yield is down -0.0186 at 0.856. Overnight, DOW dropped -0.58%. S&P 500 dropped -0.17%. NASDAQ rose 0.27%. 10-year yield dropped -0.086 to 4.838.
Australia's PMI composite dives to 47.3, slowdown amid sticky inflation
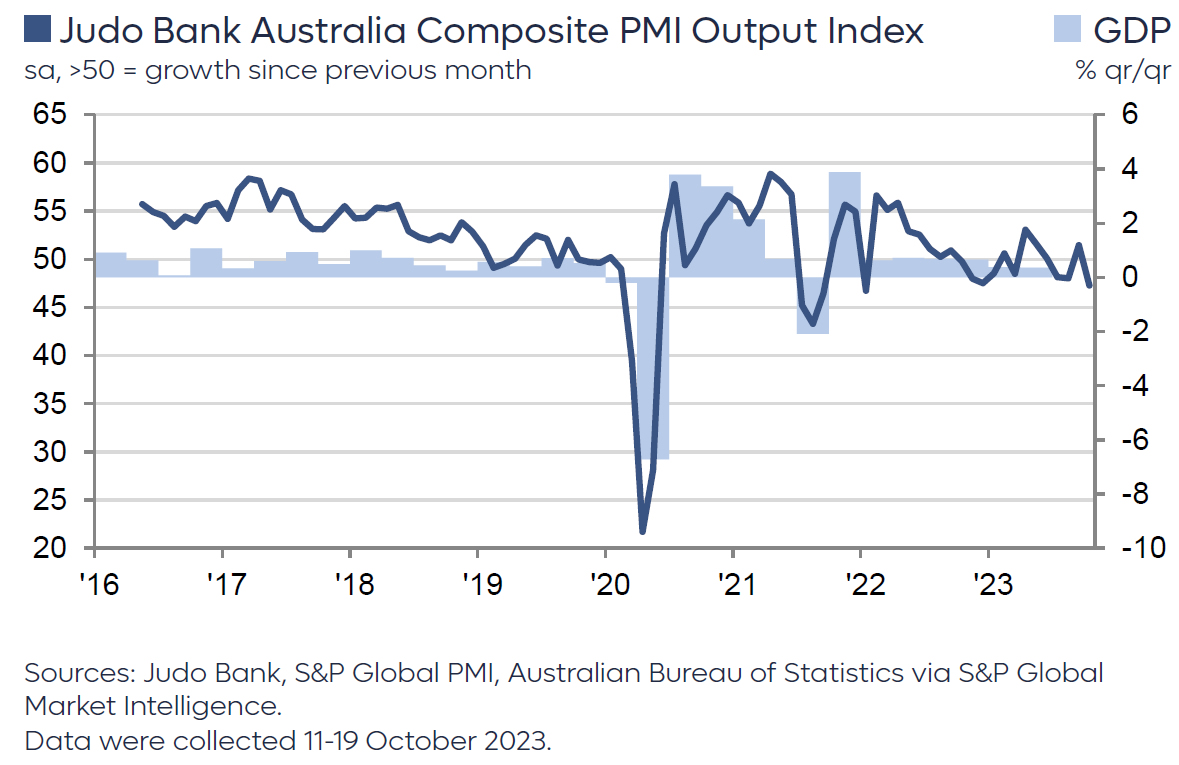
Australia's economic indicators from October paint a worrisome picture, as PMI Manufacturing dipped to a six-month low at 48.0, down from 48.7. More significantly, PMI Services plunged to a 10-month trough, dropping from 51.8 to 47.6. PMI Composite, which combines both manufacturing and services, dropped to a concerning 21-month low of 47.3 from 51.5.
Weighing in on these figures, Warren Hogan, Chief Economic Advisor at Judo Bank, mentioned PMI output index reverting to cyclical lows around 47 after a brief rise above the neutral 50 mark in September. These PMI indicators resonate with the ongoing narrative that Australia's economic momentum has decelerated in 2023, aligning with the anticipated gentle slowdown most economists had projected.
A silver lining, however, emerges from the employment index, which remains steadfastly above the 50-mark. Hogan interprets this as a sign that the deceleration in business activities hasn't notably dampened hiring trends.
However, a significant area of concern highlighted by Hogan is the enduring nature of inflation pressures, which he refers to as "stickiness". Both input and output price indexes remain elevated, not hinting at an imminent return of inflation to RBA's target.
As RBA prepares for its board meeting, set to coincide with Melbourne Cup day, the latest PMI readings, especially concerning inflation, are unlikely to drastically influence the interest rate decision. Hogan articulated, "A strong case exists for a further modest upward adjustment to the Australian cash rate target, to ensure the economy remains on the so-called 'narrow path'. If we are to avoid recession, Australia will need an extended period of below-trend growth to ensure inflation returns to target by 2025."
Japan's PMI manufacturing unchanged at 48.5, worst slump in eight months
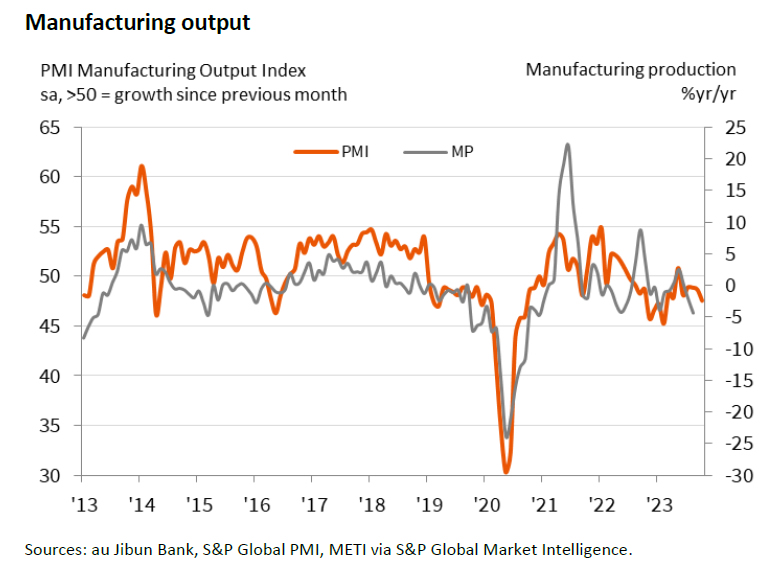
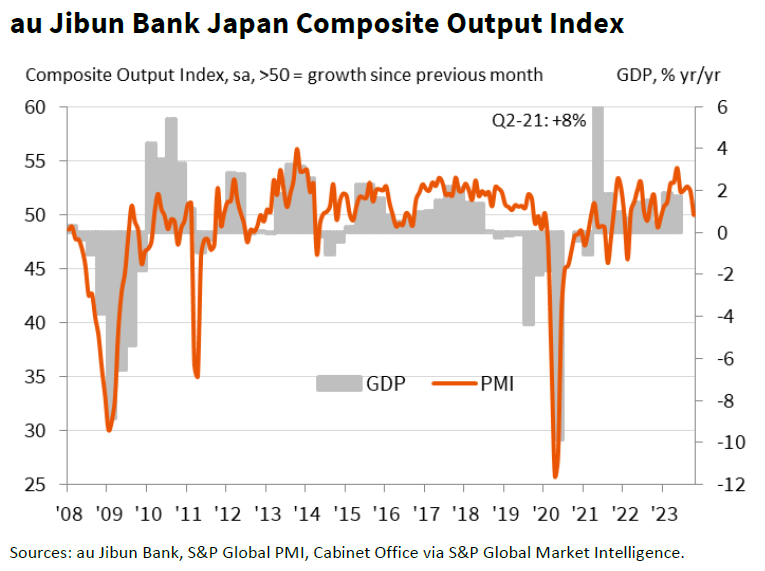
October saw Japan's PMI Manufacturing remain unchanged at 48.5, missing expectations of 48.9 and marking the fifth consecutive month showing deteriorating operating conditions. Additionally, PMI Services and PMI Composite displayed downturns, with the former dropping from 53.8 to 51.1 and the latter declining from 52.1 to a sub-50 figure of 49.9.
Jingyi Pan, Economics Associate Director at S&P Global Market Intelligence, noted that this is the first instance of a decline in business activity for the private sector since December 2022. The drop, albeit marginal, was primarily due to a more pronounced decrease in manufacturing output – the fastest rate seen in eight months. On the other hand, services activity did continue its expansion, albeit at its slowest pace for the year.
The overall sentiment among firms was not particularly encouraging either. They expressed the least optimism since the beginning of the year concerning future output, suggesting a tempered outlook for the immediate future. However, a silver lining in the employment sector, which saw a resurgence, particularly in the service sector.
On the pricing front, both manufacturing and service sectors experienced diminished cost pressures. This deceleration resulted in output prices within the private sector rising at their most muted pace since February 2022.
Bitcoin soars past 35k, ETF approval anticipation and geopolitical tensions fueling the surge
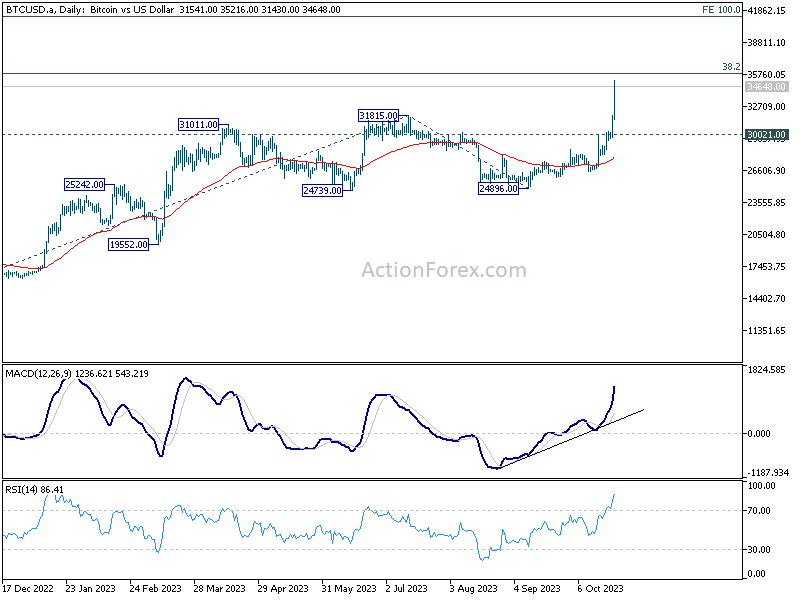
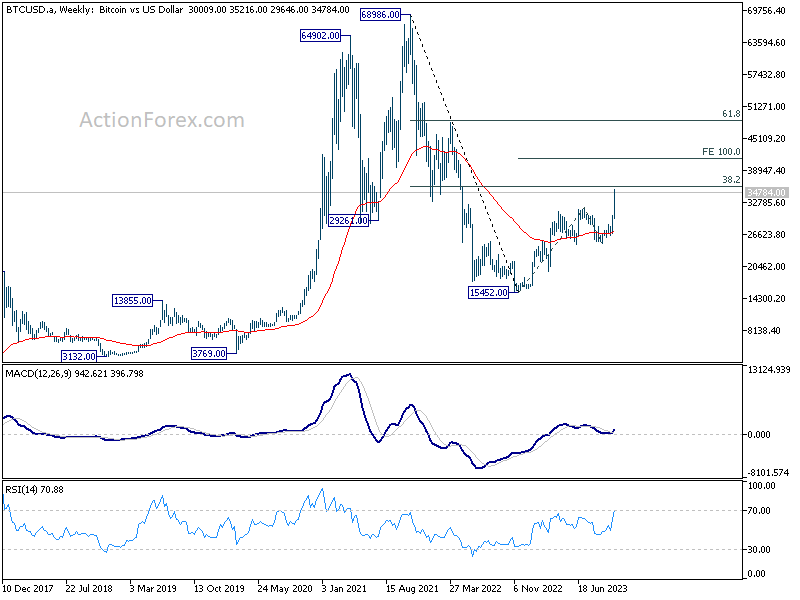
Bitcoin is experiencing a significant surge this week, effortlessly crossing its previous resistance at 31815 and making its mark beyond 35k. Notably, Bitcoin is now approaching a critical long-term fibonacci resistance near 36k. While it's uncertain whether Bitcoin can clear this barrier on its first attempt, a definitive break past this resistance could lead to profound long-term bullish implications. Such a move might propel Bitcoin swiftly past 40k next.
A potential catalyst for this robust rally is the market's anticipation of a spot BTC ETF approval. Despite last week's false report, the consensus among market participants suggests that this approval could materialize within the upcoming three months, if not sooner. Another factor worth considering is the role of geopolitical tensions in influencing Bitcoin's demand. As many in the investment community have come to regard Bitcoin as the "digital gold", it's plausible that some are turning to the cryptocurrency as an alternative safe haven amid global uncertainties.
From a technical standpoint, near term outlook will stay bullish as long as 30021 resistance turned support holds. The key resistance is 38.2% retracement of 68986 to 15452 at 35901. Sustained break there will argue that it's already reversing, rather than correcting, the whole down trend from 68986 (2021 high). Next near term target will be 100% projection of 15452 to 31815 from 24896 at 41259.
Looking ahead
Germany Gfk consumer sentiment, Eurozone PMIs and UK PMIs will be the highlights for European session. Later in the day, Canada will publish new housing price index while US will also release PMIs.
EUR/USD Daily Outlook
Daily Pivots: (S1) 1.0601; (P) 1.0640; (R1) 1.0707; More...
EUR/USD's solid break of 1.0639 resistance short term bottoming at 1.0447, on bullish convergence condition in 4H MACD. Intraday bias is back on the upside for 1.0764 cluster resistance (38.2% retracement of 1.1274 to 1.0447 at 1.0763). Rejection by this level, followed by break of 1.0522 support, will retain near term bearishness for resuming the whole decline from 1.1274. However, sustained break of 1.0763/4 will pave the way to 61.8% retracement at 1.0958.
In the bigger picture, fall from 1.1274 medium term top could still be a correction to rise from 0.9534 (2022 low). But chance of a complete trend reversal is rising. In either case, current fall should target 61.8% retracement of 0.9534 to 1.1274 at 1.0199 next. For now, risk will stay on the downside as long as 55 D EMA (now at 1.0684) holds, in case of rebound.
Economic Indicators Update
| GMT | Ccy | Events | Actual | Forecast | Previous | Revised |
|---|---|---|---|---|---|---|
| 22:00 | AUD | Manufacturing PMI Oct P | 48 | 48.7 | ||
| 22:00 | AUD | Services PMI Oct P | 47.6 | 51.8 | ||
| 00:30 | JPY | Manufacturing PMI Oct P | 48.5 | 48.9 | 48.5 | |
| 06:00 | EUR | Germany Gfk Consumer Confidence Nov | -27.3 | -26.5 | ||
| 06:00 | GBP | Claimant Count Change Sep | 2.3K | 0.9K | ||
| 06:00 | GBP | ILO Unemployment Rate 3M Aug | 4.30% | 4.30% | ||
| 07:15 | EUR | France Manufacturing PMI Oct P | 44.8 | 44.2 | ||
| 07:15 | EUR | France Services PMI Oct P | 44.6 | 44.4 | ||
| 07:30 | EUR | Germany Manufacturing PMI Oct P | 40.1 | 39.6 | ||
| 07:30 | EUR | Germany Services PMI Oct P | 50.1 | 50.3 | ||
| 08:00 | EUR | Eurozone Manufacturing PMI Oct P | 43.7 | 43.4 | ||
| 08:00 | EUR | Eurozone Services PMI Oct P | 48.7 | 48.7 | ||
| 08:30 | GBP | Manufacturing PMI Oct P | 45.2 | 44.3 | ||
| 08:30 | GBP | Services PMI Oct P | 49.5 | 49.3 | ||
| 12:30 | CAD | New Housing Price Index M/M Sep | 0.10% | 0.10% | ||
| 13:45 | USD | Manufacturing PMI Oct P | 49.5 | 49.8 | ||
| 13:45 | USD | Services PMI Oct P | 49.9 | 50.1 |
GBP/USD Faces Uphill Task, Bitcoin Surges 15%
Key Highlights
- GBP/USD is attempting a recovery wave above the 1.2200 resistance.
- It broke a major contracting triangle with resistance near 1.2185 on the 4-hour chart.
- Bitcoin price rallied over 15% and tested the $35,000 resistance.
- The UK Manufacturing PMI could increase slightly from 44.3 to 45.0 in Oct 2023.
GBP/USD Technical Analysis
The British Pound started a recovery wave above 1.2120 against the US dollar. GBP/USD gained pace above 1.2150 to move into a short-term positive zone.
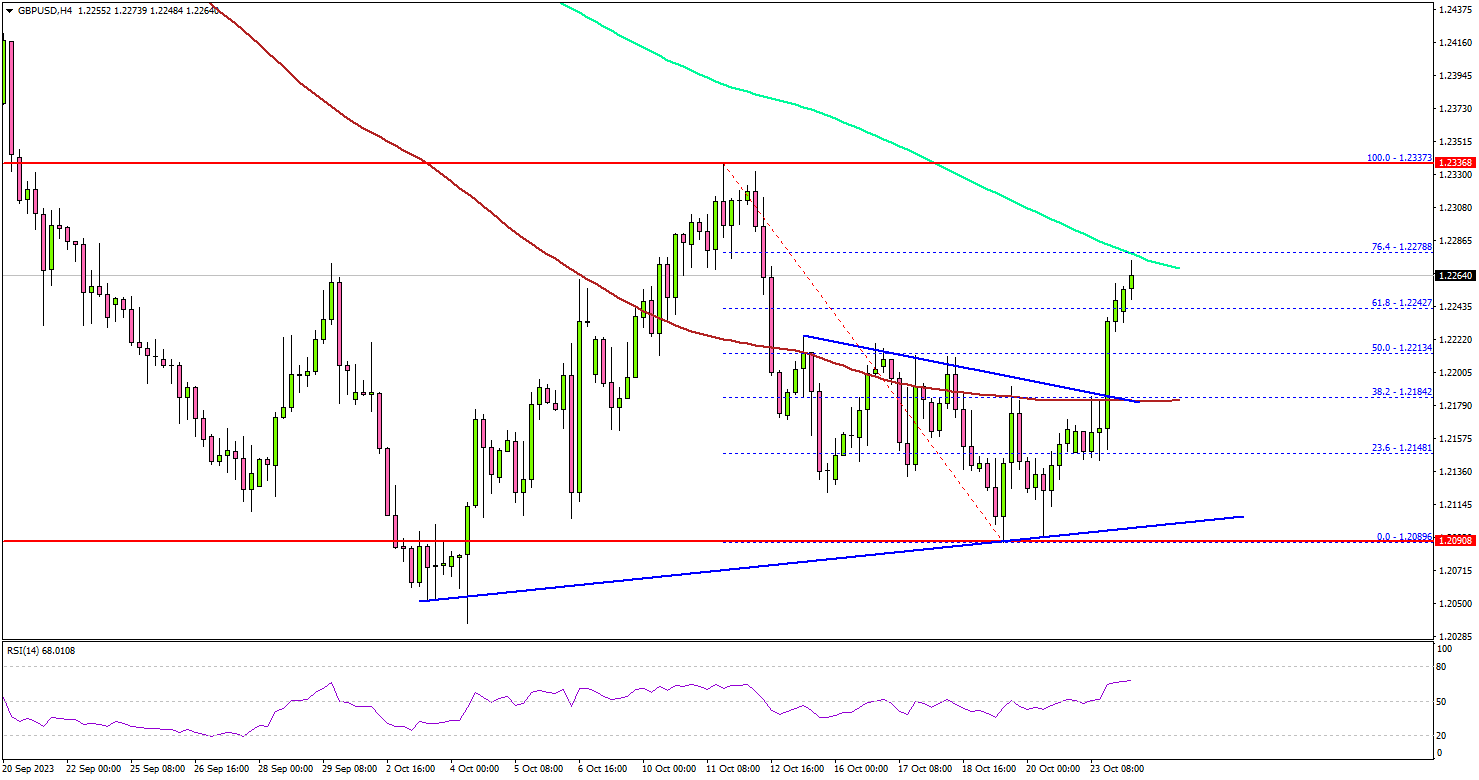
Looking at the 4-hour chart, the pair managed to surpass the 1.2200 resistance zone and the 100 simple moving average (red, 4 hours). It also broke a major contracting triangle with resistance near 1.2185.
The pair is now facing hurdles near the 1.2270 level and the 200 simple moving average (green, 4 hours). It is close to the 76.4% Fib retracement level of the downward move from the 1.2337 swing high to the 1.2089 low.
If there is a clear move above 1.2270, the pair could rise toward the 1.2340 resistance. The next key resistance is near 1.2400, above which the pair could rise toward the 1.2450 level.
If there is a fresh decline, the pair might find bids near 1.2220. The next key support is seen near the 1.2200 level, below which it could test the 100 simple moving average (red, 4 hours) at 1.2185. Any more losses might send the pair toward the 1.2120 level.
Looking at Bitcoin, there was a strong increase, and the price was able to clear many hurdles near the $32,000 and $34,200 levels.
Economic Releases
- Germany’s Manufacturing PMI for Oct 2023 (Preliminary) - Forecast 40.0, versus 39.6 previous.
- Germany’s Services PMI for Oct 2023 (Preliminary) - Forecast 50.0, versus 50.3 previous.
- Euro Zone Manufacturing PMI for Oct 2023 (Preliminary) – Forecast 43.7, versus 43.4 previous.
- Euro Zone Services PMI for Oct 2023 (Preliminary) – Forecast 48.7, versus 48.7 previous.
- UK Manufacturing PMI for Oct 2023 (Preliminary) – Forecast 45.0, versus 44.3 previous.
- UK Services PMI for Oct 2023 (Preliminary) – Forecast 49.5, versus 49.3 previous.
- US Manufacturing PMI for Oct 2023 (Preliminary) – Forecast 49.5, versus 49.8 previous.
- US Services PMI for Oct 2023 (Preliminary) – Forecast 49.9, versus 50.1 previous.
EURJPY Extends Higher in Bullish Cycle
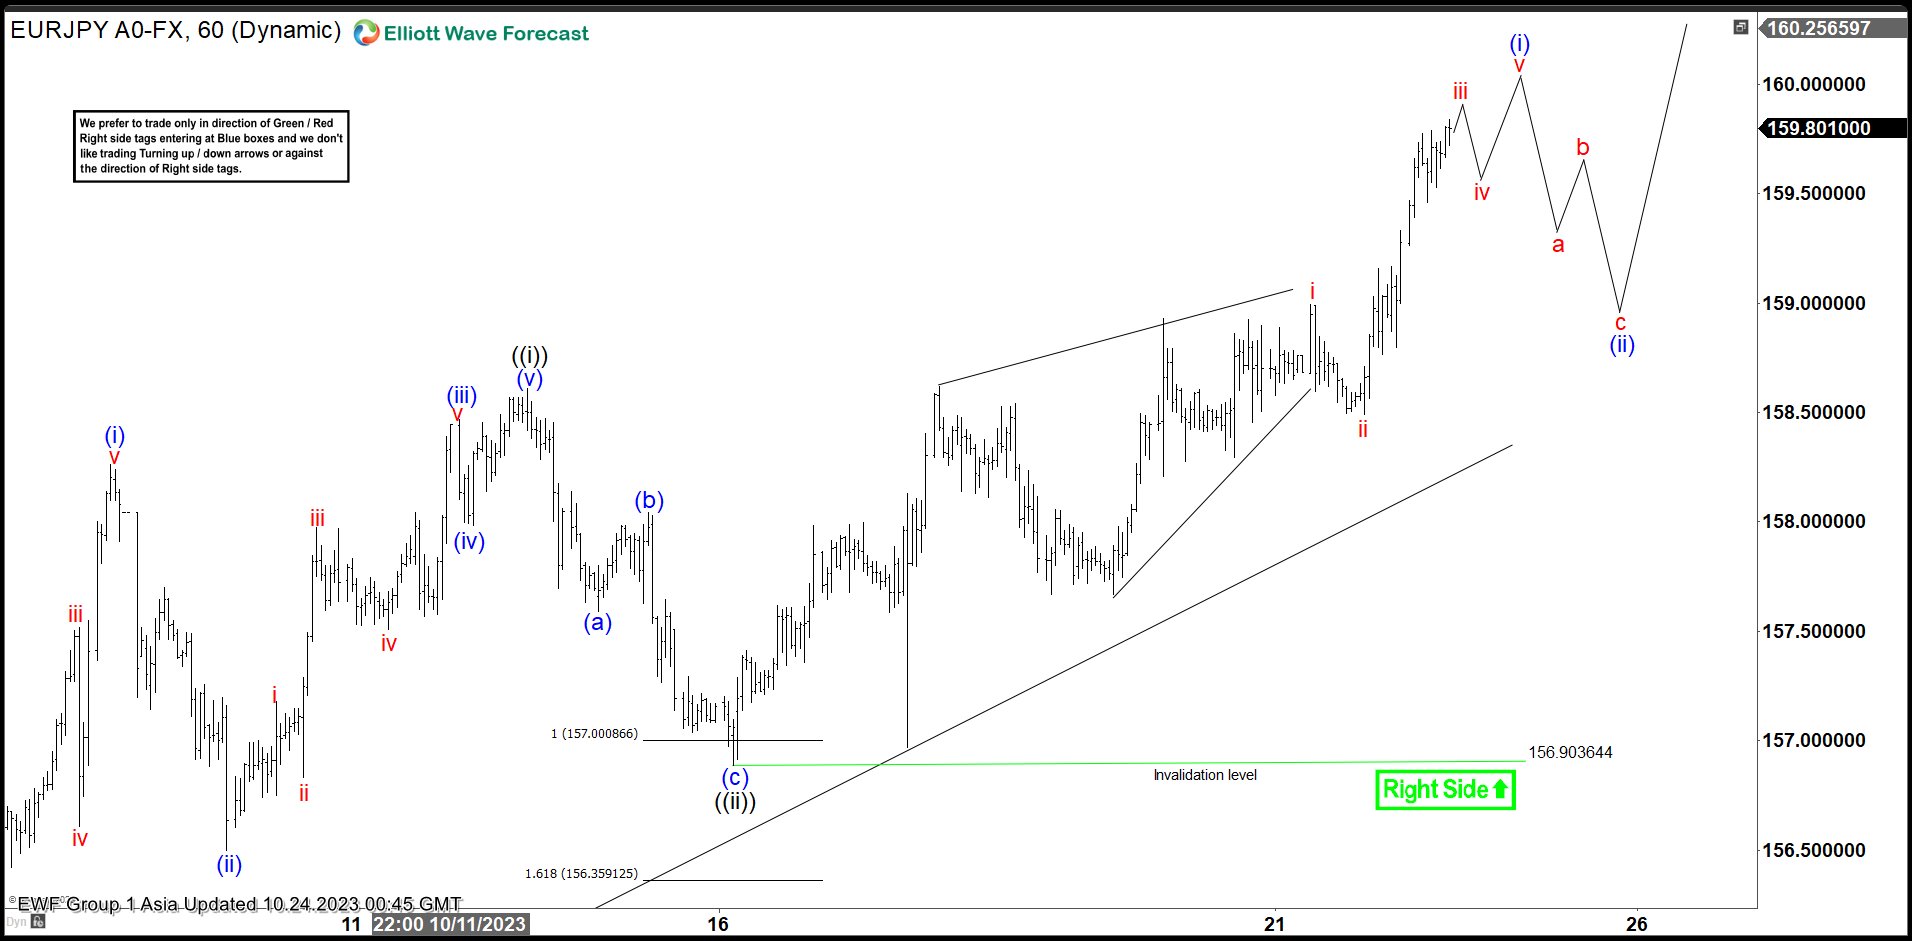
EURJPY extends higher and the pair has broken above the previous high on 8.30.2023 at 159.76 suggesting the next leg higher has started. Cycle from 10.3.2023 low is currently in progress as an impulse structure. Up from 10.3.2023 low, wave (i) ended at 158.26. Pullback in wave (ii) ended at 156.5 and wave (iii) rally ended at 158.44. Dips in wave (iv) ended at 157.98 and pair ended wave (v) higher at 158.61 which also completed wave ((i)). Pullback in wave ((ii)) ended at 156.88 with internal subdivision as a zigzag structure.
Down from wave ((i)), wave (a) ended at 157.589 and wave (b) rally ended at 158.04. Pair then extended lower in wave (c) towards 156.9 which completed wave ((ii)). Pair then resumed higher in wave ((iii)). Up from wave ((ii)), wave i ended at 158.99 and pullback in wave ii ended at 158.49. Expect pair to extend higher in wave iii, followed by pullback in wave iv, and higher again in wave v. This should complete wave (i) of ((iii)). Pair should then pullback in wave (ii) of ((iii)) to correct cycle from 10.16.2023 low before it resumes higher again. Near term, while pivot at 156.9 low stays intact, expect pullback to find support in 3, 7, or 11 swing for further upside.
EURJPY 60 Minutes Elliott Wave Chart
EURJPY Elliott Wave Video
https://www.youtube.com/watch?v=vfnCgrHRyXc
Bitcoin soars past 35k, ETF approval anticipation and geopolitical tensions fueling the surge
Bitcoin is experiencing a significant surge this week, effortlessly crossing its previous resistance at 31815 and making its mark beyond 35k. Notably, Bitcoin is now approaching a critical long-term fibonacci resistance near 36k. While it's uncertain whether Bitcoin can clear this barrier on its first attempt, a definitive break past this resistance could lead to profound long-term bullish implications. Such a move might propel Bitcoin swiftly past 40k next.
A potential catalyst for this robust rally is the market's anticipation of a spot BTC ETF approval. Despite last week's false report, the consensus among market participants suggests that this approval could materialize within the upcoming three months, if not sooner. Another factor worth considering is the role of geopolitical tensions in influencing Bitcoin's demand. As many in the investment community have come to regard Bitcoin as the "digital gold", it's plausible that some are turning to the cryptocurrency as an alternative safe haven amid global uncertainties.
From a technical standpoint, near term outlook will stay bullish as long as 30021 resistance turned support holds. The key resistance is 38.2% retracement of 68986 to 15452 at 35901. Sustained break there will argue that it's already reversing, rather than correcting, the whole down trend from 68986 (2021 high). Next near term target will be 100% projection of 15452 to 31815 from 24896 at 41259.
Japan’s PMI manufacturing unchanged at 48.5, worst slump in eight months
October saw Japan's PMI Manufacturing remain unchanged at 48.5, missing expectations of 48.9 and marking the fifth consecutive month showing deteriorating operating conditions. Additionally, PMI Services and PMI Composite displayed downturns, with the former dropping from 53.8 to 51.1 and the latter declining from 52.1 to a sub-50 figure of 49.9.
Jingyi Pan, Economics Associate Director at S&P Global Market Intelligence, noted that this is the first instance of a decline in business activity for the private sector since December 2022. The drop, albeit marginal, was primarily due to a more pronounced decrease in manufacturing output – the fastest rate seen in eight months. On the other hand, services activity did continue its expansion, albeit at its slowest pace for the year.
The overall sentiment among firms was not particularly encouraging either. They expressed the least optimism since the beginning of the year concerning future output, suggesting a tempered outlook for the immediate future. However, a silver lining in the employment sector, which saw a resurgence, particularly in the service sector.
On the pricing front, both manufacturing and service sectors experienced diminished cost pressures. This deceleration resulted in output prices within the private sector rising at their most muted pace since February 2022.
Australia’s PMI composite dives to 47.3, slowdown amid sticky inflation
Australia's economic indicators from October paint a worrisome picture, as PMI Manufacturing dipped to a six-month low at 48.0, down from 48.7. More significantly, PMI Services plunged to a 10-month trough, dropping from 51.8 to 47.6. PMI Composite, which combines both manufacturing and services, dropped to a concerning 21-month low of 47.3 from 51.5.
Weighing in on these figures, Warren Hogan, Chief Economic Advisor at Judo Bank, mentioned PMI output index reverting to cyclical lows around 47 after a brief rise above the neutral 50 mark in September. These PMI indicators resonate with the ongoing narrative that Australia's economic momentum has decelerated in 2023, aligning with the anticipated gentle slowdown most economists had projected.
A silver lining, however, emerges from the employment index, which remains steadfastly above the 50-mark. Hogan interprets this as a sign that the deceleration in business activities hasn't notably dampened hiring trends.
However, a significant area of concern highlighted by Hogan is the enduring nature of inflation pressures, which he refers to as "stickiness". Both input and output price indexes remain elevated, not hinting at an imminent return of inflation to RBA's target.
As RBA prepares for its board meeting, set to coincide with Melbourne Cup day, the latest PMI readings, especially concerning inflation, are unlikely to drastically influence the interest rate decision. Hogan articulated, "A strong case exists for a further modest upward adjustment to the Australian cash rate target, to ensure the economy remains on the so-called 'narrow path'. If we are to avoid recession, Australia will need an extended period of below-trend growth to ensure inflation returns to target by 2025."
AUDUSD Wave Analysis
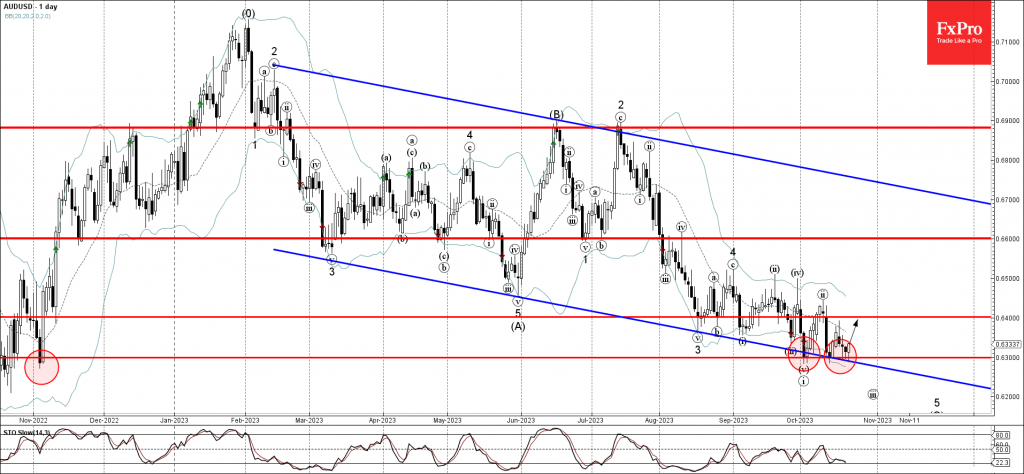
- AUDUSD reversed from key support level 0.6300
- Likely to rise to resistance level 0.6400
AUDUSD currency pair recently reversed up from the key support level 0.6300 (which has been reversing the pair from November).
The support level 0.6300 was strengthened by the lower daily Bollinger Band and by the support trendline of the weekly down channel from February.
Given the strength of the support level 0.6300, AUDUSD can be expected to rise further toward the next resistance level 0.6400.