Sample Category Title
Focus on PMI Data Today
Market movers today
We will get October flash PMIs from euro area, UK and the US, which are widely expected to show that economic activity continues to slow down.
Another release of interest today will be the ECB bank lending survey ahead of Thursday's ECB meeting on Thursday.
The 60 second overview
Markets: Equities displayed mixed performance on Monday as the 10-year Treasury yield briefly exceeded 5.00% before receding to around 4.85%. Yesterday was a quiet start to the week on the economic data front. This morning, Asian equity markets are mostly down. PMI data from Japan showed the first decline since December 2022, especially in the service sector, which declined notably but remained in expansionary territory. Elsewhere, EUR/USD reached monthly highs around 1.0680 due to the decline in US yields. Scandi currencies remain under pressure with EUR/SEK and EUR/NOK slightly above 11.70 and 11.80, respectively.
PMIs: The focus today is on growth in the euro area and the US in October. Preliminary PMI data suggests a decline in both manufacturing and service sectors in the US. Manufacturing is expected to decrease to 49.4 from September's 49.8, while services PMI is expected to fall below the 50 threshold to 49.9 from 50.1. In the euro area, consensus expects relatively unchanged figures for both sectors. Manufacturing is expected to increase slightly to 43.6 from 43.4, while services is expected to decrease slightly to 48.6 from 48.7.
Sweden: Riksbank governor Erik Thedéen will appear before Riksdag's Finance Committee and discuss the Riksbank's financial position, earning capacity and long-term capital requirements. The meeting is scheduled for 11:00. A summary will be published in association with that. The background is the Riksbank's significant losses on the bond portfolio and that over time the Riksbank must raise its own capital to safeguard its own financial independence.
Equities: Global equities were lower yesterday despite a turnaround in yields and oil prices. Hence, a first glance this could look like more classic growth-related risk-off but at the same time cyclicals growth stocks such as tech and consumer discretionary were outperforming and hence, the equity market is still very nervous and investors are confused about which direction the market will go. In the US: Dow -0.6%, S&P 500 -0.2%, Nasdaq +0.3% and Russell 2000 -0.9%. There was more optimism in Asia this morning with gains outside Japan and China. US futures are higher while European futures are lower.
FI: 10Y US Treasuries moved above 5% yesterday before declining some 15bp. Furthermore, the curve flattened from the long end. Currently, the US bond market is caught between the "higher for longer" scenario relative to the recession scenario. This has to be combined with Federal Reserve's monthly QT programme. On top of this there is a supply pressure from the significant US budget deficit as well as a declining demand for US Treasuries from overseas investors. Finally, we have seen an increased issuance in USD-denominated debt from e.g. European issuers as the Euro market is under pressure by the ECB QT programme and reduction in excess liquidity.
FX: EUR/USD climbed to 1.0670, a one-month high, amid USD weakening due to falling US yields. The decline in US yields pushed USD/JPY lower to around 149.5. EUR/GBP is still slightly above the 0.87 mark. Scandies continue to be under pressure with EUR/SEK around 11.70 and EUR/NOK around 11.80. EUR/DKK still hovers just above the 7.46 central rate.
Credit: Due to a slight moderation of long-term rates, risk assets recorded a slight recovery late yesterday. Itraxx Main tightened 2.4bp to 87bp and Xover tightened 9bp to 463.5bp. The slightly improved sentiment comes in spite of a sluggish start to the Q3 earnings season in Europe, where some 15% of the EuroStoxx600 index have reported so far and only 43% having beat earnings expectations.
Technical Outlook and Review
DXY:
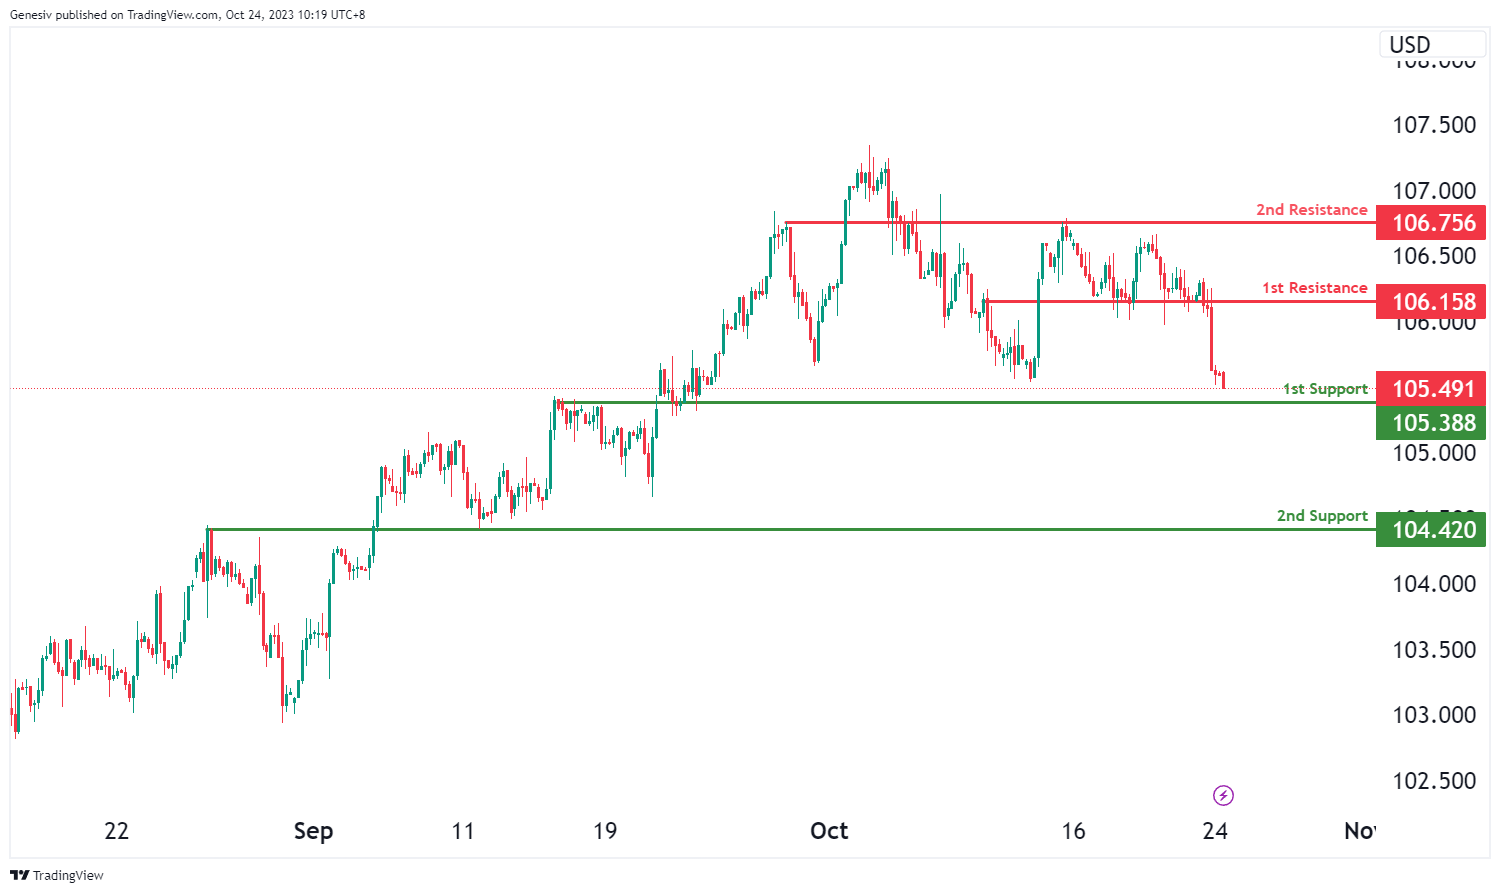
The DXY chart currently exhibits a bearish overall momentum, and there is a potential scenario for a bearish continuation towards the 1st support level.
The 1st support at 105.38 is considered significant as it aligns with an overlap support level. Additionally, the 2nd support at 104.42 is identified as an overlap support, providing a strong foundation of potential support.
On the resistance side, the 1st resistance at 106.15 is characterized as pullback resistance. Beyond this, the 2nd resistance at 106.75 is identified as an overlap resistance.
EUR/USD:
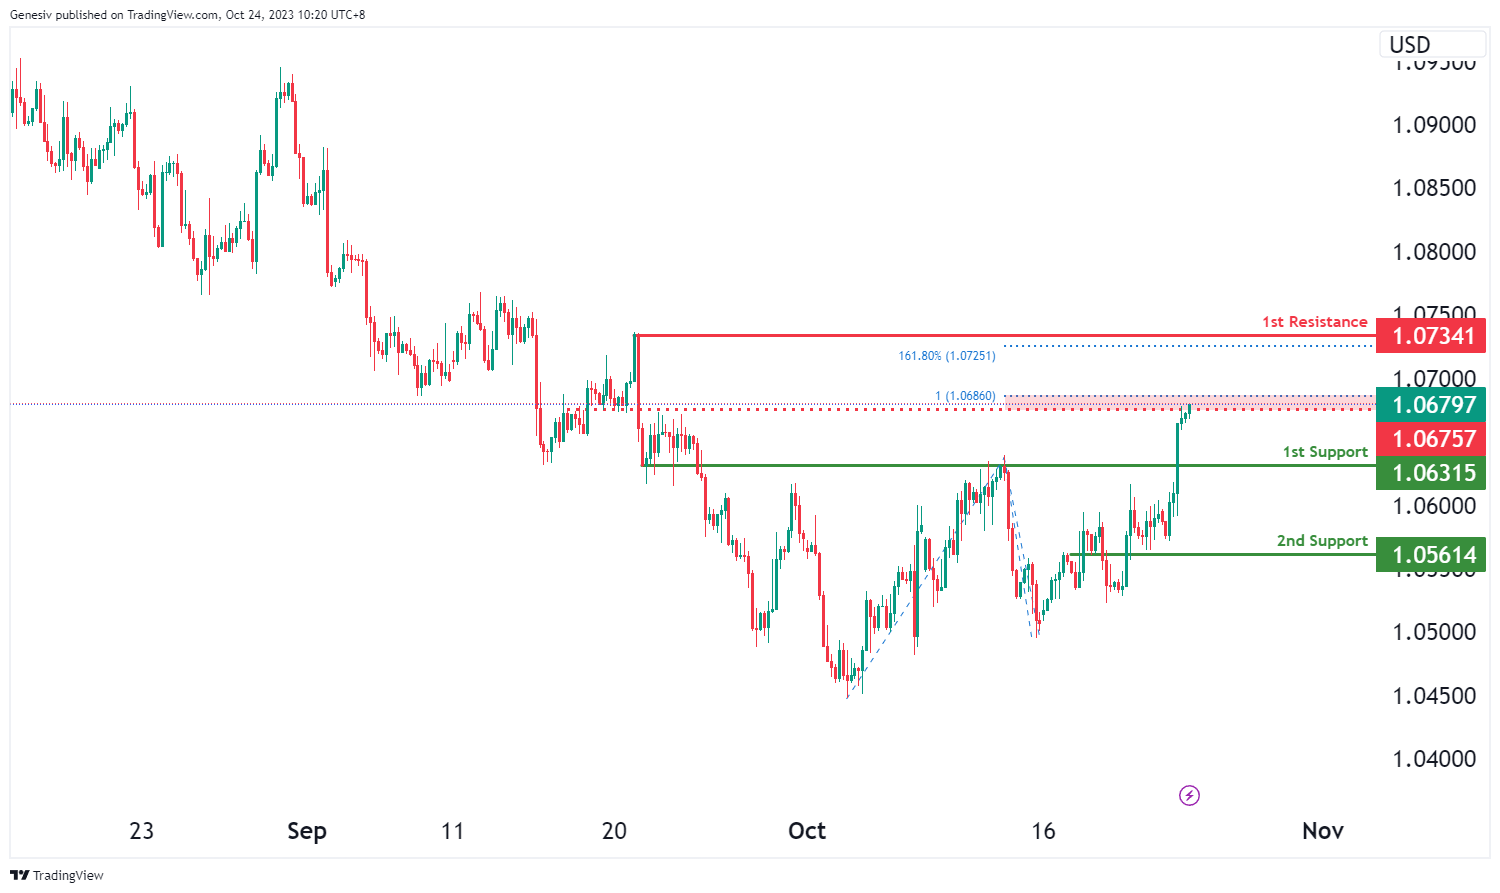
The EUR/USD chart currently has a bullish overall momentum, and there is a potential scenario for a bullish continuation towards the 1st resistance level.
The 1st support at 1.0631 is considered a strong level as it aligns with a pullback support. Additionally, the 2nd support at 1.0561 is identified as an overlap support, providing further potential support.
On the resistance side, the 1st resistance at 1.0734 is characterized as a swing high resistance, and beyond this, the intermediate resistance at 1.0675 is identified as an overlap resistance and coincides with the 100% Fibonacci Projection.
EUR/JPY:
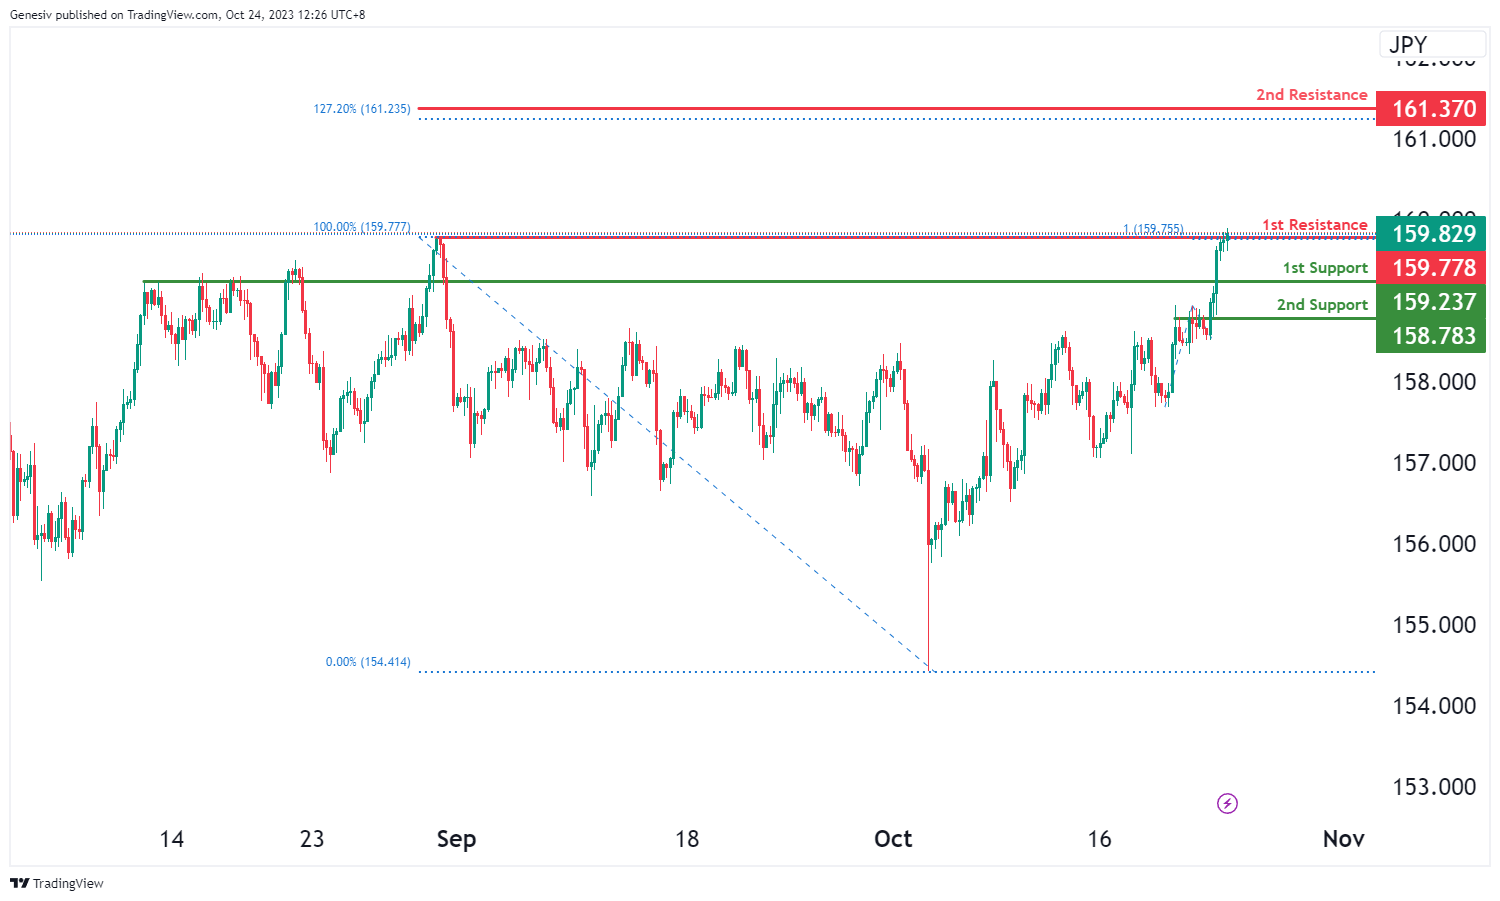
The instrument under analysis is EUR/JPY, and the overall momentum of the chart indicates a bullish trend.
There is a possibility that the price may experience a bullish breakout through the first resistance level and rise to the second resistance level.
The first support level is at 159.23, and it’s considered strong because it represents a pullback support.
The second support level is at 158.78, and it’s also significant as it marks an overlap of support.
On the resistance side, the first resistance level is at 159.77, and it’s noteworthy because it represents a swing high resistance and aligns with a 100% Fibonacci Projection.
The second resistance level is at 161.37, and it’s significant as well, as it marks a significant level indicated by a 127.20% Fibonacci Extension.
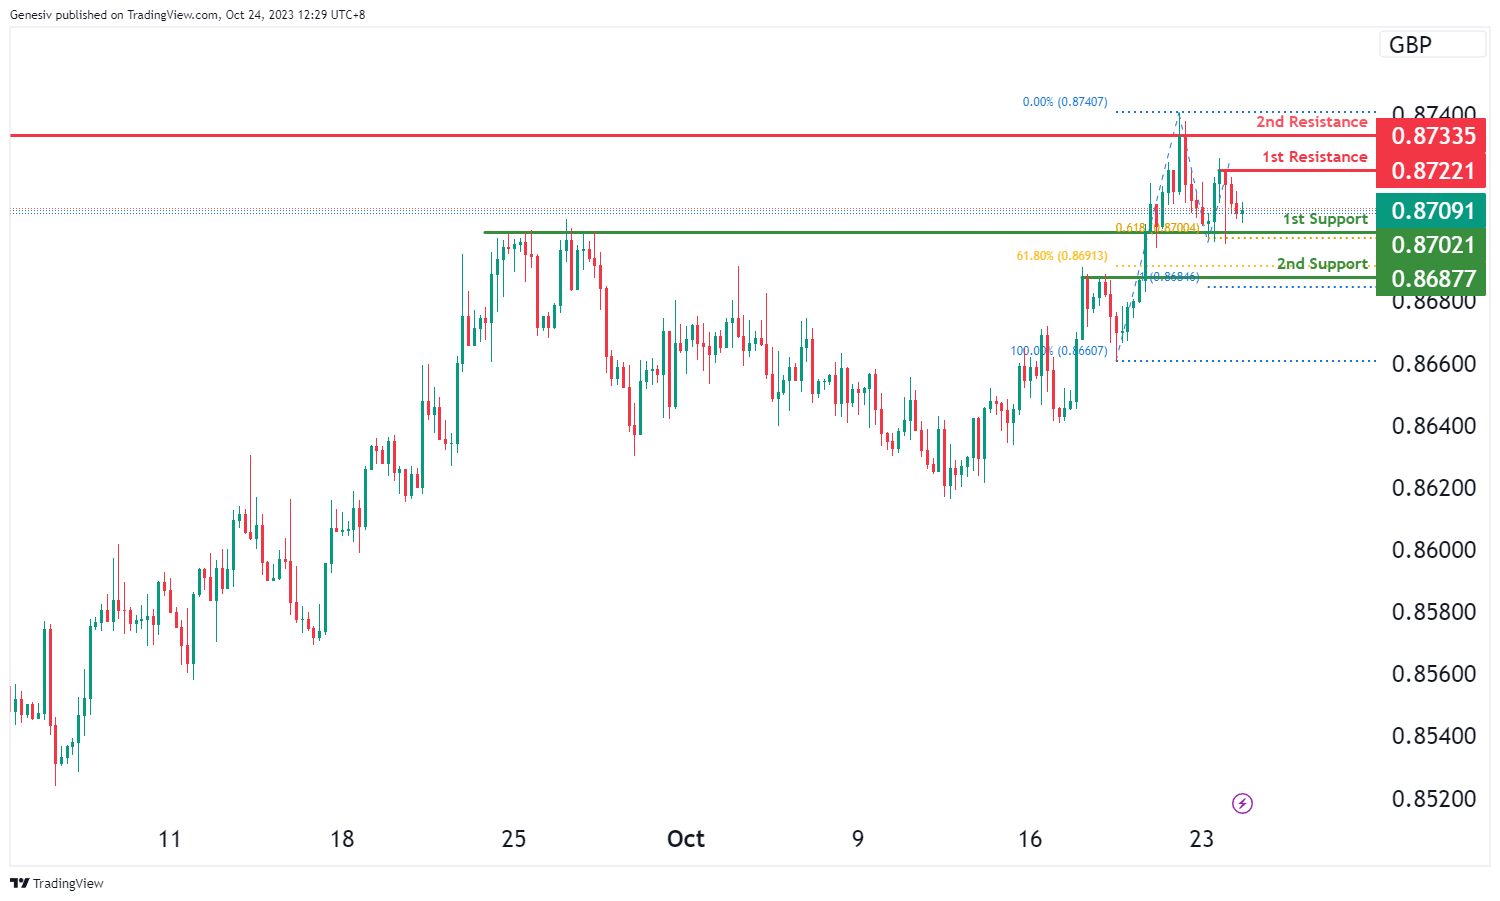
EUR/GBP:
The instrument we are examining is EUR/GBP, and the overall momentum of the chart indicates a bullish trend.
There is a possibility that the price may experience a bullish bounce off the first support level and head towards the first resistance level.
The first support level is at 0.8702, and it’s considered strong because it represents an overlap of support and is in confluence with a 61.80% Fibonacci Projection.
The second support level is at 0.8687, and it’s also significant as it represents a pullback support and aligns with both a 61.80% Fibonacci Retracement and a 100% Fibonacci Projection, indicating Fibonacci confluence.
On the resistance side, the first resistance level is at 0.8722, and it’s noteworthy because it represents a swing high resistance.
The second resistance level is at 0.8733, and it’s significant as well, as it marks an overlap of resistance.
GBP/USD:
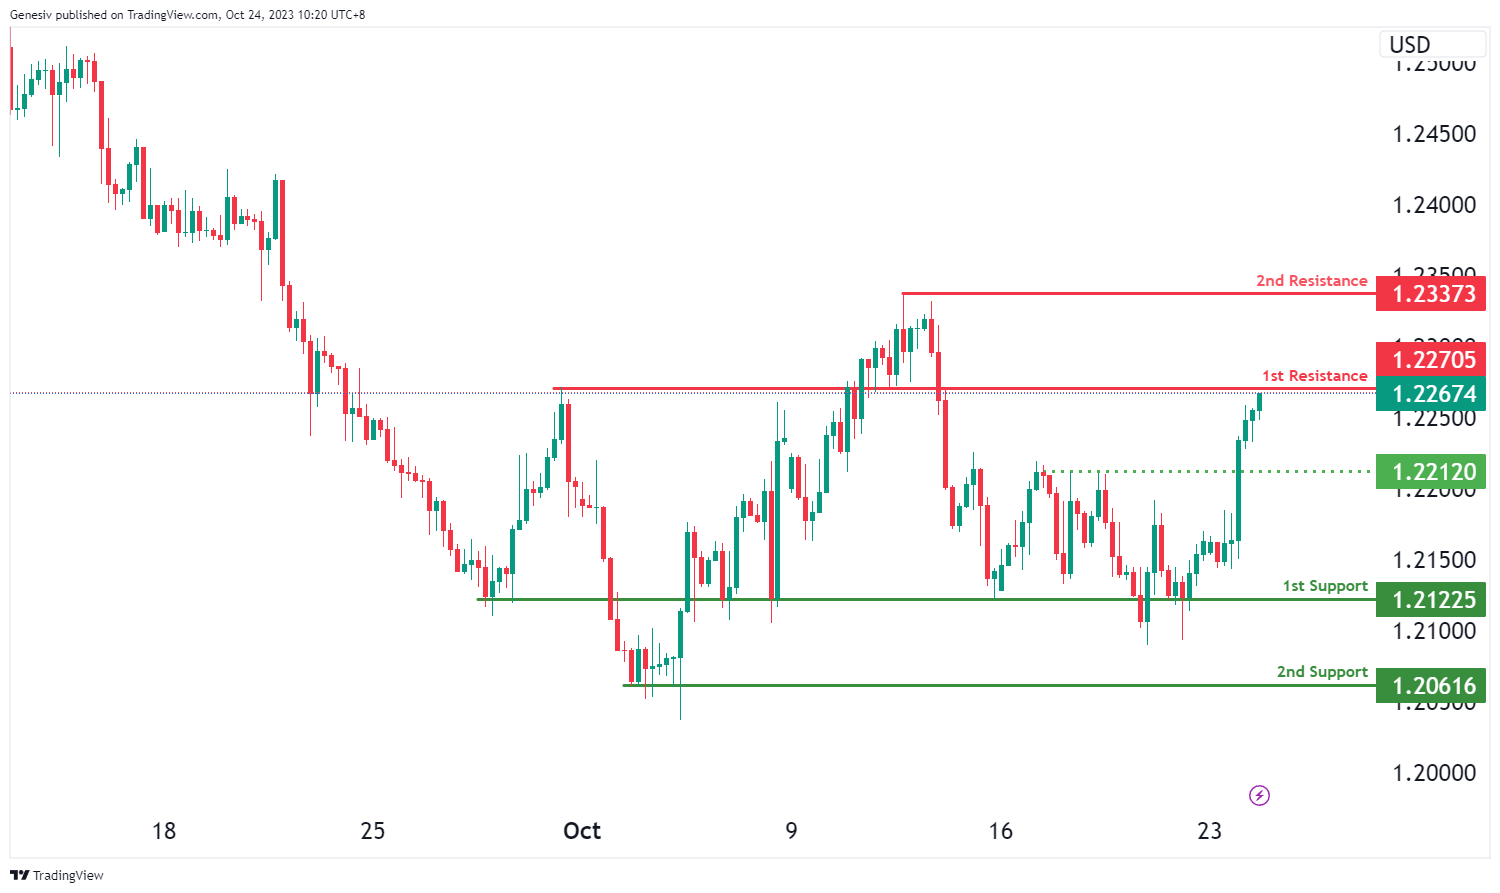
The GBP/USD chart currently exhibits bearish overall momentum, and there is a potential scenario for a bearish reaction off the 1st resistance level with a drop towards the 1st support.
The 1st support at 1.2122 is considered significant as it aligns with an overlap support, and the 2nd support at 1.2061 is identified as a multi-swing low support, providing additional potential support.
On the resistance side, the 1st resistance at 1.2270 is characterized as a pullback resistance, and beyond this, the 2nd resistance at 1.2337 is identified as a swing high resistance. There is also an intermediate support level at 1.2212, which can act as pullback support.
GBP/JPY:
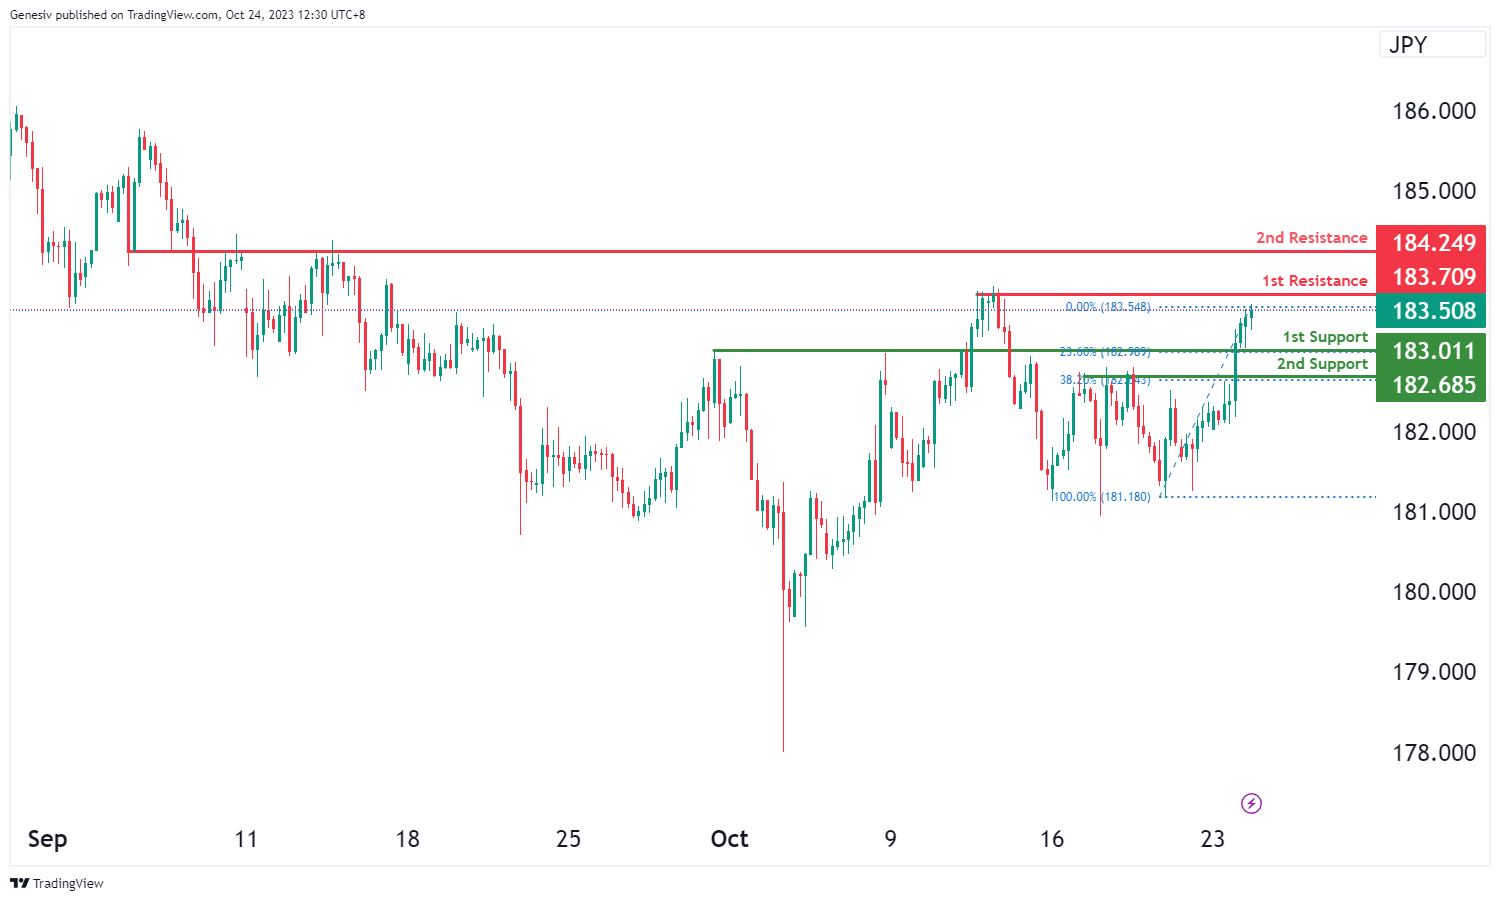
In the analysis of GBP/JPY, the overall momentum of the chart indicates a bullish trend.
It is anticipated that the price may continue to move in a bullish direction, potentially heading towards the first resistance level.
The first support level is at 183.01, and it’s considered significant due to being an overlap support and aligning with a 23.60% Fibonacci Retracement.
The second support level is at 182.68, and it is also of importance as it represents a pullback support and coincides with a 38.20% Fibonacci Retracement.
On the resistance side, the first resistance level is at 183.70, which is notable because it marks a swing high resistance.
The second resistance level is at 184.24, and it is significant as well as it represents an overlap resistance.
USD/CHF:
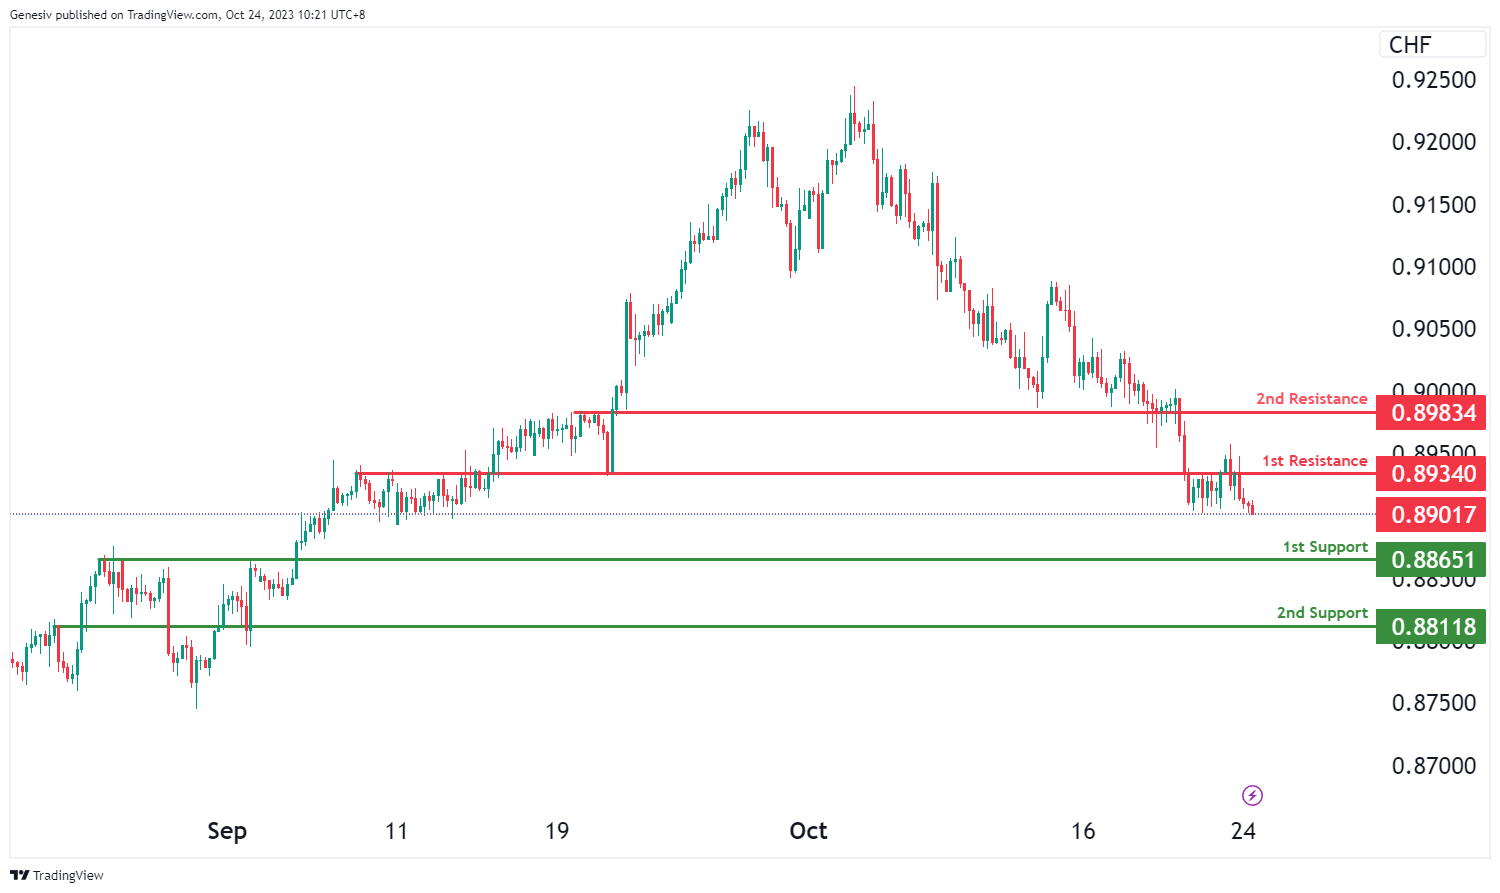
The USD/CHF chart currently exhibits bearish overall momentum, and there is a potential scenario for a bearish continuation towards the 1st support level.
The 1st support at 0.8865 is considered significant as it aligns with a pullback support level, and the 2nd support at 0.8811 is identified as another pullback support, further reinforcing the potential for a bearish move.
On the resistance side, the 1st resistance at 0.8934 is characterized as an overlap resistance, and beyond this, the 2nd resistance at 0.8983 is identified as a pullback resistance.
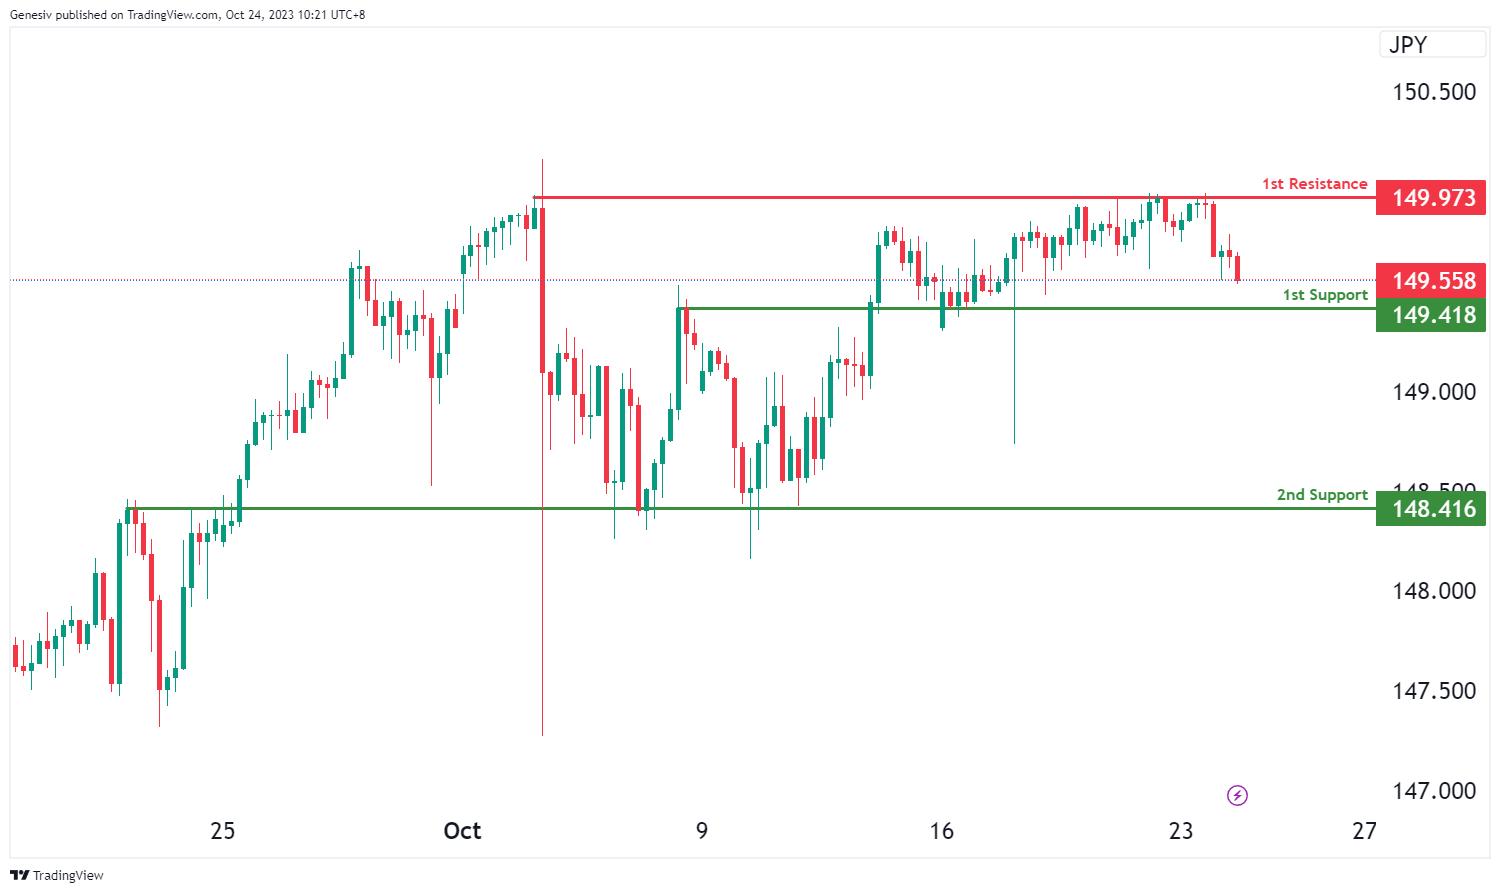
USD/JPY:
The USD/JPY chart currently exhibits bearish overall momentum, and there is a potential scenario for a bearish continuation towards the 1st support level.
The 1st support at 149.41 is considered significant as it aligns with an overlap support level, indicating a potential area of price support. Additionally, the 2nd support at 148.41 is also identified as an overlap support, further reinforcing the potential for a bearish move.
On the resistance side, the 1st resistance at 149.97 is characterized as a multi-swing high resistance level, suggesting potential price barriers for an upward movement.
USD/CAD:
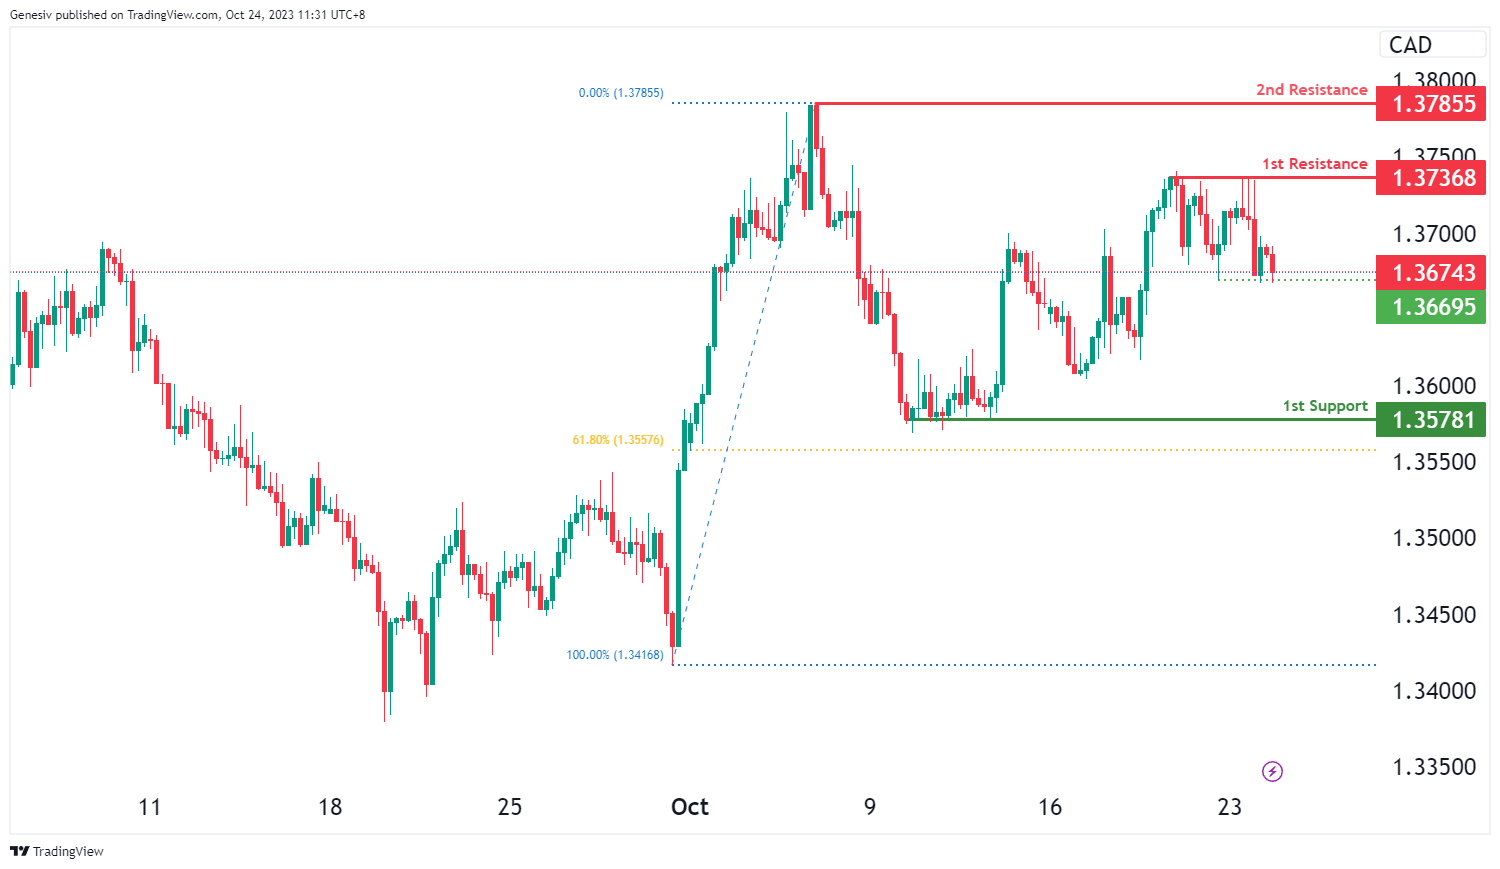
The USD/CAD chart currently exhibits an overall bearish momentum. Should price break below the intermediate support, there is a potential scenario for price to make a bearish continuation towards the 1st support level.
The intermediate support level at 1.3669 is identified as a pullback support. Further below, the 1st support level at 1.3578 is marked as a major pullback support that aligns close to the 61.80% Fibonacci retracement level, adding to its significance as a potential support zone.
To the upside, the 1st resistance level at 1.3737 is identified as a pullback resistance. Higher up, the 2nd resistance level at 1.3786 is marked as a swing-high resistance, potentially acting as a barrier to further bullish advances.
AUD/USD:
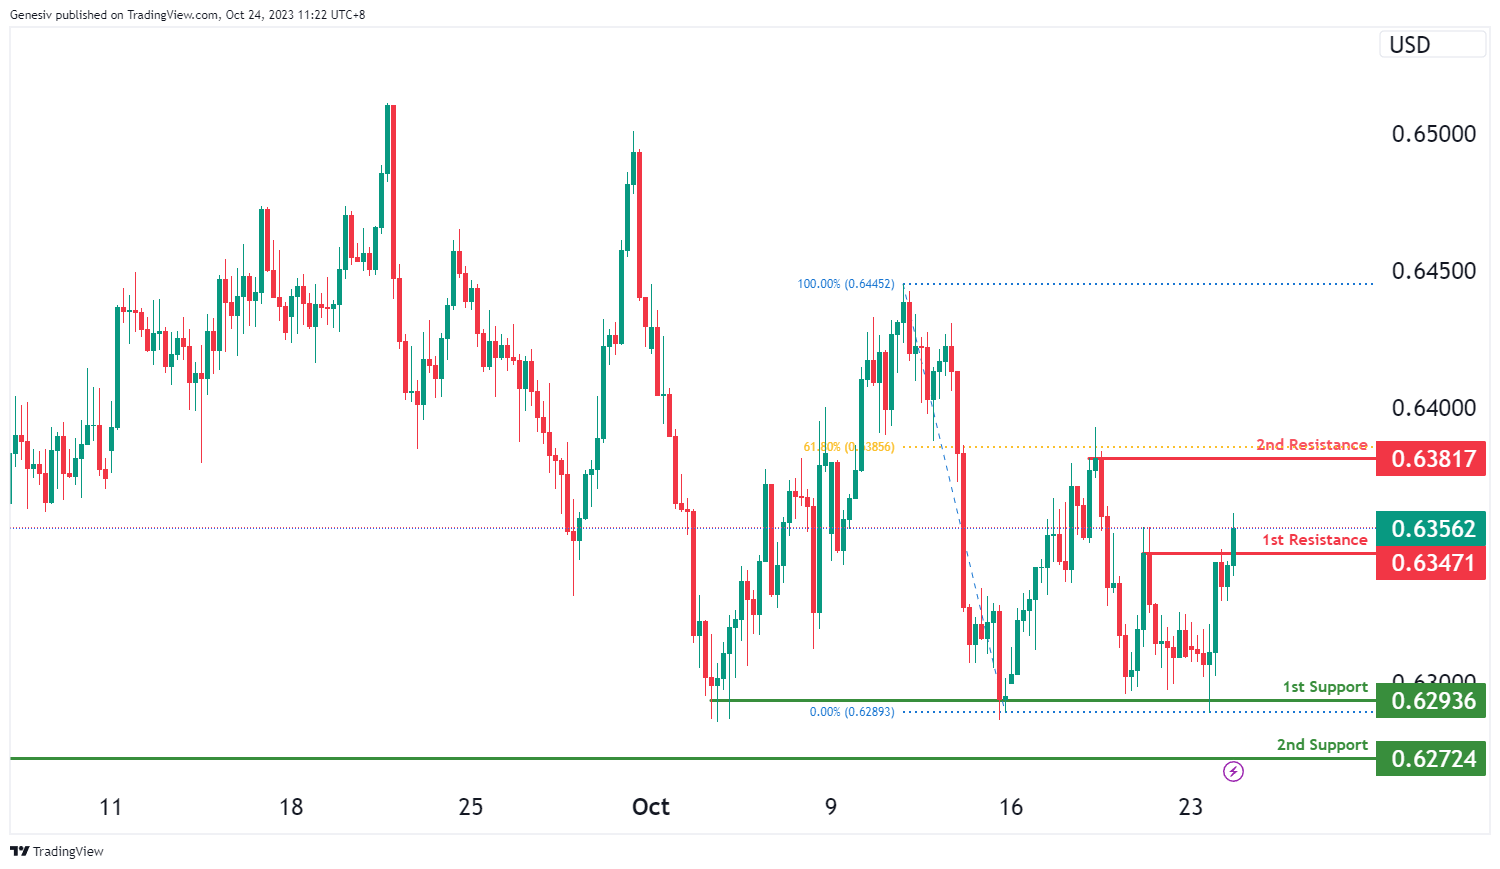
The AUD/USD chart currently exhibits an overall bullish momentum. Price could make a further bullish continuation towards the 2nd resistance level should it break above the 1st resistance level.
The 1st resistance level at 0.6347 is identified as a pullback resistance. Higher up, the 2nd resistance level at 0.6382 is marked as a swing-high resistance that aligns with the 61.80% Fibonacci retracement level, making it a potentially strong resistance level.
To the downside the 1st support level at 0.6294 is identified as a multi-swing-low support. Additionally, the 2nd support level at 0.6272 is also noted as a multi-swing-low support, further reinforcing its importance as a potential support area.
NZD/USD
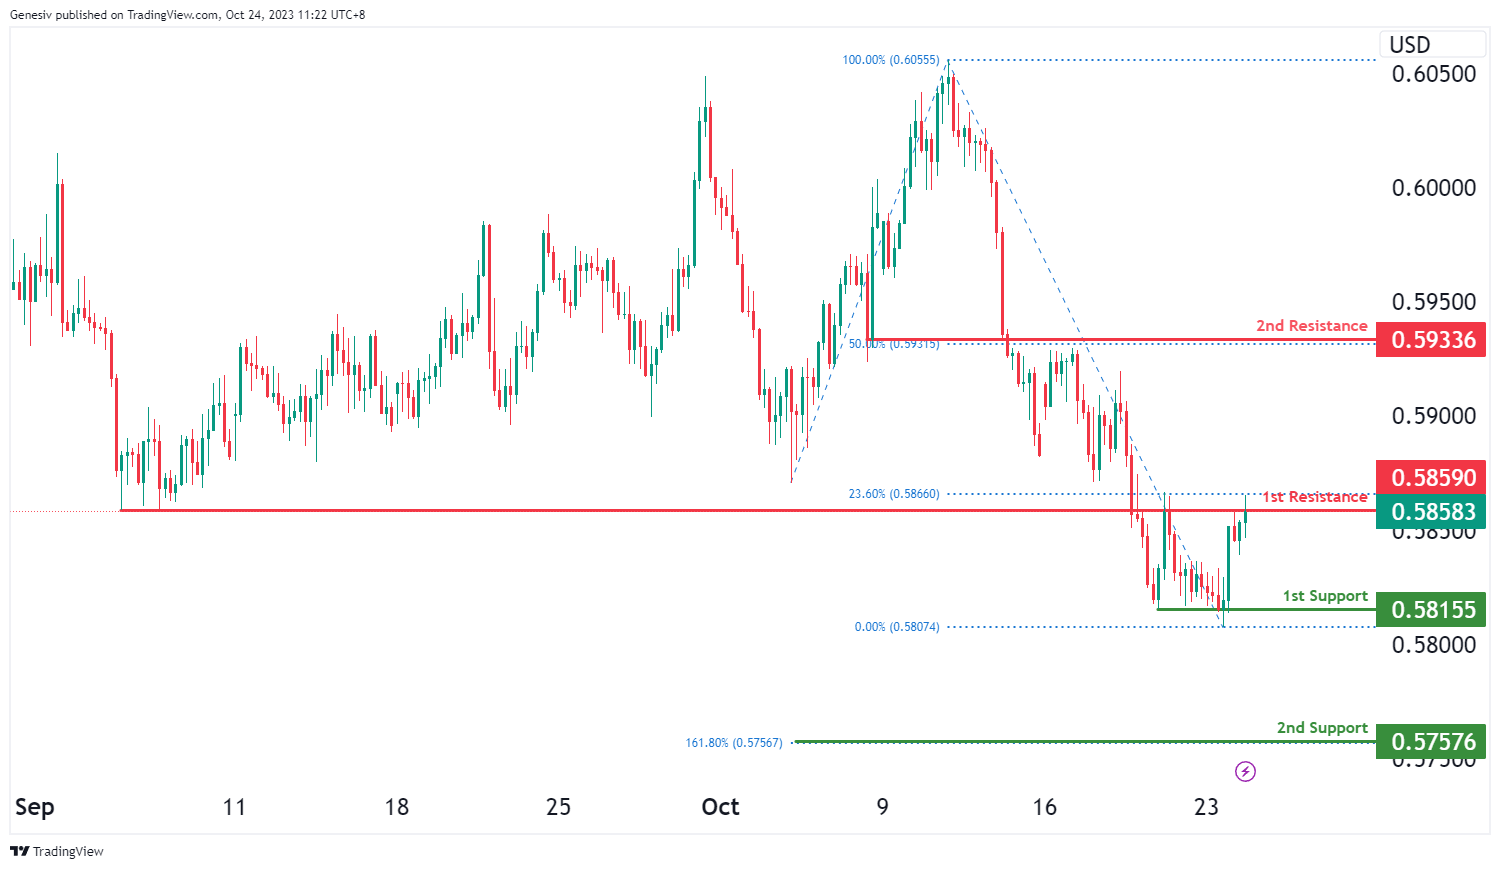
The NZD/USD chart currently exhibits an overall bullish momentum. Price could make a further bullish continuation towards the 2nd resistance level should it break above the 1st resistance level.
The 1st resistance level at 0.5859 is identified as an overlap resistance that aligns close to the 23.60% Fibonacci retracement level. Higher up, the 2nd resistance level at 0.5934 is also marked as an overlap resistance that aligns with the 50.00% Fibonacci retracement level, making it a potentially strong resistance level.
To the downside the 1st support level at 0.5816 is identifed as a pullback support. Additionally, the 2nd support level at 0.5758 is noted as a support level that aligns with the 161.80% Fibonacci extension level, further reinforcing its importance as a potential support area.
DJ30:
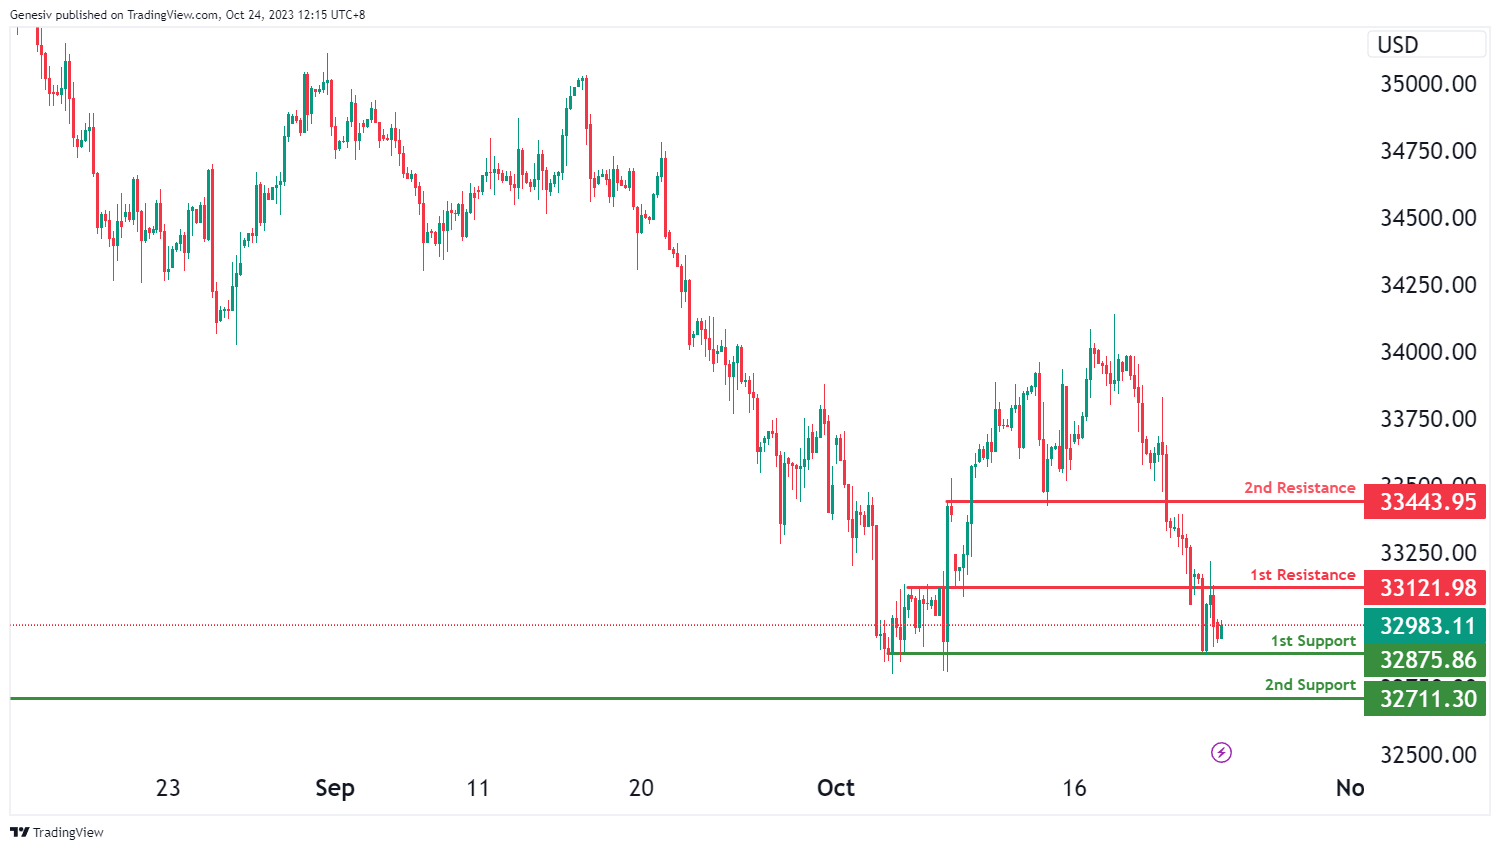
The instrument under analysis is DJ30, and the overall momentum of the chart indicates a bullish trend.
There is a possibility that the price may experience a bullish bounce when approaching the first support level and then head towards the first resistance level.
The first support level is at 32,875.86, and it’s considered strong because it represents a multi-swing low support.
The second support level is at 32,711.30, and it’s also significant as it marks another multi-swing low support.
On the resistance side, the first resistance level is at 33,121.98, and it’s noteworthy because it represents an overlap of resistance.
The second resistance level is at 33,443.95, and it’s significant as well, as it functions as a pullback resistance.
GER40:
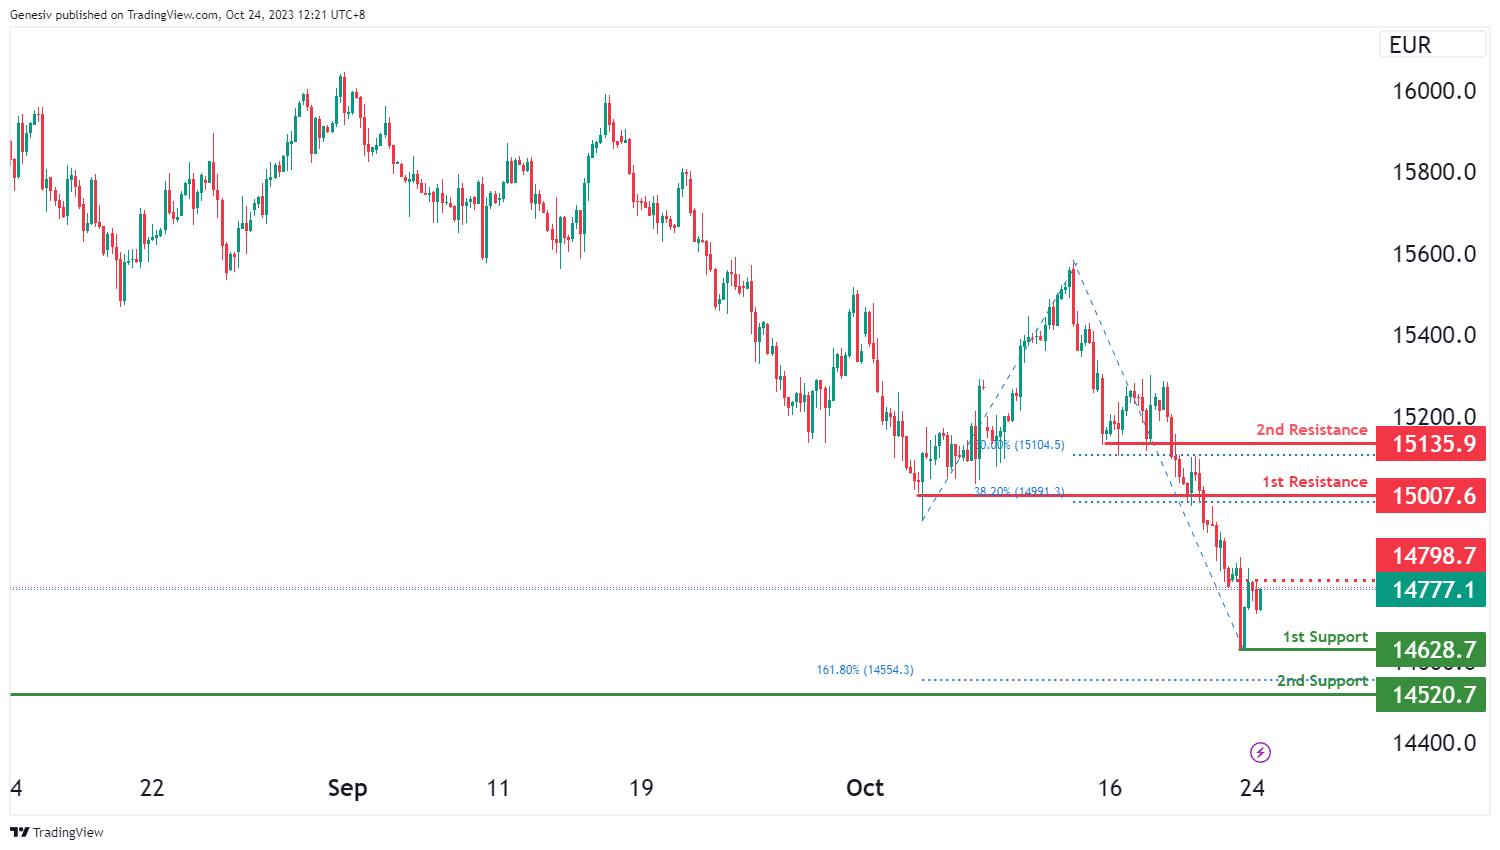
The instrument we are examining is GER40, and the overall momentum of the chart indicates a bullish trend.
There is a possibility that the price may continue its bullish momentum, potentially reaching the first resistance level.
The first support level is at 14,628.70, and it’s considered strong because it represents a swing low support.
The second support level is at 14,520.70, and it’s also significant as it marks a pullback support and aligns with a 161.80% Fibonacci Extension.
On the resistance side, the first resistance level is at 15,007.60, and it’s noteworthy because it represents a pullback resistance and aligns with a 38.20% Fibonacci Retracement.
The second resistance level is at 15,135.90, and it’s significant as well, as it functions as a pullback resistance and aligns with a 50% Fibonacci Retracement.
Additionally, there is an intermediate resistance level at 14,798.70, which is significant because it represents an overlap of resistance.
US500
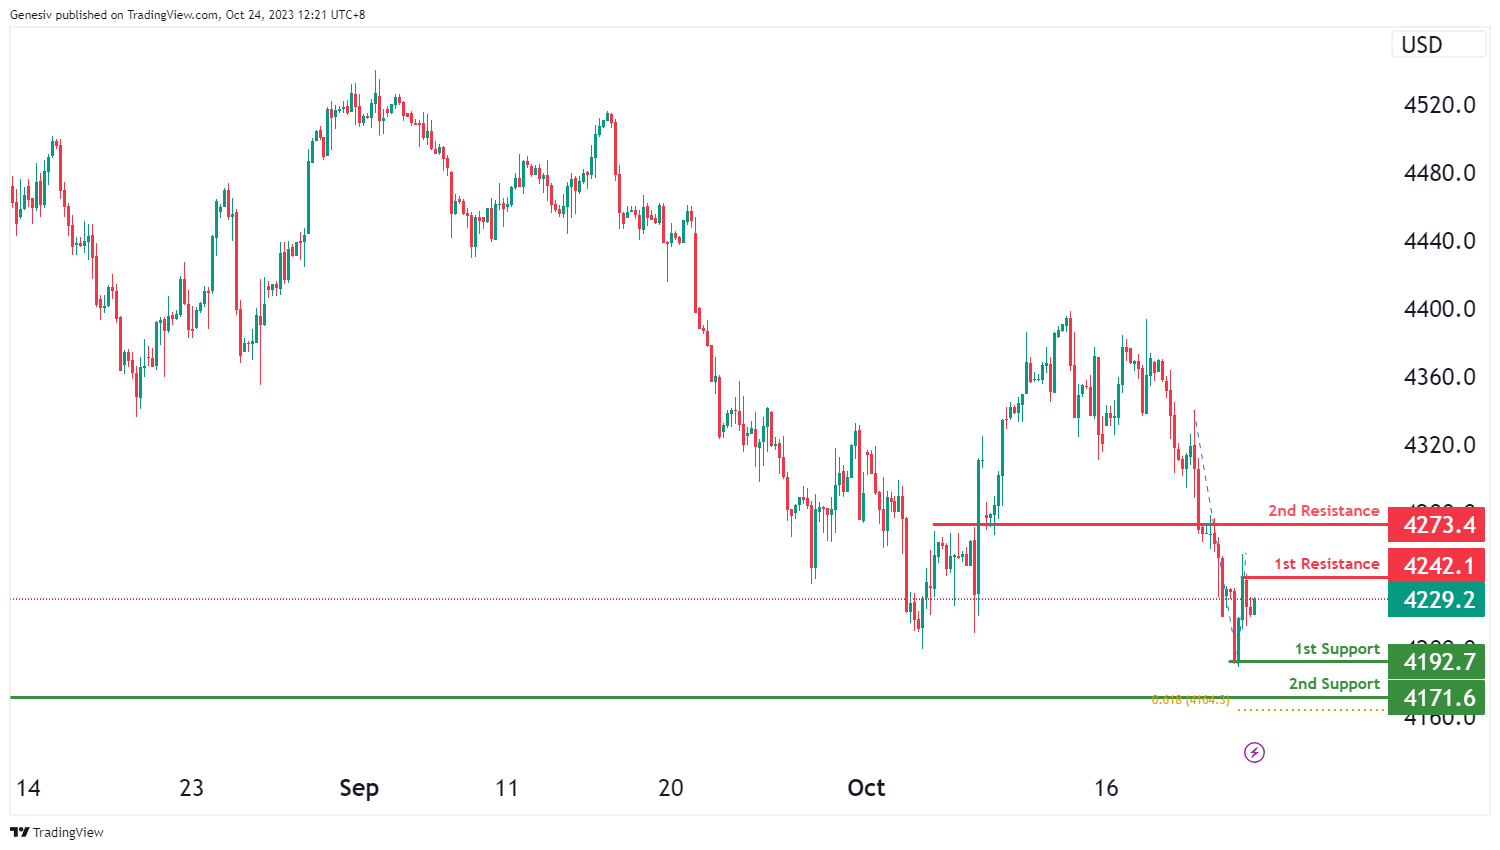
The instrument we are examining is US500, and the overall momentum of the chart indicates a bearish trend.
There is a possibility that the price may experience a short-term rise towards the first resistance level before reversing off it and dropping towards the first support level.
The first support level is at 4,192.7, and it’s considered strong because it represents a swing low support.
The second support level is at 4,171.6, and it’s also significant as it marks another swing low support and aligns with a 61.80% Fibonacci Projection.
On the resistance side, the first resistance level is at 4,242.1, and it’s noteworthy because it represents a swing high resistance.
The second resistance level is at 4,273.4, and it’s significant as well, as it functions as an overlap of resistance.
BTC/USD:
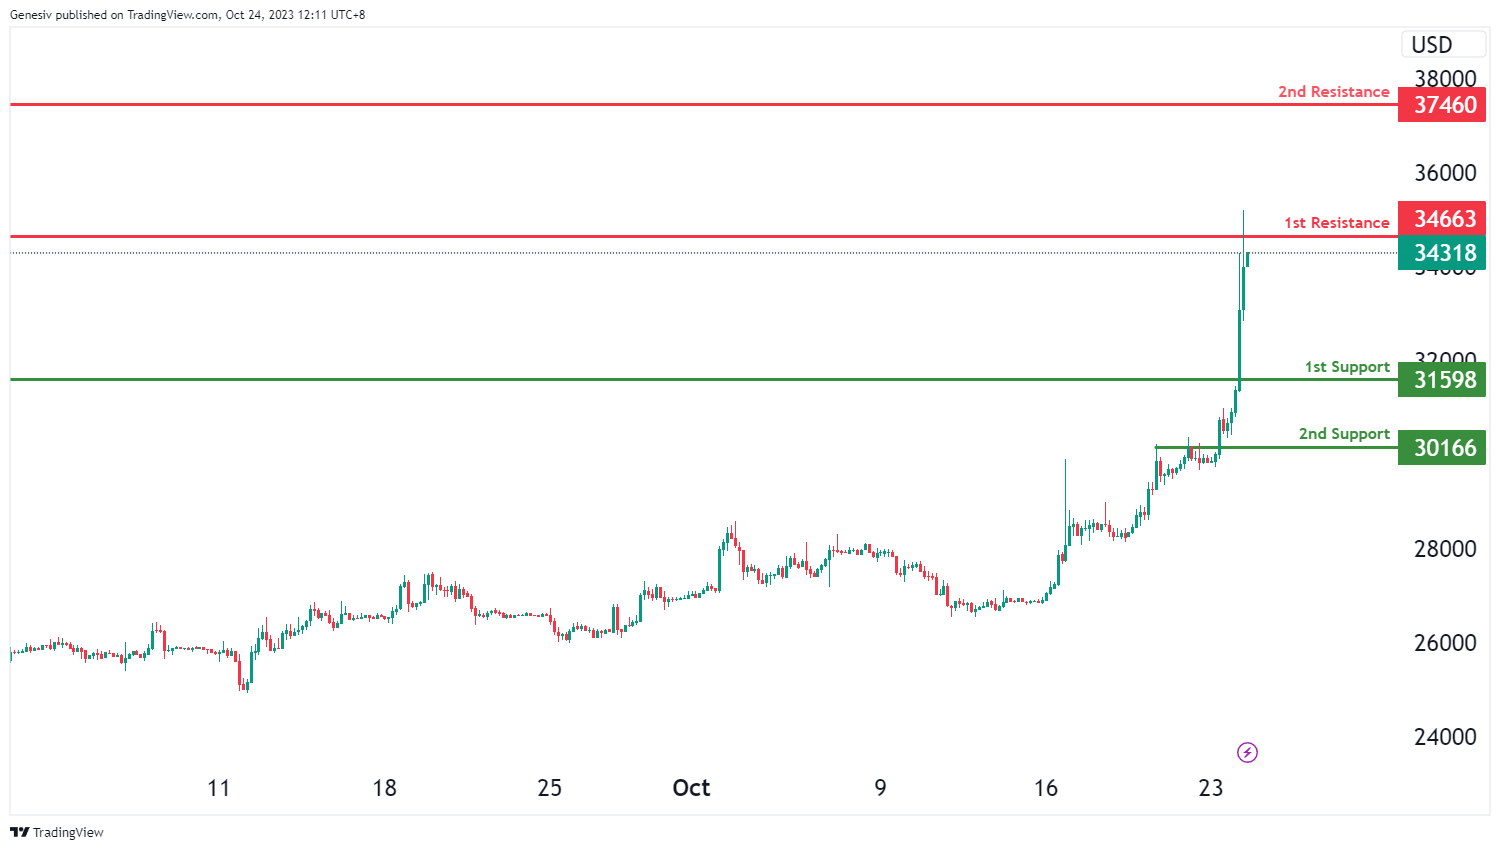
The instrument we are examining is BTC/USD, and the overall momentum of the chart indicates a bullish trend.
There is a possibility that the price may continue its bullish momentum, potentially reaching the first resistance level.
The first support level is at 31,598, and it’s considered strong because it represents a pullback support.
The second support level is at 30,166, and it’s also significant as it marks another pullback support.
On the resistance side, the first resistance level is at 34,663, and it’s noteworthy because it represents a pullback resistance.
The second resistance level is at 37,460, and it’s significant as well, as it functions as a pullback resistance.
ETH/USD:
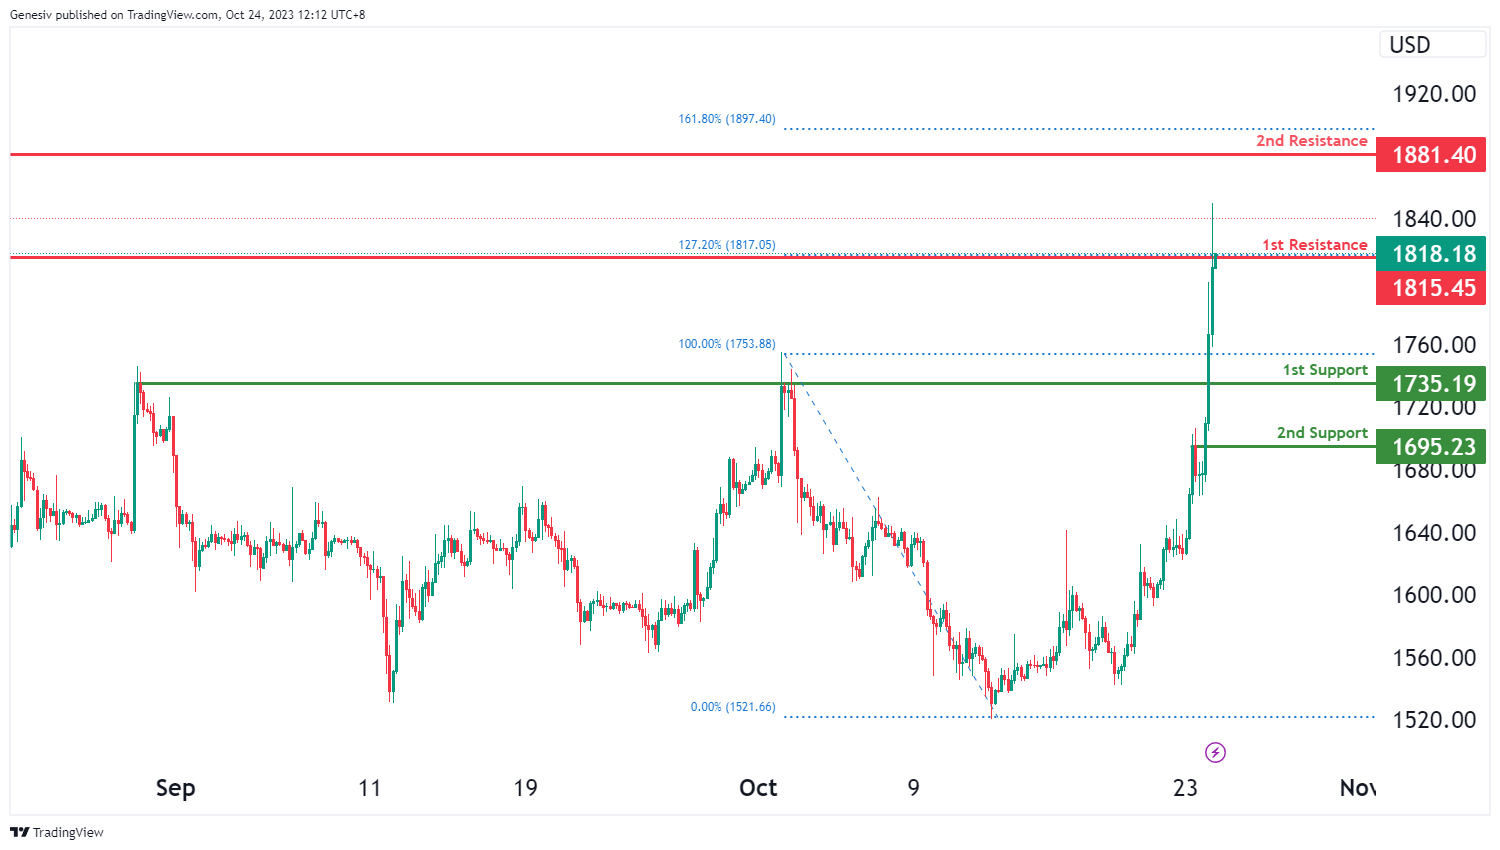
The instrument under analysis is ETH/USD, and the overall momentum of the chart indicates a bearish trend.
There is a possibility that the price may experience a bearish reaction when approaching the first resistance level and then drop to the first support level.
The first support level is at 1,735.19, and it’s considered strong because it represents a pullback support.
The second support level is at 1,695.23, and it’s also significant as it marks another pullback support.
On the resistance side, the first resistance level is at 1,815.45, and it’s noteworthy because it represents a pullback resistance and aligns with a 127.20% Fibonacci Extension.
The second resistance level is at 1,881.40, and it’s significant as well, as it functions as a multi-swing high resistance and aligns with a 161.80% Fibonacci Extension.
WTI/USD:
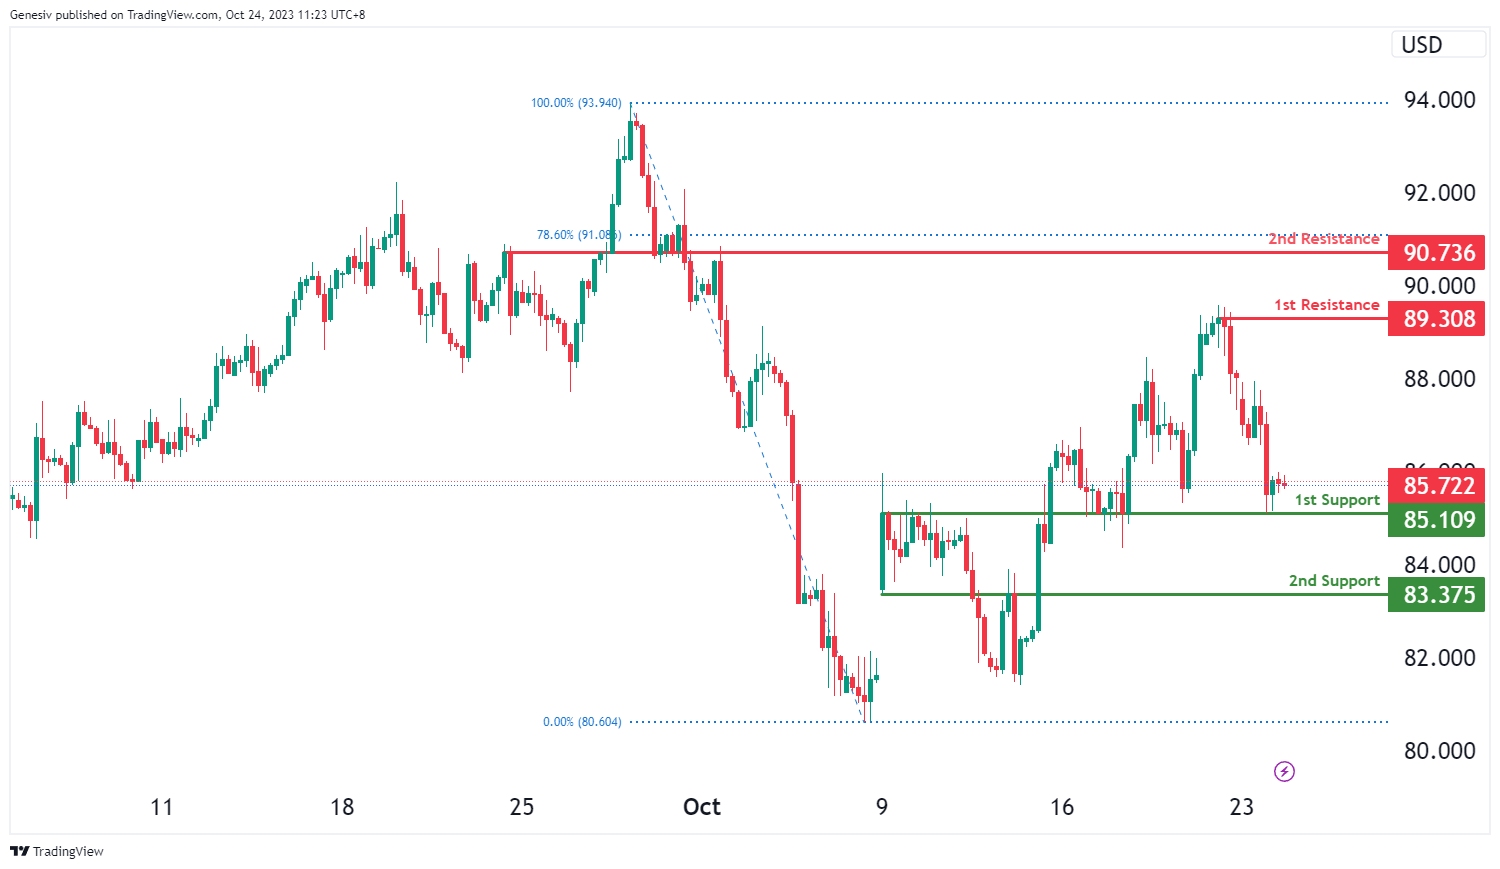
The WTI chart currently exhibits a weak bullish momentum, indicating a potential scenario for price to make a bullish reaction off the 1st support level.
The 1st support level at 85.11 is identified as an overlap support. Further below, the 2nd support level at 83.38 is also marked as an overlap support, indicating a potential support zone.
To the upside, the 1st resistance level at 89.31 is identified as a swing-high resistance. Beyond this, the 2nd resistance level at 90.74 is noted as an overlap resistance that aligns close to the 78.60% Fibonacci retracement level, making it a potentially strong resistance level.
XAU/USD (GOLD):
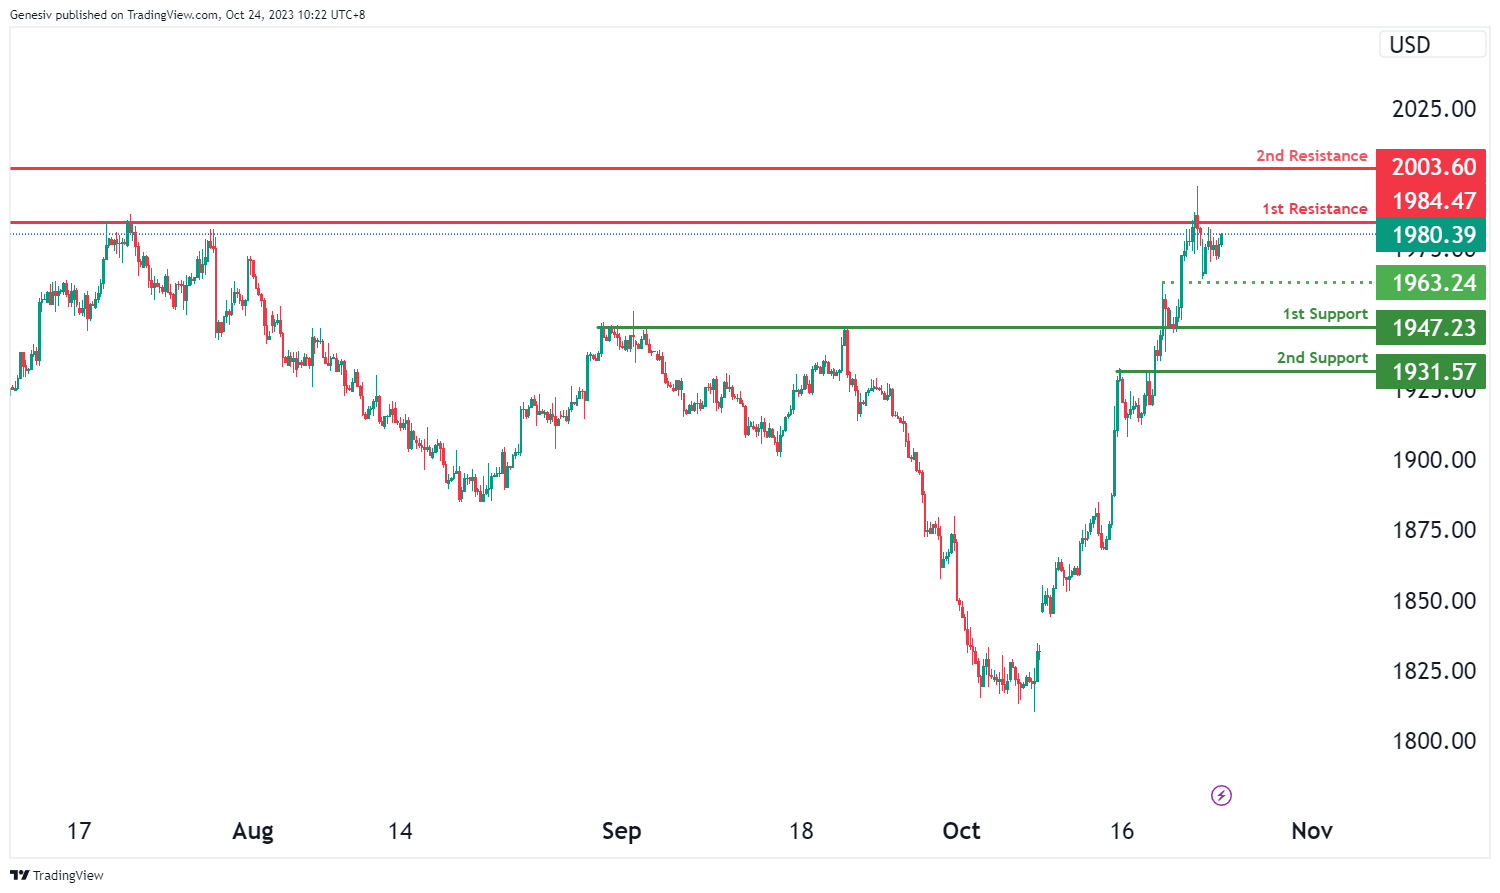
The XAU/USD chart is currently influenced by a bearish overall momentum, indicating the potential for a bearish continuation towards the 1st support level.
The 1st support at 1947.23 holds significance as it coincides with an overlap support, underscoring its potential as a crucial price support zone. Additionally, the presence of a 2nd support level at 1931.57, identified as a pullback support, further strengthens the case for potential bearish movement.
On the resistance side, the 1st resistance at 1984.47 is characterized as a multi-swing high resistance. This designation implies that it has previously acted as a robust barrier to upward price movements, making it a key area to monitor for potential reversals or slowdowns in the bearish trend. Additionally, the 2nd resistance at 2003.60, identified as a swing high resistance, could provide added resistance if the price attempts to move higher.
An intermediate support level is also observed at 1963.24, labeled as a pullback support. This level may serve as a temporary resting point for the price during its bearish trajectory.
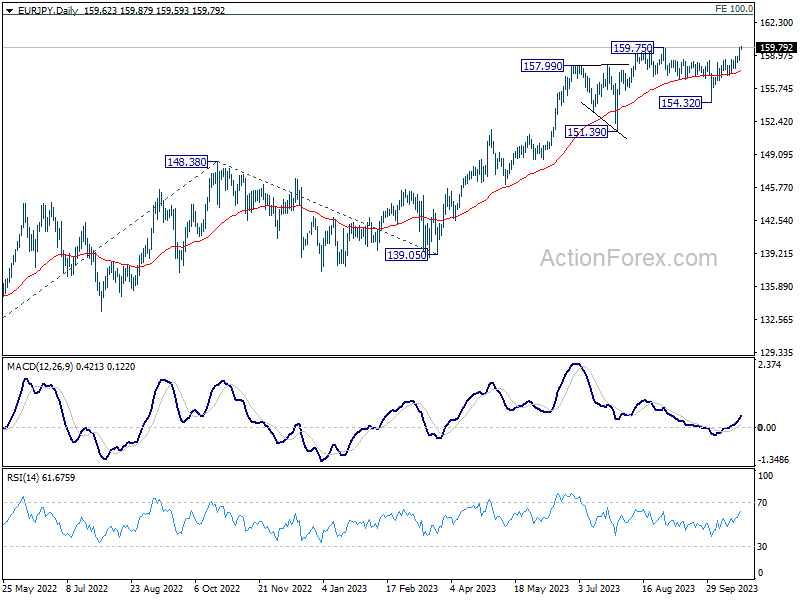
EUR/JPY Daily Outlook
Daily Pivots: (S1) 158.89; (P) 159.34; (R1) 160.16; More....
EUR/JPY's break of 159.75 indicates larger up trend resumption. Intraday bias stays on the upside at this point. next target is 163.06 projection level. On the downside, below 158.49 minor support will turn intraday bias neutral and bring consolidations first, before staging another rally.
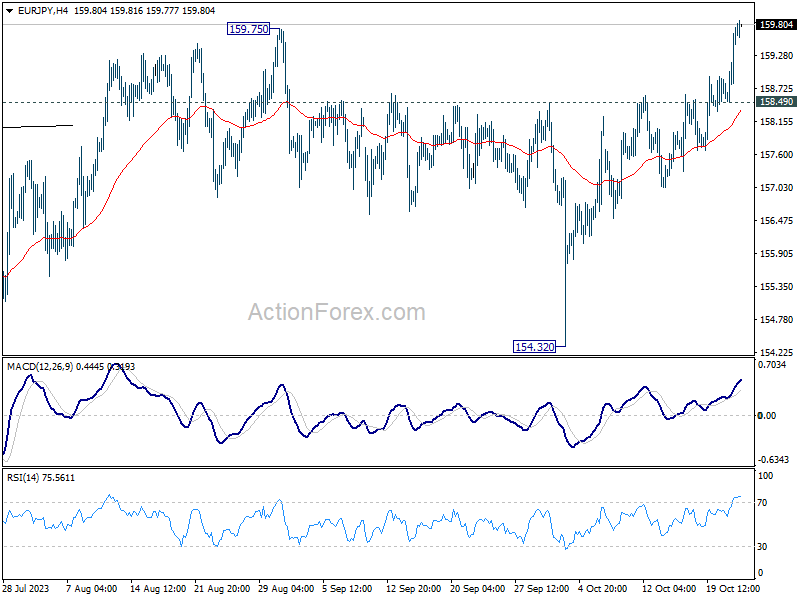
In the bigger picture, rise from 114.42 (2020 low) is in progress. next target is 100% projection of 124.37 to 148.38 from 139.05 at 163.06. On the downside, break of 154.32 support is needed to be the first sign of medium term topping. Otherwise, outlook will remain bullish even in case of deep pullback.
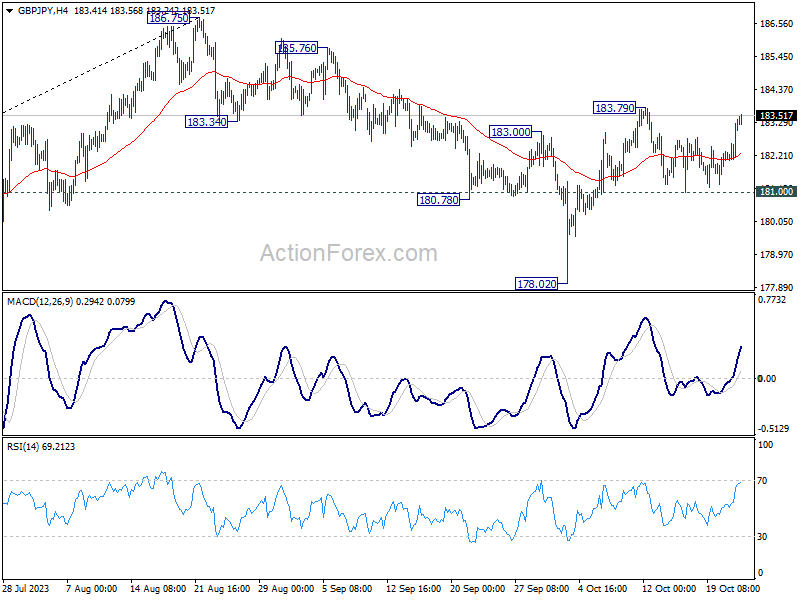
GBP/JPY Daily Outlook
Daily Pivots: (S1) 182.46; (P) 182.94; (R1) 183.83; More...
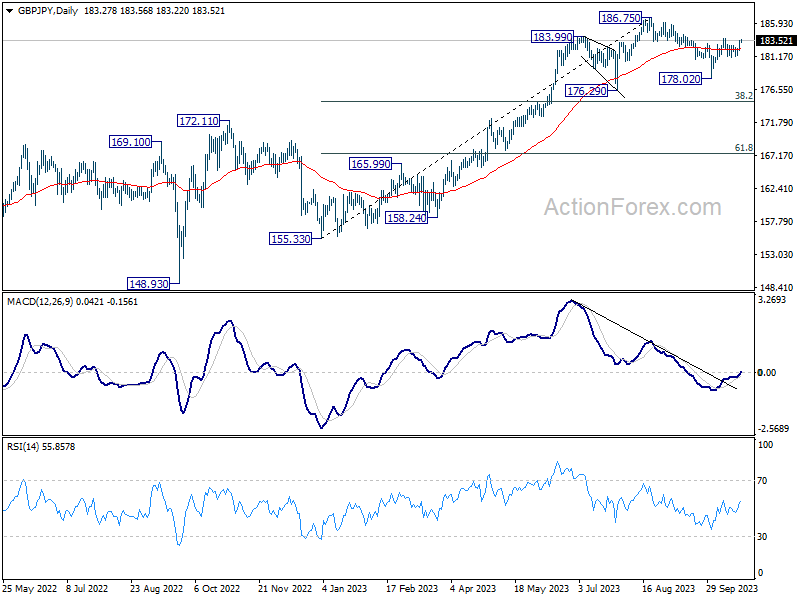
Intraday bias in GBP/JPY remains neutral and further rise is expected with 181.00 support intact. The favored case is still that correction from 186.75 has completed at 178.02. Above 183.79 will resume the rise from 178.02 to retest 186.75 high. However, break of 181.00 will dampen this view, and turn bias back to the downside for 178.02 instead.
In the bigger picture, fall from 186.75 is seen as a corrective move only. As long as 176.29 support holds, larger up trend from 123.94 (202 low) should still be in progress. Break of 186.75 will target 195.86 (2015 high). Nevertheless, firm break of 176.29 will confirm medium term topping, and bring lengthier and deeper consolidations.
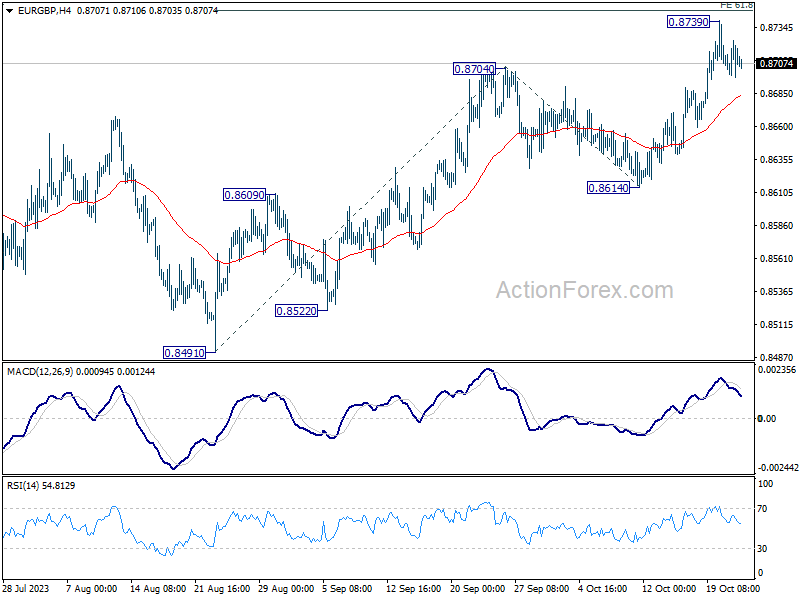
EUR/GBP Daily Outlook
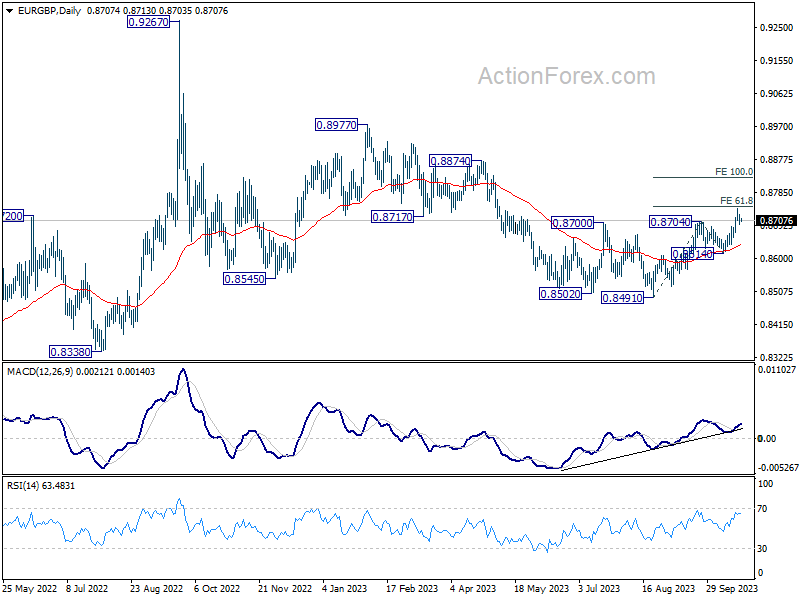
Daily Pivots: (S1) 0.8697; (P) 0.8712; (R1) 0.8725; More....
EUR/GBP is staying in consolidation from 0.8739 and intraday bias remains neutral. Downside of retreat should be contained well above 0.8614 support to bring another rally. Firm break of 0.8746 will target 100% projection of 0.8491 to 0.8704 from 0.8614 at 0.8827 next.
In the bigger picture, current development suggests that whole down trend from 0.9267 (2022 high) has completed with three down to to 0.8491. Rise from 0.8491 is seen as another leg inside that pattern from 0.9499 (2020 high). Further rally should be seen to 0.8977 resistance and above. This will now remain the favored case as long as 0.8614 support holds.
EUR/AUD Daily Outlook
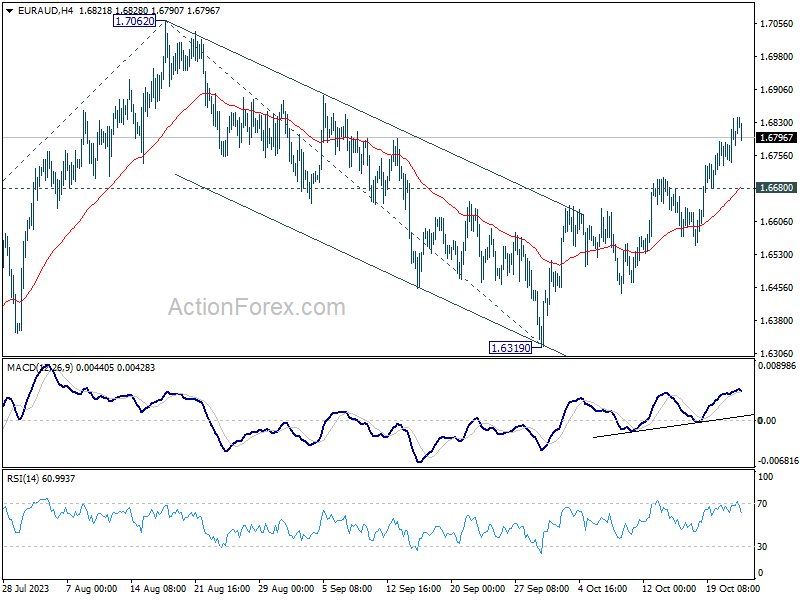
Daily Pivots: (S1) 1.6774; (P) 1.6810; (R1) 1.6877; More...
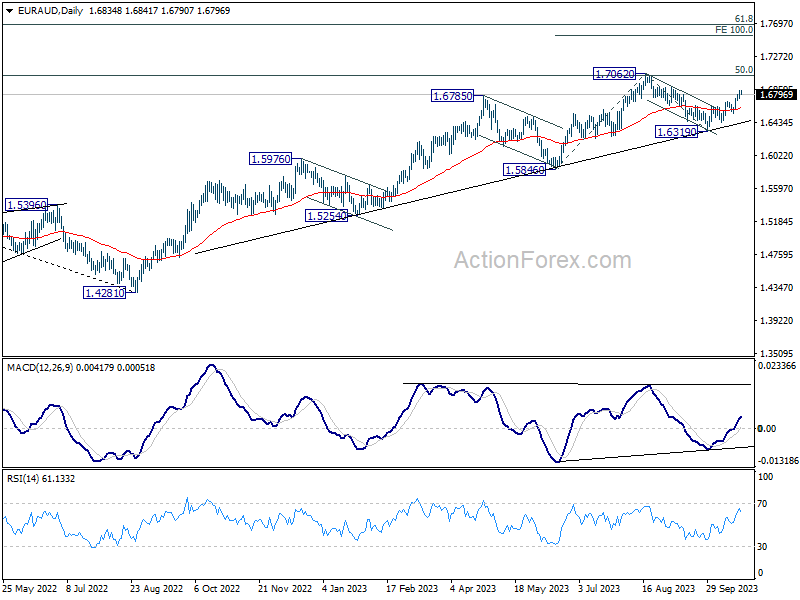
No change in EUR/AUD's outlook as rise from 1.6319 is in progress. Intraday bias stays on the upside for 1.7062 resistance. Decisive break there will confirm larger up trend resumption. Next target is 100% projection of 1.5846 to 1.7062 from 1.6319 at 1.7353. On the downside, break of 1.6680 will turn intraday bias neutral first.
In the bigger picture, the strong support from medium term rising trend line indicates that rise from 1.4281 (2022 low) is still in progress. Sustained break of 1.7062 will pave the way to 61.8% retracement of 1.9799 (2020 high) to 1.4281 at 1.7691. In any case, outlook will stay bullish as long as 1.6319 support holds.
EUR/CHF Daily Outlook
Daily Pivots: (S1) 0.9468; (P) 0.9491; (R1) 0.9530; More...
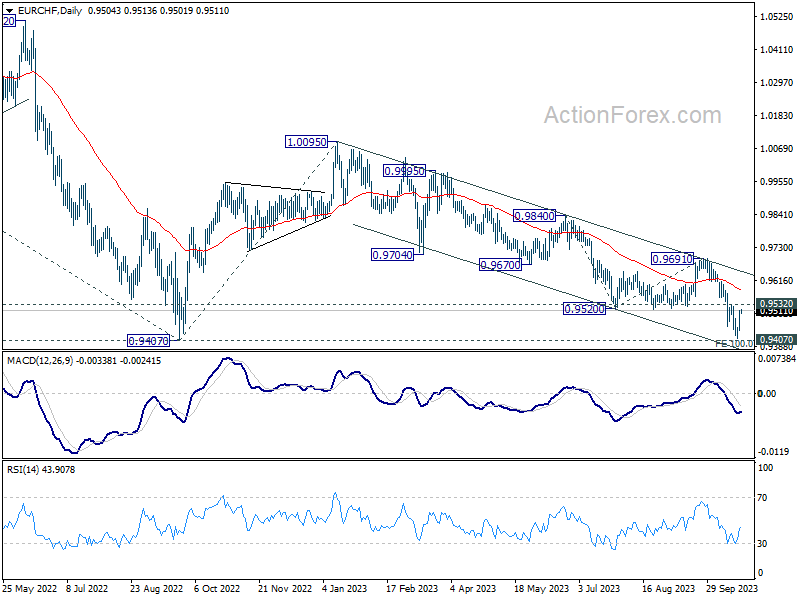
EUR/CHF is staying below 0.9532 resistance despite current recovery. Intraday bias remains neutral and outlook stays bearish. On the downside, decisive break of 0.9407 medium term bottom will confirm resumption of larger down trend. Next near term target will be 100% projection of 0.9840 to 0.9520 from 0.9691 at 0.9499, and then 161.8% projection at 0.9179. However, firm break of 0.9532 will confirm short term bottoming, and turn bias to the upside for 0.9691 resistance instead.
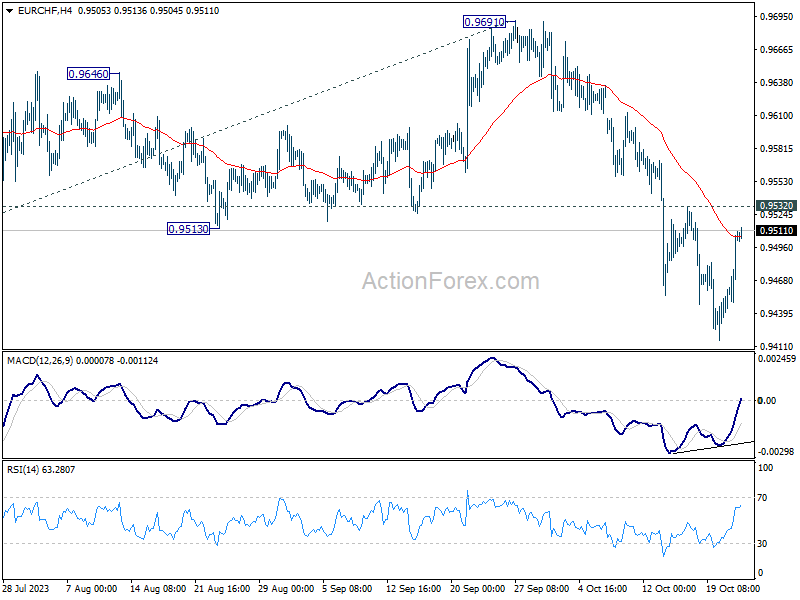
In the bigger picture, down trend from 1.2004 (2018 high) is still in progress. Decisive break of 0.9407 will confirm resumption, and target 61.8% projection of 1.1149 to 0.9407 from 1.0095 at 0.9018. On the upside, break of 0.9691 resistance is needed to be the first sign of medium term bottoming. Otherwise, outlook will stay bearish.
USD/CAD Daily Outlook
Daily Pivots: (S1) 1.3660; (P) 1.3698; (R1) 1.3729; More....
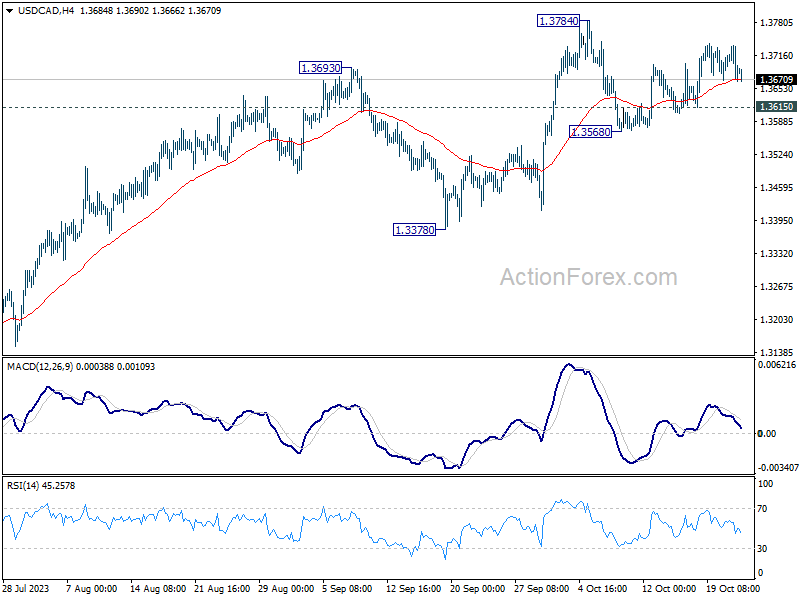
Intraday bias in USD/CAD remains neutral for the moment. Consolidation from 1.3784 could extend further. On the upside, decisive break of 1.3784 resistance will resume the rise from 1.3091 to retest 1.3976 high. On the downside, however, break of 1.3615 support will bring another falling leg to extend the near term corrective pattern from 1.3784.
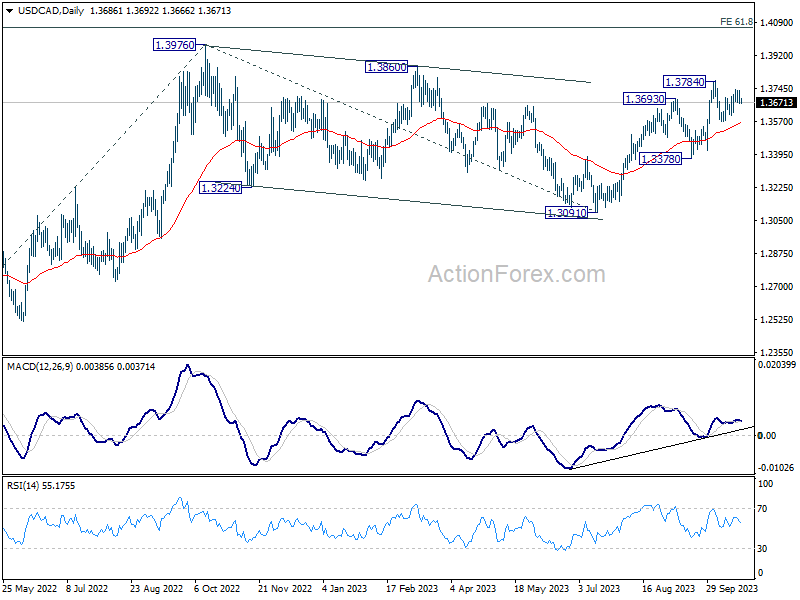
In the bigger picture, current development revives the case that corrective pattern from 1.3976 (2022 high) has completed with three waves down to 1.3091. Decisive break of 1.3976 high will confirm resumption of up trend from 1.2005 (2021 low). Next target will be 61.8% projection of 1.2401 to 1.3976 from 1.3091 at 1.4064. This will now remain the favored case as long as 1.3378 support holds.
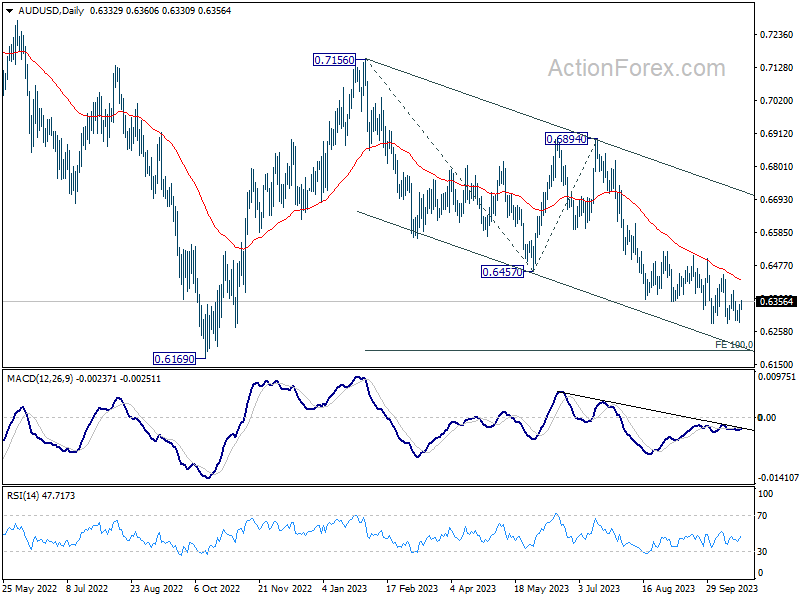
AUD/USD Daily Report
Daily Pivots: (S1) 0.6300; (P) 0.6324; (R1) 0.6360; More...
Range trading continues in AUD/USD and intraday bias remains neutral. Downside breakout is expected with 0.6444 resistance intact. On the downside, firm break of 0.6284 will resume whole fall from 0.7156. Next target is 100% projection of 0.7156 to 0.6457 from 0.6894 at 0.6195, which is close to 0.6169 medium term support.
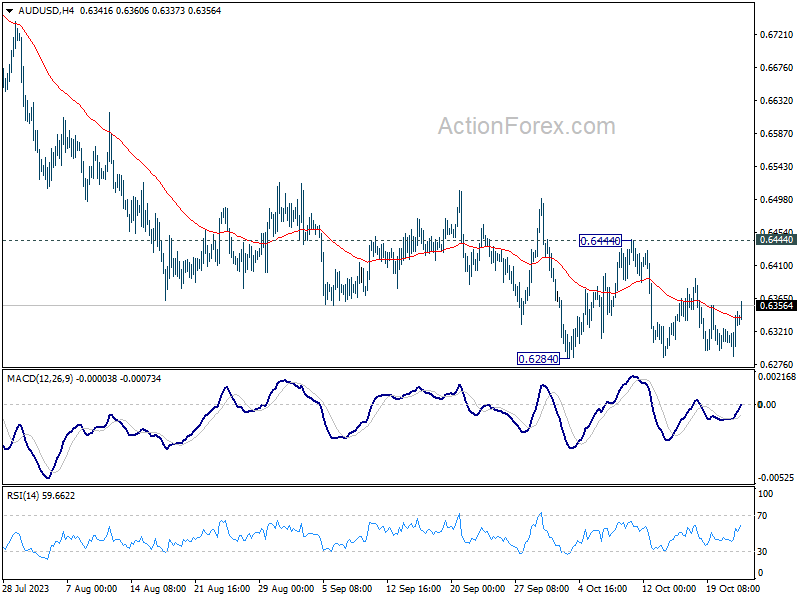
In the bigger picture, down trend from 0.8006 (2021 high) is possibly still in progress. Decisive break of 0.6169 will target 61.8% projection of 0.8006 to 0.6169 to 0.7156 at 0.6021. This will now remain the favored case as long as 0.6894, in case of strong rebound.
USD/JPY Daily Outlook
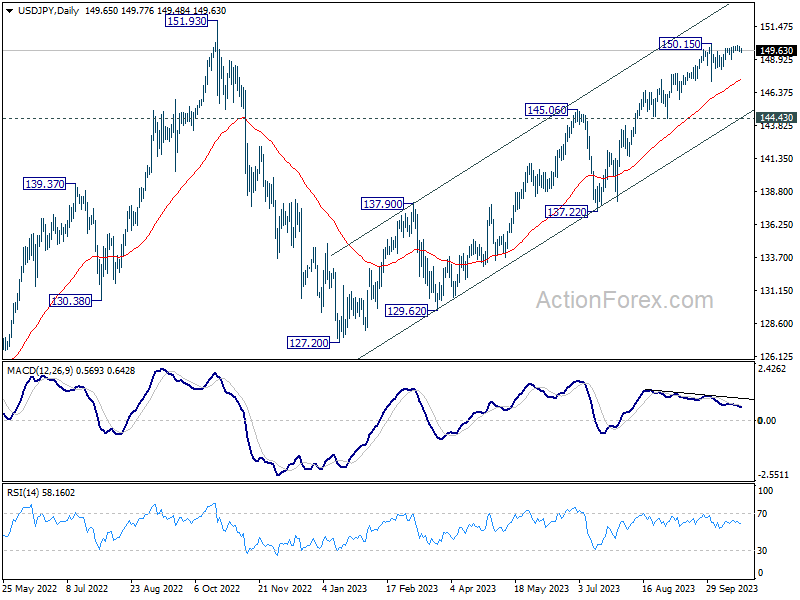
Daily Pivots: (S1) 149.52; (P) 149.75; (R1) 149.95; More...
Intraday bias in USD/JPY remains neutral and outlook is unchanged. Consolidation pattern from 150.15 could extend further. On the downside, below 148.94 minor support will turn bias to the downside for another down leg towards 147.28. On the upside, firm break of 150.15 will resume larger up trend to test 151.93 high.
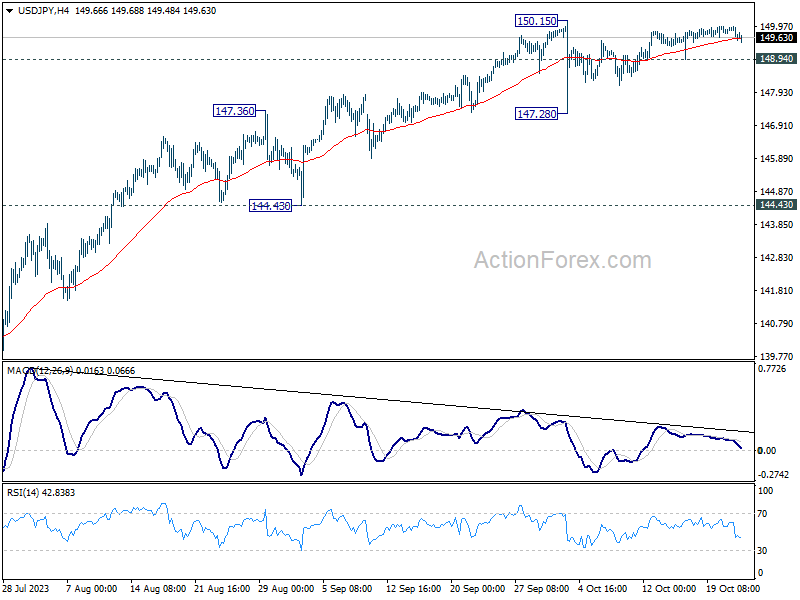
In the bigger picture, while rise from 127.20 is strong, it could still be seen as the second leg of the corrective pattern from 151.93 (2022 high). Rejection by 151.93, followed by sustained break of 145.06 resistance turned support will be the first sign that the third leg of the pattern has started. However, sustained break of 151.93 will confirm resumption of long term up trend.