Sample Category Title
A Quiet Prelude to a Bustling Week: PMIs, BoC, ECB and US GDP Watched
Asian markets commenced the week in a muted tone, with trading activity dampened due to public holidays in New Zealand and Hong Kong. The tepid trading ambiance is expected to persist through the day, given the sparse economic calendar. However, market participants are bracing for a resurgence in volatility, as a flurry of Purchasing Managers' Index (PMI) data from several major economies is slated for release tomorrow.
The limelight will progressively shift towards BoC and ECB rate decisions later in the week, both events capable of injecting significant dynamism into the market. Additionally, the unveiling of US GDP and PCE inflation data will be keenly observed.
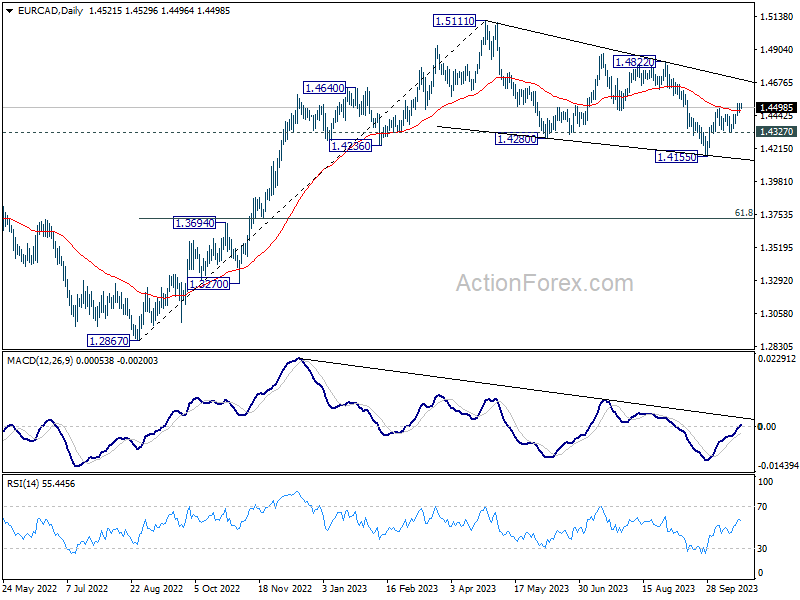
From a technical standpoint, EUR/CAD is shaping up to be a focal point for traders this week. Current analysis slightly leans towards the case that corrective decline from 1.5111 has wrapped up with three waves down to 1.4155. . Further rally is expected as long as 1.4327 support holds. Firm break of trend line resistance (now at 1.4703) will strengthen this case and target 1.4822 resistance next. However, break of 1.4327 will argue that corrective fall from 1.5111 is ready to resume through 1.4155.
In Asia, Nikkei closed down -0.83%. Japan 10-year JGB yield rose 0.0145 to 0.859. China Shanghai SSE is down -1.67%. Singapore Strait Times is down -0.39%.
Bitcoin firms its grip on 30k handle, yet a warm summer remains uncertain
Bitcoin, in today's subdued Asian trading session, has shown promising signs of firmly grasping 30k level finally. Last week, the digital currency experienced a brief yet sharp ascent, triggered by a false report of the SEC approving a Bitcoin spot ETF. Although this ascent was short-lived, the subsequent pullback was moderate, underscoring the resilience of the ongoing rally.
Expectations surrounding the approval of a Bitcoin spot ETF continue to percolate through the crypto community. Most analysts harbor hopes for a green light sometime in 2023. The ephemeral spike in Bitcoin's value last week underscores the market's sensitivity to such developments, suggesting that potential approval is not yet fully accounted for in current prices. This dynamic could lead to heightened responsiveness to positive news, refocusing investor attention on cryptocurrencies ahead of the much-anticipated "halving" slated for April next year.
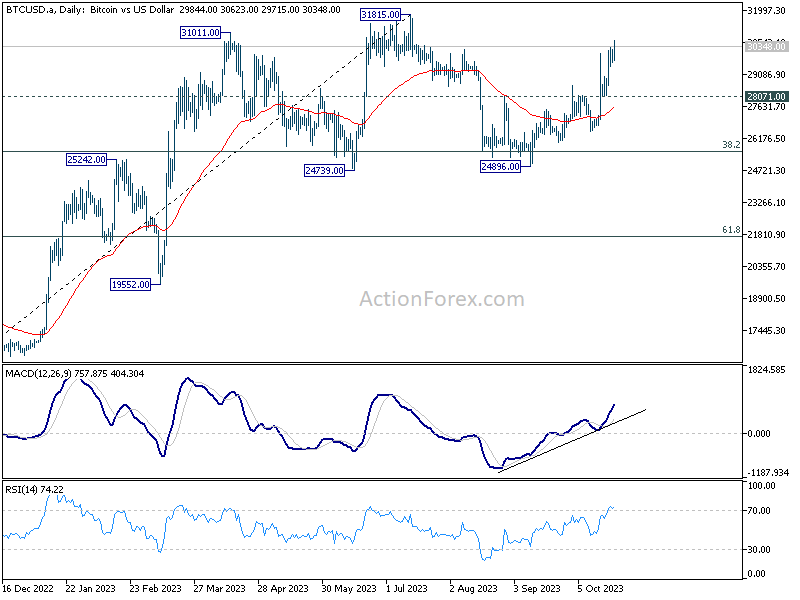
On the technical front, bullish sentiment in the near term is likely to prevail as long as 28071 support level remains intact, with eyes set on retesting 31815 high.
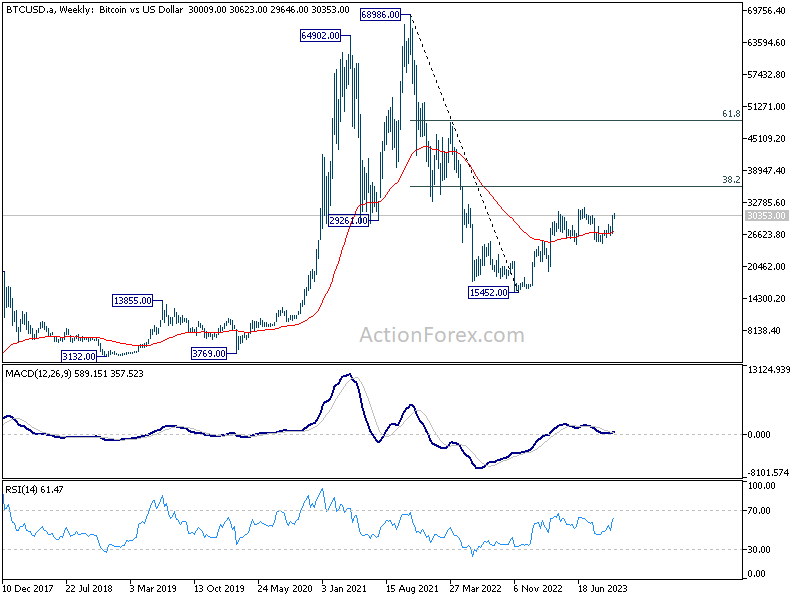
More comprehensive insights emerge when viewing the broader picture: robust support from 55 W EMA (now at 27115) coupled with 38.2% retracement of 15452 to 31815 at 25564 augments the bullish narrative.
Nevertheless, the real test lies ahead. For market enthusiasts to be convinced that Bitcoin's "summer" is in full swing, a significant hurdle awaits. The cryptocurrency will need to convincingly break through long-term Fibonacci resistance at 38.2% retracement of 68986 to 15452 at 35901.
China's market woes weigh on Copper and Aussie
Chinese Shanghai SSE Composite continue its descent below the psychological 3000 handle today, Copper has been dragged along in the downward spiral. The string of arrests and the investigation, over the weekend, into Foxconn Technology Group , Apple Inc.'s primary collaborator and one of China's largest employers, have further dampened foreign investors' confidence in the Chinese market.
Interestingly, this pessimistic trend emerged against the backdrop of optimistic economic data. Last week's releases paint a rather favorable economic portrait for China, boasting GDP growth in Q3 that exceeded expectations, accompanied by robust performances in retail sales and industrial production for September. However, these optimistic numbers have not translated into positive momentum for the SSE, which plummeted by -2.89% over the week, underscoring a pervasive bearish sentiment.
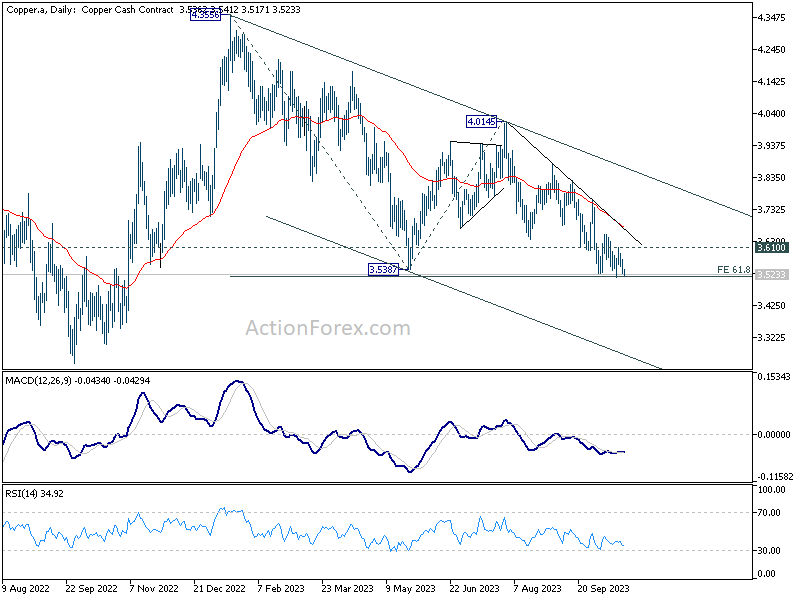
Copper, not immune to these developments, now teeters precariously, with its immediate future hanging in the balance. The metal's price is homing in on last week's low at 3.5129. Decisive break of this support could unleash a torrent of selling pressure, igniting resumption of the downtrend from 4.3556. Under this scenario, the next stop for Copper would be 100% projection of 4.3556 to 3.5387 from 4.0145 at 3.1976, which is close to 3.1314 support (2022 low).
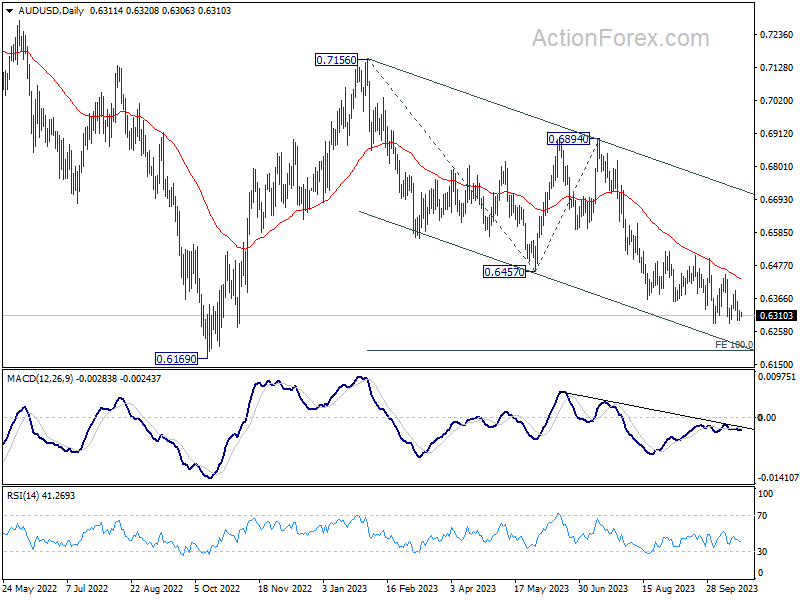
The trajectory of copper is closely entwined with that of AUD/USD, and a continued selloff in the former, spurred by dimming optimism about China, could unleash a cascade of selling pressure on the currency pair. Break of this month's low at 0.6284 will resume AUD/USD's down trend from 0.7156 to 100% projection of 0.7156 to 0.6457 from 0.6894 at 0.6195, which is close to 0.6169 support (2022 low).
BoC and ECB to stand pat, eyes on PMIs, US GDP, and Australia CPI
BoC is anticipated to maintain interest rate unchanged at 5.00% this week. This stance appears solidified following last week's September CPI which displayed faster deceleration to 3.8%. Market observers are now pondering whether the BoC will hint at an end to its tightening phase or adopt a hawkish stance, leaving the door open for potential future hikes. Meanwhile, a recent Reuters poll highlighted that two-thirds of economists are already expecting at least one rate cut by mid-2024. Yet, a clear indication from BoC is unlikely at this stage.
Meanwhile, across the Atlantic, ECB is poised to retain its main refinancing rate at 4.50% and its deposit rate at 4.00%. Several ECB officials have voiced the need for a pause, allowing prior tightening to permeate the European economy. ECB President Christine Lagarde has consistently expressed that the current rate level, if maintained for a "sufficiently long duration", will steer inflation back towards its target in a timely manner. But the definition of "sufficiently long" remains ambiguous. In a separate Reuters poll, out of 83 economists, 48 (accounting for 58%) forecast the inaugural rate cut to materialize in the third quarter of 2024. But any official indication from Lagarde on this timeline is not anticipated at the moment.
In terms of economic indicators, PMI figures from major economies will be under the microscope come Tuesday, with components such as activity, orders, employment, and prices being crucial for analysts' assessments. Other pivotal releases this week include US GDP and PCE inflation data. Down under, all eyes will be on Australia's CPI, a metric that will be scrutinized to evaluate the likelihood of a November rate hike by the RBA, especially given the central bank's stated minimal tolerance for unexpected upticks in inflation.
Here are some highlights for the week:
- Monday: Eurozone consumer confidence.
- Tuesday: Australia PMIs, Japan PMIs; Germany Gfk consumer sentiment; Eurozone PMIs; UK employment, PMIs; US PMIs.
- Wednesday: Australia CPI; Germany Ifo business climate; BoC rate decision; US new home sales.
- Thursday: Japan corporate service prices; Australia import prices; ECB rate decision; US GDP, jobless claims, durable goods orders, goods trade balance, pending home sales.
- Friday: Japan Tokyo CPI; Australia PPI; US PCE inflation, personal income and spending.
USD/CHF Daily Outlook
Daily Pivots: (S1) 0.8906; (P) 0.8921; (R1) 0.8938; More....
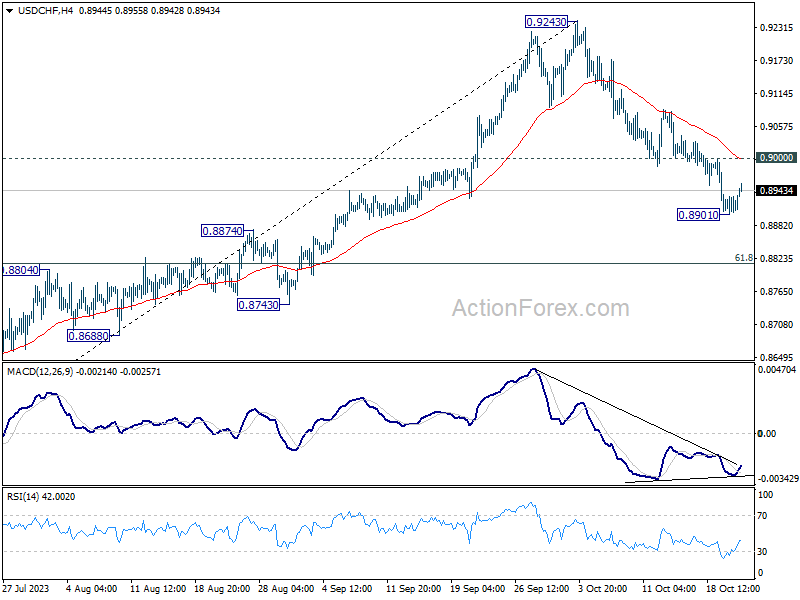
Intraday bias in USD/CHF is turned neutral first with today's recovery. But further decline is still expected as long as 0.9000 resistance holds. Below 0.8901 will resume the fall from 0.9243 to 61.8% retracement of 0.8551 to 0.9243 at 0.8815 next. Sustained break there will pave the way to retest 0.8551 low. Nevertheless, break of 0.9000 will turn bias back to the upside for stronger rebound.
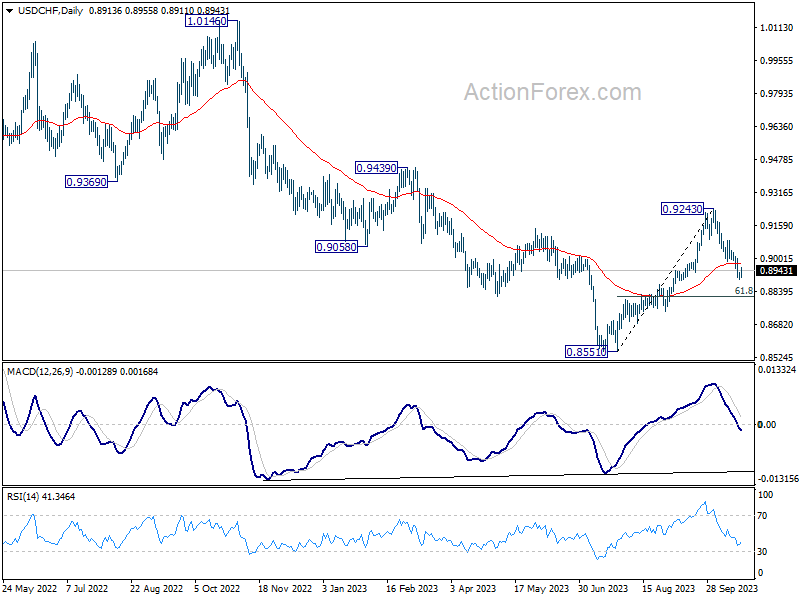
In the bigger picture, the firm break of 55 D EMA (now at 0.8974) argues that rebound from 0.8551 might be completed as a correction at 0.9243. In other words, larger fall from 1.0146 (2022 high) is possibly not over yet. Risk will now stay on the downside as long as 0.9243 resistance holds. Firm break of 0.8551 will confirm down trend resumption.
Economic Indicators Update
| GMT | Ccy | Events | Actual | Forecast | Previous | Revised |
|---|---|---|---|---|---|---|
| 10:00 | EUR | German Buba Monthly Report | ||||
| 14:00 | EUR | Eurozone Consumer Confidence Oct P | -18 | -18 |
Gold Technical: At Risk of a Minor Pull-back Before Potential New Upleg
- The recent three weeks of rally seen in spot Gold (XAU/USD) has been driven by geopolitical risk premium and positive momentum.
- The rise in the price actions of spot Gold has ignored the increase in the long-term opportunity cost of holding gold as the US 10-year Treasury yield rallied in tandem.
- Heightened stagflation risk is likely the cause of the ignorance of higher holding costs in Gold.
- The current short-term uptrend phase of spot Gold (XAU/USD) has reached an “overstretched condition” which increases the risk of a corrective retracement, watch the US$2,006 key short-term resistance.
The price actions of spot Gold (XAU/USD) have risen by +10.3% right at the highlighted US$1,810 key support in the past three weeks and printed an intraday high of US$1,997 last Friday, 20 October 2023.
A medium-term uptrend phase may have kickstarted in Gold
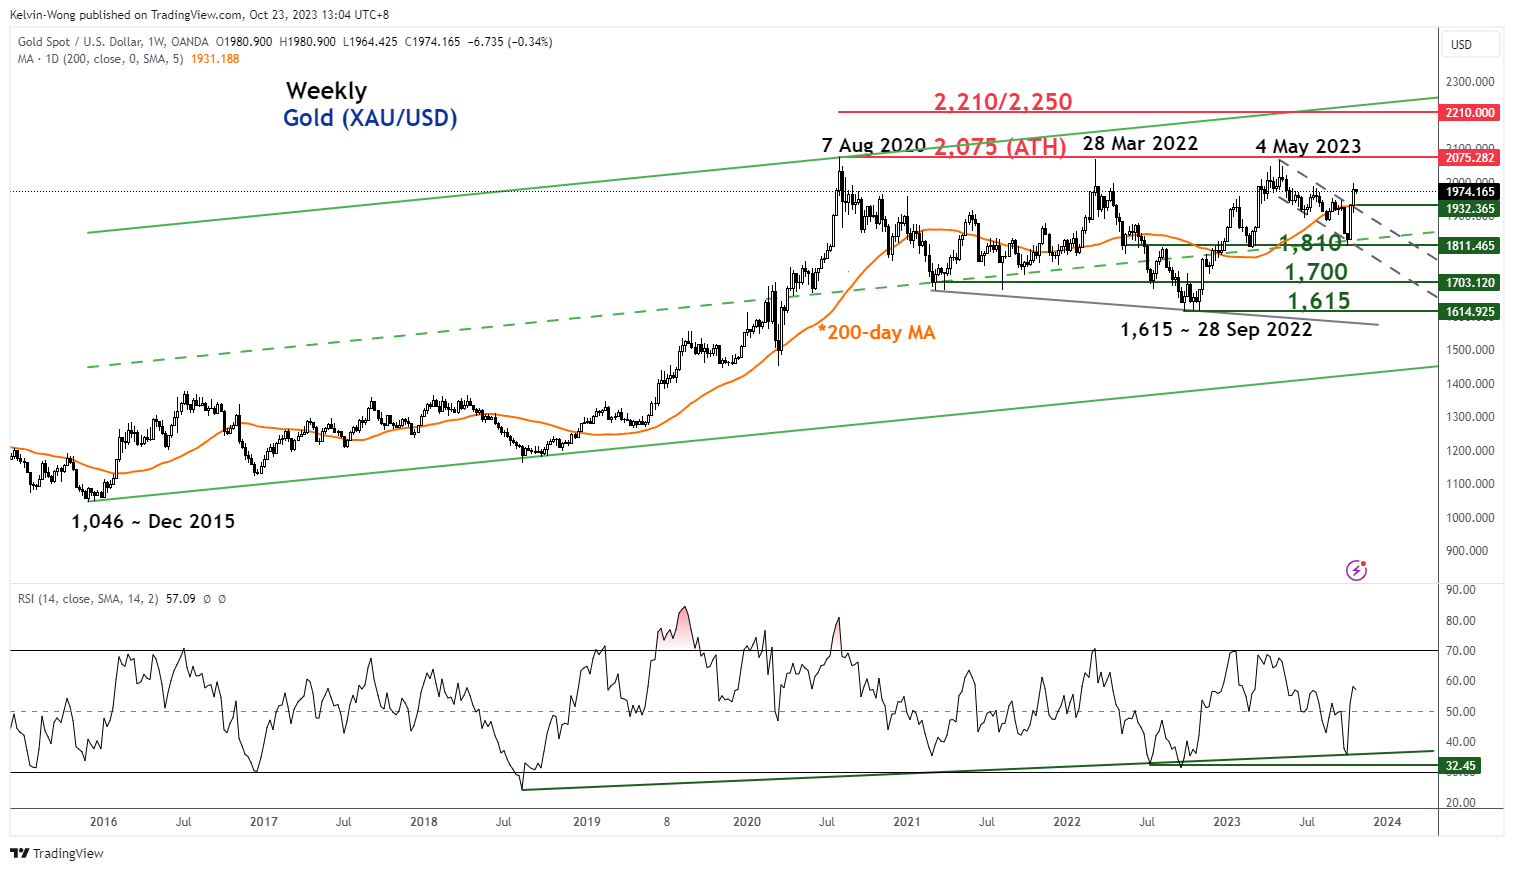
Fig 1: Spot Gold (XAU/USD) medium-term & major trends as of 23 Oct 2023 (Source: TradingView, click to enlarge chart)
One of the bullish primary drivers has been momentum where spot Gold (XAU/USD) surpassed two key technical milestones; the upper boundary of a medium-term descending channel that capped prior rallies since 4 May 2023 and the key 200-day moving average. The occurrences of these key resistance breakout episodes are likely to have led to a psychological positive feedback loop as well as short-covering activities because large non-commercial (speculators) net long positions in the Gold futures market had declined to 161,861 contracts for the week of 9 October 2023, a year-to-date low based on the Commitments of Traders report.
The other driver is the rising geopolitical risk premium due to the risk of a prolonged Israel-Hamas conflict as well as stagflation risk triggered by potential higher oil prices due to its spill-over impact to the wider Middle East region where supply disruption in oil may be weaponized for strategic reasons by key stakeholders such as Iran.
Interestingly, the heightened risk of stagflation seen in the last three weeks has overshadowed the increase in the opportunity cost of holding gold as the US 10-year Treasury yield also rallied in unison and hit an intraday high of 5% last Thursday 19 October, its highest level since July 2007 before the onset of the Great Financial Crisis.
A minor corrective retracement/pull-back looms for Gold
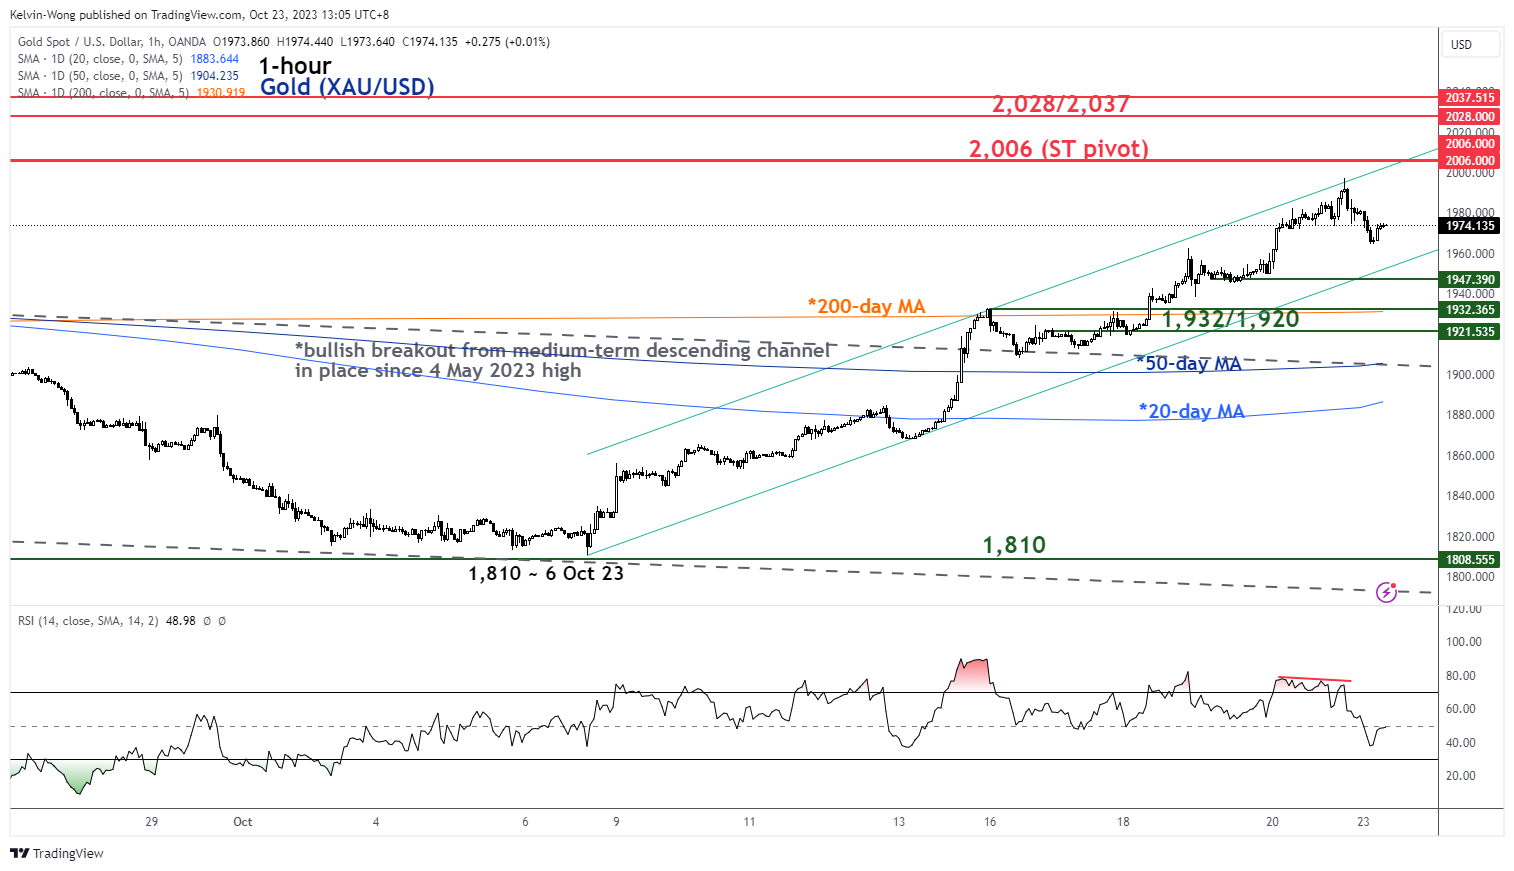
Fig 2: Spot Gold (XAU/USD) minor short-term trend as of 23 Oct 2023 (Source: TradingView, click to enlarge chart)
Right now, technically speaking, the short-term uptrend phase of Gold (XAU/USD) in place since the 6 October 2023 low of US$1,810 has reached an “overstretched condition” after it scaled to a five-month high seen last Friday, 20 October.
Price actions of Gold (XAU/USD) have reacted negatively at the upper boundary of the short-term ascending channel that is right below a key short-term pivotal resistance of US$2,006 (the former congestion area of 5 May/12 May 2023 and a Fibonacci extension projection cluster) coupled with a bearish divergence condition seen in the hourly RSI momentum indicator at its overbought region (above 70 level) on last Friday.
These observations suggest the bullish momentum of the short-term uptrend phase in Gold (XAU/USD) has abated and the next potential movement may be a corrective retracement before a new potential impulsive up move sequence unfolds due to the clearance of the key 200-day moving average and the former medium-term descending channel resistance at around US$1,900.
A break below the near-term support of US$1,947 reinforces the retracement scenario towards the immediate support zone of US$1,932/1,920 (200-day moving average and the 38.2% Fibonacci retracement of the recent rally from 6 October 2023 low to 20 October 2023 high).
On the flip side, a clearance above US$2,006 negates the short-term bearish tone for a continuation of the bullish impulsive up move sequence towards the next intermediate resistance at US$2,028/2,037 (11 May 2023 minor swing high and a Fibonacci extension projection) in the first step.
Technical Outlook and Review
DXY:
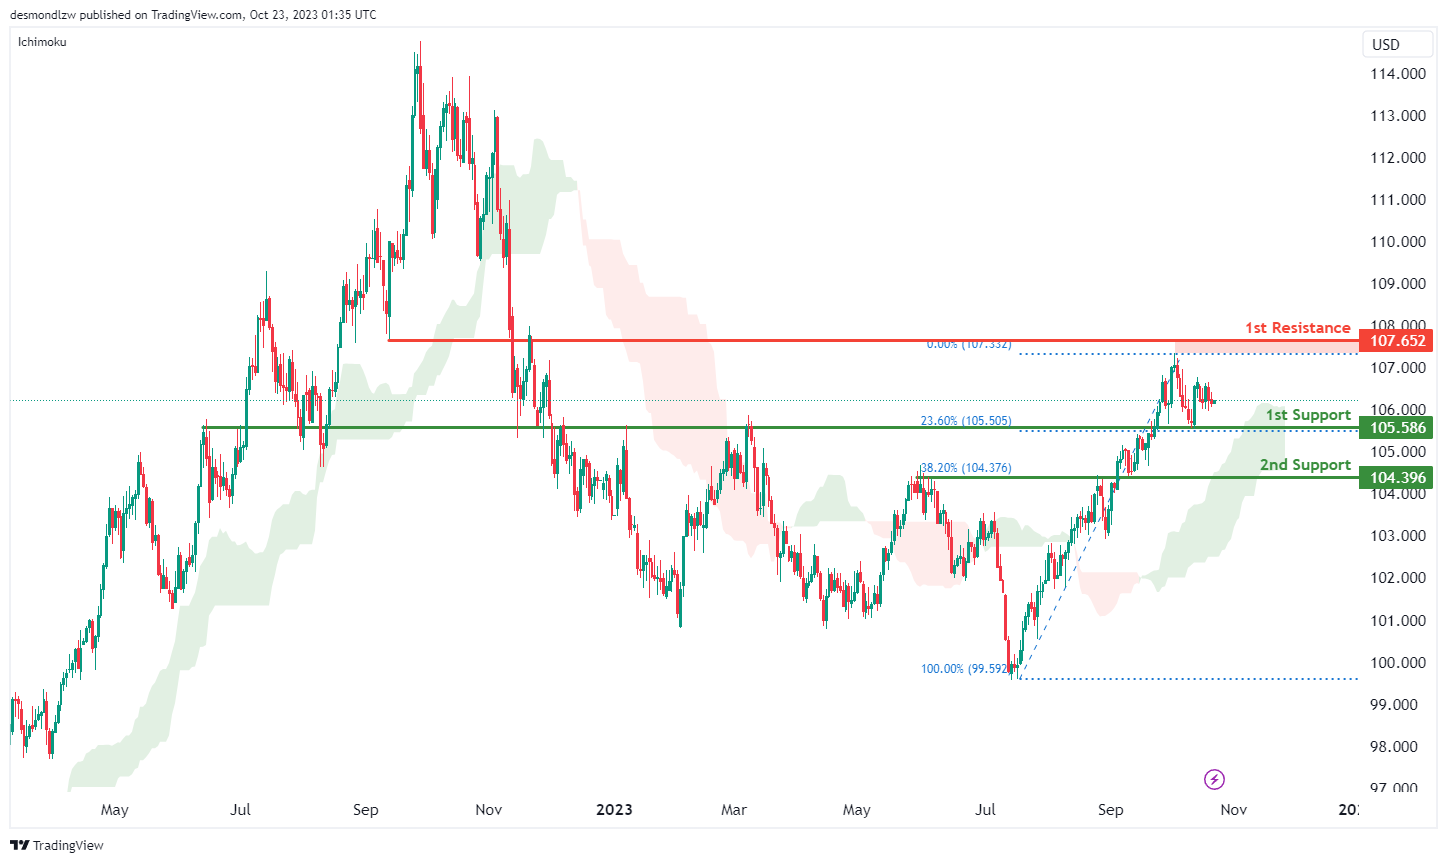
The DXY chart currently maintains a bullish momentum, with the price positioned above the bullish Ichimoku cloud. There is a potential scenario where price could experience a bullish bounce off the 1st support level and head towards the 1st resistance.
The 1st support at 105.58 is considered significant as it aligns with an overlap support level and coincides with the 23.60% Fibonacci Retracement level. Additionally, the 2nd support at 104.39 is identified as an overlap support and corresponds to the 38.20% Fibonacci Retracement level.
On the resistance side, the 1st resistance at 107.65 is characterized as an overlap resistance.
EUR/USD:
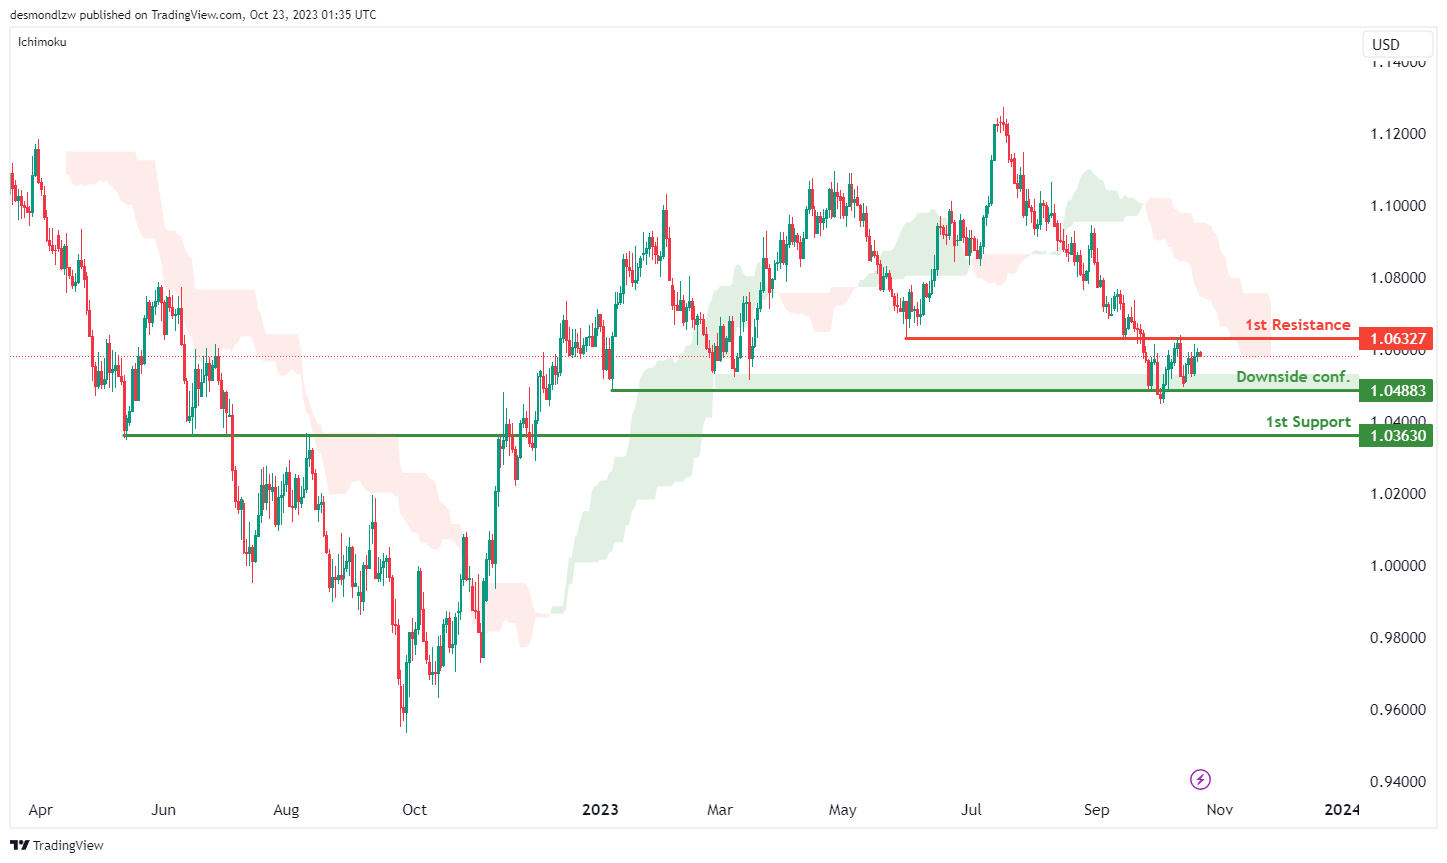
The EUR/USD chart currently exhibits a bearish momentum, with price positioned below the bearish Ichimoku cloud. There’s a potential scenario where price could experience a bearish reaction off the 1st resistance and drop towards the 1st support.
The 1st support at 1.0363 is considered significant as it aligns with an overlap support level and coincides with the 78.60% Fibonacci Retracement level. Traders may also watch for downside confirmation at the 1.0488 level, which is identified as a swing low support.
On the resistance side, the 1st resistance at 1.0632 is characterized as an overlap resistance.
EUR/JPY:
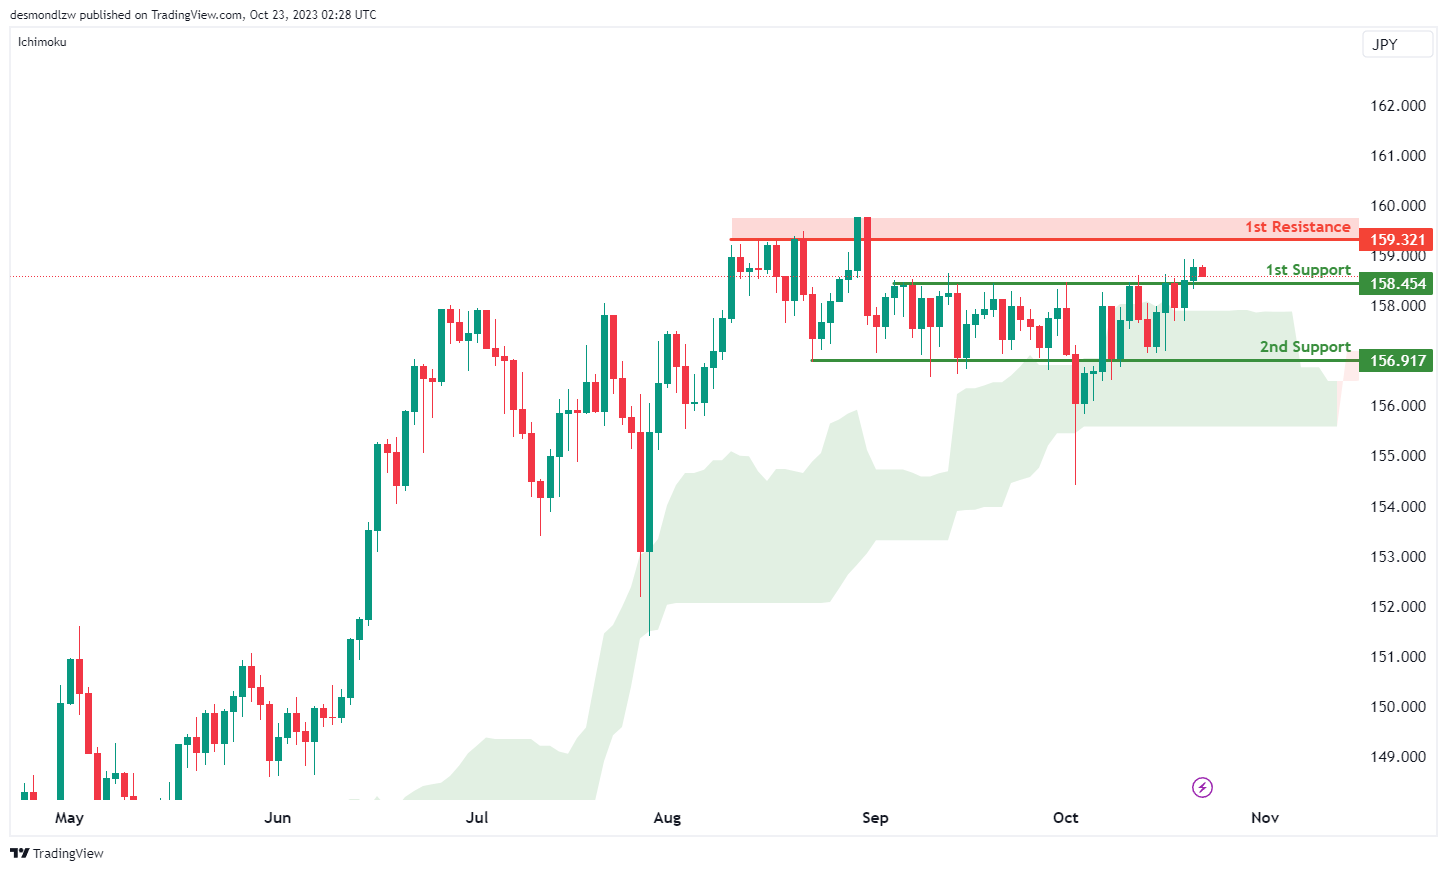
The instrument we are analyzing is EUR/JPY, and the overall momentum of the chart is bullish. One of the factors contributing to this momentum is that the price is above the bullish Ichimoku cloud, a commonly used technical indicator in trading.
There is a possibility that the price may experience a bullish bounce when approaching the first support level and then head towards the first resistance level.
The first support level is at 158.45, and it’s considered strong because it represents an overlap of support.
The second support level is at 156.91, and it’s also significant as it marks another overlap of support.
On the resistance side, the first resistance level is at 159.32, and it’s noteworthy because it represents a pullback resistance.
EUR/GBP:
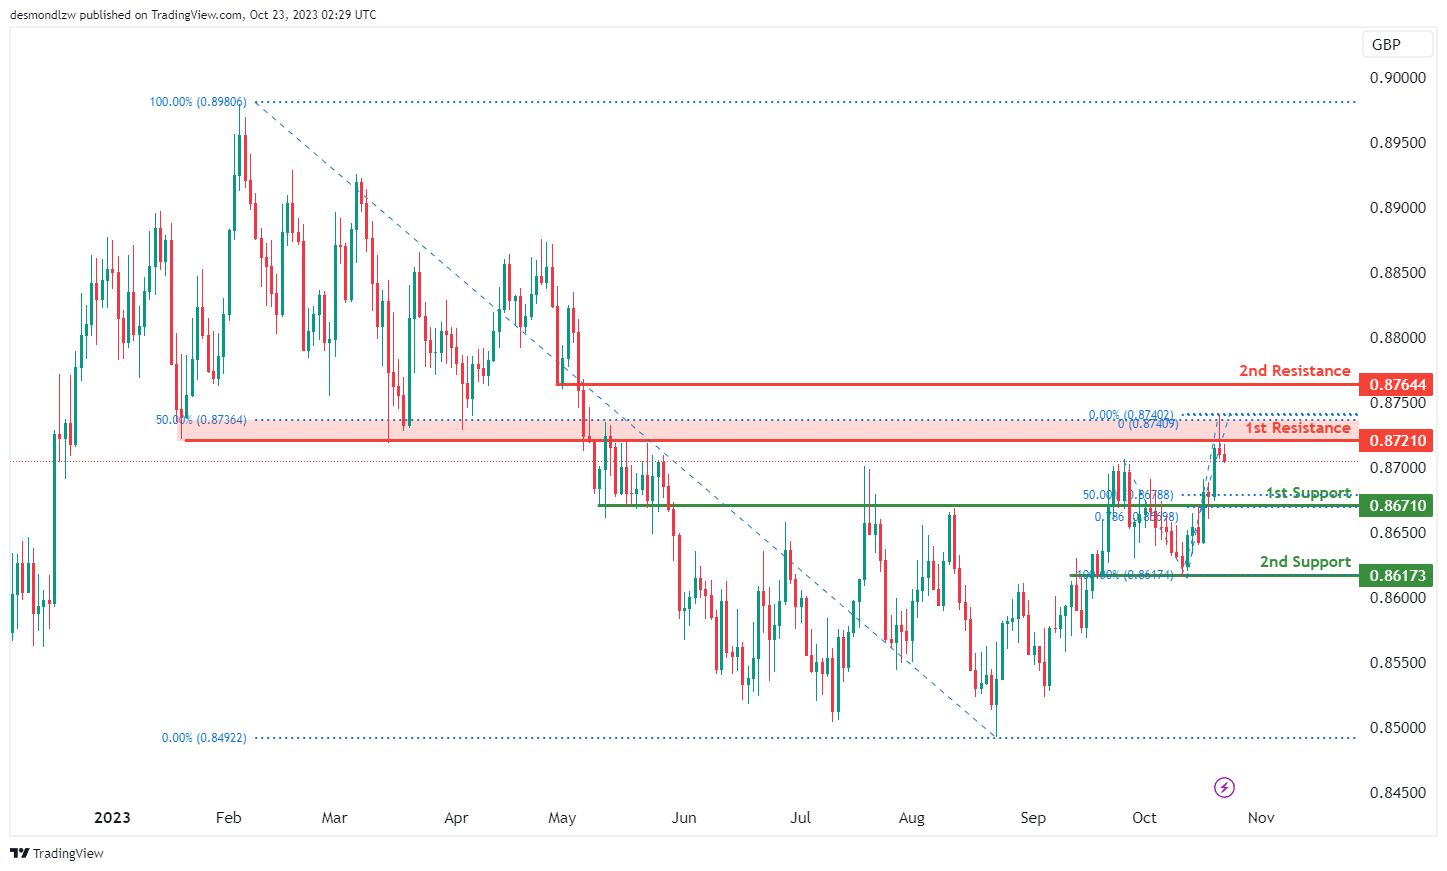
The instrument we are examining is EUR/GBP, and the overall momentum of the chart indicates a bearish trend.
There is a possibility that the price may continue in a bearish direction, potentially reaching the first support level.
The first support level is at 0.8671, and it’s considered strong because it represents a pullback support. Additionally, it aligns with a 50% Fibonacci Retracement and a 78.60% Fibonacci Projection, indicating a Fibonacci confluence.
The second support level is at 0.8617, and it’s also significant as it marks an overlap of support.
On the resistance side, the first resistance level is at 0.8721, and it’s noteworthy because it represents an overlap of resistance and aligns with a 50% Fibonacci Retracement.
The second resistance level is at 0.8764, and it’s significant as well, as it functions as a pullback resistance.
GBP/USD:
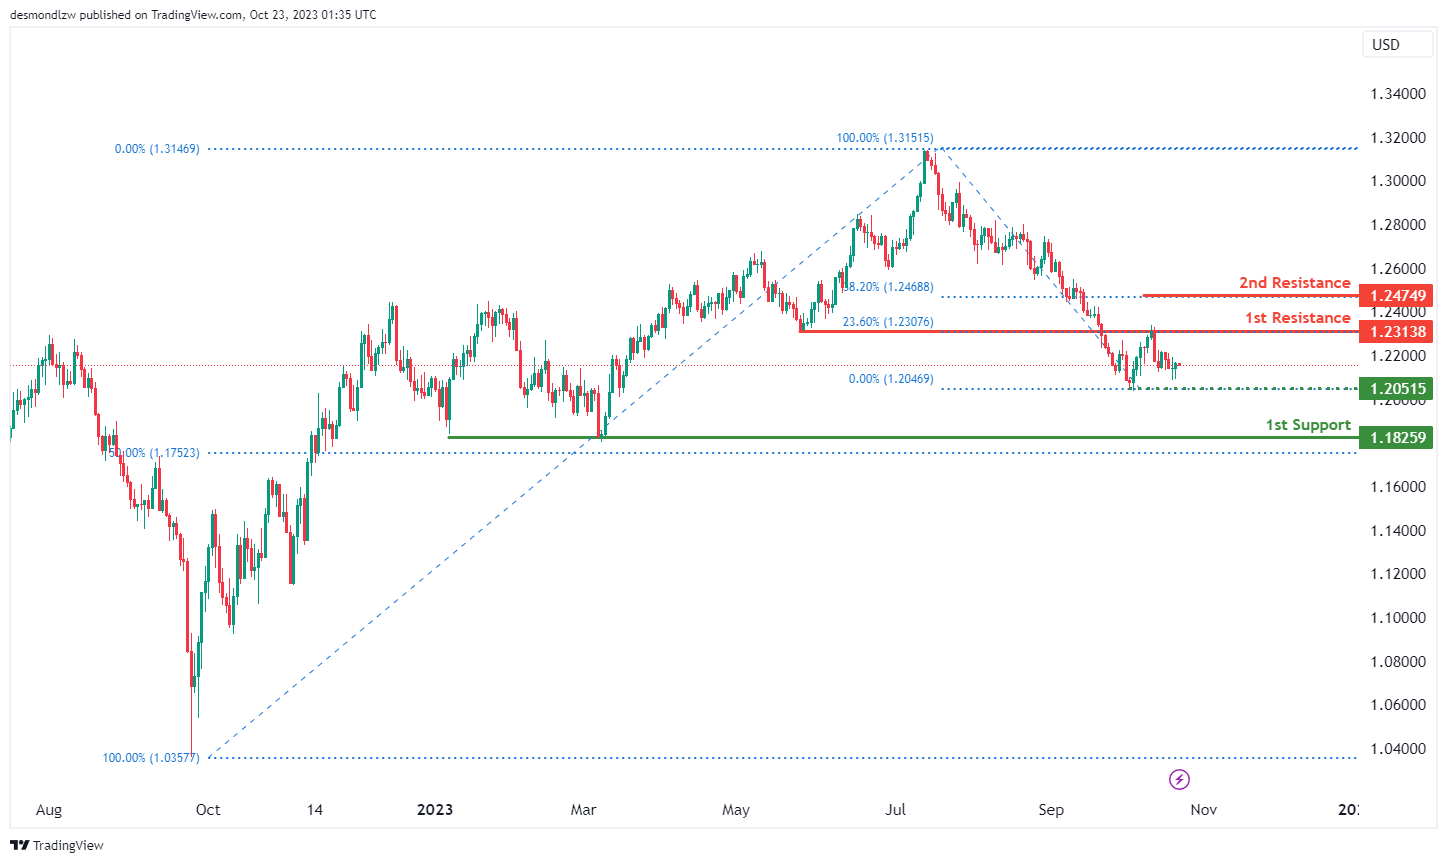
The GBP/USD chart currently exhibits a neutral momentum, suggesting a potential for price to fluctuate The GBP/USD chart currently has a bearish overall momentum. There’s a potential scenario where price could continue in a bearish direction towards the 1st support level.
The 1st support at 1.1825 is considered significant as it aligns with multi-swing low support. Additionally, there is an intermediate support at 1.2051, identified as a swing low support level.
On the resistance side, the 1st resistance at 1.2313 is characterized as an overlap resistance and coincides with the 23.60% Fibonacci Retracement level. Beyond this, the 2nd resistance at 1.2474 is identified as a resistance level at the 38.20% Fibonacci Retracement.
GBP/JPY:
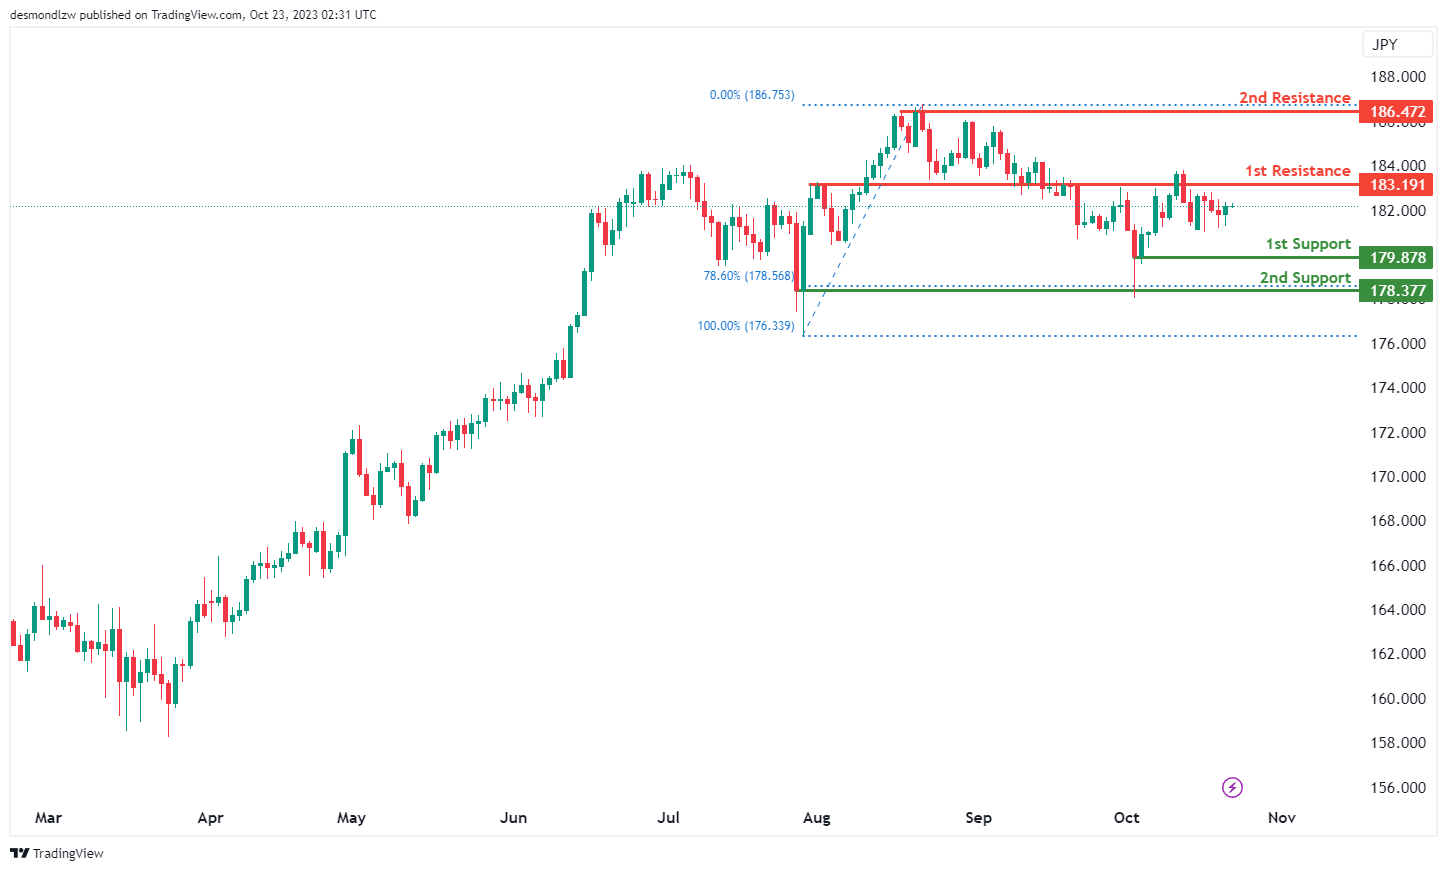
The instrument we are analyzing is GBP/JPY, and the overall momentum of the chart is bullish. One of the factors contributing to this momentum is that the price is within the bullish Ichimoku cloud, a commonly used technical indicator in trading.
There is a possibility that the price may experience a bullish continuation, potentially reaching the first resistance level.
The first support level is at 179.87, and it’s considered strong because it represents a swing low support.
The second support level is at 178.37, and it’s also significant as it marks a multi-swing low support and aligns with a 78.60% Fibonacci Retracement.
On the resistance side, the first resistance level is at 183.19, and it’s noteworthy because it represents an overlap of resistance.
The second resistance level is at 186.47, and it’s significant as well, as it functions as a swing high resistance.
USD/CHF:
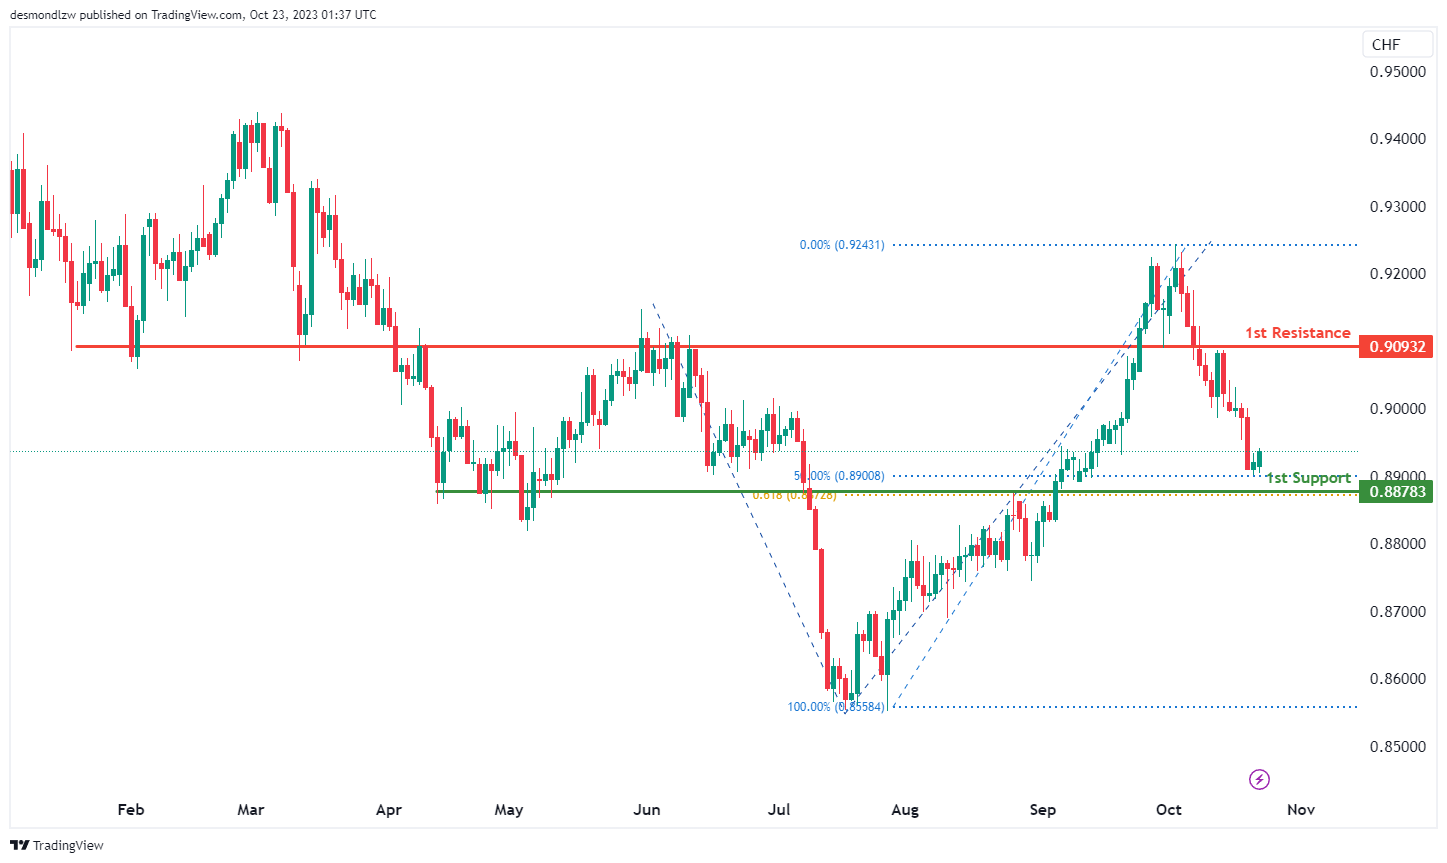
The USD/CHF chart currently exhibits a bullish overall momentum, and there is a potential scenario for a bullish bounce off the 1st support level towards the 1st resistance.
The 1st support at 0.8878 is considered significant as it aligns with an overlap support level. Notably, it also coincides with both the 50% Fibonacci Retracement and the 61.80% Fibonacci Projection, indicating a strong Fibonacci confluence at this level.
On the resistance side, the 1st resistance at 0.9093 is characterized as an overlap resistance.
USD/JPY:
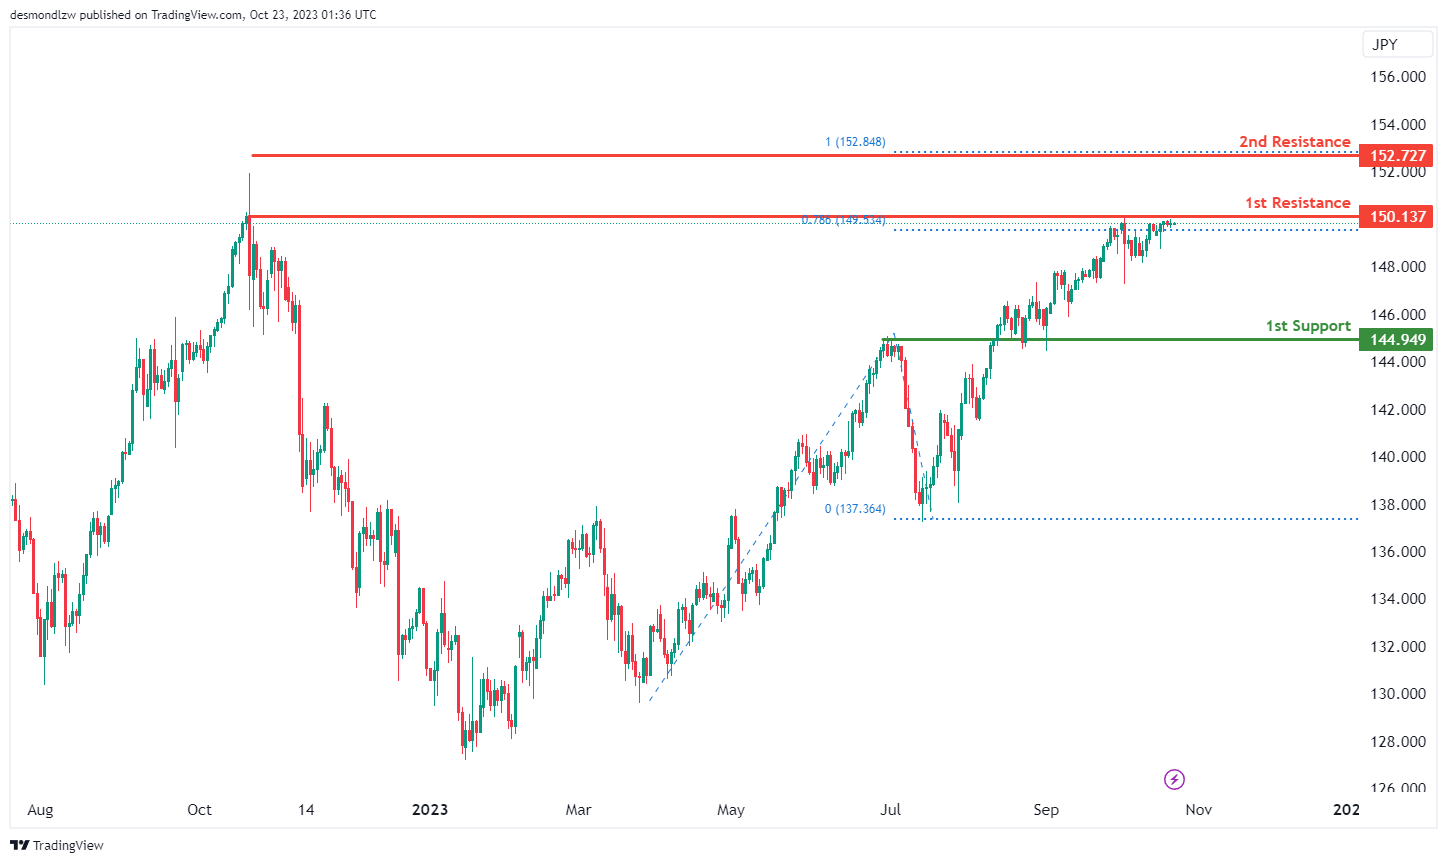
The USD/JPY chart currently exhibits a weak bearish overall momentum with low confidence, and there is a potential scenario for a bearish continuation towards the 1st support level.
The 1st support at 144.94 is considered significant as it aligns with an overlap support level.
On the resistance side, the 1st resistance at 150.13 is characterized as a multi-swing high resistance level, and beyond this, the 2nd resistance at 152.72 is identified as a swing high resistance level, coinciding with the 100% Fibonacci Projection.
USD/CAD:
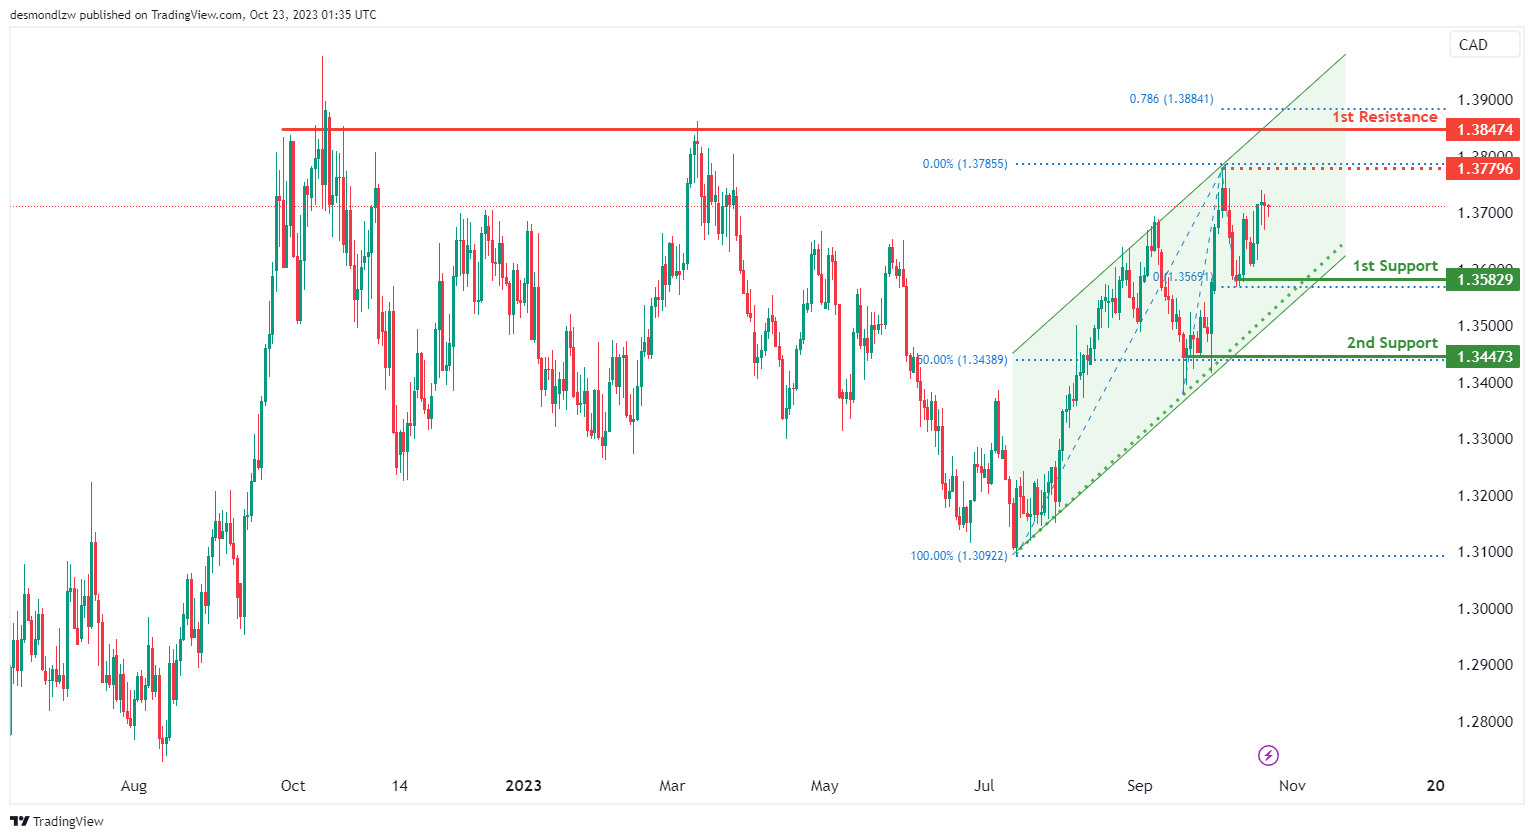
The USD/CAD chart currently exhibits a bullish momentum, suggesting a potential scenario for price to make a bullish continuation towards the 1st resistance level, especially if price breaks above the intermediate resistance level. In addition, price has also been trading within a bullish channel since mid-July to provide another bullish factor.
The intermediate resistance level at 1.3779 is identified as a swing-high resistance. Higher up, the 1st resistance level at 1.3847 is marked as a multi-swing-high resistance that aligns close to the 78.60% Fibonacci projection level, potentially acting as a barrier to further bullish advances.
To the downside, the 1st support level at 1.3583 is identified as a pullback support. Additionally, the 2nd support level at 1.3447 is also noted as a pullback support that aligns with the 50.00% Fibonacci retracement level, adding to its significance as a potential support zone.
AUD/USD:
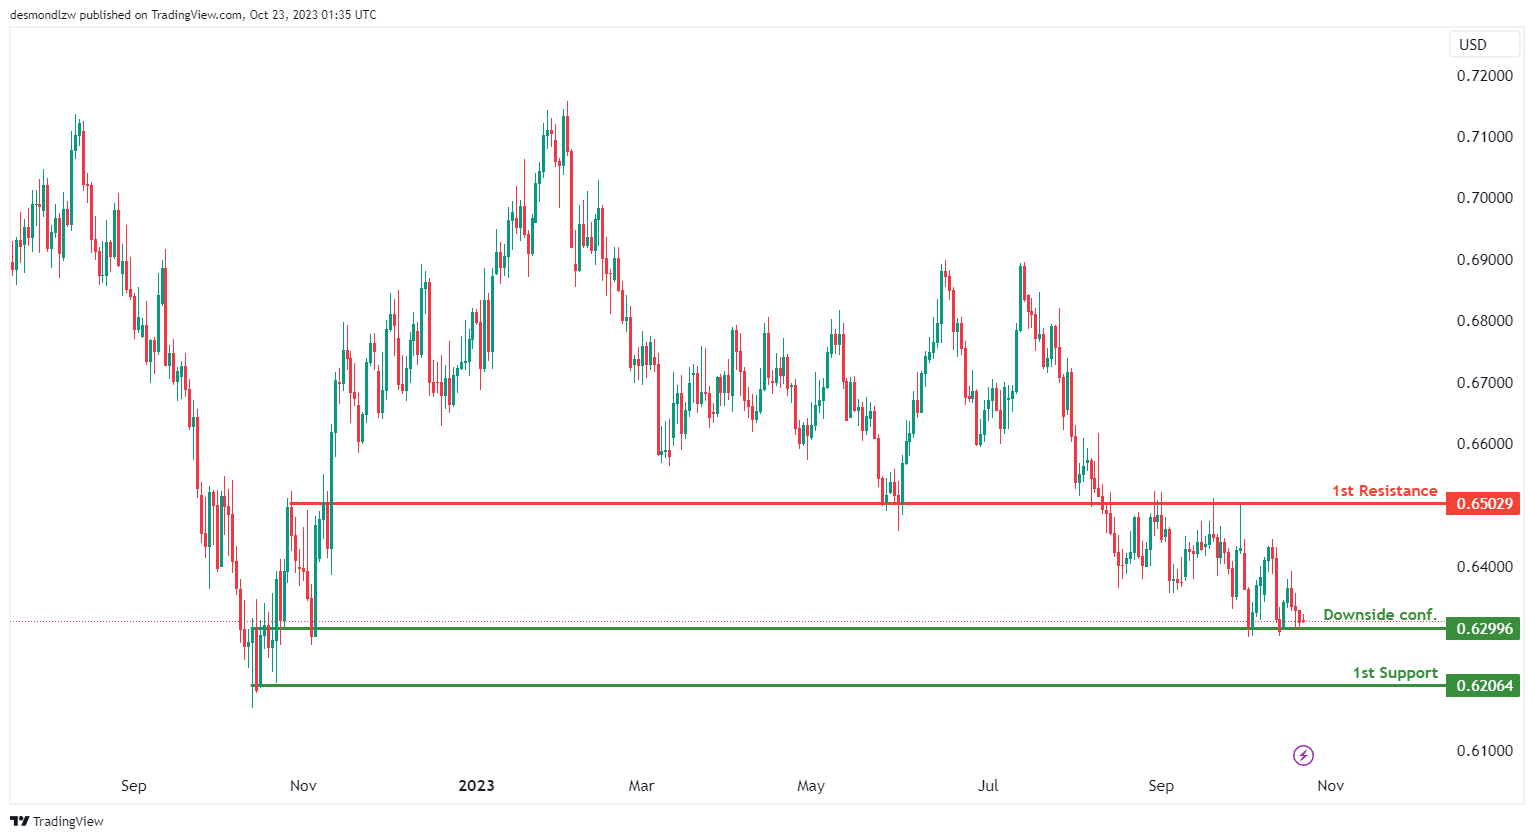
The AUD/USD chart currently exhibits an overall bearish momentum. Price could make a further bearish continuation should it break below the downside confirmation level to trigger a move towards the 1st support level.
The downside confirmation level at 0.6299 is identified as an overlap support. Further below, the 1st support level at 0.6206 is marked as a major swing-low support, further reinforcing its importance as a potential support area.
To the upside, the 1st resistance level at 0.6503 is identified as an overlap resistance, making it a potentially strong resistance level.
NZD/USD
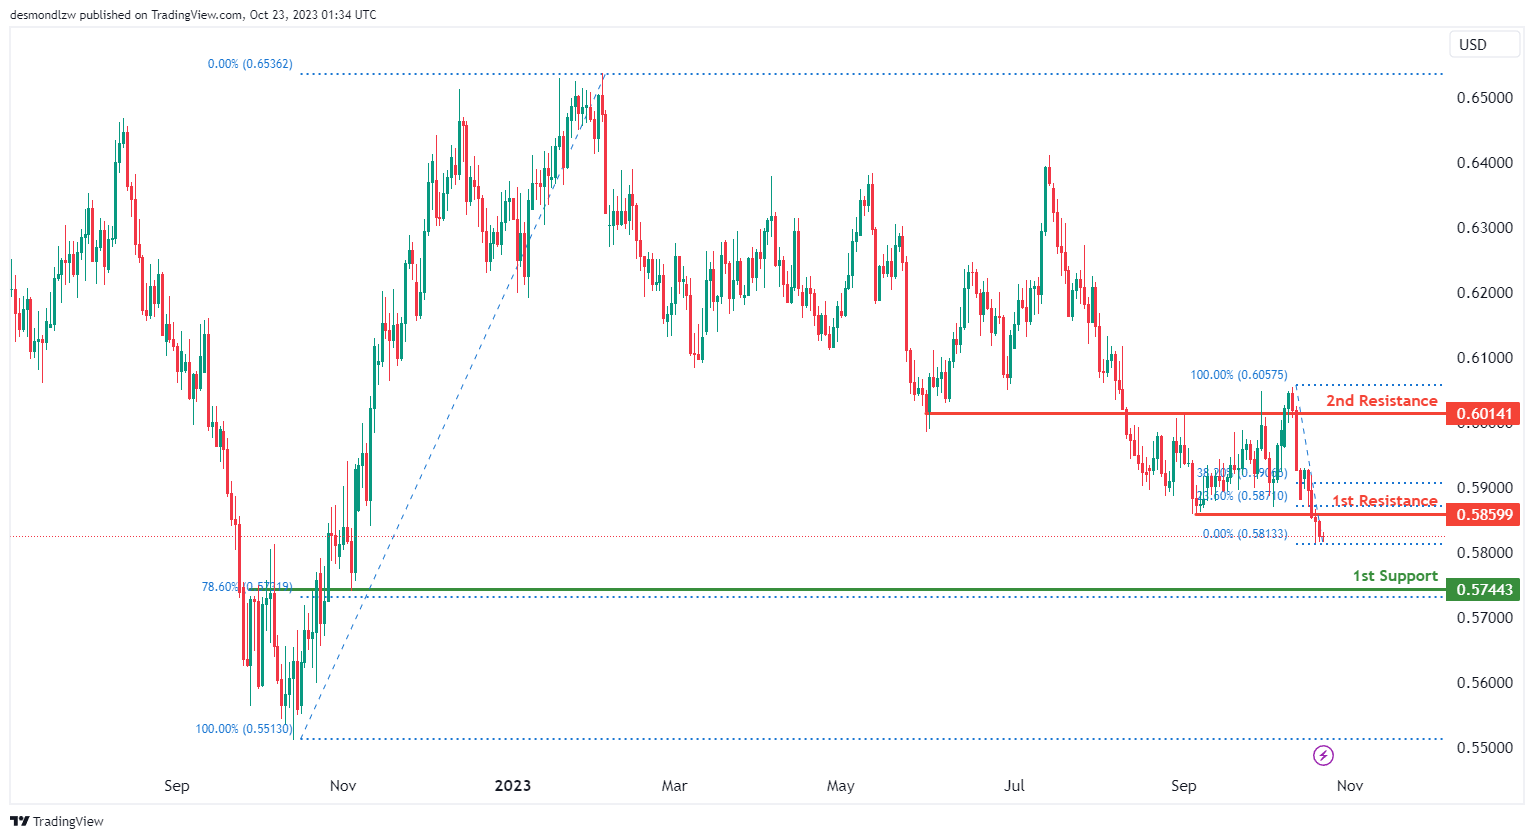
The NZD/USD chart currently exhibits a bearish momentum, suggesting a potential scenario for price to make a bearish continuation towards the 1st support level.
The 1st support level at 0.5744 is identified as an overlap support that aligns with the 78.60% Fibonacci retracement level, indicating a potential support zone.
To the upside, the 1st resistance level at 0.5859 is identified as a pullback resistance that aligns with the 23.60% Fibonacci retracement level. Beyond this, the 2nd resistance level at 0.6014 is marked as an overlap resistance, making it a potentially strong resistance level.
DJ30:
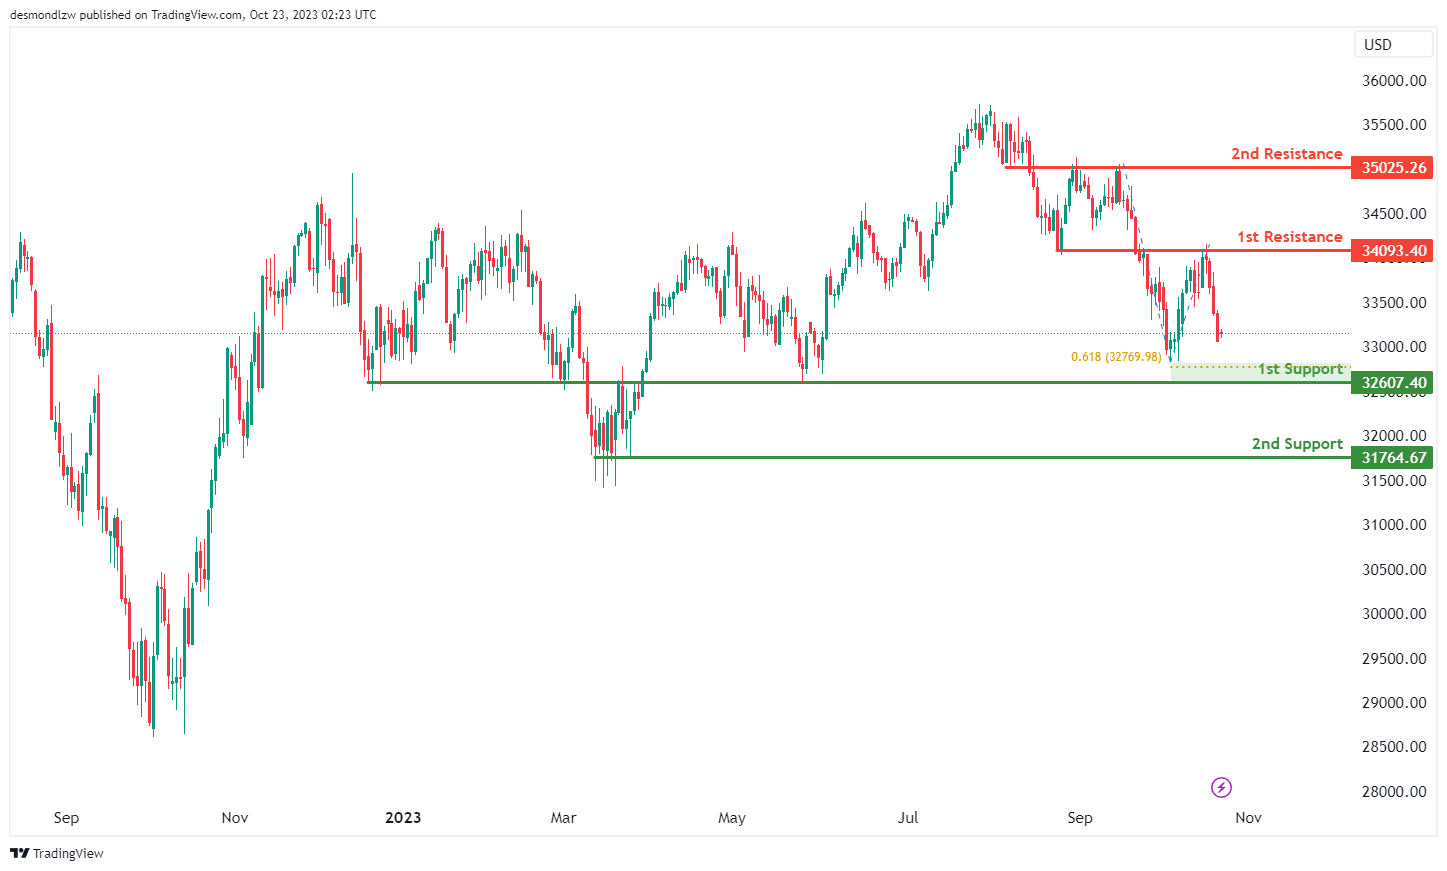
The instrument we are analyzing is DJ30, and the overall momentum of the chart indicates a bearish trend.
There is a possibility that the price may continue in a bearish direction, potentially reaching the first support level.
The first support level is at 32,607.40, and it’s considered strong because it represents an overlap of support and aligns with a 61.80% Fibonacci Projection.
The second support level is at 31,764.67, and it’s also significant as it marks a multi-swing low support.
On the resistance side, the first resistance level is at 34,093.40, and it’s noteworthy because it represents an overlap of resistance.
The second resistance level is at 35,025.26, and it’s significant as well, as it functions as an overlap resistance.
GER40:
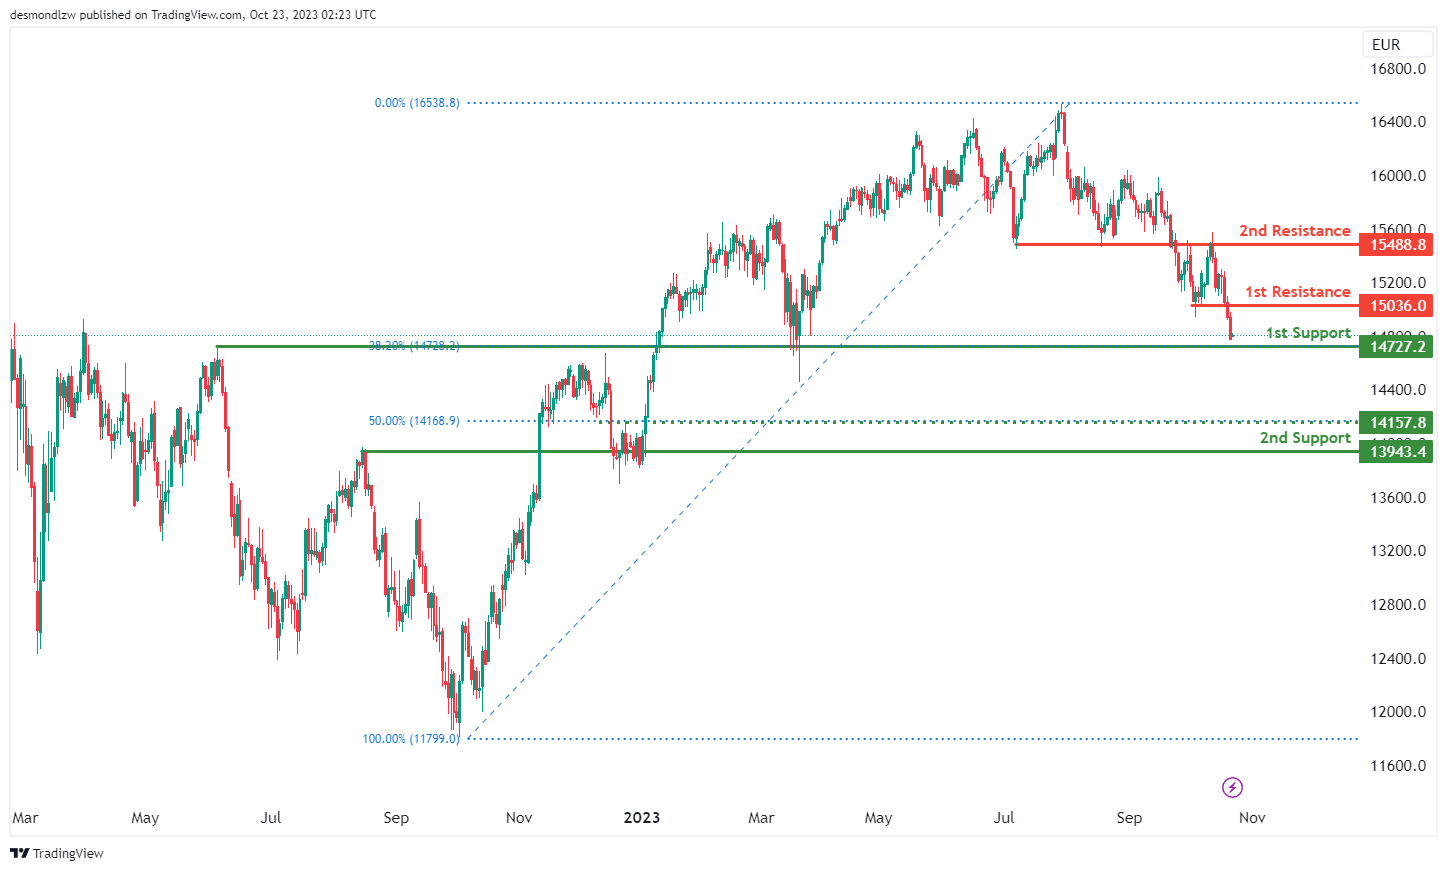
The instrument we are examining is GER40, and the overall momentum of the chart indicates a bearish trend.
There is a possibility that the price may continue in a bearish direction, potentially reaching the first support level.
The first support level is at 14,727.20, and it’s considered strong because it represents an overlap of support and aligns with a 38.20% Fibonacci Retracement.
The second support level is at 13,943.40, and it’s also significant as it marks another overlap of support.
On the resistance side, the first resistance level is at 15,036.00, and it’s noteworthy because it represents a pullback resistance.
The second resistance level is at 15,488.80, and it’s significant as well, as it functions as an overlap resistance.
Additionally, there is an intermediate support level at 14,157.80, and it’s considered significant because it represents a pullback support and aligns with a 50% Fibonacci Retracement.
US500
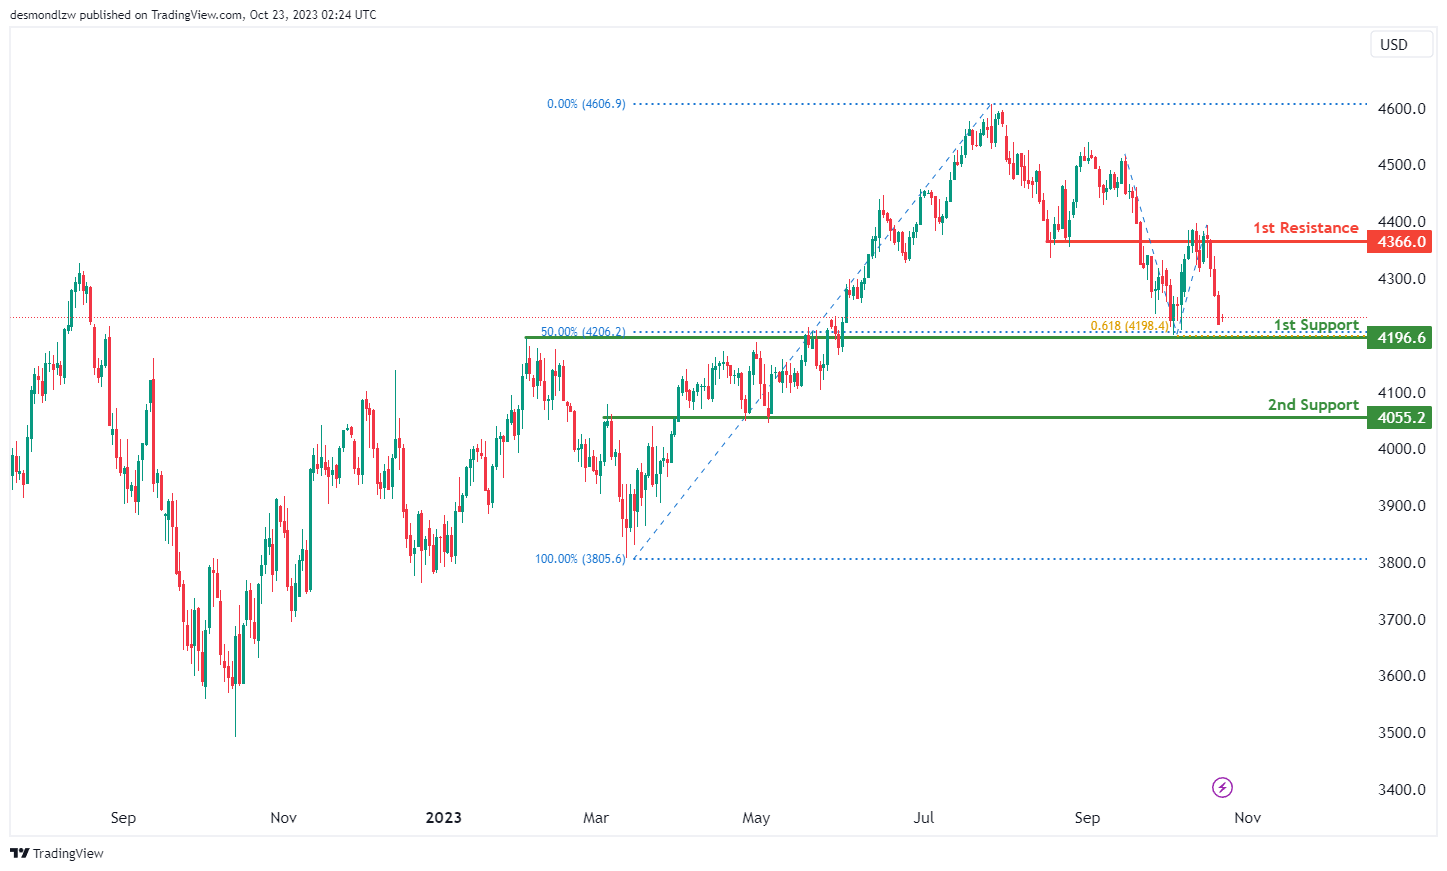
The instrument under analysis is US500, and the overall momentum of the chart indicates a bearish trend.
There is a possibility that the price may continue in a bearish direction, potentially reaching the first support level.
The first support level is at 4,196.6, and it’s considered strong because it represents an overlap of support and aligns with a 50% Fibonacci Retracement and a 61.80% Fibonacci Projection, indicating a Fibonacci confluence.
The second support level is at 4,055.2, and it’s also significant as it marks another overlap of support.
On the resistance side, the first resistance level is at 4,366.0, and it’s noteworthy because it represents an overlap of resistance.
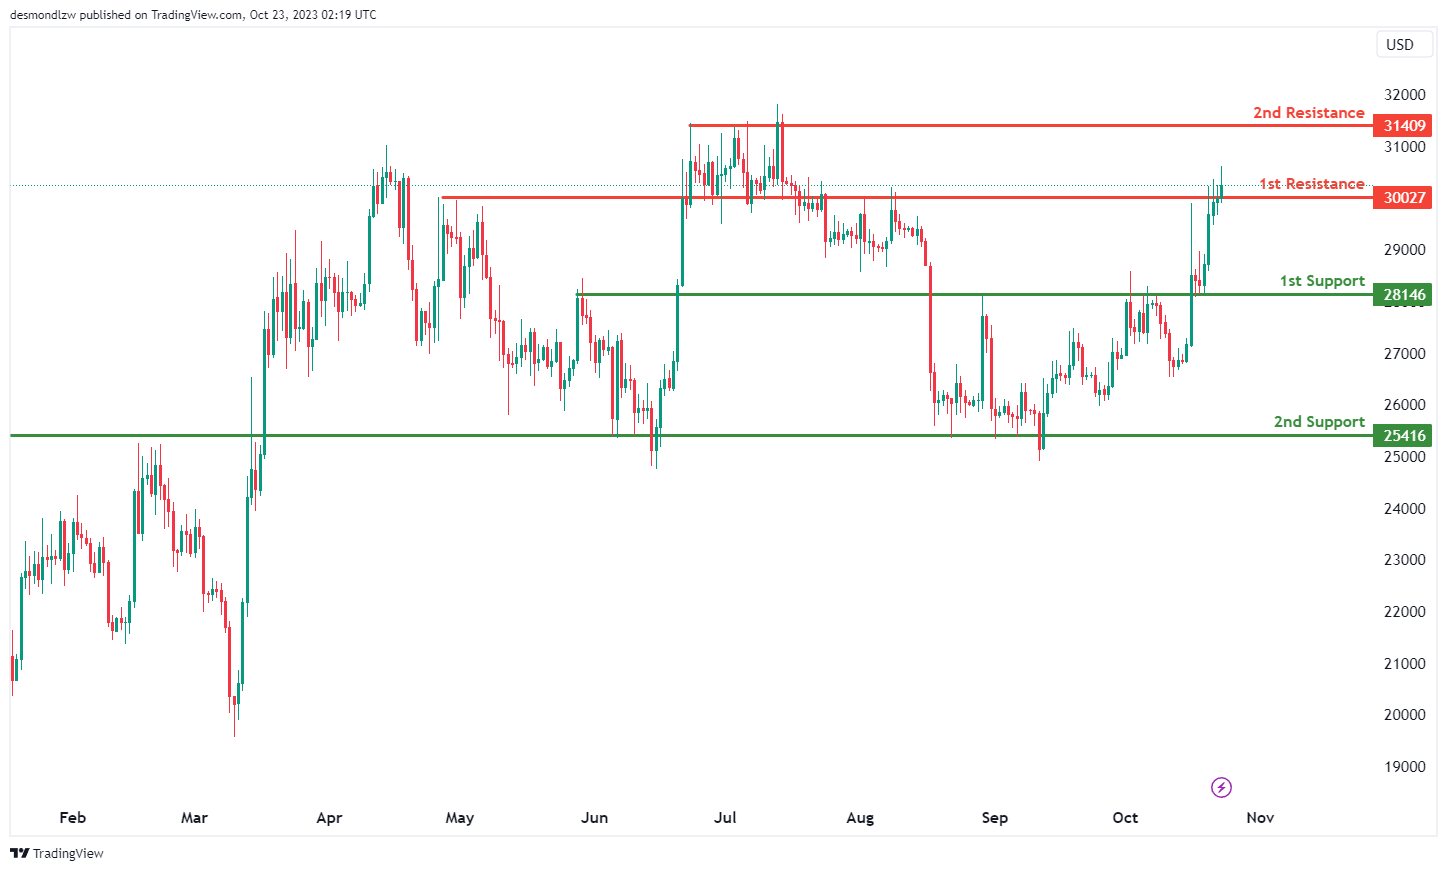
BTC/USD:
The instrument we are examining is BTC/USD, and the overall momentum of the chart indicates a bullish trend.
There is a possibility that the price may experience a bullish break through the first resistance level and then rise to the second resistance level.
The first support level is at 28,146, and it’s considered strong because it represents a pullback support.
The second support level is at 25,416, and it’s also significant as it marks an overlap of support.
On the resistance side, the first resistance level is at 30,027, and it’s noteworthy because it represents an overlap of resistance.
The second resistance level is at 31,409, and it’s significant as well, as it functions as a multi-swing high resistance.
ETH/USD:
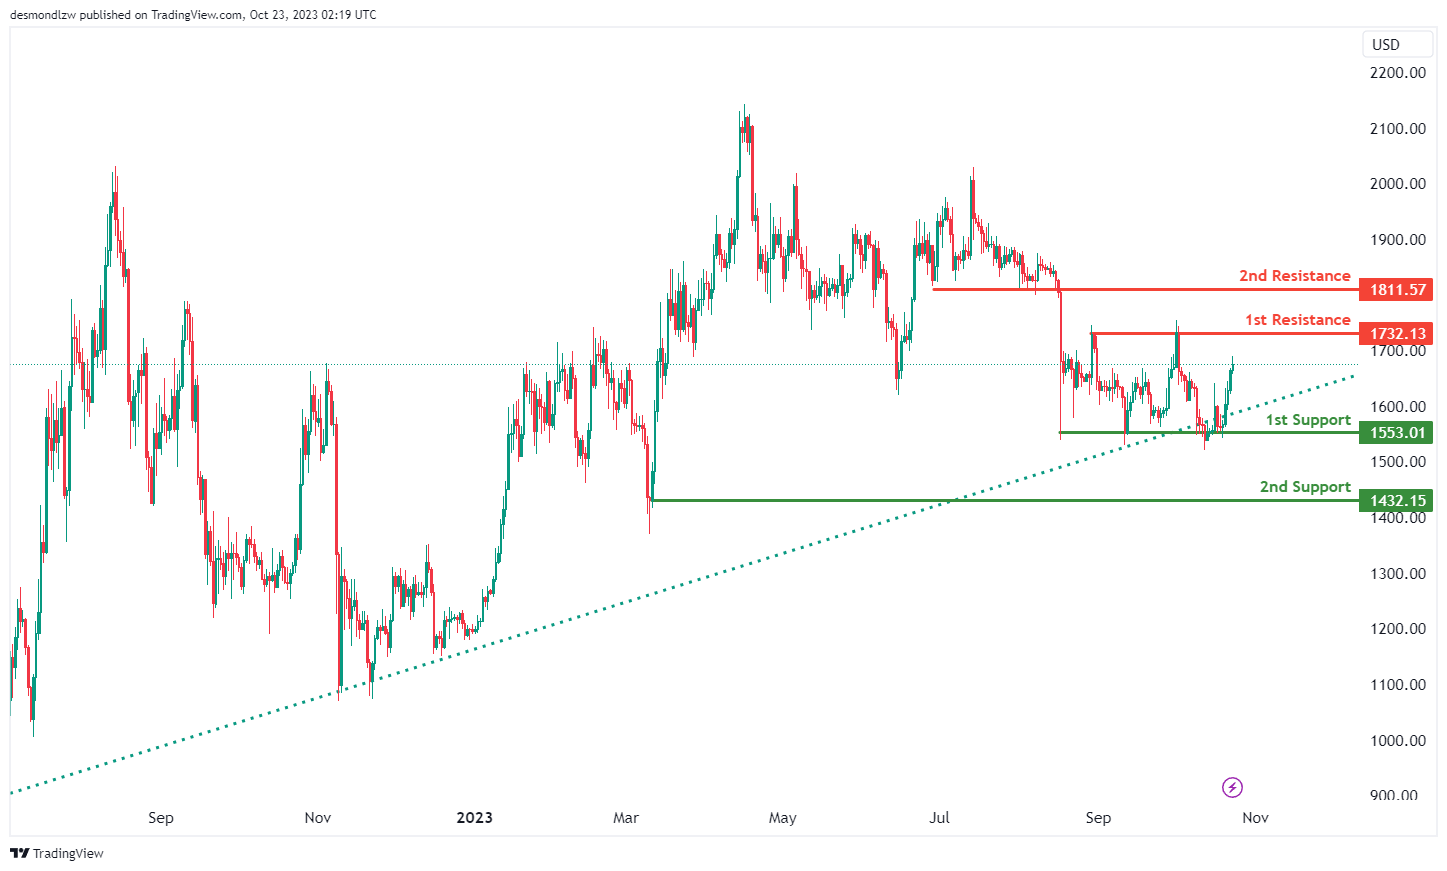
The instrument we are analyzing is ETH/USD, and the overall momentum of the chart is bullish. This momentum is attributed to the fact that the price is above a major ascending trend line, suggesting that further bullish momentum is likely.
There is a possibility that the price may experience a bullish break through the first resistance level and then rise to the second resistance level.
The first support level is at 1,553.01, and it’s considered strong because it represents a multi-swing low support.
The second support level is at 1,432.15, and it’s also significant as it marks a swing low support.
On the resistance side, the first resistance level is at 1,732.13, and it’s noteworthy because it represents a multi-swing high resistance.
The second resistance level is at 1,811.57, and it’s significant as well, as it functions as a pullback resistance.
WTI/USD:
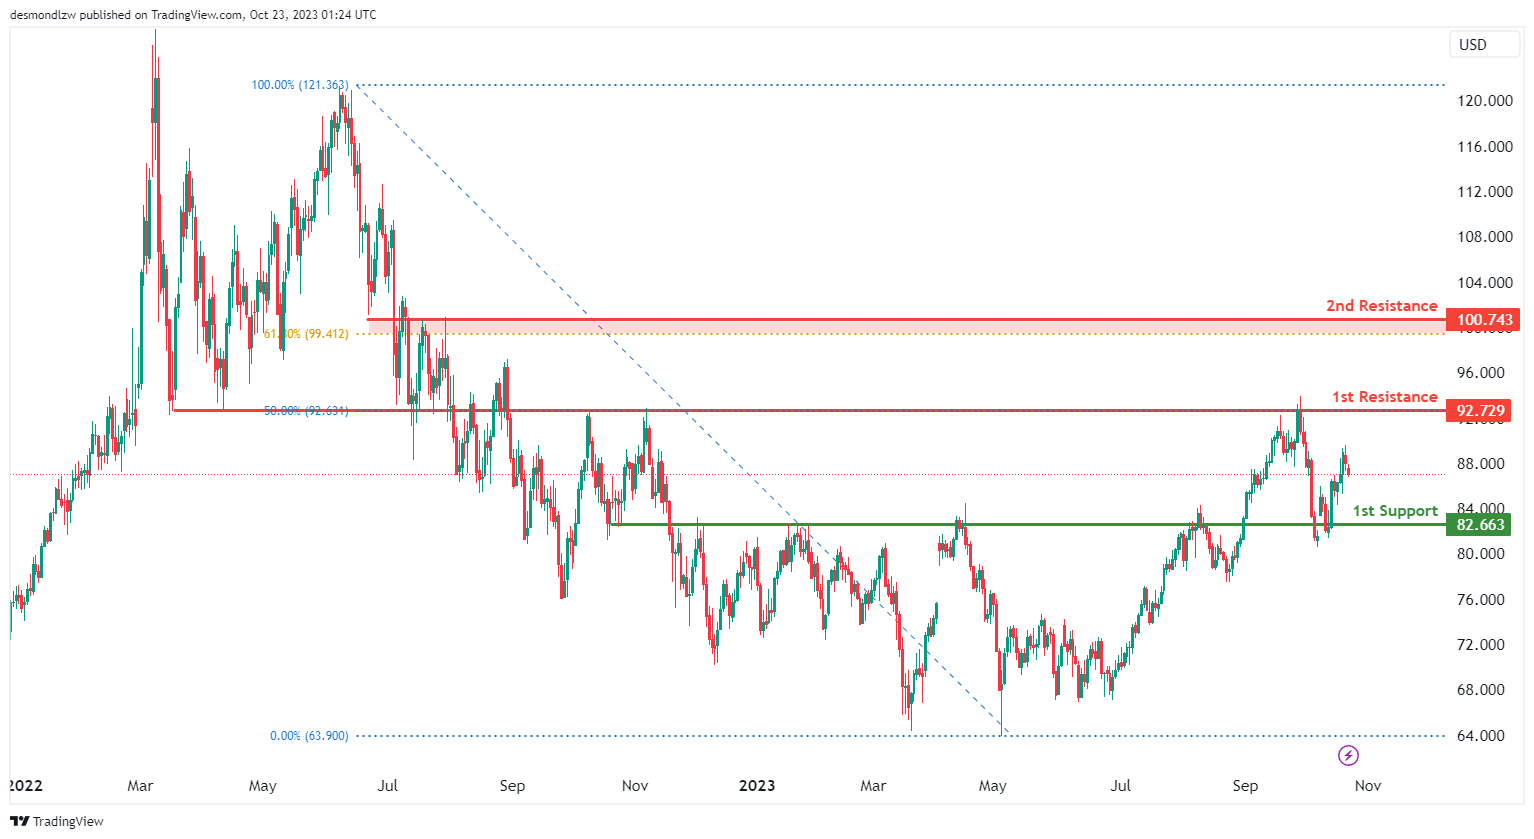
The WTI chart currently shows a bearish momentum, indicating a potential scenario for price to make a bearish continuation towards the 1st support level.
The 1st support level at 82.66 is identified as a major overlap support level, indicating a potential support zone.
To the upside, the 1st resistance level at 92.73 is identified as an overlap resistance that aligns with the 50.00% Fibonacci retracement level. Beyond this, the 2nd resistance level at 100.74 is also marked as an overlap resistance, making it a potentially strong resistance level.
XAU/USD (GOLD):
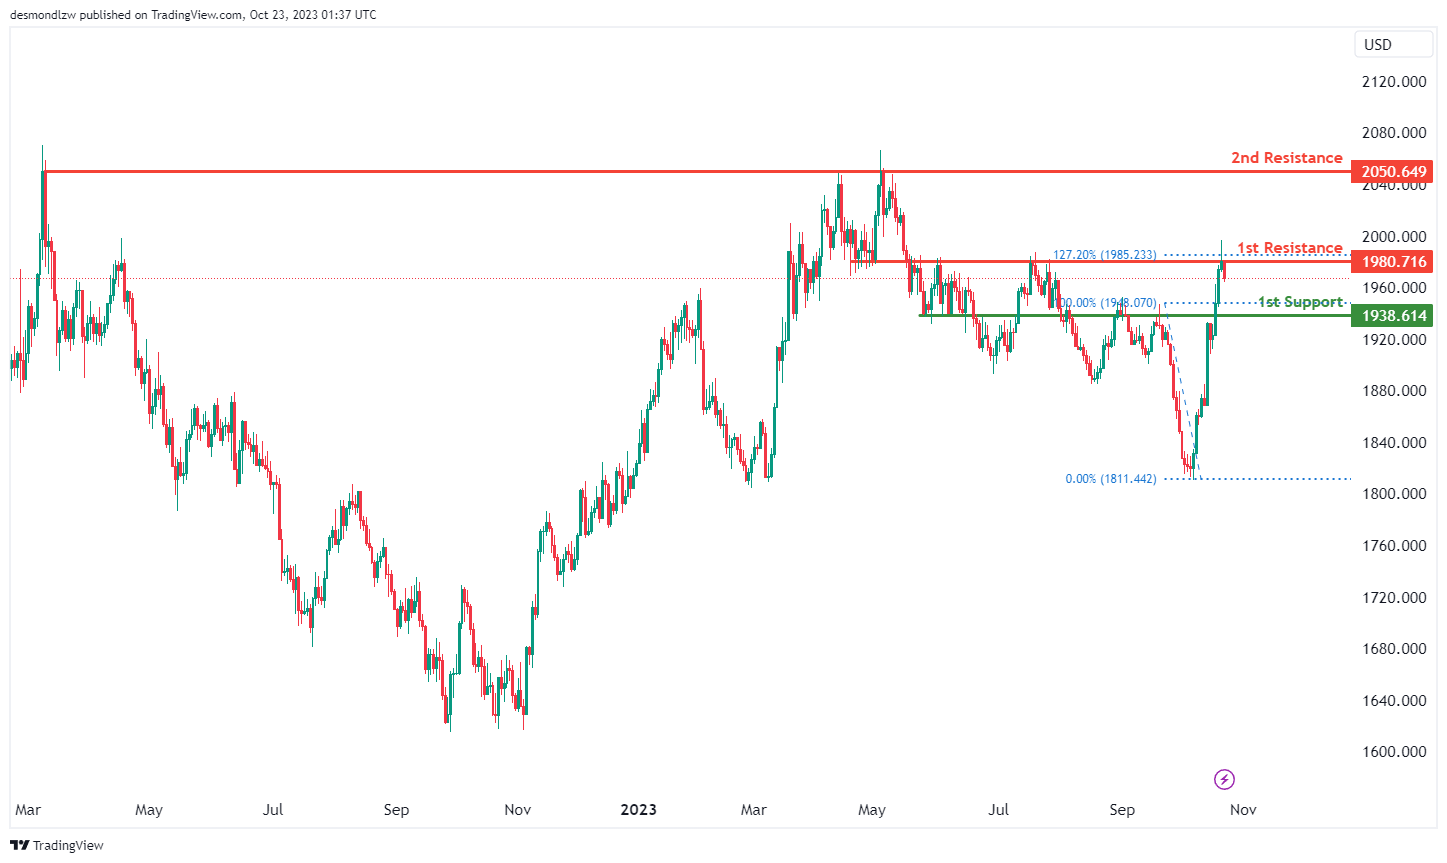
The XAU/USD chart currently shows a bearish overall momentum, and there is a potential scenario for a bearish continuation towards the 1st support level.
The 1st support at 1938.61 is considered significant as it aligns with a pullback support level.
On the resistance side, the 1st resistance at 1980.00 is characterized as an overlap resistance level, and beyond this, the 2nd resistance at 2050.64 is identified as a multi-swing high resistance level.
Gold, Crude Oil Ease But Upside Risks Prevail
Risk sentiment is improved compared to Friday as tensions in the Middle East didn’t escalate as much as feared during the weekend. Hamas released two hostages and humanitarian aid started to enter Gaza from the Egyptian border. But tensions remain extremely high and risk of serious escalation prevails as Israel stepped up air raids in Gaza and Hezbollah could drag Lebanon into war, and spread tensions through the region.
The market has been reacting to the news mainly by seeking safety in gold. Gold spiked to $1997 per ounce on Friday on fears that tensions would further escalate in the Middle East. As the weekend news was somehow better, gold eased to $1964 on Monday morning. Upside prevails. The next wave of haven flows will likely push the yellow metal above the $2000 mark. Above that level, we enter a little-known region. The price of an ounce reached $2075 in August 2020, tested $2070 in March 2022 at the wake of the beginning of the Ukrainian war, and the yellow metal traded at $2081 in May, this year. The war in Gaza throws the foundation for a fresh attempt to a new high above $2080. Note, however, that as soon as tensions in the Middle East stabilize – I don’t say ease because there is a chance that we won’t see peace return to the region in the close future - gold will come under a decent selling pressure as the US 10-year yield flirts with the 5% level, as the US 30-year paper now yields above 5%. The opportunity cost of holding the non-interest bearing gold has significantly increased since the start of the war in Gaza as the negative correlation between the US yields and gold clearly broke, and turned positive. Interestingly the rising tensions didn’t benefit the US treasuries this time. The chances are that, when it will be time for investors to start de-pricing the Gaza war, gold will feel like someone has pulled the rug from under its feet. But when that will happen is the million-dollar question.
In the market
The US dollar index has been stagnating since its October 3rd peak. Strong economic data, and Federal Reserve (Fed) officials’ determination to keep interest rates high for long stopped feeding into the US dollar.
Due this week, the US GDP growth is expected to double from 2.1% to 4.2% for Q3. That’s the fastest pace since the Fed started raising rates. Atlanta Fed’s GDPNow model estimate for real GDP growth (at a seasonally adjusted annual rate) in Q3 of 2023 points at 5.4% despite more than 500bp hike since 1.5-year which didn’t bring the US economy close to a recession.
The US dollar’s reluctance faced with such a rapid rise in the yields is astonishing.
The EURUSD tested the 1.06 offers last week, despite weakening European Central Bank (ECB) expectations. The ECB is expected to hold its rates steady when it meets this week, after a 450bp hike since last July. Christine Lagarde will unlikely call the end of policy tightening at the ECB. She will probably remain cautiously optimistic that the ECB is also approaching the end of the tunnel, but that they must remain careful especially now that the boiling Middle East threatens to aggravate the energy crisis into another winter with limited energy supply due to the Ukrainian war.
Speaking of energy, the barrel of US crude traded past the $91pb level on Friday but smashed back below the $88pb this morning as tensions in the Middle East remained softer than what investors feared into the weekend. But upside risks prevail.
In equities, the S&P500 closed last week more than 2.5% lower and below its 200-DMA on the back of limited risk appetite due to geopolitical tensions. Nasdaq also fell below its past year’s ascending base. Sentiment is morose, but a big wave of earnings could help equity investors price out the war news. Amazon, Microsoft, Meta, Intel, Exxon Mobil and Chevron are among companies that will report earnings throughout this week.
Geopolitics in the Driver’s Seat ahead of PMIs and ECB
Market movers today
The week kicks off in a quiet fashion in terms of data, so focus will remain on geopolitics and the next developments in the war between Israel and Hamas.
Tomorrow we will get October flash PMIs from the euro area, UK and the US, which are widely expected to show that economic activity continues to slow down. Another release of interest tomorrow will be the ECB bank lending survey ahead of Thursday's ECB meeting.
This week's main event will the ECB meeting on Thursday where we and the markets widely expect the Governing Council to keep rates on hold. Also see our ECB Preview - Keeping a tightening bias with optionality, 17 October.
Central Bank of Turkey will also meet on Thursday, and there consensus expects another 500bp hike which would bring the policy rate to 35%.
On Thursday, we get Q3 GDP data from the US and the week is rounded off with the University of Michigan survey on Friday.
The 60 second overview
Markets: Risk-off sentiment has been weighing on equity markets in the US and Europe. The S&P 500 Index saw its largest weekly decline in a month, influenced by geopolitical tensions, stern remarks from Federal Reserve officials, and a surge in long-term bond yields, reaching 16-year highs. This period also witnessed growth stocks underperforming compared to their value counterparts. The 10-year U.S. Treasury yield approached 5%, its highest level since 2007. Germany's 10-year government bond yield neared 2.9%. Italian bond yields also rose, pushing the yield differential between German and Italian 10-year debt above 200 basis points. Oil and gold both fell on softening fears of escalation in the Middle East. USD/JPY briefly breached the 150 mark - a possible intervention level by Japanese authorities. EUR/CHF hit new all-time lows, just above the 0.94 mark. This morning, Asian markets are mostly down. Equity futures point to a flat opening in Europe and slightly positive in the US.
Middle East conflict: Hamas released two US hostages and aid started entering Gaza through Egypt's border. However, Israel has increased air attacks on Gaza in anticipation of the next stage of the conflict with Hamas. Israel also cautioned that Hezbollah could potentially involve Lebanon in a broader regional warfare.
Japan: Although Japan's inflation rate slowed in September, with the core consumer price index increasing by 2.8% y/y (down from 3.1% in August), it remains above the Bank of Japan's 2% target for the 18th consecutive month. The BoJ is expected to raise its inflation forecasts at the 31 October meeting, where further tweaks to the Yield Curve Control could be on the cards. The primary focus now lies on wage growth, as higher pay demands for the next year could signify evolving wage-setting behaviour and growing confidence in the BoJ's progress toward its target. The Japanese Trade Union Confederation (Rengo) plans to demand at least a 5% wage increase during the 2024 "shunto" spring wage negotiations, and the BoJ sees sustained wage growth as a critical factor in achieving its inflation target.
Equities: Risk-off sentiment continued across regions and sectors on Friday. Global equities were down a little more than 2% last week with cyclical growth underperforming. Friday was characterised by rather classic defensive rotation in equities but also more classic risk-off across asset classes and high-grade bond yields moving lower. In the US, Dow -0.9%, S&P 500 -1.3%, Nasdaq -1.5% and Russell 2000 -1.3%. The negative sentiment from Europe and US on Friday has carried over to Asia this morning with indices lower across the region. European futures are flat this morning while US futures are marginally higher.
FI: 10Y US Treasuries are again testing 5% as yields are rising in Asian trading hours even though there was a modest decline on Friday. Furthermore, the 2-10Y US curve continues to bear-steepen and is now at just -15bp relative to -80bp in September. We have seen the same movement in the 2-10Y German yield curve.
FX: EUR/USD ended last week higher, just below the 1.06 mark. USD/JPY is still hovering slightly below 150. EUR/GBP reached its highest level since May during Friday's session and is now trading above 0.87. EUR/CHF hit new all-time lows, just above the 0.94 mark. Poor risk sentiment caused EUR/SEK to fluctuate around the 11.60 mark, while EUR/NOK broke 11.70 for the first time since July.
Credit: The credit markets ended last week on a relatively worried note. During Friday, iTraxx Main continued to widen (+2.5bp) to 89.5bp while iTraxx Crossover widened (+10.6) bp to 472.5bp. The negative development in the CDS market for the week (+3.8 and +18.8 bp) was also visible in the cash bond market, where secondary bond trading experienced a lower-than-normal activity level. Primary markets remained inactive most of the week as the ongoing Q3 earning season progresses.
China’s market woes weigh on Copper and Aussie
Chinese Shanghai SSE Composite continue its descent below the psychological 3000 handle today, Copper has been dragged along in the downward spiral. The string of arrests and the investigation, over the weekend, into Foxconn Technology Group , Apple Inc.'s primary collaborator and one of China's largest employers, have further dampened foreign investors' confidence in the Chinese market.
Interestingly, this pessimistic trend emerged against the backdrop of optimistic economic data. Last week's releases paint a rather favorable economic portrait for China, boasting GDP growth in Q3 that exceeded expectations, accompanied by robust performances in retail sales and industrial production for September. However, these optimistic numbers have not translated into positive momentum for the SSE, which plummeted by -2.89% over the week, underscoring a pervasive bearish sentiment.
Copper, not immune to these developments, now teeters precariously, with its immediate future hanging in the balance. The metal's price is homing in on last week's low at 3.5129. Decisive break of this support could unleash a torrent of selling pressure, igniting resumption of the downtrend from 4.3556. Under this scenario, the next stop for Copper would be 100% projection of 4.3556 to 3.5387 from 4.0145 at 3.1976, which is close to 3.1314 support (2022 low).
The trajectory of copper is closely entwined with that of AUD/USD, and a continued selloff in the former, spurred by dimming optimism about China, could unleash a cascade of selling pressure on the currency pair. Break of this month's low at 0.6284 will resume AUD/USD's down trend from 0.7156 to 100% projection of 0.7156 to 0.6457 from 0.6894 at 0.6195, which is close to 0.6169 support (2022 low).
EUR/USD Could Recover, Bitcoin Price Clears $30K
Key Highlights
- EUR/USD is attempting a recovery wave above the 1.0550 resistance.
- A key contracting triangle is forming with resistance near 1.0600 on the 4-hour chart.
- Gold prices are correcting gains after rising toward $2,000.
- Bitcoin price started a steady increase and cleared the $30,000 resistance.
EUR/USD Technical Analysis
The Euro managed to stay above the 1.0450 level against the US dollar. EUR/USD started a short-term recovery wave and climbed above 1.0520.
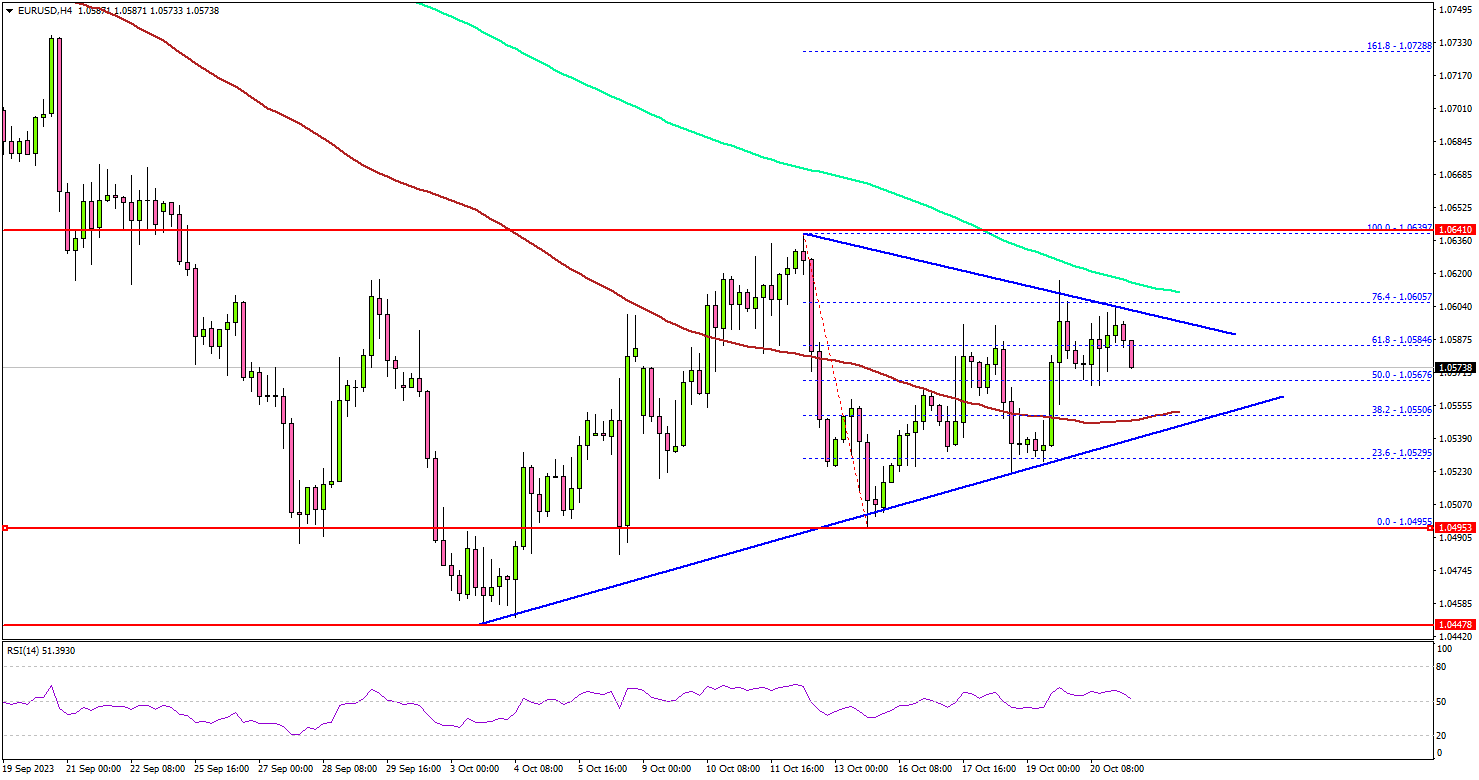
Looking at the 4-hour chart, the pair managed to surpass the 1.0550 resistance zone and the 100 simple moving average (red, 4 hours). However, the pair is now struggling to rise above the 1.0600 resistance and the 200 simple moving average (green, 4 hours).
There is also a key contracting triangle forming with resistance near 1.0600 on the same chart. If there is a move above the triangle resistance, the pair could rise toward 1.0640 resistance.
A close above the 1.0640 level is needed to start a steady increase. The next key resistance is near 1.0700, above which the pair could rise toward the 1.0780 level.
If there is a fresh decline, the pair might find bids near 1.0565. The next key support is seen near the 1.0550 level, below which it could test 1.0500. Any more losses might send the pair toward the 1.0450 level.
Looking at bitcoin, there was a steady increase, and the bulls were able to pump the price above the $29,200 and $30,000 resistance levels.
Economic Releases
- Euro Zone Consumer Confidence for Oct 2023 (Preliminary) – Forecast -18.2, versus -17.8 previous.
Bitcoin firms its grip on 30k handle, yet a warm summer remains uncertain
Bitcoin, in today's subdued Asian trading session, has shown promising signs of firmly grasping 30k level finally. Last week, the digital currency experienced a brief yet sharp ascent, triggered by a false report of the SEC approving a Bitcoin spot ETF. Although this ascent was short-lived, the subsequent pullback was moderate, underscoring the resilience of the ongoing rally.
Expectations surrounding the approval of a Bitcoin spot ETF continue to percolate through the crypto community. Most analysts harbor hopes for a green light sometime in 2023. The ephemeral spike in Bitcoin's value last week underscores the market's sensitivity to such developments, suggesting that potential approval is not yet fully accounted for in current prices. This dynamic could lead to heightened responsiveness to positive news, refocusing investor attention on cryptocurrencies ahead of the much-anticipated "halving" slated for April next year.
On the technical front, bullish sentiment in the near term is likely to prevail as long as 28071 support level remains intact, with eyes set on retesting 31815 high.
More comprehensive insights emerge when viewing the broader picture: robust support from 55 W EMA (now at 27115) coupled with 38.2% retracement of 15452 to 31815 at 25564 augments the bullish narrative.
Nevertheless, the real test lies ahead. For market enthusiasts to be convinced that Bitcoin's "summer" is in full swing, a significant hurdle awaits. The cryptocurrency will need to convincingly break through long-term Fibonacci resistance at 38.2% retracement of 68986 to 15452 at 35901.
EURNZD Wave Analysis
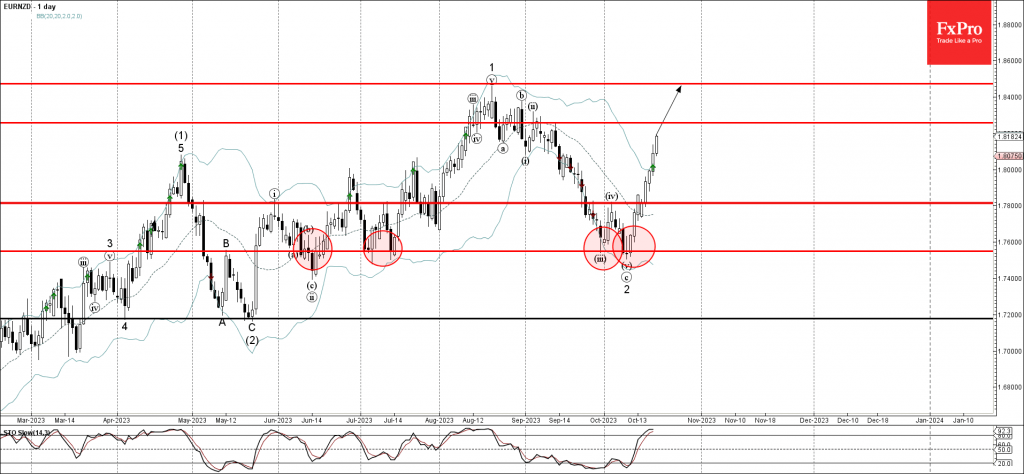
- EURNZD rising inside sharp impulse wave 3
- Likely to test resistance level 1.8260
EURNZD currency pair rising inside the sharp upward impulse wave 3, which previously broke the key resistance level 1.7800 (top of the previous minor correction iv, can be seen below).
The breakout of the resistance level 11.7800 accelerated the active impulse wave 3 of the intermediate impulse wave (3) from May.
Given the clear daily uptrend and the bullish EUR sentiment see across the FX markets today, EURNZD can be expected to rise further toward the next resistance level 1.8260, which reversed the pair twice at the start of September.
EURCHF Wave Analysis
- EURCHF reversed from support level 0.9420
- Likely to test resistance level 0.9530
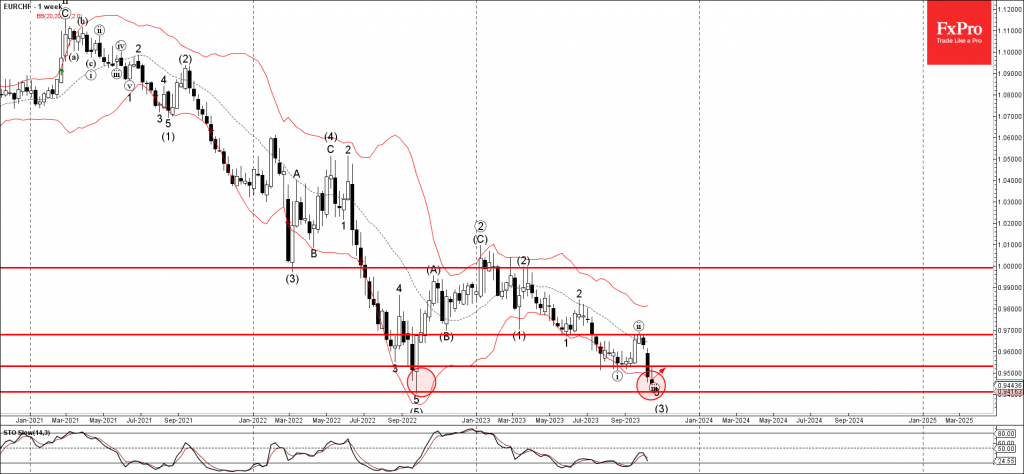
EURCHF currency pair recently reversed up from the major support level 0.9420 (which stopped the sharp weekly downtrend in 2022 as can be seen below).
The support level 0.9420 was further strengthened by the nearby lower weekly and the daily Bollinger Bands.
Given the bullish divergence on the weekly Stochastic, EURCHF can be expected to rise further toward the next resistance level 0.9530.