

Sample Category Title
Technical Outlook and Review
DXY:
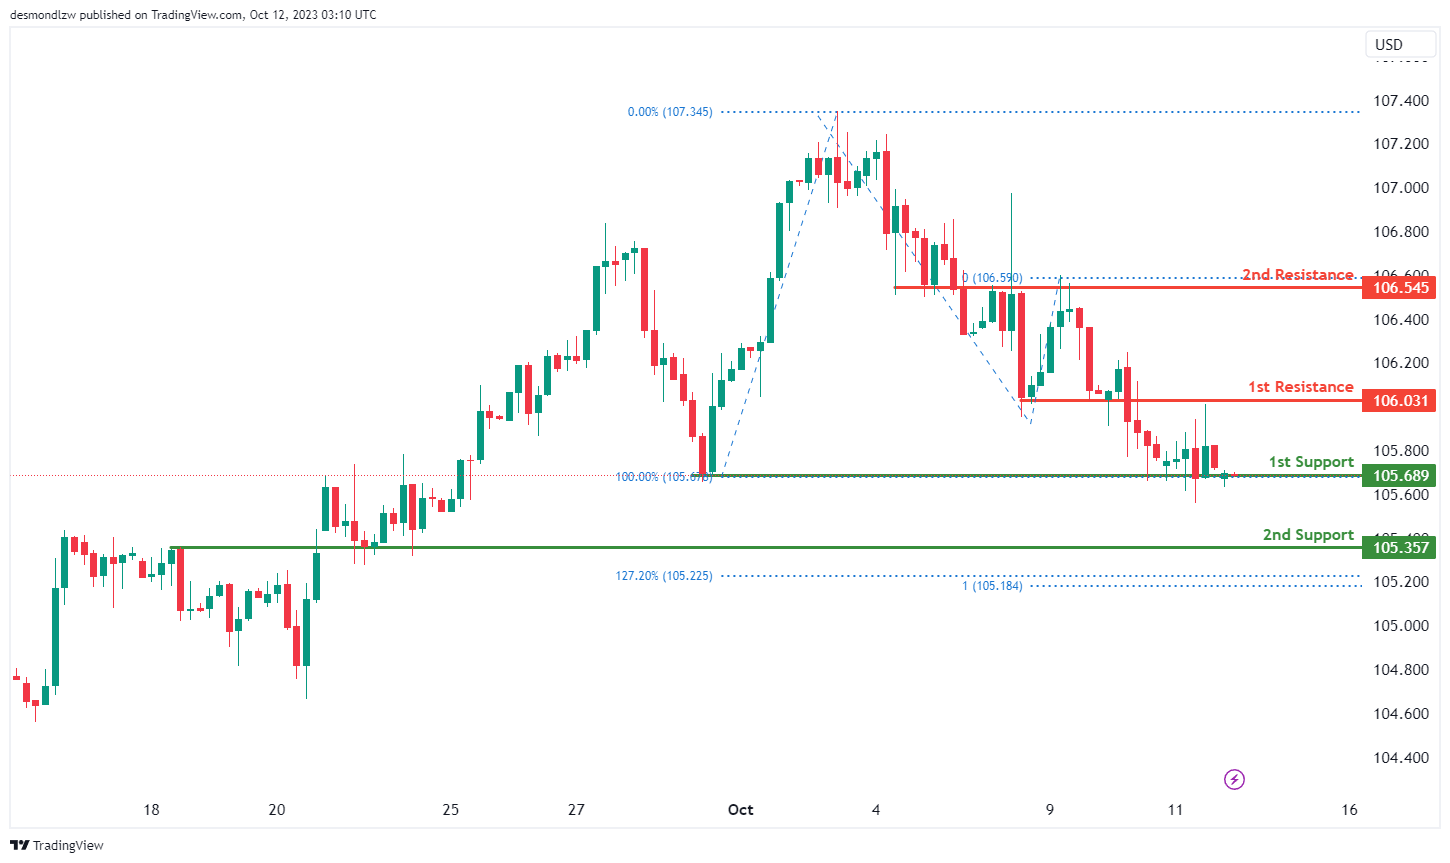
The DXY (US Dollar Index) chart currently exhibits bullish momentum, suggesting the potential scenario of a bullish bounce off the 1st support level with a subsequent move towards the 1st resistance.
The 1st support at 105.68 is considered significant as it is identified as a multi-swing low support, indicating a potential area where buying interest may emerge. Additionally, the 2nd support at 105.36 is characterized as an overlap support, further reinforcing its importance as a potential level for price rebounds.
On the resistance side, the 1st resistance level at 106.03 is identified as an overlap resistance, suggesting it could act as a strong barrier to upward price movement. Beyond this, the 2nd resistance at 106.54 is also characterized as an overlap resistance, adding to its significance as a potential area where selling pressure may emerge.
EUR/USD:
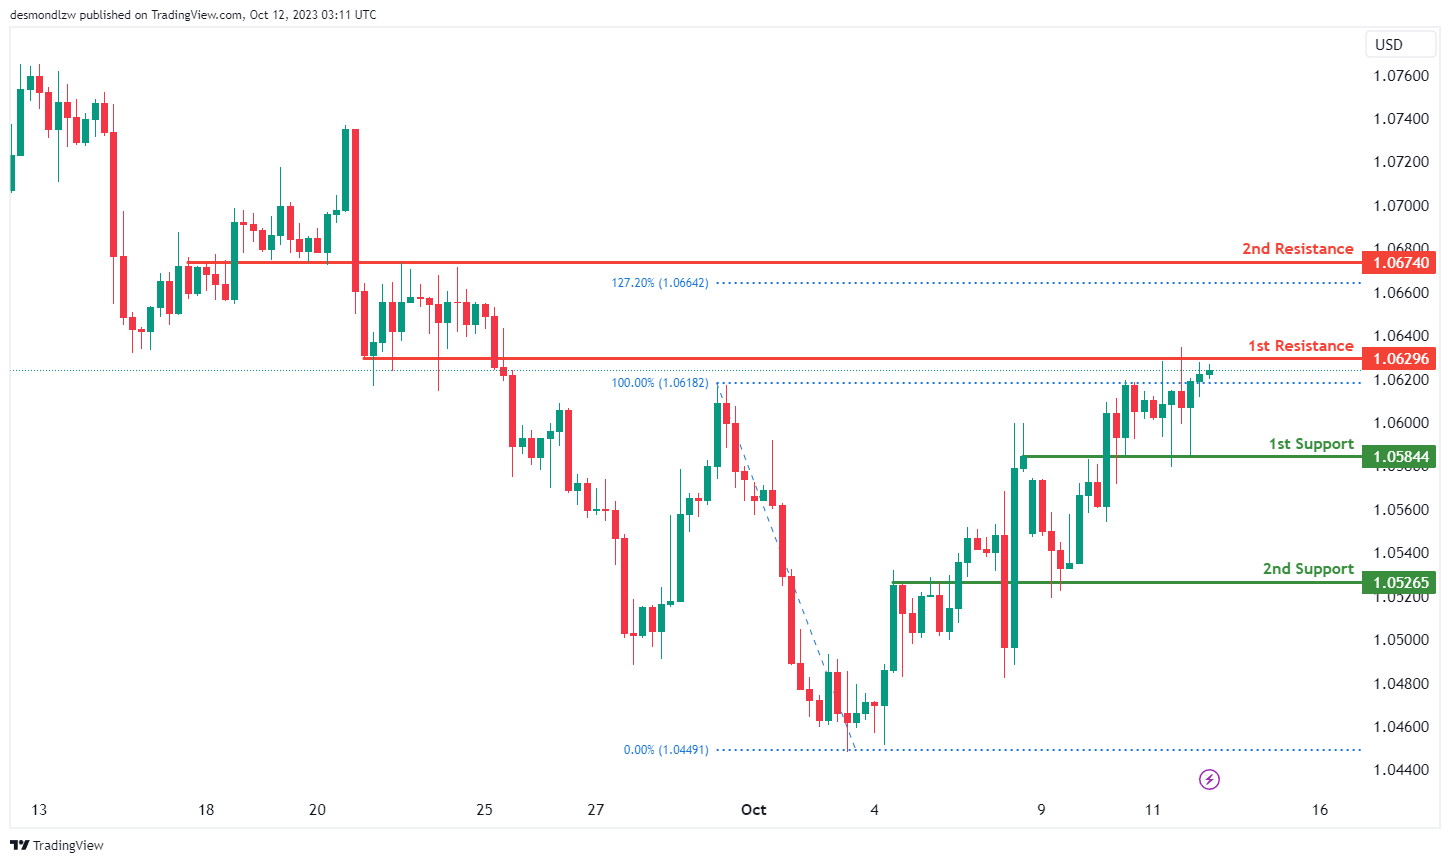
The EUR/USD chart currently shows a bearish momentum, indicating the potential scenario of a bearish reaction off the 1st resistance level, followed by a drop towards the 1st support.
The 1st support at 1.0584 is considered significant as it is identified as an overlap support, suggesting it may act as a level where buying interest could emerge. Additionally, the 2nd support at 1.0526 is also characterized as an overlap support, reinforcing its importance as a potential level for price rebounds.
On the resistance side, the 1st resistance level at 1.0629 is identified as an overlap resistance, indicating it could serve as a strong barrier to upward price movement. Beyond this, the 2nd resistance at 1.0674 is also characterized as an overlap resistance and coincides with the 127.20% Fibonacci Extension level, further adding to its significance as a potential area where selling pressure may emerge.
EUR/JPY:
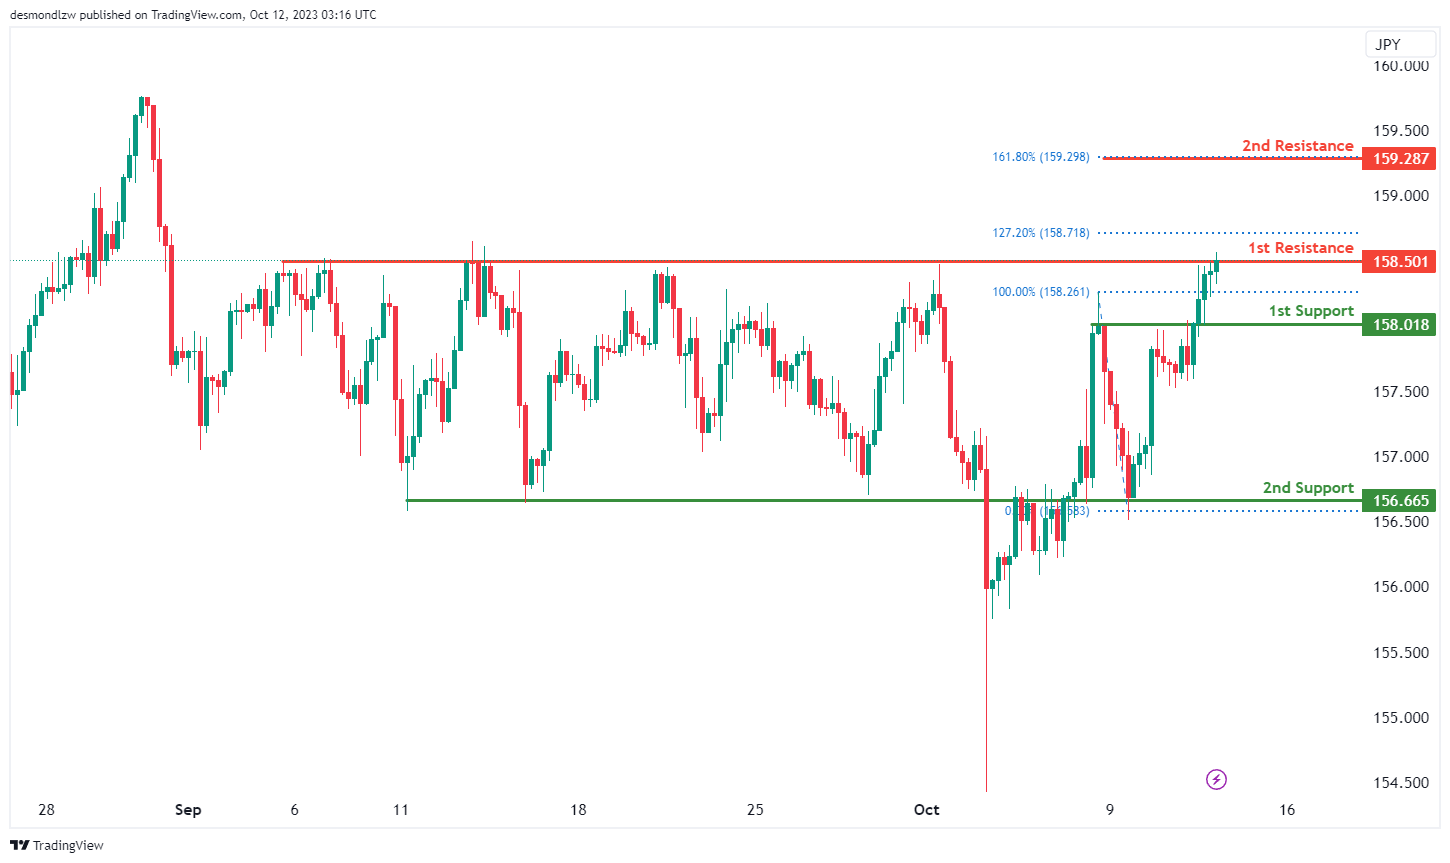
The EUR/JPY chart currently demonstrates a bearish momentum, suggesting a potential scenario of a bearish reaction off the 1st resistance level, followed by a drop towards the 1st support.
The 1st support at 158.01 is considered significant as it’s identified as an overlap support, indicating a potential area where buying interest could materialize. Additionally, the 2nd support at 156.66 is also characterized as an overlap support, reinforcing its importance as a potential level for price rebounds.
On the resistance side, the 1st resistance level at 158.50 is identified as a multi-swing high resistance, making it a robust level where selling pressure may intensify, leading to a bearish reaction. Beyond this, the 2nd resistance at 159.28 is associated with the 161.80% Fibonacci Retracement, adding to its significance as a potential area where selling pressure may emerge.
EUR/GBP:
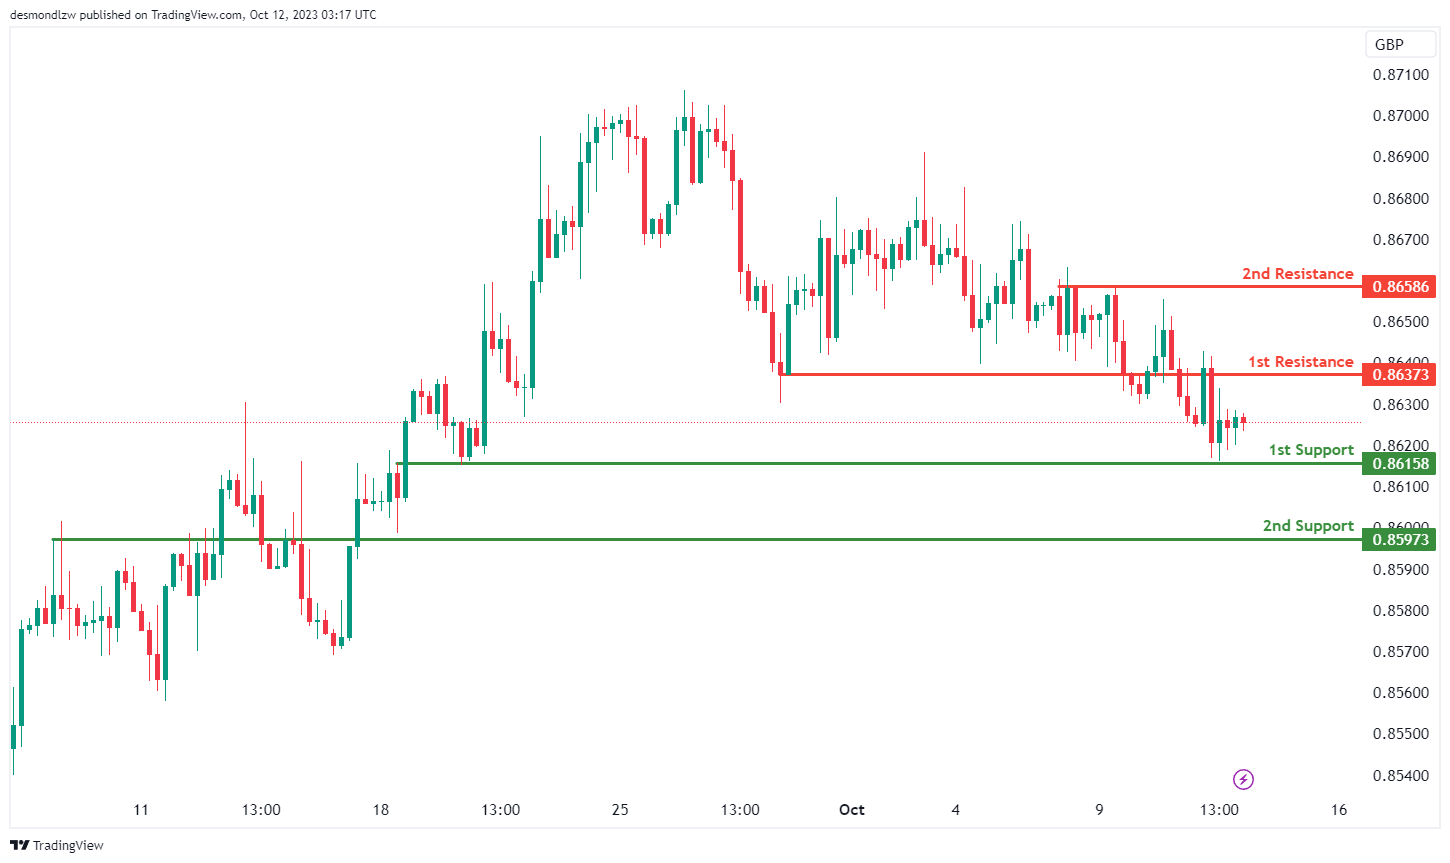
The EUR/GBP chart is currently exhibiting a neutral momentum, indicating the potential scenario of price fluctuating between the 1st resistance and the 1st support level.
The 1st support at 0.8615 is considered significant as it’s identified as an overlap support. This level may attract buying interest and act as a potential area for price bounce. Additionally, the 2nd support at 0.8597 is also characterized as an overlap support, reinforcing its importance as a level where price could find support.
On the resistance side, the 1st resistance level at 0.8637 is identified as an overlap resistance, indicating a zone where selling pressure may increase. Beyond this, the 2nd resistance at 0.8658 is associated with multi-swing high resistance, making it another key level where sellers may become more active.
GBP/USD:
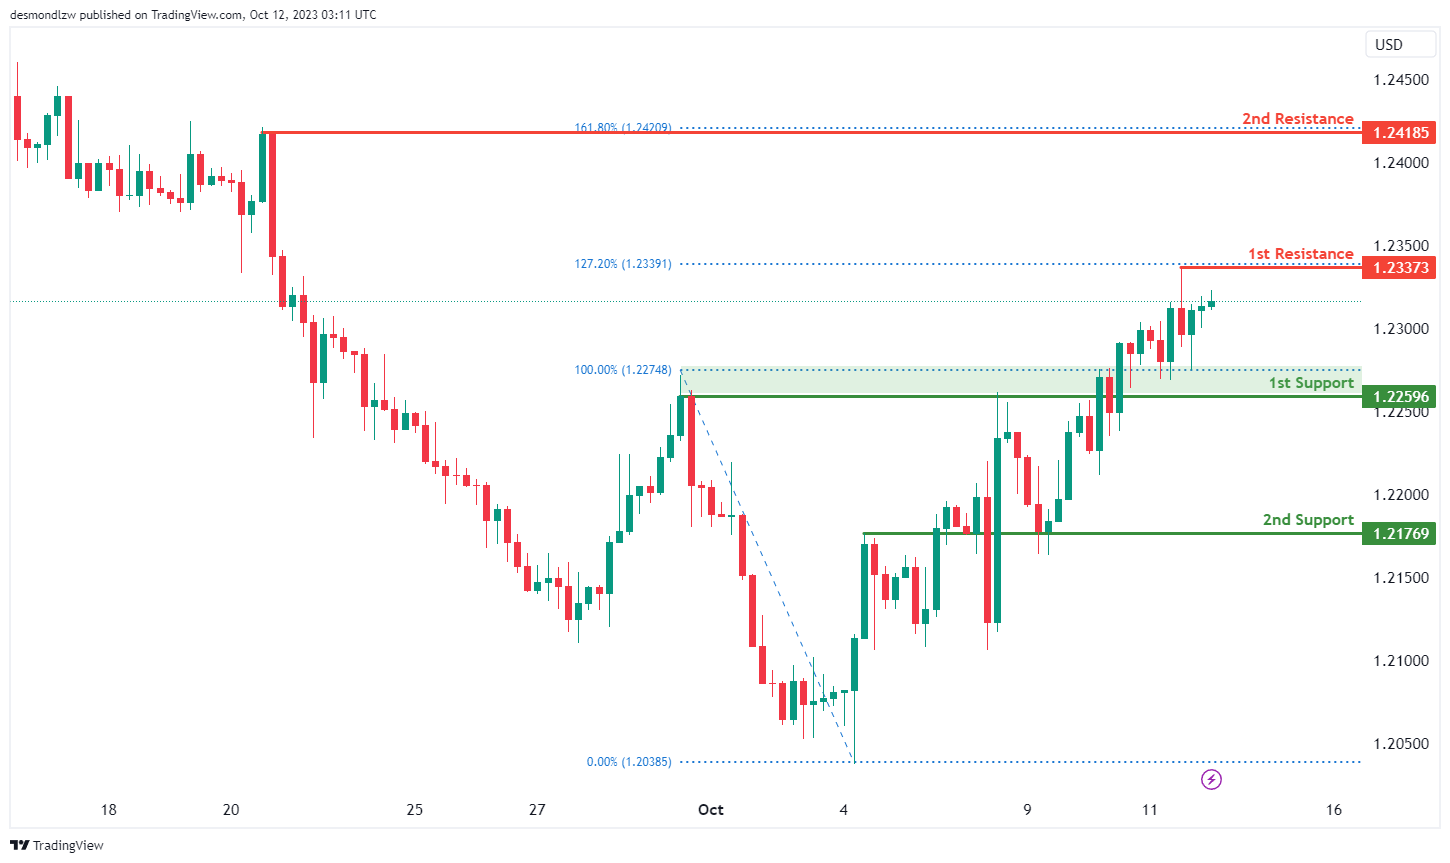
The GBP/USD chart currently exhibits bearish momentum, suggesting a potential scenario of a bearish reaction off the 1st resistance level, followed by a drop towards the 1st support.
The 1st support at 1.2259 is considered significant as it’s identified as an overlap support, indicating that it may act as a level where buying interest could emerge. Additionally, the 2nd support at 1.2176 is also characterized as an overlap support, reinforcing its importance as a potential level for price rebounds.
On the resistance side, the 1st resistance level at 1.2337 is identified as a swing high resistance, and it’s noteworthy for being located at the 127.20% Fibonacci Extension level, suggesting it could serve as a strong barrier to upward price movement. Beyond this, the 2nd resistance at 1.2418 is also characterized as a swing high resistance and is positioned at the 161.80% Fibonacci Extension level, further adding to its significance as a potential area where selling pressure may emerge.
GBP/JPY:
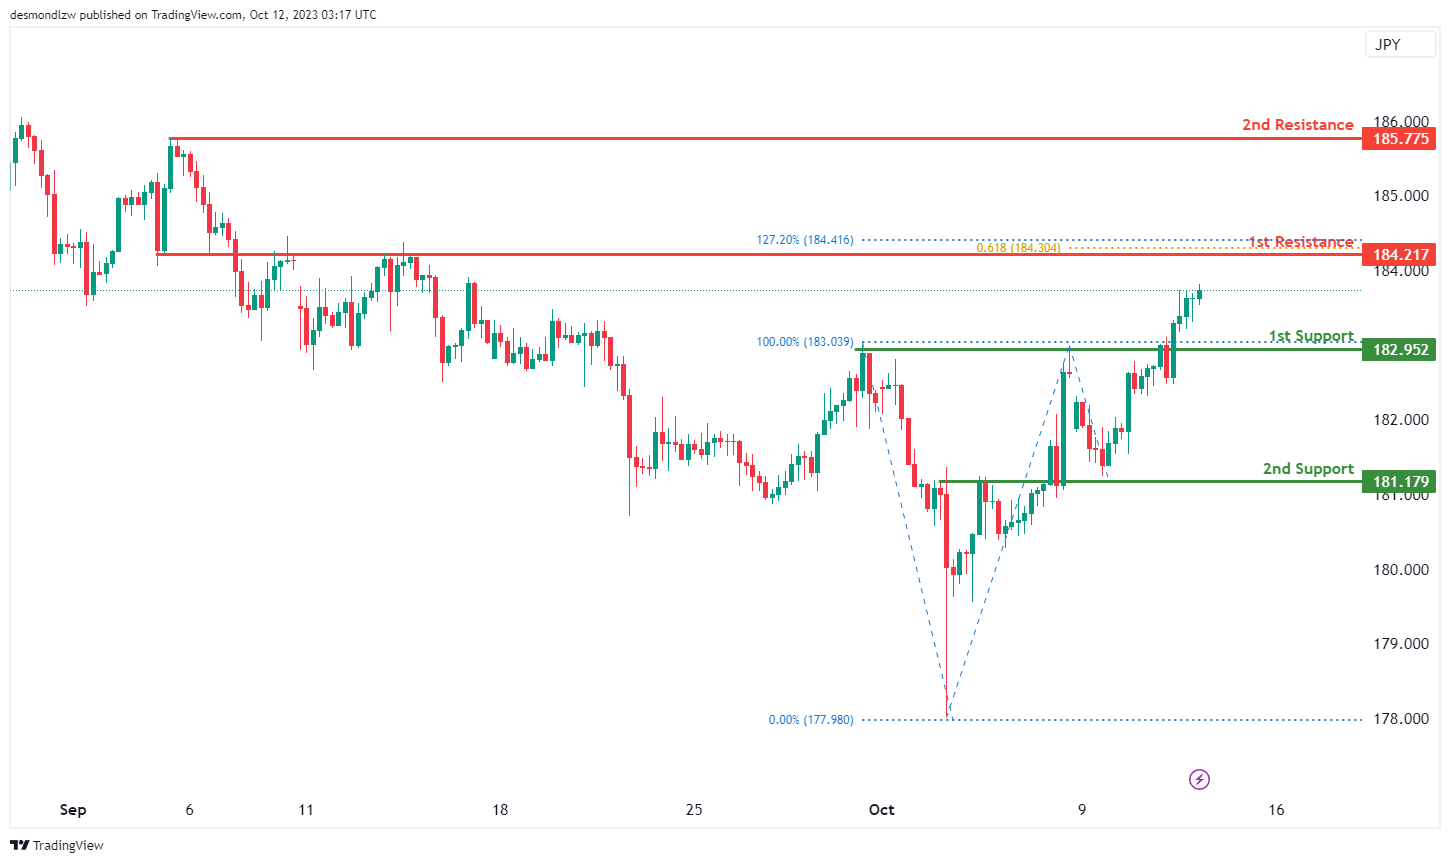
The GBP/JPY chart currently exhibits a bullish momentum, suggesting the potential scenario of a bullish continuation towards the 1st resistance.
The 1st support at 182.95 is considered significant as it’s identified as a pullback support level. This support area may attract buying interest and provide a potential bounce for the price. Additionally, the 2nd support at 181.17 is characterized as an overlap support, reinforcing its importance as a level where price could find support.
On the resistance side, the 1st resistance level at 194.21 is identified as an overlap resistance, indicating a zone where selling pressure may increase. This level also coincides with both the 127.20% Fibonacci Extension and the 61.80% Fibonacci Projection, signifying a potential Fibonacci confluence zone, which could make it a strong resistance area. Beyond this, the 2nd resistance at 185.77 is associated with swing high resistance.
USD/CHF:
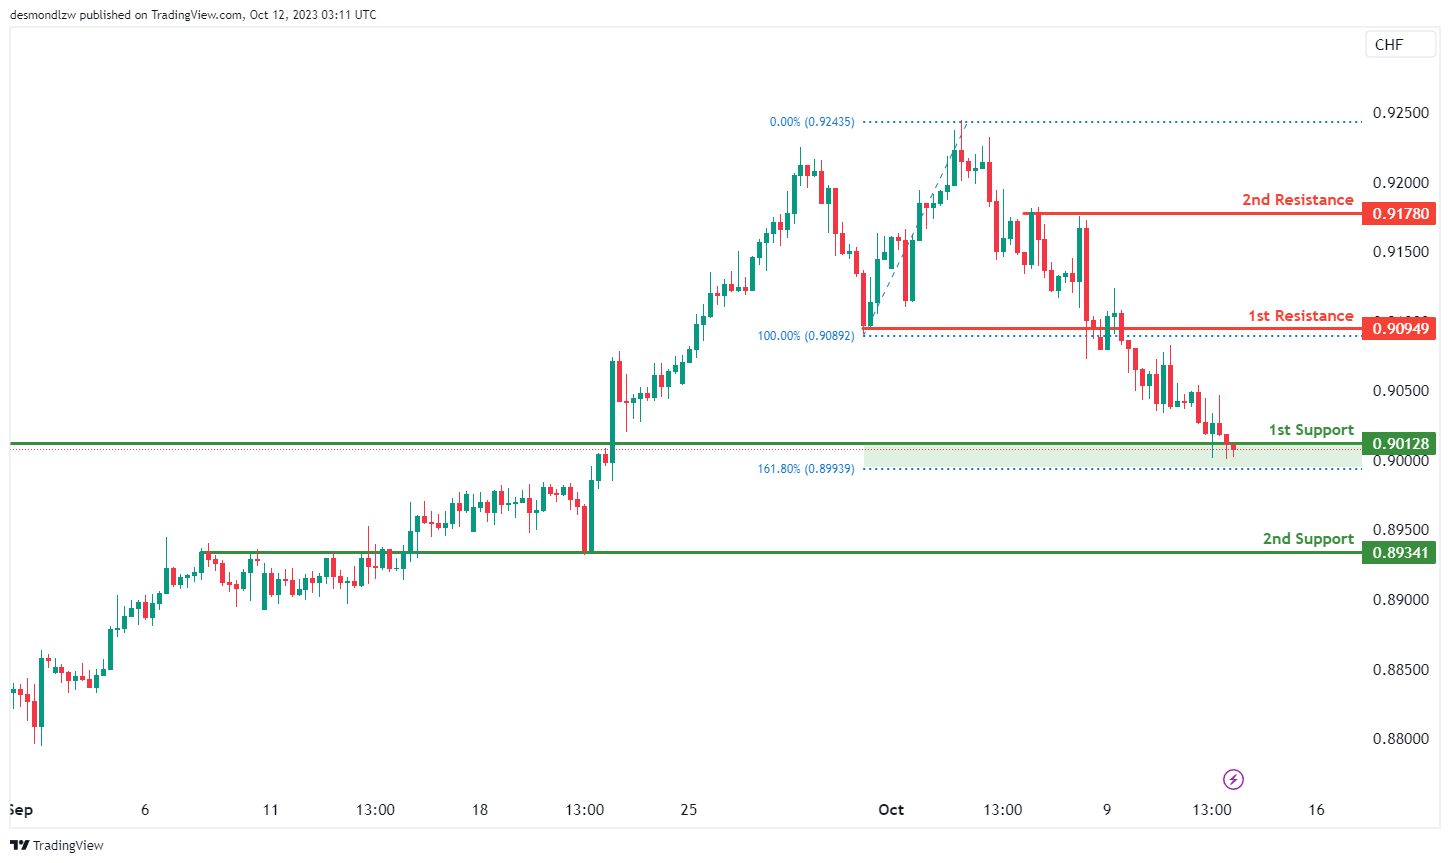
The USD/CHF chart currently exhibits bullish momentum, suggesting a potential scenario of a bullish bounce off the 1st support level, followed by a move towards the 1st resistance.
The 1st support at 0.9012 is considered significant as it’s identified as a pullback support, and it coincides with the 161.80% Fibonacci Extension level. This suggests that it may act as a strong level of support where buying interest could emerge. Additionally, the 2nd support at 0.8934 is characterized as an overlap support, reinforcing its importance as a potential level for price rebounds.
On the resistance side, the 1st resistance level at 0.9094 is identified as an overlap resistance, indicating that it may serve as a barrier to upward price movement. Beyond this, the 2nd resistance at 0.9178 is characterized as a multi-swing high resistance, further adding to its significance as a potential area where selling pressure may emerge.
USD/JPY:
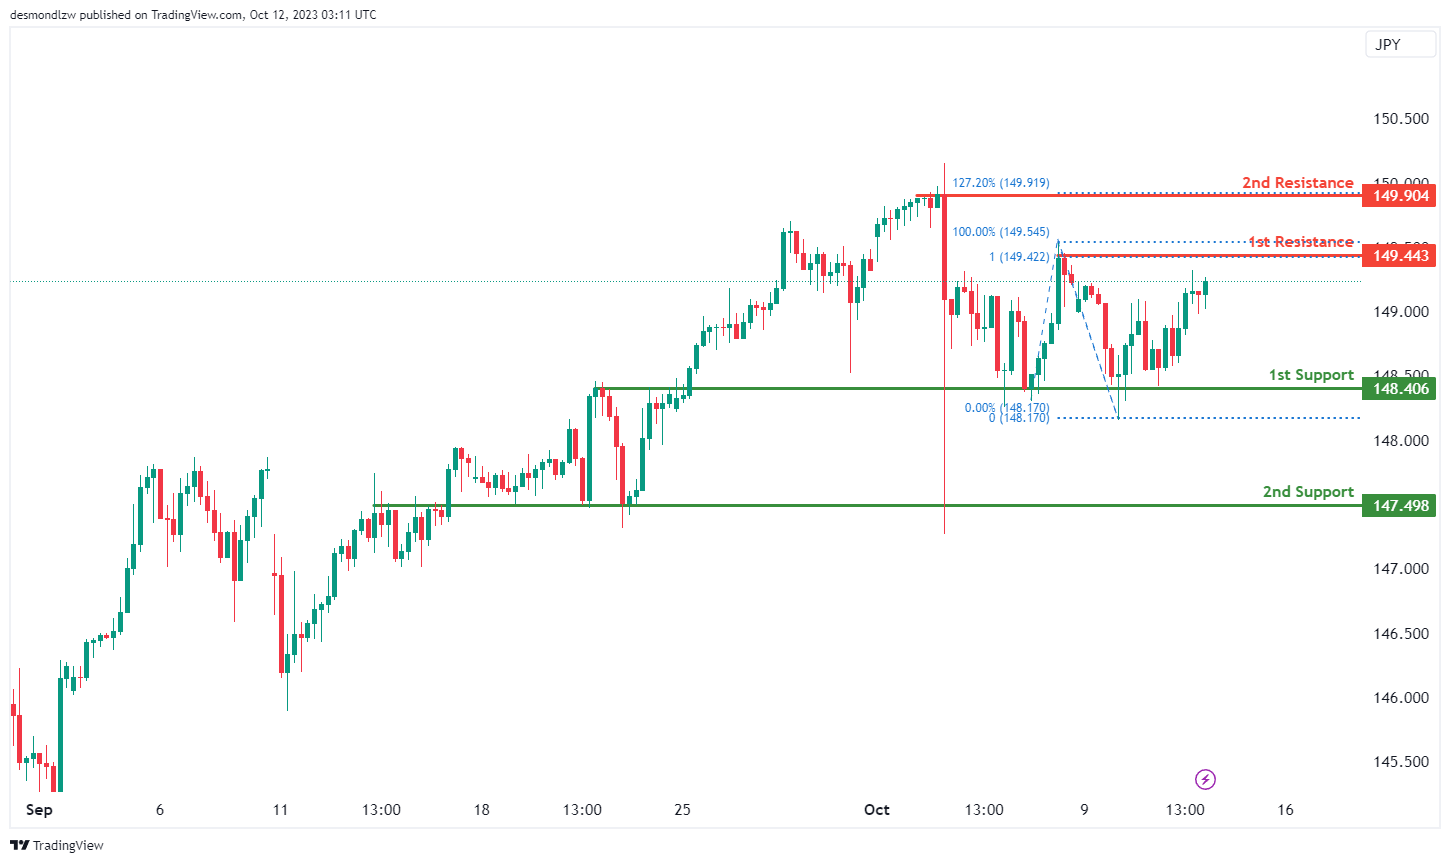
The USD/JPY chart currently exhibits bearish momentum, suggesting a potential scenario of a bearish reaction off the 1st resistance level, followed by a drop towards the 1st support.
The 1st support at 148.40 is considered significant as it’s identified as an overlap support, potentially acting as a strong level where buying interest could emerge. Additionally, the 2nd support at 147.49 is characterized as an overlap support, reinforcing its importance as a potential level for price rebounds.
On the resistance side, the 1st resistance level at 149.44 is identified as a swing high resistance, and it coincides with the 100% Fibonacci Projection, making it a robust level of resistance where selling pressure may intensify. Beyond this, the 2nd resistance at 149.90 is characterized as a multi-swing high resistance and aligns with the 127.20% Fibonacci Extension, further adding to its significance as a potential area where selling pressure may emerge.
USD/CAD:
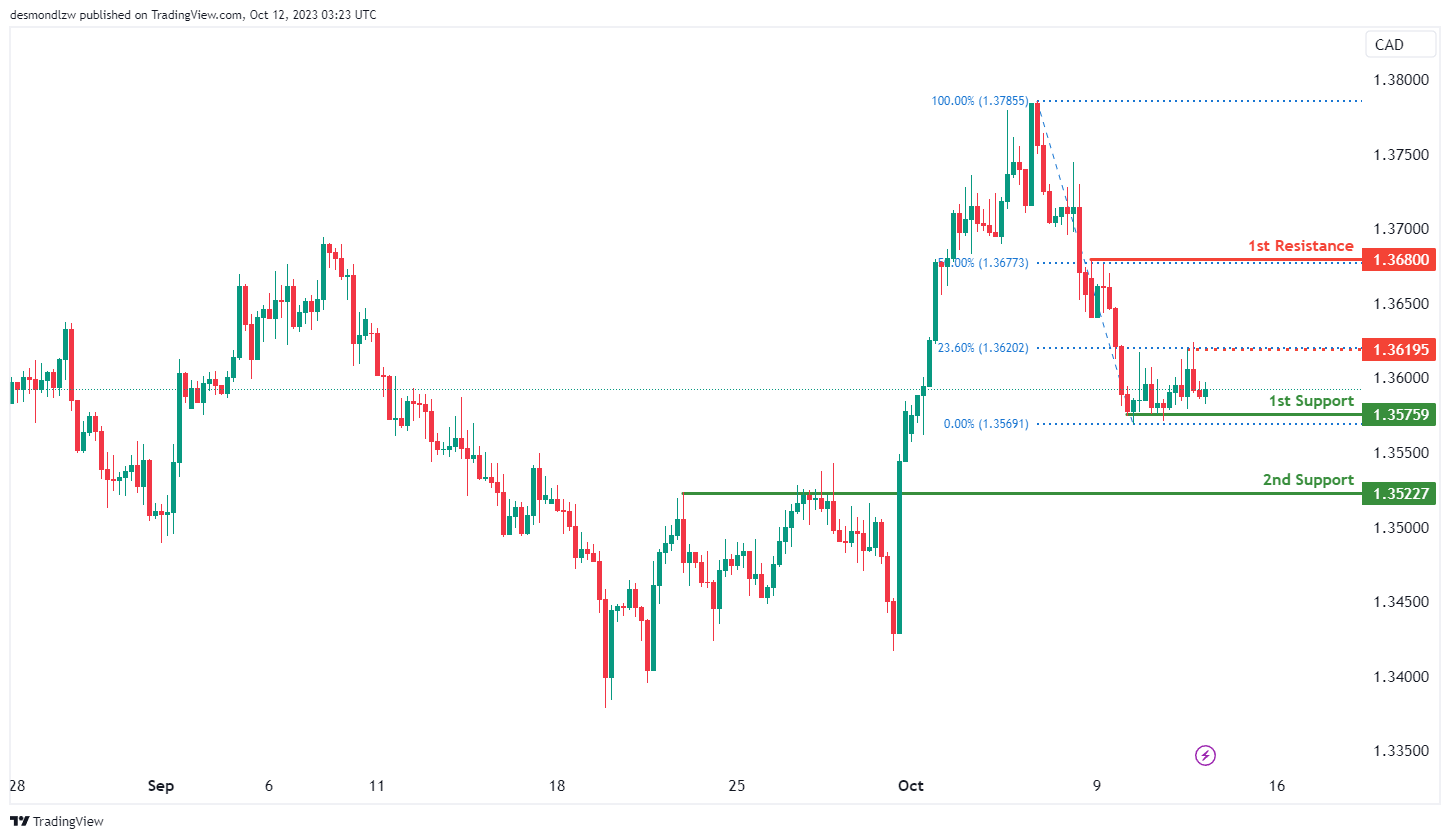
The USD/CAD chart is currently showing a neutral momentum with a potential scenario for price to fluctuate between the intermediate resistance and the 1st support levels.
The 1st support level at 1.3576 is identified as a pullback support. Additionally, the 2nd support level at 1.3523 is also noted as a pullback support, further reinforcing its significance as an area where the price may find support.
To the upside, the intermediate resistance at 1.3619 is identified as a pullback resistance that aligns with the 23.60% Fibonacci retracement level. Higher up, the 1st resistance level at 1.3680 is also marked as a pullback resistance that aligns with the 50.00% Fibonacci retracement level, further emphasizing its significance as a barrier for future price increases.
AUD/USD:
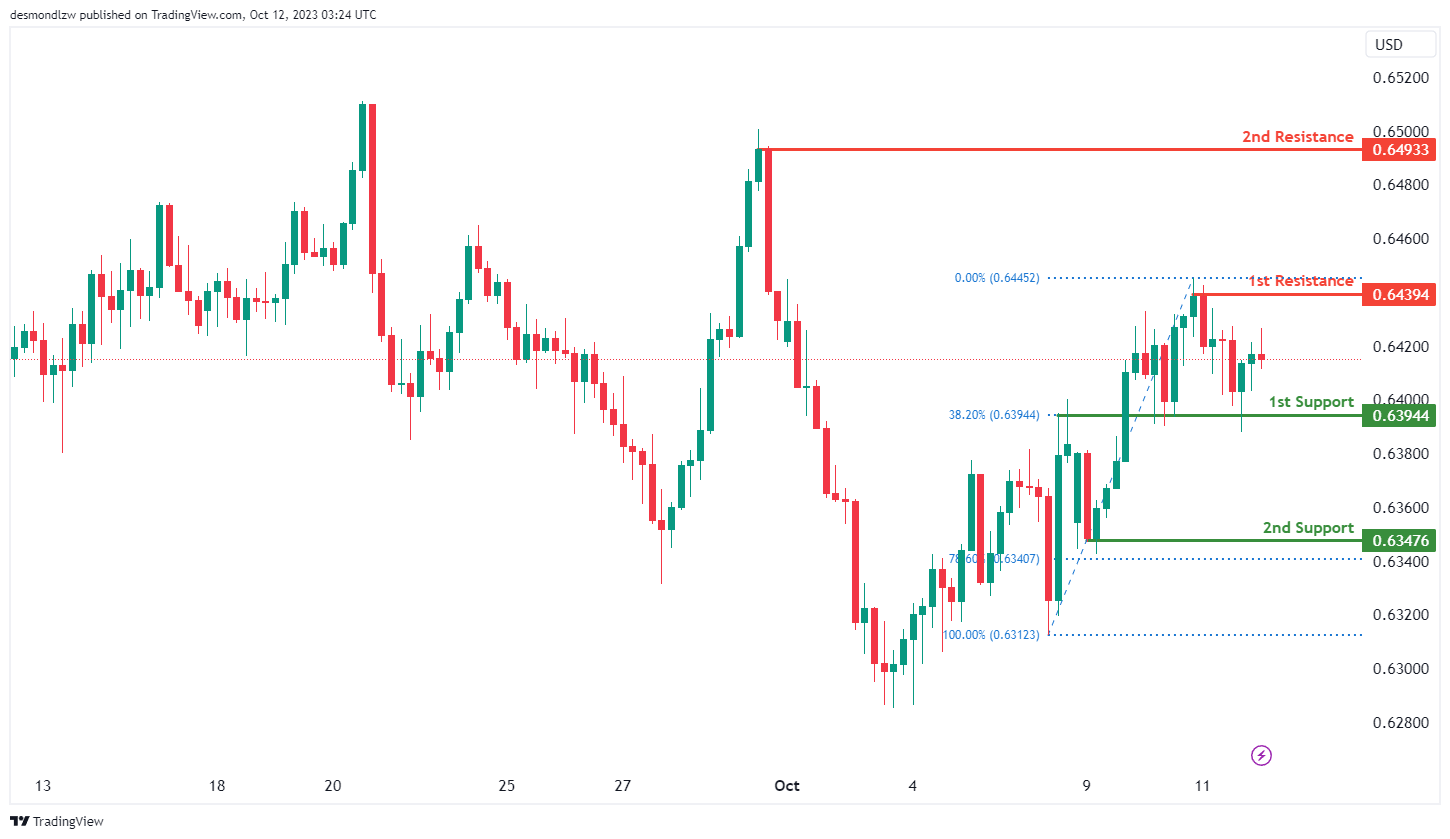
The AUD/USD chart currently exhibits a neutral momentum with a potential scenario for price to fluctuate between the 1st resistance and the 1st support levels.
The 1st support level at 0.6394 is identified as an overlap support that aligns with the 38.20% Fibonacci retracement level. Further below, the 2nd support level at 0.6348 is marked as a pullback support that aligns with the 78.60% Fibonacci retracement level, reinforcing its importance as a potential support level.
To the upside, the 1st resistance level at 0.6439 is identified as a pullback resistance. Additionally, the 2nd resistance level at 0.6493 is noted as a swing-high resistance, further emphasizing its significance as a barrier for future price increases.
NZD/USD
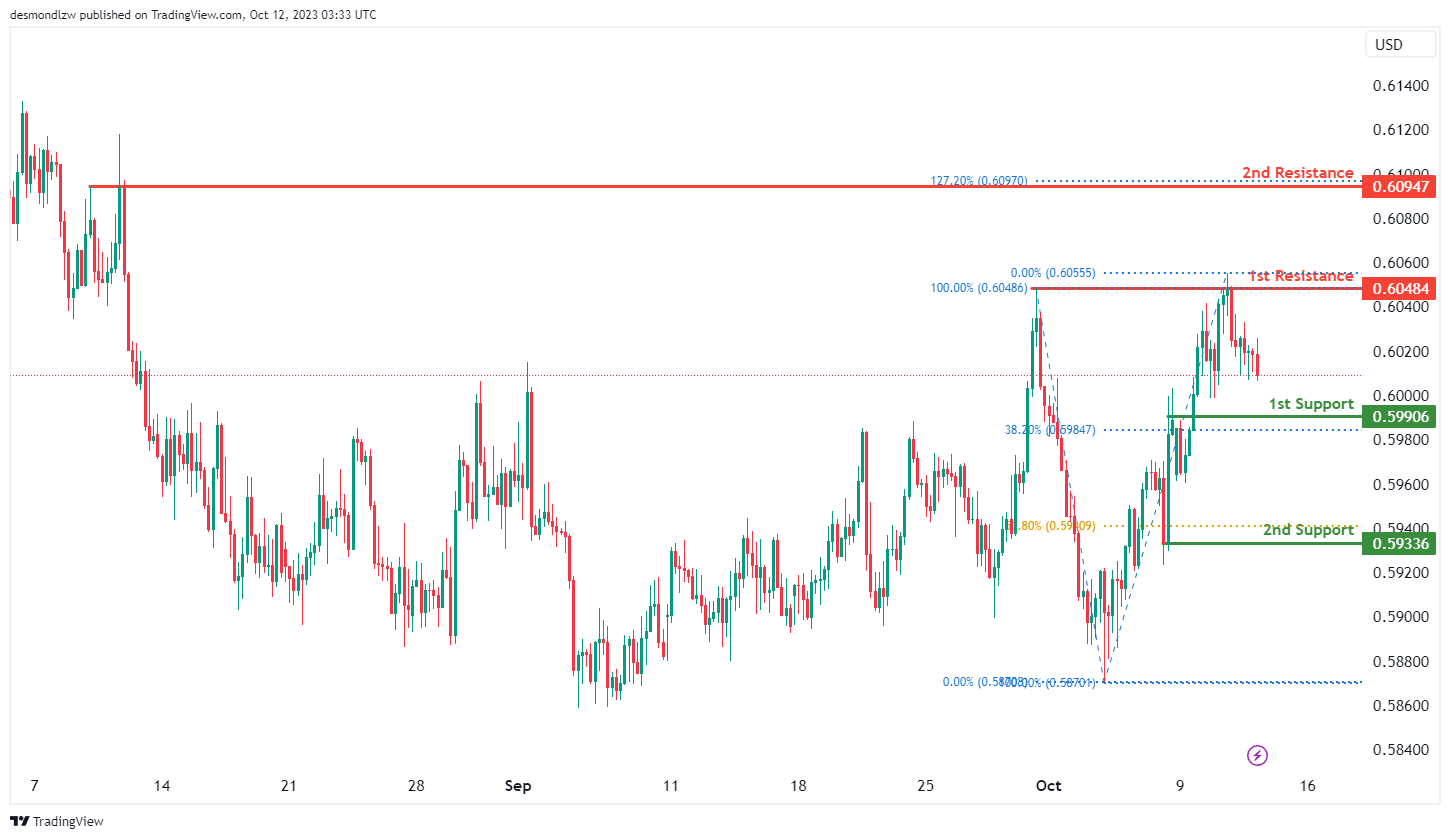
The NZD/USD chart currently exhibits an overall bearish momentum with a potential scenario for price to make a bearish continuation towards the 1st support level.
The 1st support level at 0.5991 is identified as a pullback support that aligns with the 38.20% Fibonacci retracement level. Further below, the 2nd support level at 0.5934 is also noted as a pullback support that aligns with the 61.80% Fibonacci retracement level, further reinforcing its significance as an area where price may find support.
The 1st resistance level at 0.6048 is identified as a pullback resistance. Additionally, the 2nd resistance level at 0.6095 is also marked as a pullback resistance that aligns with the 127.20% Fibonacci extension level, further emphasizing its significance as a barrier for future price increases.
DJ30:
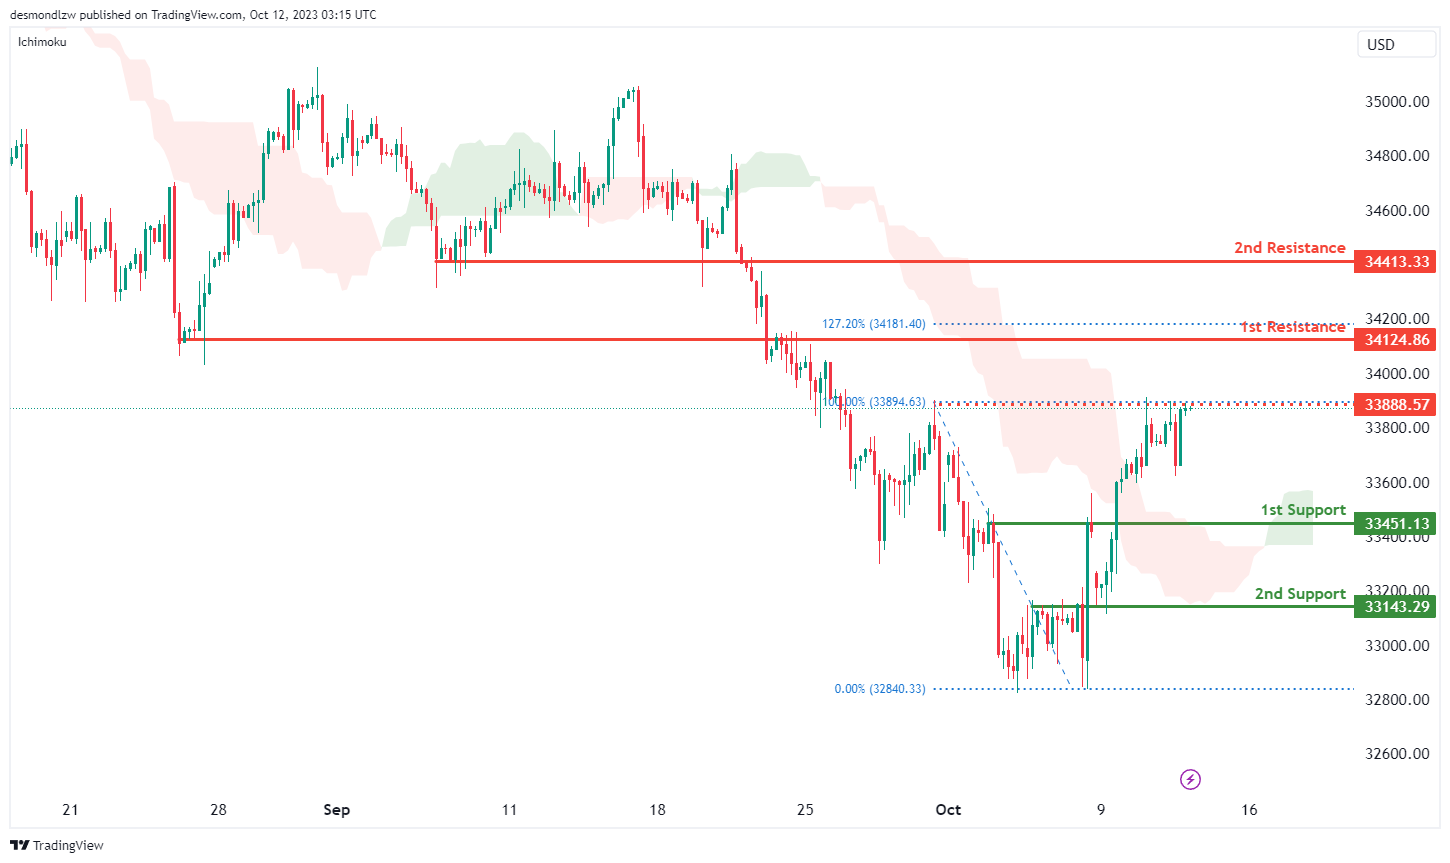
The DJ30 (Dow Jones Industrial Average) chart currently exhibits a bullish momentum, suggesting the potential scenario of a bullish continuation towards the 1st resistance.
The 1st support at 33451.13 is considered significant as it’s identified as a pullback support level. This support area may attract buying interest and provide a potential bounce for the price. Additionally, the 2nd support at 33143.29 is characterized as an overlap support, reinforcing its importance as a level where price could find support.
On the resistance side, the 1st resistance level at 34124.86 is identified as an overlap resistance, indicating a zone where selling pressure may increase. This level also coincides with the 127.20% Fibonacci Extension, signifying a potential Fibonacci confluence zone, which could make it a strong resistance area. Beyond this, the 2nd resistance at 34413.33 is associated with pullback resistance. There’s also an intermediate resistance at 33888.57, characterized as multi-swing high resistance.
GER40:
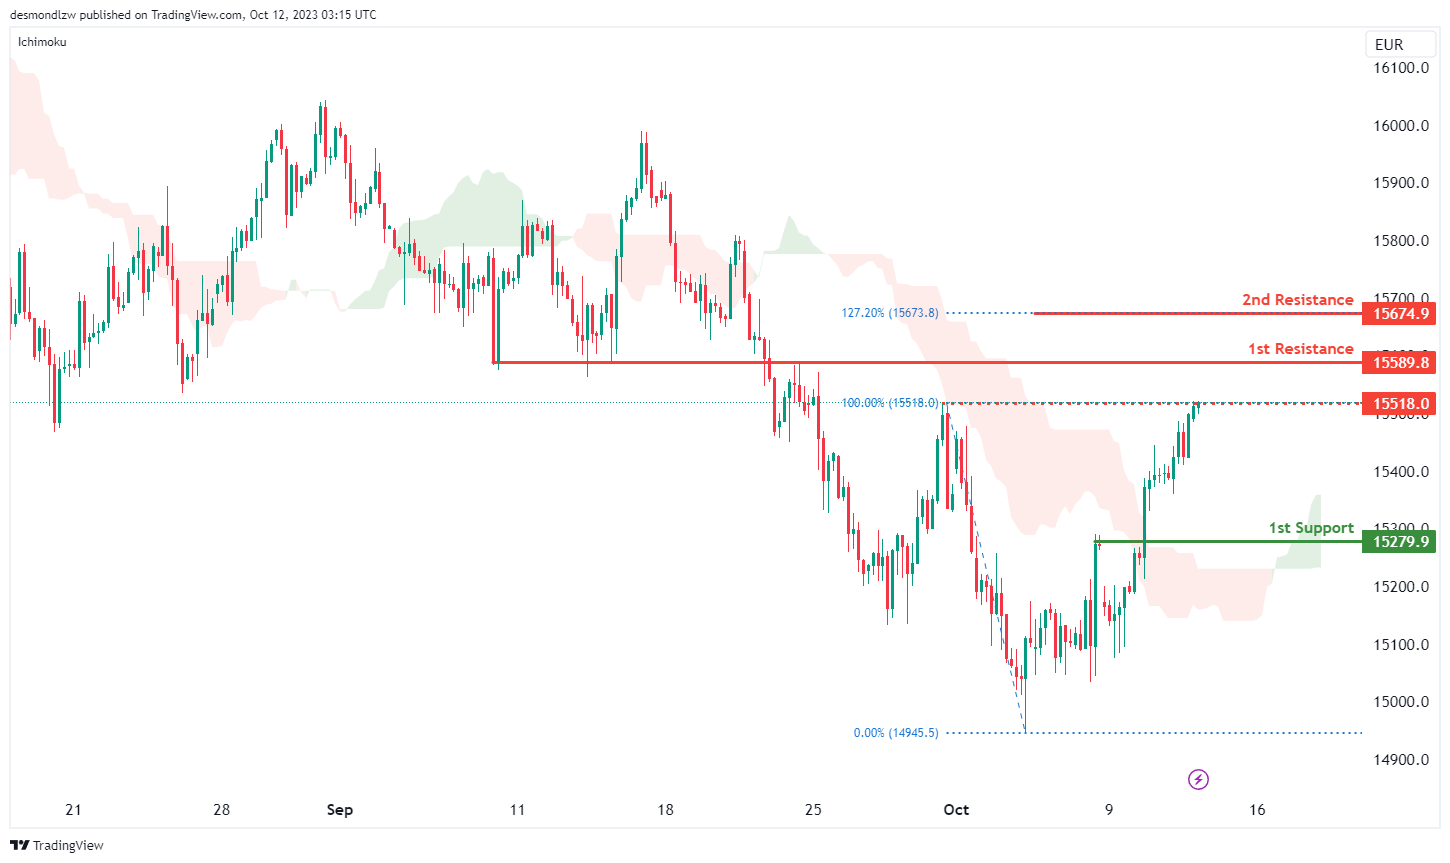
The GER40 (DAX) chart currently exhibits a bullish momentum, with price trading above the bullish Ichimoku cloud. This suggests a positive outlook for the chart.
The 1st support at 15279.90 is identified as a pullback support level, indicating that it could act as a significant area of price support, potentially preventing sharp declines.
On the resistance side, the 1st resistance level at 15589.80 is considered an overlap resistance. This level may present a zone where selling interest could emerge. Additionally, the 2nd resistance at 15674.90 is noted, and it coincides with the 127.20% Fibonacci Extension, which may act as a strong resistance area due to this Fibonacci confluence. There is also an intermediate resistance at 15518.00, characterized as a swing high resistance.
US500
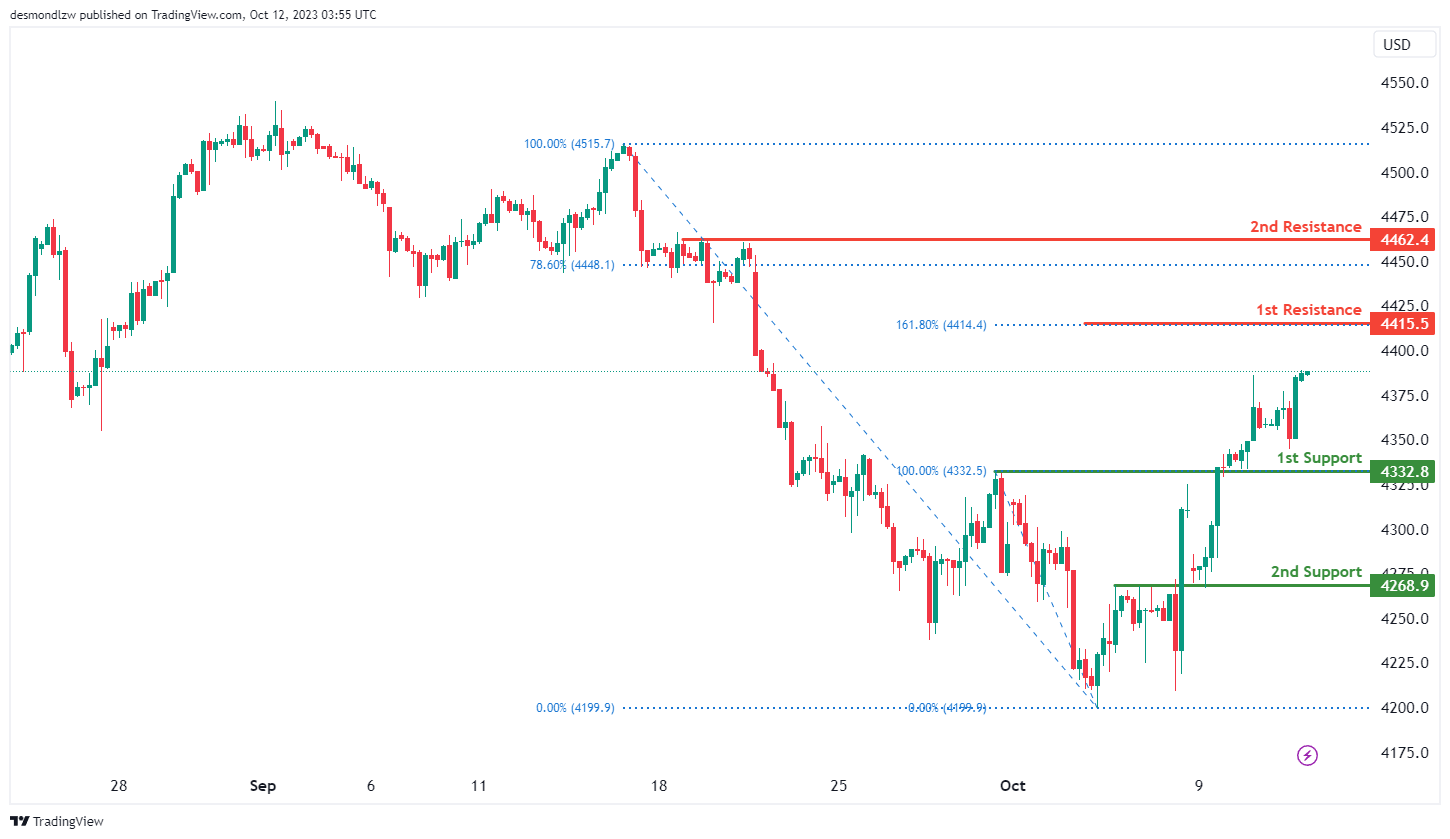
The S&P 500 (US500) chart is currently showing an overall bullish momentum with a potential for price to make a bullish continuation towards the 1st resistance level.
The 1st resistance level at 4,415.50 is identified as a resistance that aligns with the 161.80% Fibonacci extension level. Higher up, the 2nd resistance level at 4,462.40 is noted as a pullback resistance that aligns close to the 78.60% Fibonacci retracement level.
To the downside, the 1st support level at 4,332.80 is identified as an overlap support. Additionally, the 2nd support level at 4,268.90 is also marked as an overlap support.
BTC/USD:
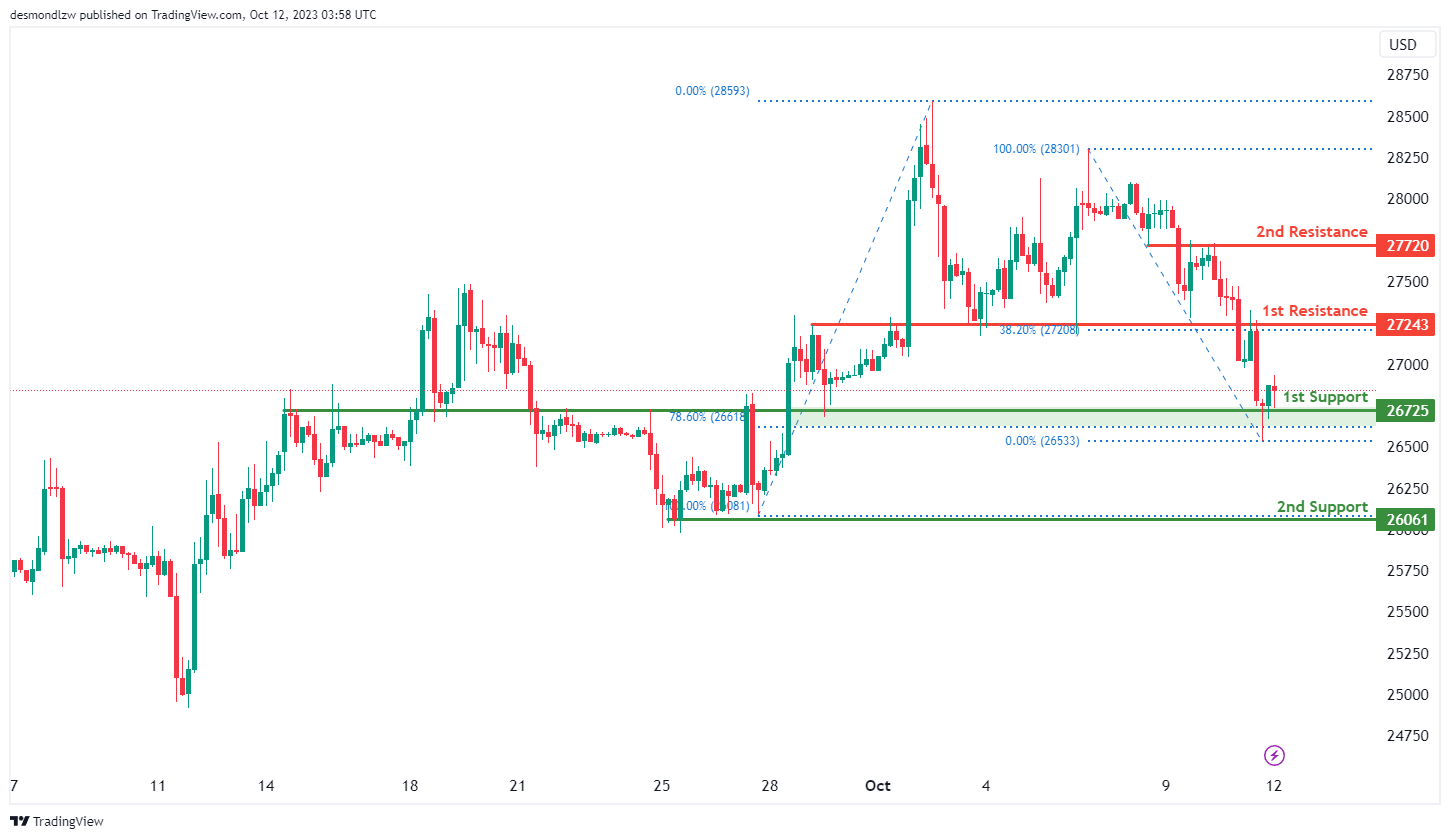
The Bitcoin (BTC/USD) chart currently exhibits an overall bearish momentum with a potential scenario for price to make a bearish continuation towards the 1st support level.
The 1st support level at 26,725.00 is identified as an overlap support that aligns with the 78.60% Fibonacci retracement level. Further below, the 2nd support level at 26,061.00 is noted as a pullback support.
To the upside, the 1st resistance level at 27,243.00 is identified as an overlap resistance that aligns with the 38.20% Fibonacci retracement level. Higher up, the 2nd resistance level at 27,720.00 is also marked as an overlap resistance.
ETH/USD:
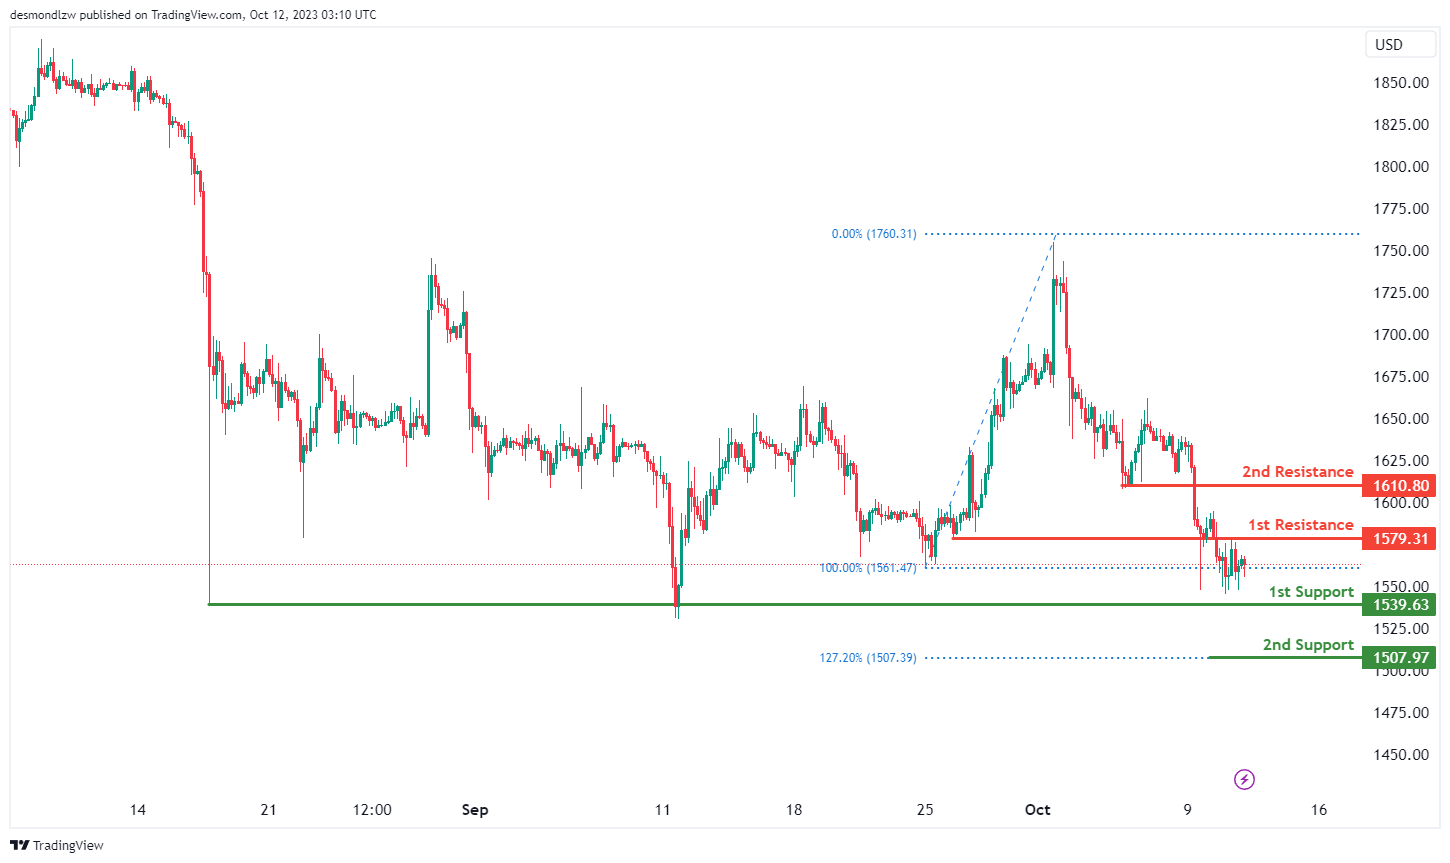
The Ethereum (ETH/USD) chart currently exhibits a neutral momentum with a potential scenario for price to fluctuate between the 1st resistance and the 1st support levels.
The 1st support level at 1,539.63 is identified as a pullback support. Further below, the 2nd support level at 1,507.97 is noted as a support level that aligns with the 127.20% Fibonacci extension level.
To the upside, the 1st resistance level at 1,579.31 is identified as an overlap resistance. Higher up, the 2nd resistance level at 1,610.80 is marked as a pullback resistance.
WTI/USD:
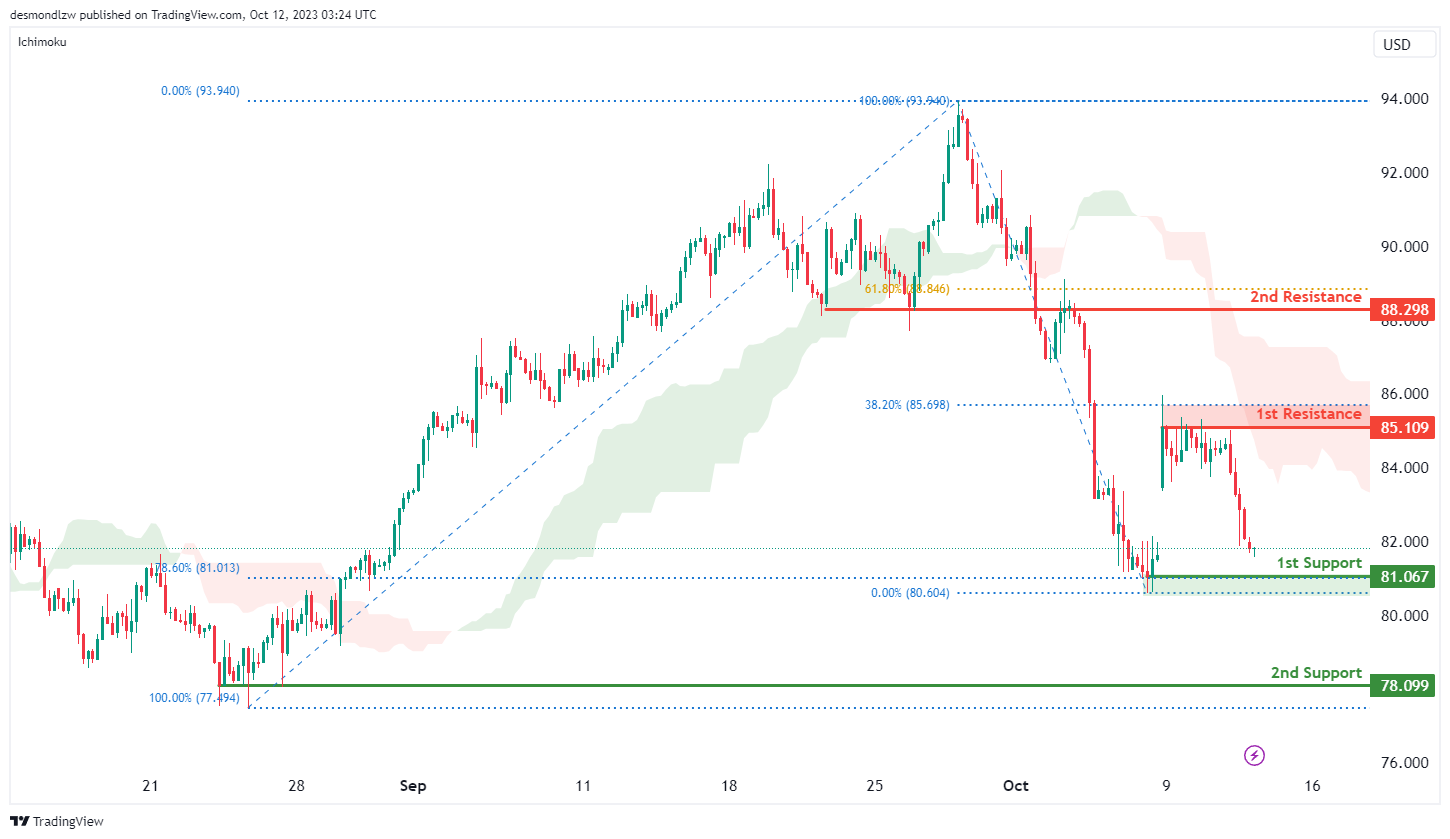
The WTI chart currently exhibits an overall bearish momentum with price trading under the bearish Ichimoku cloud. There is a potential scenario for price to make a bearish continuation towards the 1st support level.
The 1st support level at 81.07 is identified as a pullback support that aligns with the 78.60% Fibonacci retracement level. Additionally, the 2nd support level at 78.09 is also noted as pullback support, further reinforcing its significance as an area where price may find support.
The 1st resistance level at 85.11 is identified as a pullback resistance that aligns close to the 38.20% Fibonacci retracement level. Higher up, the 2nd resistance level at 88.29 is noted as an overlap resistance that aligns close to the 61.80% Fibonacci retracement level, potentially acting as a barrier to further upward movement.
XAU/USD (GOLD):
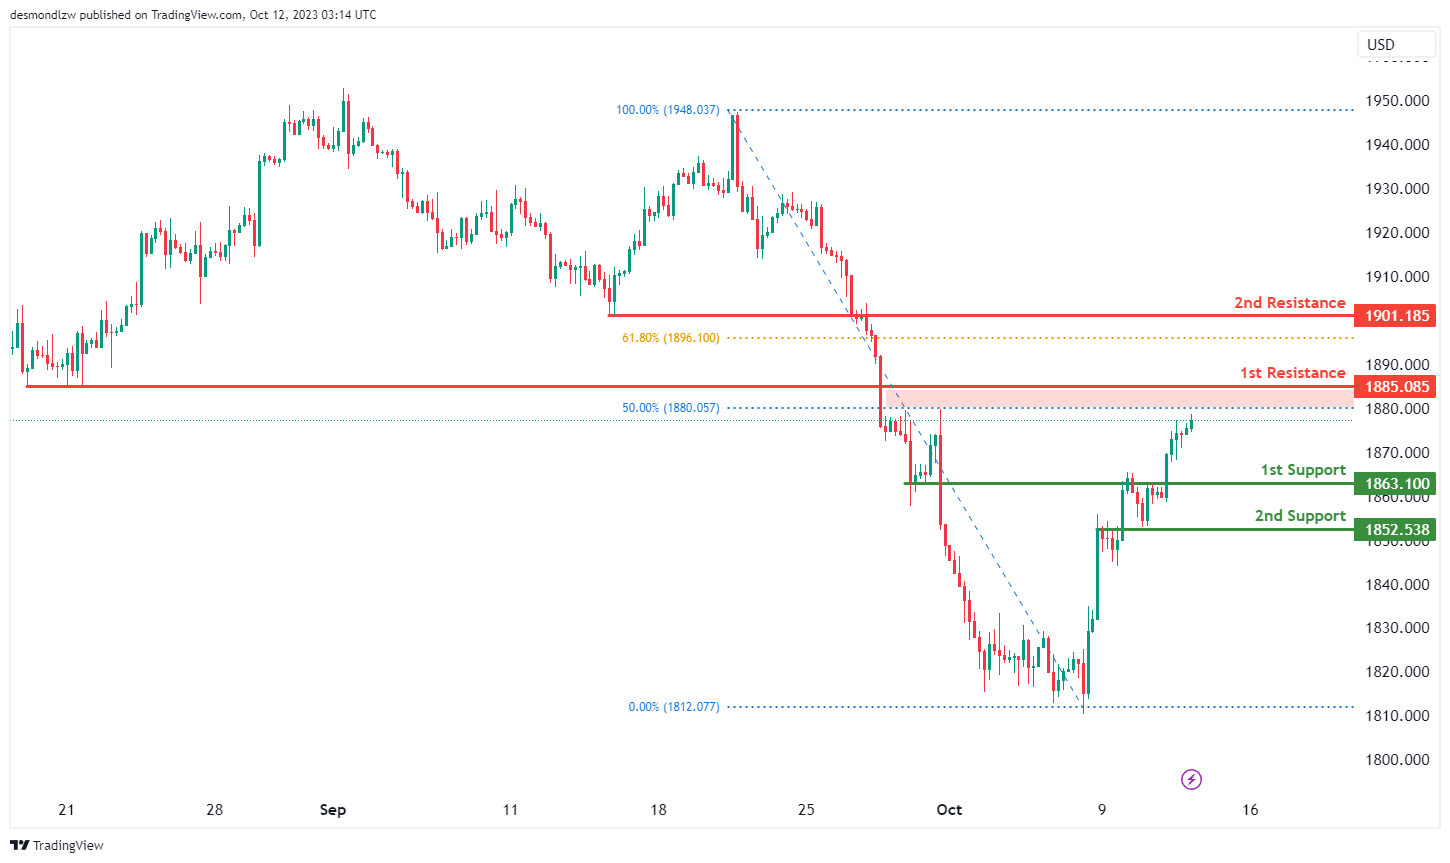
The XAU/USD chart currently exhibits a bearish momentum, indicating a potential scenario of a bearish reaction off the 1st resistance level, followed by a drop towards the 1st support.
The 1st support at 1863.10 is considered significant as it’s identified as a pullback support, potentially acting as a strong level where buying interest could emerge. Additionally, the 2nd support at 1852.53 is characterized as an overlap support, reinforcing its importance as a potential level for price rebounds.
On the resistance side, the 1st resistance level at 1885.08 is identified as a pullback resistance, and it coincides with the 50% Fibonacci Retracement level, making it a robust level of resistance where selling pressure may intensify. Beyond this, the 2nd resistance at 1901.18 is characterized as an overlap resistance, further adding to its significance as a potential area where selling pressure may emerge.
Crude Oil Price Could See Swing Moves Due To Israel-Hamas War
Key Highlights
- Crude oil prices opened with a gap higher after the Israel-Hamas war escalated.
- It is struggling to clear the $87.00 resistance on the 4-hour chart.
- Gold prices climbed further higher toward the $1,880 resistance.
- The US Consumer Price Index could decline from 3.7% to 3.6% in Sep 2023 (YoY).
Crude Oil Price Technical Analysis
Yesterday, we discussed how Gold and Crude oil prices opened with a gap higher this week due to the Israel-Hamas war. Oil prices climbed above the $85.00 resistance zone before the bears appeared. The death toll is still rising in Israel and the Gaza Strip, as missile attacks continue, and conflicts explode for a sixth day on Thursday.
Looking at the 4-hour chart of XTI/USD, the price spiked toward the $87.00 resistance zone and the 200 simple moving average (green, 4-hour). It struggled to continue higher and formed a short-term high at $87.36.
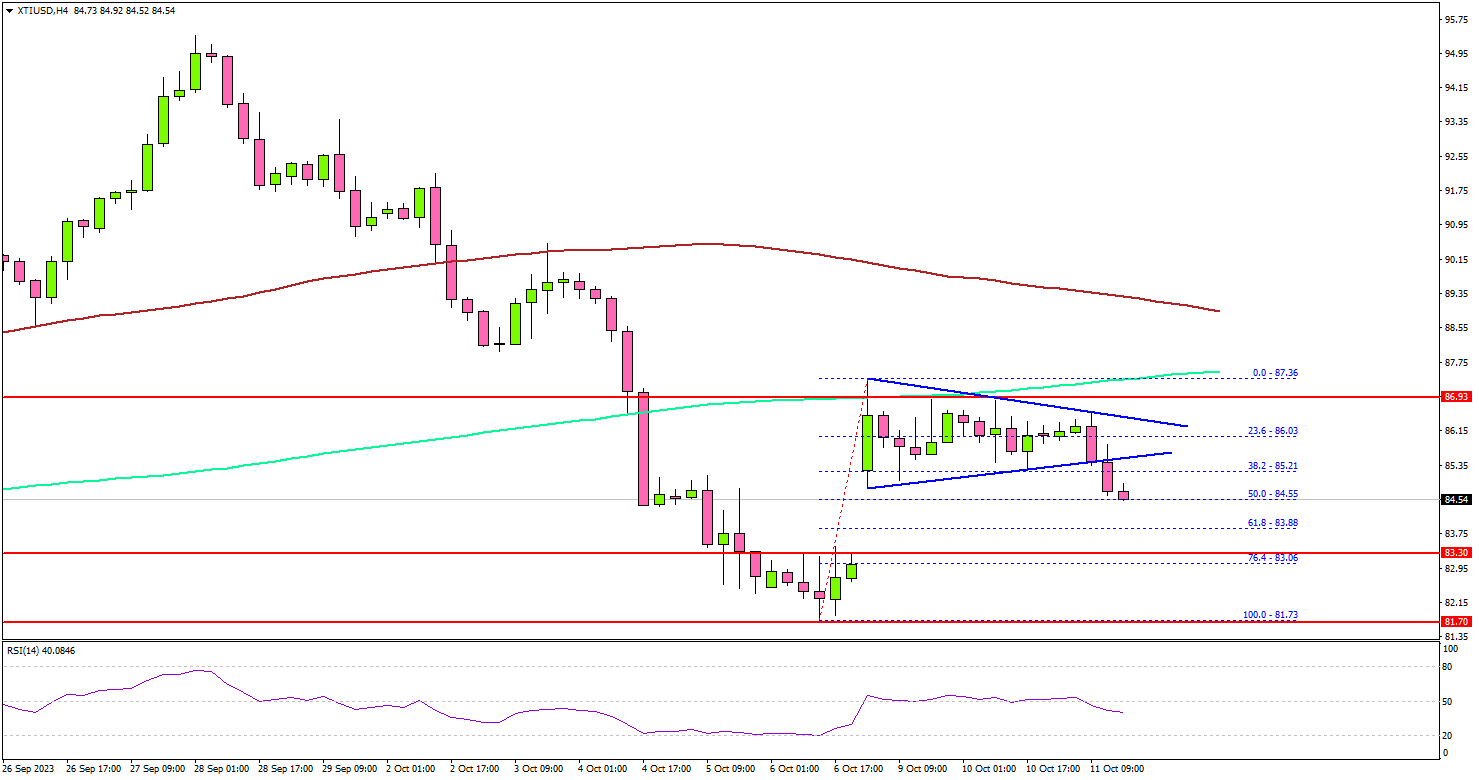
Recently, there was a downside correction below the $86.20 support. The price is now trading well below the $87.00 zone, the 100 simple moving average (red, 4-hour), and the 200 simple moving average (green, 4-hour).
If it continues to move down, the bulls might appear near the gap-close region at $83.30. The next major support sits near the $81.80 zone. Any more losses might call for a test of the $80.50 support zone or a trend change and drop toward the $80.00 support zone.
On the upside, the price might face resistance near the $86.20 level. The next major resistance is near the $87.00 zone, above which the price may perhaps accelerate higher. In the stated case, it could even visit the $90 resistance.
Looking at gold prices, there was a steady increase above the $1,850 level and the bulls could aim a spike above the $1,880 resistance.
Economic Releases to Watch Today
- US Consumer Price Index for Sep 2023 (MoM) – Forecast 0.3%, versus +0.6% previous.
- US Consumer Price Index for Sep 2023 (YoY) – Forecast +3.6%, versus +3.7% previous.
- US Consumer Price Index Ex Food & Energy for Sep 2023 (YoY) – Forecast +4.1%, versus +4.3% previous.
Japan’s PPI slows to 2% yoy in Sep, trailing CPI core for the first time since 2021
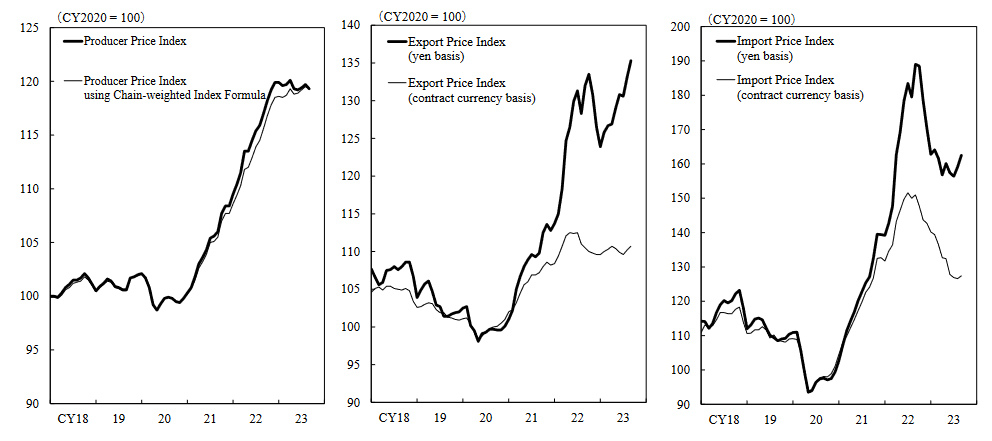
Japan PPI slowed from 3.3% yoy to 2.0% yoy in September, below expectations of 2.3%. That's the lowest level since March 2021. Also, PPI is now below CPI core (at 3.1% yoy) for the first time since early 2021.
Import price index was unchanged at -15.6% yoy, the sixth month of decline. Export price index rose for the first time in seven months, up 0.2% yoy, comparing to prior month's -0.7% yoy.
For the month, PPI fell -0.3% mom. Import price index rose 0.6% mom. Export price index rose 0.5% mom.
Fed’s Collins eyes prolonged restrictive rates
Boston Fed President Susan Collins noted overnight her expectation that the central bank may need to maintain interest rates at restrictive levels "for some time" until there's tangible evidence of inflation moving back to 2% target.
While acknowledging that the policy rates might currently be near their peak, Collins did not rule out the possibility of additional rate hikes.
She stated, "And while we are likely near, and could be at, the peak for policy rates, further tightening could be warranted depending on incoming information."
Amidst the pervasive economic uncertainties and risks characterizing the current financial climate, Collins remains cautiously optimistic. She believes that the restoration of price stability is achievable, anticipating an "orderly slowdown in activity and only a modest increase in the unemployment rate."
Fed minutes show majority leaning towards further rate hike
In the minutes from Fed's September 19-20 meeting, while "a majority of participants" believed another rate increase might be in order, a contrasting view was held by "some" who deemed no further hikes necessary.
A unanimous consensus was evident among all attendees that the existing policy stance needs to "remain restrictive for some time". The chief rationale behind this unified sentiment is to ensure that inflation trends downwards in a sustained manner to Fed's target.
An interesting shift in communication strategy was proposed by "several participants". They emphasized that discussions and subsequent messaging should transition from deliberating the potential height of rate hikes to determining the duration for which rates should be maintained at these elevated, restrictive levels.
In terms of gauging risks, participants "generally judged" that challenges to fulfilling the Fed's mandates had become "more two sided". However, a lingering concern persists. Despite this balanced view of risks, "most participants" continued to see upside risks to inflation.
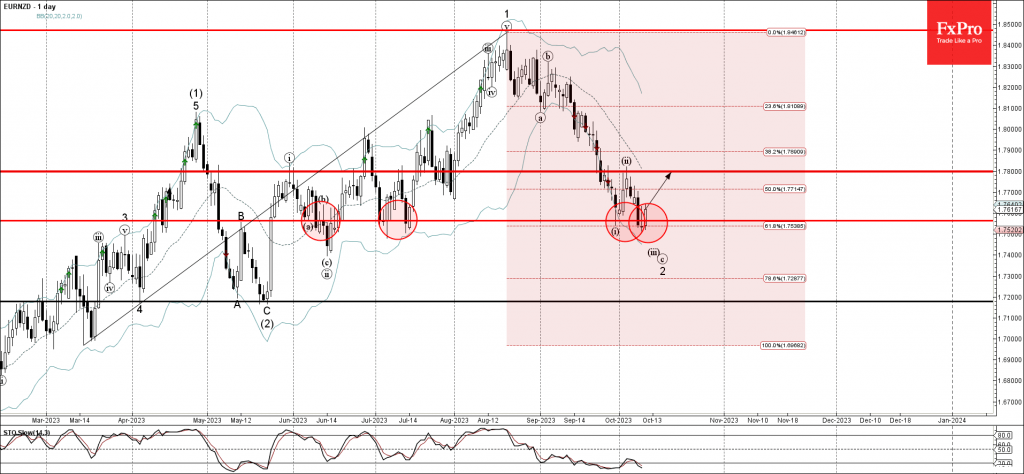
EURNZD Wave Analysis
- EURNZD reversed from support level 1.7565
- Likely to rise to resistance level 1.7800
EURNZD currency pair recently reversed up from the key support level 1.7565 (which has been reversing the price from June), intersecting with the lower daily Bollinger Band and the 61.8% Fibonacci correction of the previous upward impulse from March.
The upward reversal from the support level 1.7565 stopped the c-wave of the previous ABC correction 2 from the middle of August.
Given the oversold daily Stochastic, EURNZD currency pair can be expected to rise further toward the next resistance level 1.7800.
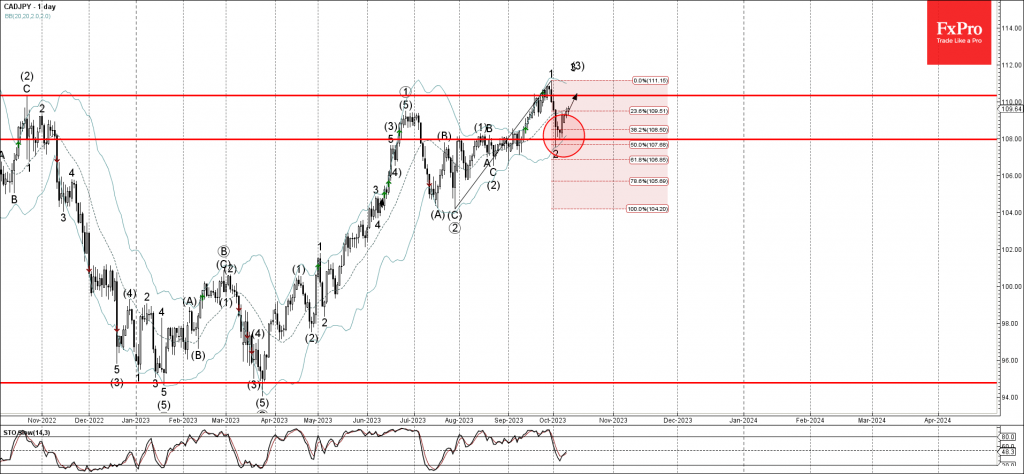
CADJPY Wave Analysis
- CADJPY reversed from support level 108.00
- Likely to rise to resistance level 110.35
CADJPY currency pair recently reversed up from the pivotal support level 108.00 (former key resistance from July and August), intersecting with the lower daily Bollinger Band.
The upward reversal from the support level 108.00 started the active short-term impulse wave 3 of the intermediate impulse wave (3) from the middle of August.
Given the clear daily uptrend and the continued yen sales, CADJPY can be expected to rise further toward the next resistance level 110.35.
Dollar Mostly Unfazed Post FOMC Minutes
- Minutes: Fed sees ‘restrictive’ policy staying in place until inflation eases
- 10-year Treasury yield resumes slide post minutes, down 5.4bps to 4.599%
- Inflation expected to moderate given energy price trends in September; while core proves to be sticky
These Fed Minutes seem to be particularly old given everything we’ve seen with rates, a new war, and a gloomier outlook for the economy. The Minutes noted that policy should remain restrictive for some time until the Committee is confident that inflation is moving down sustainably toward its objective. The Fed acknowledged given how restrictive monetary policy has become that the risks to the achievement of the Committee’s goals had become more two sided. Many noted data volatility and potential data revisions, or the difficulty of estimating the neutral policy rate, as supporting the case for proceeding carefully in determining the extent of additional policy firming that may be appropriate.
Wall Street seems confident the Fed is done raising rates this year. A lot has happened since the September 19-20th FOMC policy decision and it seems the Fed can park rates here and wait to see how quickly inflation falls to their target. If the consumer finally shows major signs of weakness this earnings season, Fed rate cut bets will become bolstered for the spring time.
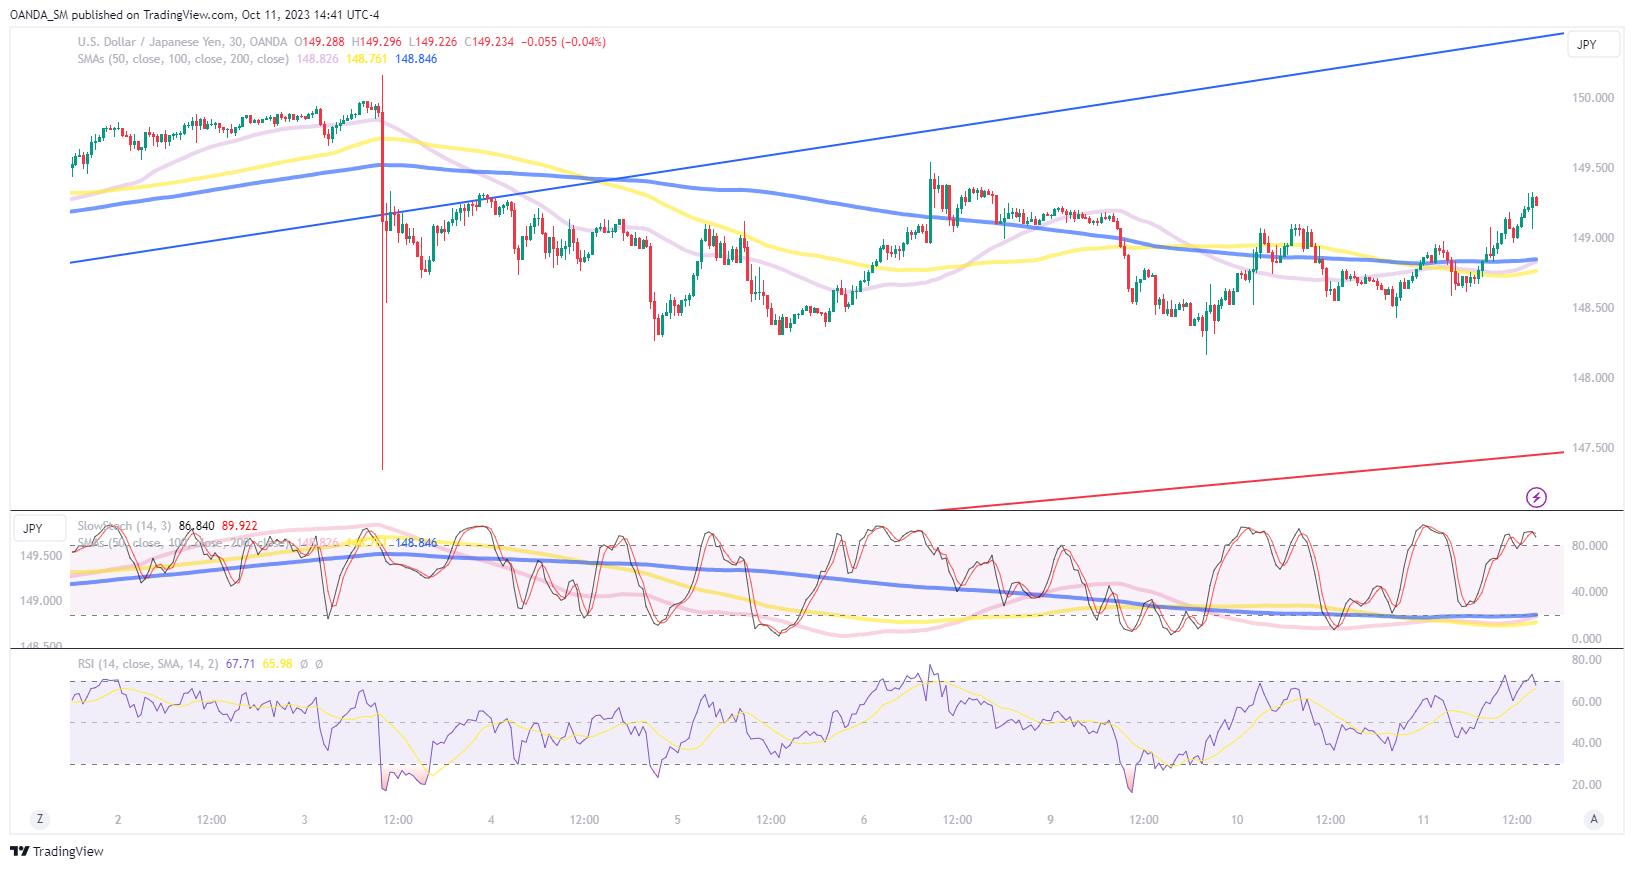
The dollar initially pared losses against its major trading partners following the release of the Fed minutes, with the dollar-yen erasing the majority of losses that stemmed from the start of the trading week. The safe-haven flows that went into the Japanese yen from the Israel-Hamas war have mostly been unwound. Currency traders will pay close attention to the upcoming inflation report which could suggest restrictive policy might have to stay in place even longer.
USD/JPY 30-minute chart
Fed Minutes Signal One More Rate Hike Could Be On Tap
The minutes from the September 19-20, 2023 Federal Open Market Committee (FOMC) meeting underscored the Fed's commitment to curtailing price pressures.
On the economic outlook, Committee members noted that "that real GDP had been expanding at a solid pace and had been more resilient than expected. Nevertheless, participants also noted that they expected that real GDP growth would slow in the near term. Participants judged that the current stance of monetary policy was restrictive and that it broadly appeared to be restraining the economy as intended." Additionally, participants continued to anticipate that a period of below trend growth would be needed to return inflation to its 2% target.
On debating the appropriate policy actions, "almost all participants judged it appropriate to maintain the target range for the federal funds rate." A more cautious approach would better allow the Committee the cumulative effects of previous tightening on economic activity.
When discussing future interest rate hikes, the "majority of participants judged that one more increase in the target federal funds rate at a future meeting would likely be appropriate, while some judged it likely that no further increases would be warranted." Moreover, all participants stressed the importance of maintaining a restrictive policy stance until there is strong evidence that inflation is moving back to target.
Concerning the risks of additional rate hikes, committee members noted that "risks to the achievement of the Committee’s goals had become more two sided." The Committee noted the potential for a larger-than-anticipated lagged impact on economic activity from tightening financial conditions.
Key Implications
Today's minutes confirmed that the Fed has kept another rate hike in play as economic activity continues to be buoyant underscored by strength in the labor market. This has been reflected in an expected shallower path of rate cuts. While inflation has been trending in a favorable direction, near-term inflation expectations have inched higher in recent months and will have the Fed attentively monitoring upside risks to inflation when calibrating policy to a restrictive level that balances the risks of doing too much versus doing too little.
With economic activity remaining strong, the Fed is likely to move forward with an additional rate hike and maintain rates at a restrictive level until there is clear evidence that inflation is on a sustainable path to its 2% target. The one risk to this view is the sharp tightening in financial conditions experienced over the past several weeks, highlighted by a rise in long-term treasury yields. Should this continue, it may give the Fed reason to pause.