

Sample Category Title
Fed’s Bowman: Policy rate may need to rise further
Fed Governor Michelle Bowman acknowledged in a speech the progress made in curbing inflation. However, she quickly pointed out "inflation remains well above the FOMC's 2 percent target."
She highlighted the robust pace of domestic spending and the prevailing tightness in the labor market. These factors indicate that "the policy rate may need to rise further and stay restrictive for some time to return inflation to the FOMC's goal."
Shifting her attention to the broader challenges faced by central banks, she elucidated, "As they have confronted price stability challenges, central banks have also faced new financial stability risks."
Specifically, she cited concerns related to the substantial fluctuations in interest rates amidst an environment characterized by sustained, heightened inflation.
Moreover, Bowman emphasized the potential risks arising from geopolitical tensions, explaining how they can instigate "greater financial market volatility." She also underscored the indirect impacts such tensions could have, including influencing economic activity and inflation.
Crypto Nosedive Amid Stock Upturns
Market Picture
The crypto market did not support the impressive rise in risk appetite on traditional finances. Their combined capitalisation fell 1.7% over the past 24 hours to $1.055 trillion – the lowest in almost two weeks.
Bitcoin fell below $27K in early trading on Wednesday. This is the fifth consecutive day of decline after a failed attempt to consolidate above the 200-day MA late last week. Currently, BTCUSD has pulled back to the upward channel’s lower boundary. The ability to push back from there will confirm the formation of an uptrend. For now, this is the preferred scenario.
A consolidation below $27K will likely intensify the sell-off and open the way for a quick drop to $26K (previous local highs) and further to $25K.
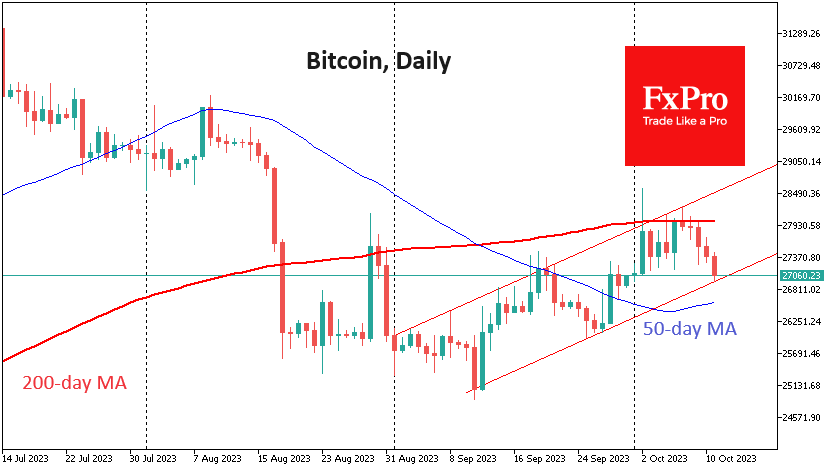
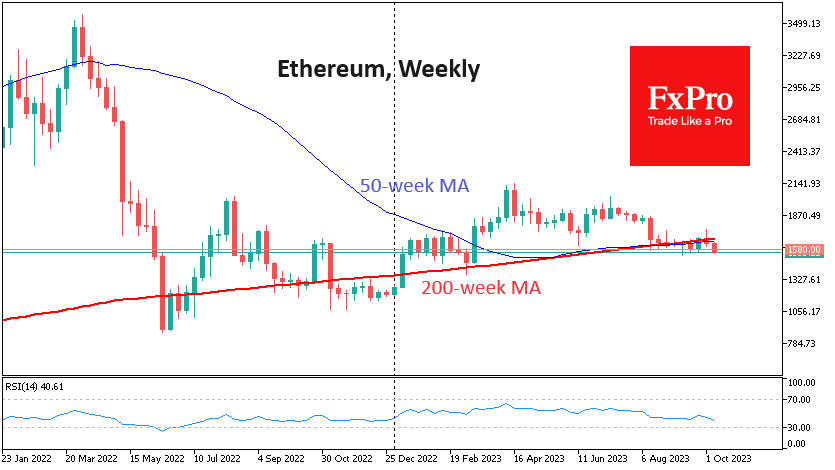
While Bitcoin tries to stay within an uptrend, Ethereum has fallen to $1550, not far from the September lows. This dip below the 200-week MA could demonstrate the market’s bearish bias. And Bitcoin’s stronger momentum is a result of institutional buying.
Ethereum came under pressure amid asset sales. The Ethereum Foundation sold some of its assets – 1,700 ETH – on the decentralised exchange Uniswap and converted the proceeds into USDC $2.7 million worth of stablecoins.
News background
Bitfinex points out that the number of bitcoins available to speculators has continued to fall to its lowest level in almost eight years. On the other hand, holders have increased the number of coins in their wallets to a new record.
According to Bloomberg, Binance has closed the widely publicised project to support the cryptocurrency industry’s Industry Recovery Initiative, to which it had pledged at least $1 billion following the collapse of FTX. The initiative only managed to raise $64 million from one of the announced participants.
According to Santiment, cryptocurrency purchases could start soon. According to its data, investors have withdrawn $10 billion worth of Tether stablecoins to exchange wallets. The replenishment of addresses has been observed since mid-September, and now the volume of USDT on trading platforms is at its highest since March 2023.
EURUSD Takes a Breather Before New Battle
- EURUSD eases bullish tone near major obstacle
- Holds within bearish channel ahead of FOMC minutes
- Bulls need to drive above 1.0760 to brighten outlook
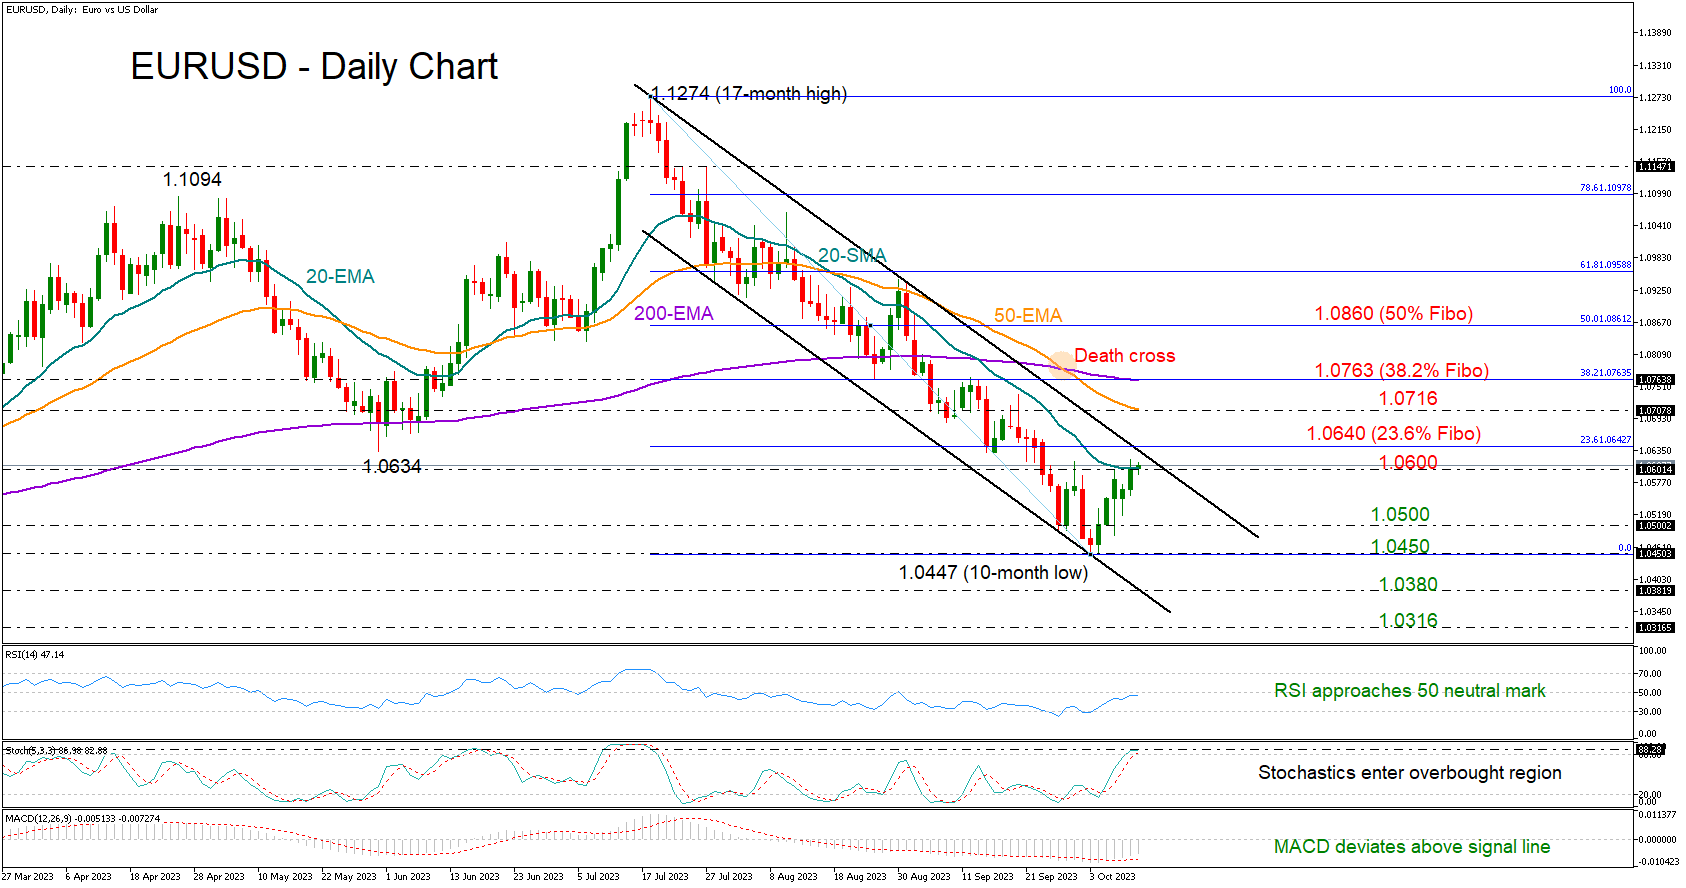
EURUSD has been muted around the 1.0600 level during the early European trading hours on Wednesday after five consecutive bullish days.
The pair is having a positive week, but the 20-day SMA has been a struggle. The upper boundary of the bearish channel could be a bigger threat at 1.0640, close to the 23.6% Fibonacci retracement of 1.1274-1.0447.
The technical signals remain encouraging, given the positive slope in the RSI and the stochastic oscillator. However, the former is still below the neutral mark of 50, while the latter is already in the overbought zone, indicating there are still some risks. Strikingly, the 50- and 200-day exponential moving averages (EMAs) have recently formed a death cross, promoting the market’s negative trajectory from mid-July.
If the bulls exit the channel on the upside, the 50- and 200-day EMAs could come first into view at 1.0700 and 1.0763 respectively. The latter point coincides with the 38.2% Fibonacci number. Hence, a successful bounce above it could stage a notable rally towards the 50% Fibonacci of 1.0860.
If the price stays in the downward channel and closes below the 20-day EMA, support may immediately develop around 1.0500. Then, the bears could retest October’s low of 1.0447 before sinking towards the channel’s lower boundary seen at 1.0380. Another failure there would dampen market sentiment, squeezing the price probably to 1.0316 taken from November 30, 2022.
To sum up, the latest positive rotation in EURUSD is not very tempting yet as key resistance levels stand overhead. To gain durable confidence in buying, the pair needs to break the bearish pattern above 1.0640 and strengthen above its longer-term EMAs.
NZDUSD Rally Stops at Key Area
- NZDUSD trades sideways amidst geopolitical developments
- The current short-term upleg started when NZDUSD failed to break 0.5870
- Momentum indicators are somewhat supportive of the current move
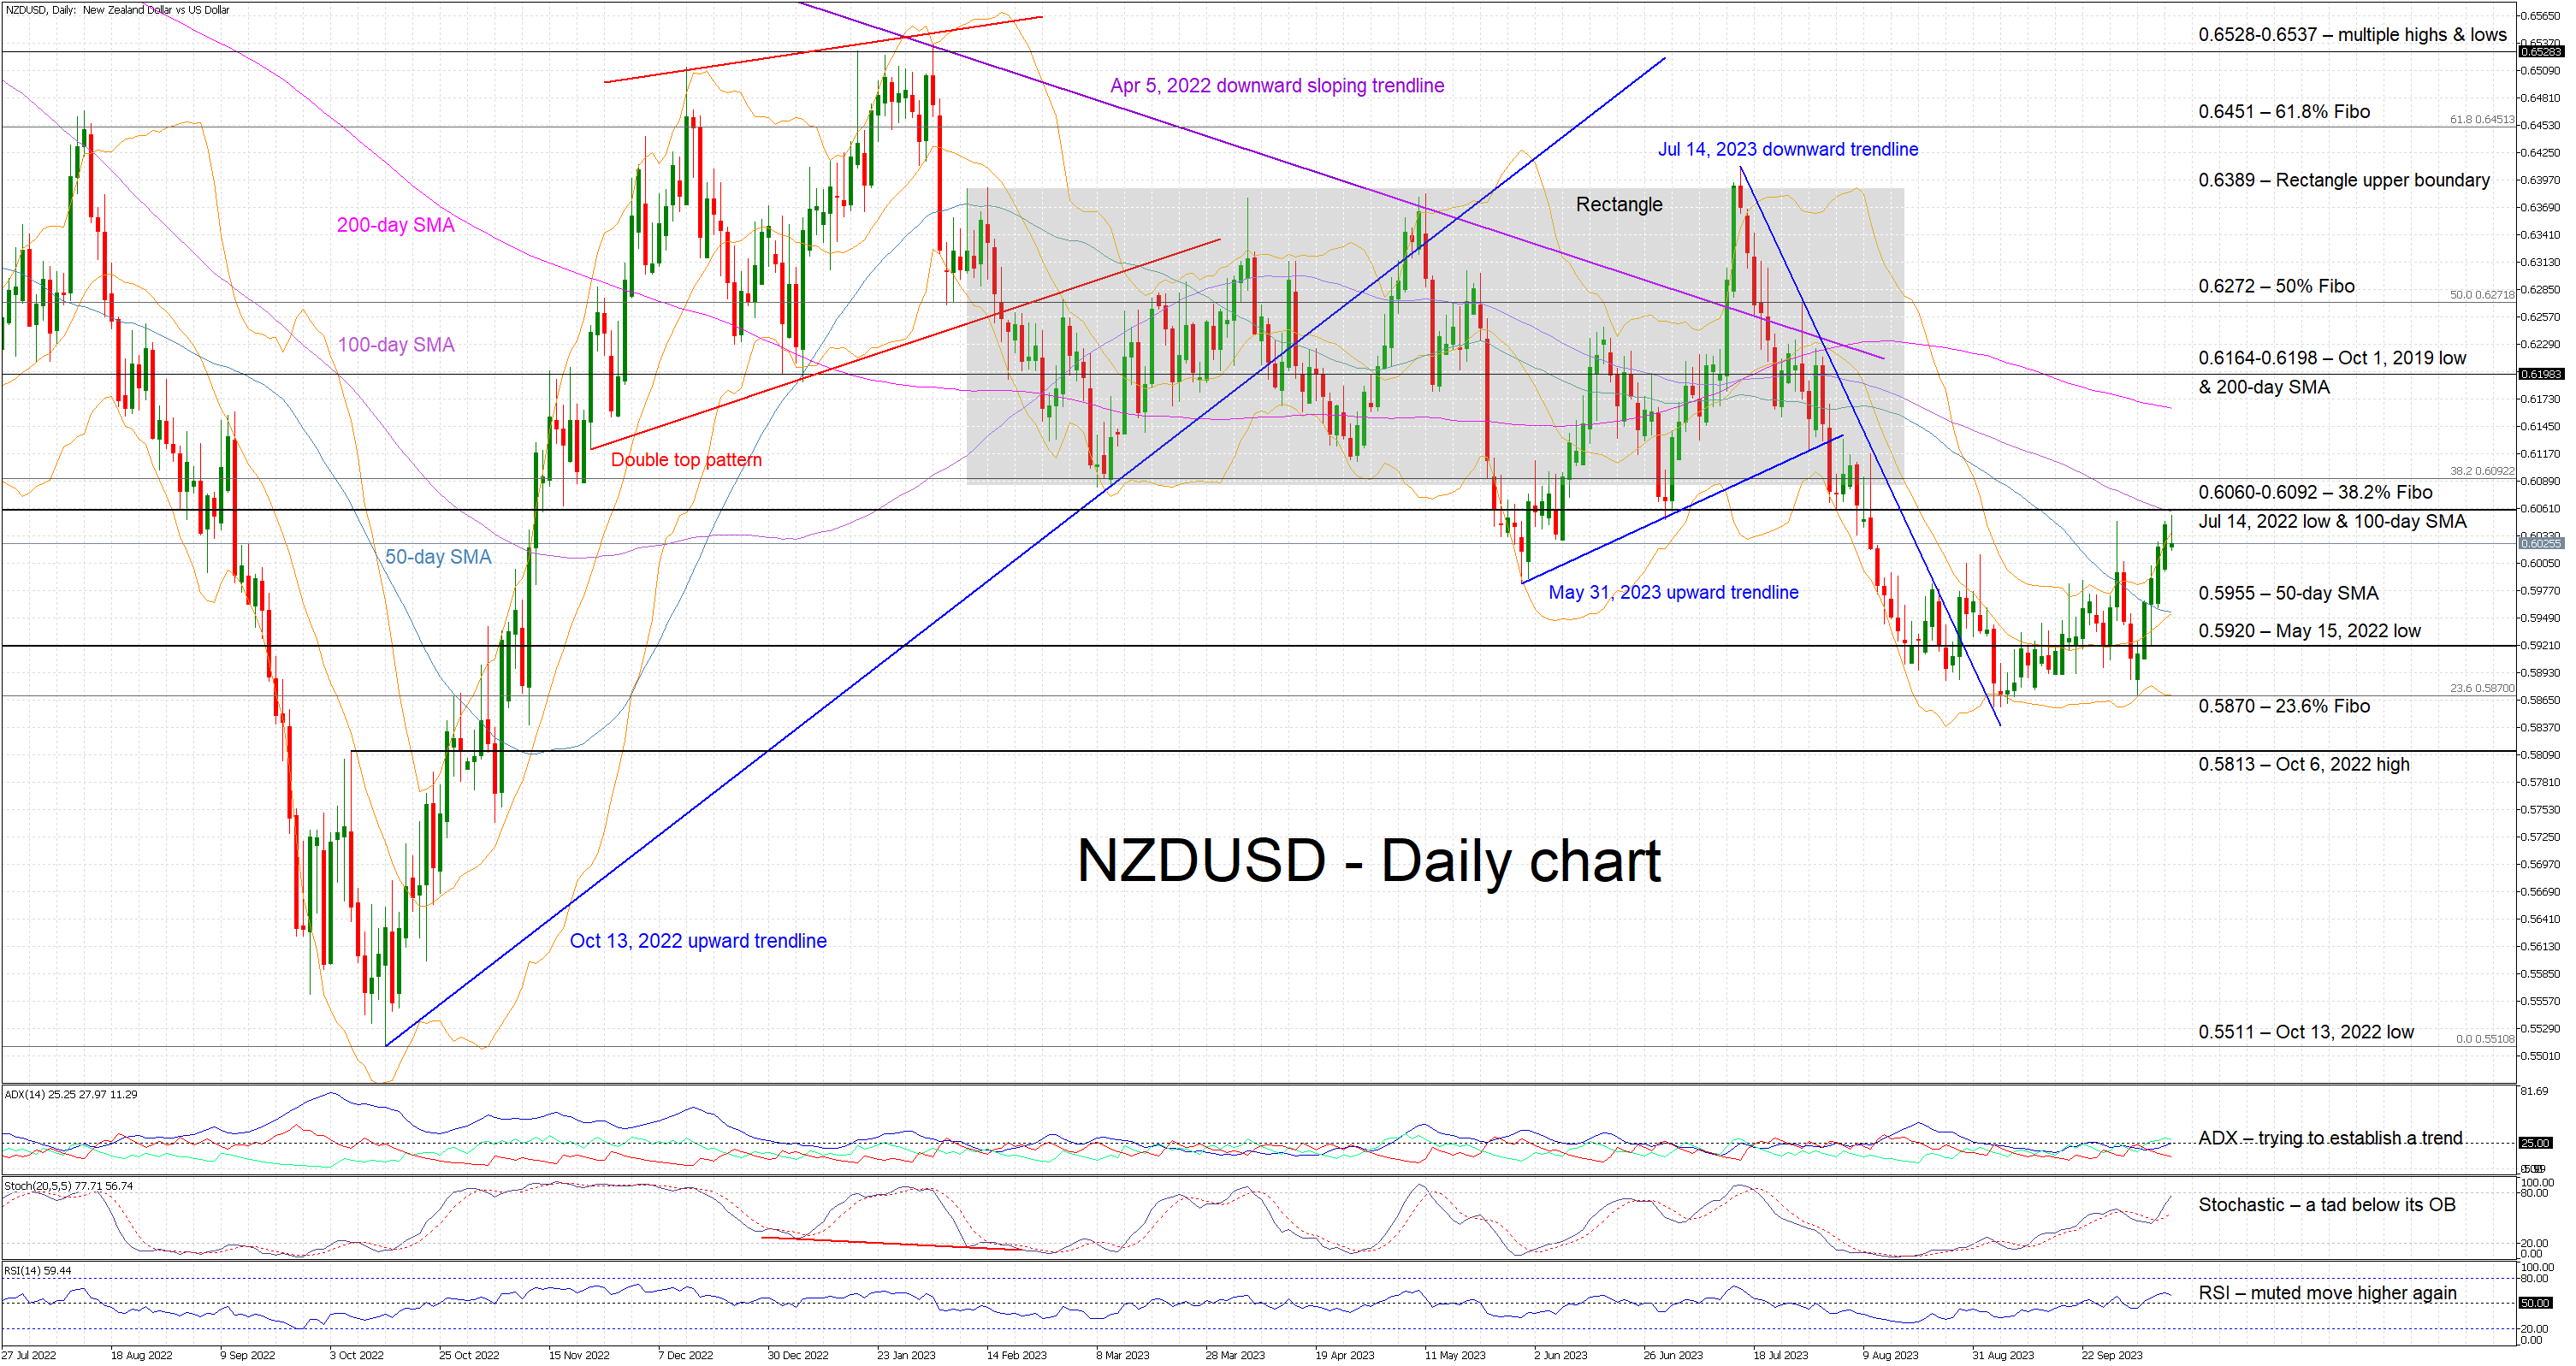
NZDUSD is trading sideways today after registering five strong green candles. It tested the 0.5870 level multiple times during September, but it failed to break it thus fuelling the current short-term rally. It has now reached a key resistance area, a tad below the lower boundary of the February-August rectangle.
Understandably, the focus is now on the momentum indicators and their likely support for the current move. More specifically, the Average Directional Movement Index (ADX) points to a weak bullish trend in the market, and the RSI remains a tad above its 50-midpoint. More importantly, the stochastic oscillator has jumped aggressively towards its overbought territory, potentially opening the door to a more protracted rally.
Should the bulls remain confident, they could try to overcome the busy 0.6060-0.6092 range, defined by the 38.2% Fibonacci retracement of the April 5, 2022 – October 13, 2022 downtrend, the July 14, 2022 low and the 100-day simple moving average (SMA). This would be the final step before pushing NZDUSD back inside the rectangle that has been in place since February 2023 and cancelling out the sell-off since early August.
On the flip side, the bears are probably determined to defend the key 0.6060-0.6092 area. If successful, they could then have a go at breaking the 0.5955 and 0.5920 levels set by the 50-day SMA and the May 15, 2022 low respectively. Even lower, the bears could then plot a course for the 23.6% Fibonacci retracement at 0.5870 that proved too strong during September.
To conclude, NZDUSD bulls have managed to stage a decent rally, but they probably need a break above the 0.6060-0.6092 range to confirm taking control of the market.
NZD/USD Analysis: Reaches a 2-month High
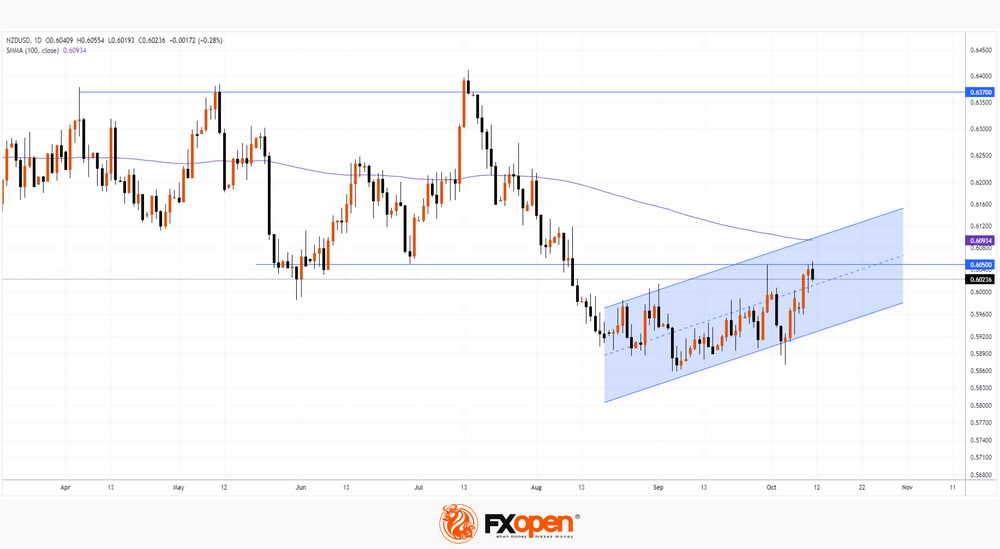
This morning, as the NZD/USD chart shows, one USD was worth 0.605 New Zealand dollar, for the first time since August 10.
The strengthening of NZD was facilitated by:
→ rumours that China is planning a major stimulus package to boost the economy amid the real estate crisis. And the Australian and New Zealand dollars, as one can see, are showing growth against the backdrop of positive news from China;
→ the weakness of the US dollar due to the fact that Fed members make it clear in their statements that it is no longer worth raising rates further.
Will the NZD/USD pair continue its upward trend?
The chart points to important bearish arguments:
→ the level of 0.605 previously served as long-term support. This can be seen from the price action in the spring-summer of this year. After the bearish breakout in the first half of August, this level has already shown its role as resistance, as seen in the September 29th candle;
→ exceeding the 0.605 level today, as well as the high on September 29, could be a trap for the bulls. A similar phenomenon can be seen on July 13-14, when the price exceeded previous local highs for only a short time. And, note, the current excess of the 0.605 level may also be very fleeting;
→ SMA (100) slopes down, indicating that bearish sentiment prevails over the long term.
News from the United States can have an important impact on the current situation. Statements by FOMC members are scheduled for today at 21:00 GMT+3 — be careful, spikes in volatility are likely.
This article represents the opinion of the Companies operating under the FXOpen brand only. It is not to be construed as an offer, solicitation, or recommendation with respect to products and services provided by the Companies operating under the FXOpen brand, nor is it to be considered financial advice.
EUR/USD Attempts Recovery While USD/CHF Revisits Support
EUR/USD started a recovery wave above the 1.0550 resistance. USD/CHF declined and now trading near the 1.0450 support zone.
Important Takeaways for EUR/USD and USD/CHF Analysis Today
- The Euro gained pace after it broke the 1.0550 resistance against the US Dollar.
- There is a major bullish trend line forming with support near 1.0570 on the hourly chart of EUR/USD at FXOpen.
- USD/CHF declined below the 0.9140 and 0.9080 support levels.
- There is a connecting bearish trend line forming with resistance near 0.9080 on the hourly chart at FXOpen.
EUR/USD Technical Analysis
On the hourly chart of EUR/USD at FXOpen, the pair started a recovery wave from the 1.0450 level. The Euro even cleared the 1.0485 barrier to move into a short-term bullish zone against the US Dollar.
The bulls pushed the pair above the 50-hour simple moving average and 1.0570. Finally, the pair tested the 1.0615 resistance. It is now consolidating gains above the 23.6% Fib retracement level of the upward wave from the 1.0519 swing low to the 1.0619 high.
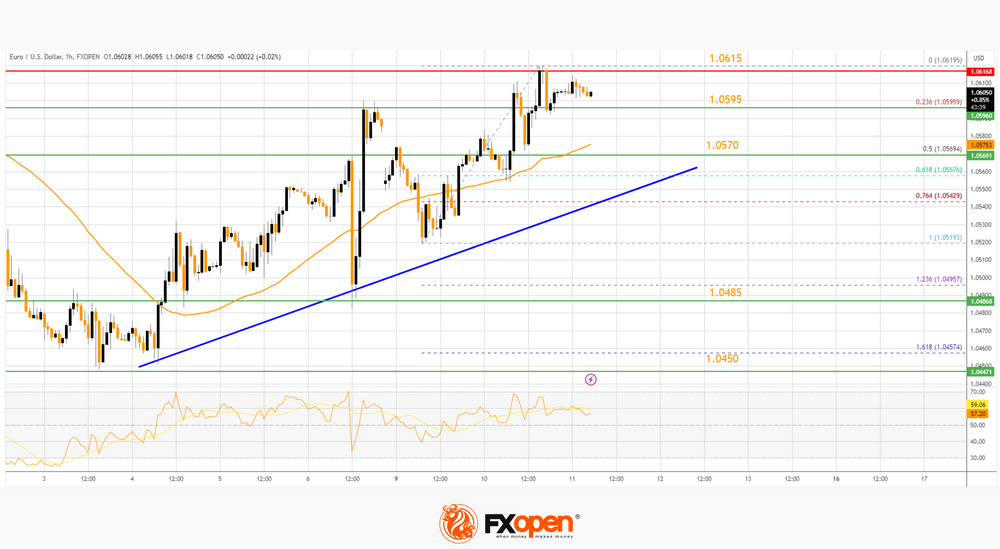
Immediate support on the downside is 1.0595. The next major support is near a bullish trend line at 1.0570 and the 50-hour simple moving average.
The trend line is close to the 50% Fib retracement level of the upward wave from the 1.0519 swing low to the 1.0619 high. A downside break below the 1.0570 support could send the pair toward the 1.0485 level.
Immediate resistance on the EUR/USD chart is near the 1.0615 zone. The first major resistance is near the 1.0650 level. An upside break above the 1.0650 level might send the pair toward the 1.0700 resistance.
The next major resistance is near the 1.0720 level. Any more gains might open the doors for a move toward the 1.0800 level.
USD/CHF Technical Analysis
On the hourly chart of USD/CHF at FXOpen, the pair started a fresh decline from the 0.9240 zone. The US Dollar dropped below the 0.9140 support to move into a negative zone against the Swiss Franc.
The bears pushed the pair below the 50-hour simple moving average and 0.9080. Finally, the bulls appeared near the 0.9035 level. A low is formed near 0.9034 and the pair is now consolidating losses.
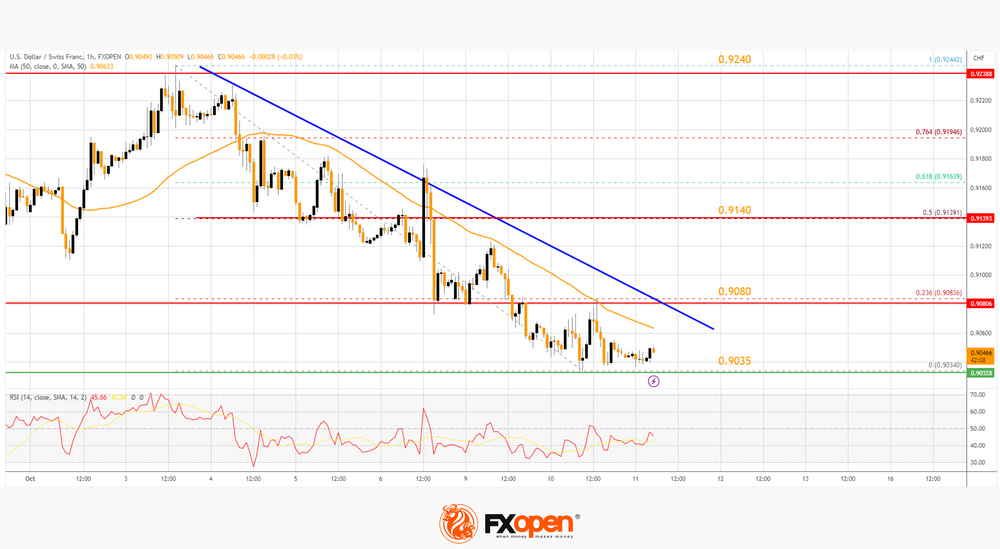
On the upside, the pair could face resistance near a connecting bearish trend line at 0.9080. The trend line is near the 23.6% Fib retracement level of the downward move from the 0.9244 swing high to the 0.9034 low.
The next major resistance is near the 0.9140 level or the 50% Fib retracement level of the downward move from the 0.9244 swing high to the 0.9034 low.
If there is a clear break above the 0.9140 resistance zone, the pair could start another increase. In the stated case, it could even surpass 0.9240.
On the downside, immediate support on the USD/CHF chart is 0.9035. The first major support is near the 0.9000 level. The next major support is near 0.8950. Any more losses may possibly open the doors for a move toward the 0.8880 level in the coming days.
This article represents the opinion of the Companies operating under the FXOpen brand only. It is not to be construed as an offer, solicitation, or recommendation with respect to products and services provided by the Companies operating under the FXOpen brand, nor is it to be considered financial advice.
Nasdaq 100 Technical: Potential Bearish Reversal Looms
- Counter trend rebound hit the 15,140 resistance.
- A bearish reversal candlestick was sighted at the close of yesterday’s US session which suggests that the recent two weeks of rally is unlikely the start of a new impulsive bullish move sequence.
- The recent pull-back seen in the US 10-year Treasury yield has almost reached its upward-sloping 20-day moving average now acting as a support at around 4.55% that may lead to a continuation of the medium-term uptrend of the Treasury yield.
- The start of a potential impulsive bullish move in the US 10-year Treasury yield may ignite renewed downside pressure in the Nasdaq 100.
In the past two weeks, the price actions of the US Nas 100 Index (a proxy for the Nasdaq 100 futures) have indeed shaped the expected counter trend rebound from its 28 September 2023 swing low of 14,450 and hit the 15,140 resistance. This recent bounce has been accompanied by a pull-back of 26 basis points in the US Treasury 10-year yield right below a key medium-term resistance at the 4.90% level (printed an intraday high of 4.88% on 4 October) to yesterday, 10 October low of 4.62%.
Right now, there are several technical elements and intermarket analysis that suggest that the US Nas 100 Index may start to shape a bearish reversal at this juncture as the release of the key US CPI data for September looms ahead on Thursday, 12 October.
Current pull-back in US 10-year Treasury yield has almost reached its 20-day moving average

Fig 1: 10-year UST yield medium-term trend as of 11 Oct 2023 (Source: TradingView, click to enlarge chart)
The recent four-week of steep up move seen in the US 10-year Treasury yield from its 1 September 2023 low to 4 October 2023 high has retraced towards the upward-sloping 20-day moving average now acting as support at around 4.55%.
In addition, the daily RSI indicator has already exited its overbought zone without any prior bearish divergence condition and managed to hold above a key parallel ascending support at the 52 level which suggests that the medium-term upside momentum of price actions remains intact.
Hence, there is an increased odds that the pull-back on the US 10-year Treasury yield may have ended and a potential new impulsive up move sequence is around the corner within its ongoing medium-term and major uptrend phases.
Given its recent significant indirect correlation with the price action movements of the Nasdaq 100, a further potential uptick in the US 10-year Treasury yield is likely to lead to another wave of bearish movement in the Nasdaq 100 at least in the short to medium-term.
Daily bearish reversal candlestick sighted in the Nasdaq 100
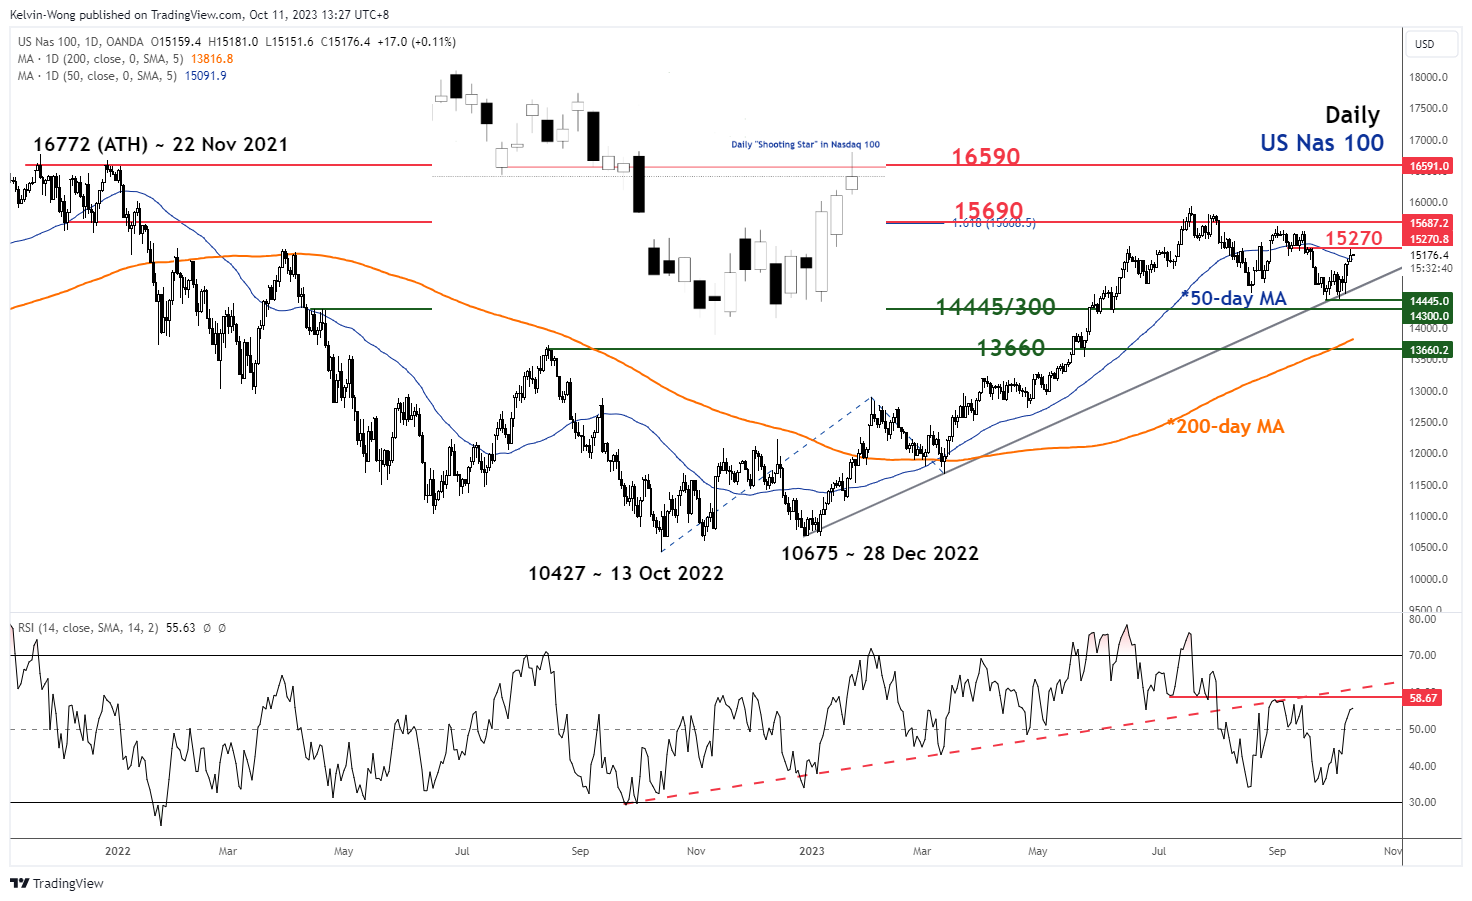
Fig 2: US Nas 100 medium-term trend as of 11 Oct 2023 (Source: TradingView, click to enlarge chart)
The last two days of positive up move seen in the Nasdaq 100 have been reinforced by a relatively dovish Fedspeak out from several US Federal Reserve officials where the majority has implied that there is an increasing possibility that the Fed is almost near the end of the current interest rate hiking cycle and coupled with a positive news flow out from China; the media reported that top policymakers are considering raising its budget deficit for 2023 that implies new fiscal stimulus may be enacted soon to halt the current severe liquidity crunch faced by major Chinese property developers.
Interestingly, yesterday’s intraday gains of +1.3% in the Nasdaq 100 were trimmed by almost half towards the US closing and ended the session near the bottom of its intraday range as well as slightly above the 50-day moving average where its price actions have traded below it since 15 September 2023.
In terms of technical analysis utilizing Japanese candlesticks, yesterday’s price actions of the Nasdaq 100 have formed a daily “Shooting Star” bearish reversal candlestick that indicates a potential significant swift change of sentiment from positive to negative.
This set of price action behaviour suggests that market participants on the aggregate were likely not confident of maintaining a continuation of bullish bias on the Nasdaq 100 seen in the past two weeks that may lead to profit-taking activities soon which increases the odds of further weakness in the Nasdaq 100 at least in the short-term.
Watch the 15,355 key short-term resistance
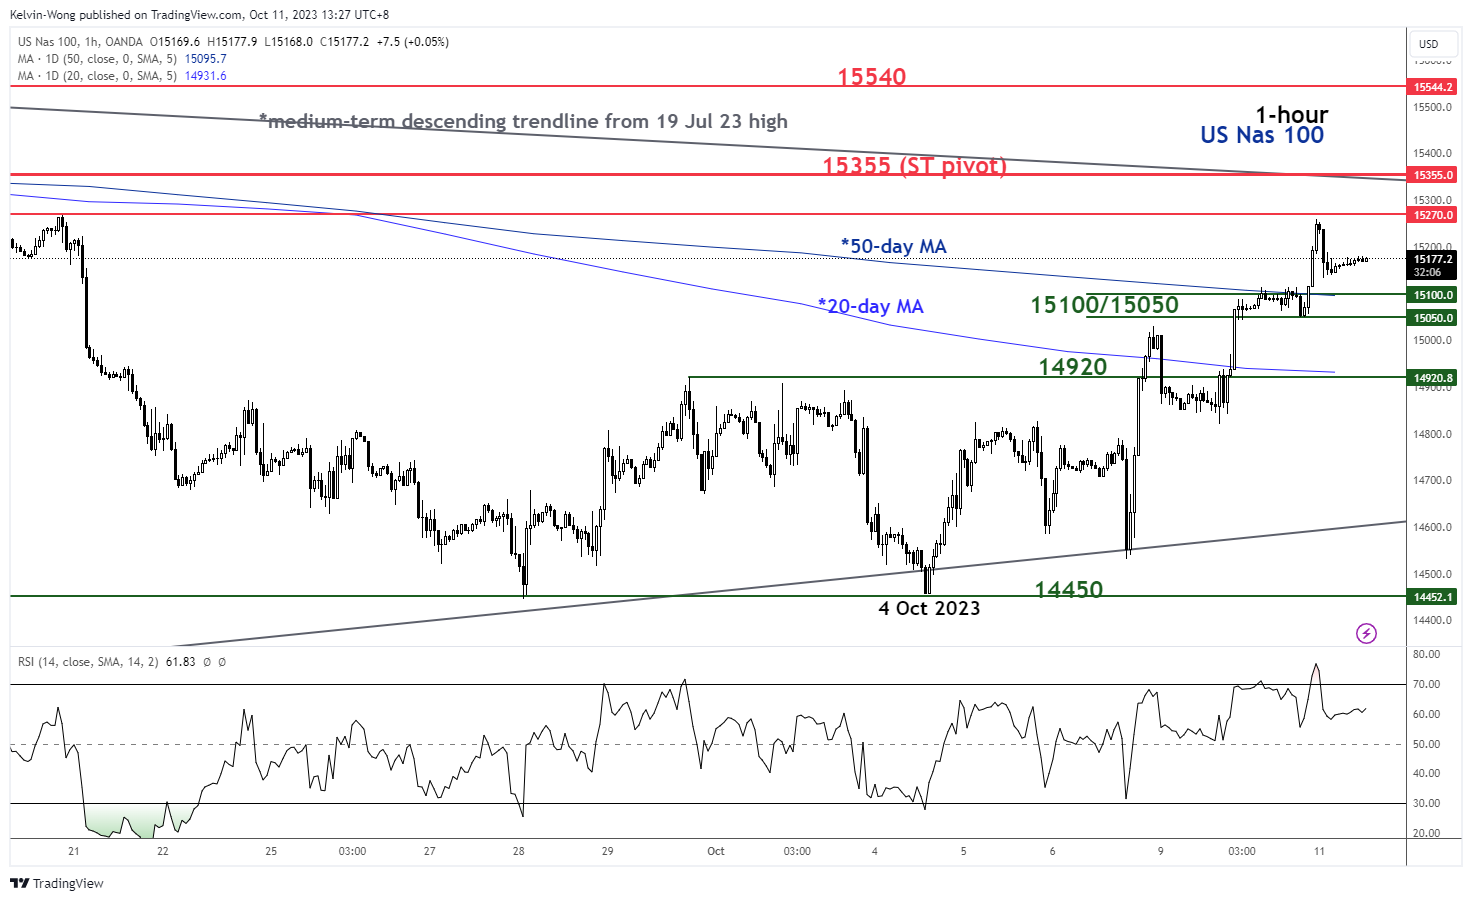
Fig 3: US Nas 100 minor short-term trend as of 11 Oct 2023 (Source: TradingView, click to enlarge chart)
As seen in the 1-hour chart, yesterday’s push-up in the price action of the US Nas 100 Index (a proxy for the Nasdaq 100 futures) is now coming close to the medium-term descending trendline in place since 19 July 2023 high now acting as resistance at 15,355 which also coincides with the 76.4% Fibonacci retracement of the recent decline from 1 September 2023 high to 27 September 2023 low.
If the 15,355 key short-term pivotal resistance is not surpassed, the Index may see a dip to the near-term support zone of 15,100/15,050 (also the 50-day moving average) and a break below it exposes the next intermediate support at 14,920 (also the 20-day moving average).
On the other hand, a clearance above 15,355 invalidates the bearish reversal scenario to see the next immediate resistance coming in at 15,540 (minor swing high areas of 4/6/15 September 2023).
Fed Minutes Probably Sound More Hawkish Compared to Debate on Yields
Markets
Global markets yesterday succeeded a surprising ‘all‐asset rebound’ with both bonds and equities gaining despite multiple indications that geopolitical tensions will unlikely disappear anytime soon. Central bank/Fed guidance was the dominant factor. (Some) Fed members including Vice Chair Jefferson, recently launched the thesis that tightening via higher LT bond yields might reduce the need for further Fed hikes. Fed Bostic yesterday also saw a good chance that rates have been raised enough. However, this is no consensus view and there are important nuances. Fed Daly of late also supported Jefferson’s view, but yesterday indicated that the neutral policy rate might have risen to the 2.5%‐3% range. Fed’s Kashkari was more balanced/agnostic on the impact of the rise in LT yields for Fed policy. However, markets are giving more weight to the dovish side of the story. A slight rise in the NY Fed’s inflation expectations was largely ignored. US yields fell between 14,8 bps (5‐y) and 11.1 bps (2‐y). Probably due to the sharp decline in yields yesterday, the $46bn US 3‐y Note auction only yielded a ‘mediocre’ outcome. German yields intraday tried a cautious rebound after Monday’s decline, but in the end the US‐driven trend was too strong. The German 2‐y yield gained modestly (+3.1 bps). The 30‐y eased 1 bp. Recent ‘tension’ on intra‐EMU government bond markets also eased with the 10‐y Italian spread vs Germany declining 11 bps (back at 1.95%). The combination of easing global monetary conditions and hope on additional fiscal stimulus in China, propelled equities. The Eurostoxx 50 added 2.25 % and revisits the previous range bottom near 4200. US indices gained 0.4%/0.6%. A context of sharply lower US (real) yields and an outright risk‐on sentiment, implied a further modest USD correction. DXY dropped from about 106.05 at the close on Friday to 105.75. EUR/USD tested the short‐term top near 1.062, but the (euro) momentum was unconvincing. USD/JPY even succeded a minor gain (close 148.7).
Asian equity markets join yesterday’s risk rally with Korea outperforming (2%+). US bonds are trading mixed with short‐term yields rising a few bps while the US long bond outperforms. Later today, we look out for the ECB CPI inflation expectations, US September PPI, and the FOMC minutes. Given recent Fed comments, the focus will be on the US. US PPI is expected at a rather moderate 0.3% M/M and 1.6% Y/Y. The Fed minutes probably sound more hawkish compared to the current debate on the impact of higher long‐term yields. The US 10‐y yield at the time of the meeting was about 50 bps below last week’s top. At that meeting, a majority of the Fed governors reconfirmed their view that at least one more hike was probably needed. We also look out for any internal debate on a higher neutral rate. Even so, we don’t expect tentatively hawkish minutes to derail the rebound in Treasuries. Short‐term developments suggest some USD softness with the 1.0635/1.043 area (previous low; 23% retracement since July top) first important resistance.
News and views
The NY Fed’s Household Survey showed that inflation expectations increased slightly at the 1‐yr and 3‐yr horizons (3.6% to 3.7% and 2.8% to 3%) while decreasing on the 5‐yr term (3% to 2.8%). Median inflation uncertainty increased slightly across all three horizons. Labor market expectations were mixed with unemployment expectations deteriorating and perceived job loss risk improving. Households’ perceptions and expectations for credit conditions deteriorated slightly. The average perceived probability of missing a minimum debt payment over the next three months increased by 1.4 percentage points to 12.5%, the highest reading since May 2020.
The FT reports that Bank of England officials are pushing for tighter liquidity requirement for GBP‐denominated money market funds. Under the recommendations, money market fonds would have to hold up 50% to 60% of their funds in assets that can be liquidated within 7 days compared to 30% currently. The guidance comes as the BoE published its quarterly financial stability statement in which it also warned for material leveraged positions in US Treasuries by hedge funds and the UK households are under pressure from higher living costs with a notable rise in the percentage of households with a high debt burden.
The Sweet Sound of Dovish Fed
The IMF lowered its global growth forecast to 2.9% but boosted its inflation projection from 5.2% to 5.8% for next year, warning the global central banks that they should hold on to their tight monetary policies if they want to keep inflation under control. That’s not something that investors wanted to hear. Happily, the overall market reaction to the IMF’s inflation forecast was: ‘whatever’. The US 2-year yield remained steady around the 5% level on the growing choir of Federal Reserve (Fed) members singing the dovish tune and the 10-year yield consolidated within the 4.60/4.65% range.
Due today, the FOMC minutes will remind investors that ‘the rates will stay higher for longer’ if inflation remains above target. Going into the data, the expectation is a mostly softening inflation both for producer and consumer prices. Despite the rising crude prices, US gasoline prices have been falling since mid-August due to a collapse in refiner margins. The latter could temper a seasonally strong September spending. But how long gasoline prices will remain on a falling path is yet to be seen. The risks in US yields remain tilted to the upside despite the dovish Fed talk and the safe haven inflows into the US treasuries following mounting tensions in the Middle East. The US 2-year yield remains 50bp above the upper range of the Fed funds policy target.
But anyway, regardless of toward where the risks are tilted, the softer yields please equity investors. The S&P500 extended its rebound into the third straight session yesterday, and Nasdaq pulled out its 50-DMA resistance and closed above this level. Chinese equities, on the other hand, rallied after the IMF recommended Beijing to take ‘forceful action’ on its real estate troubles, and on news that China was considering fresh stimulus measures to boost growth, anyway. Let’s see if this time is the charm – I am not convinced.
In the FX, the US dollar is giving back strength globally, the EURUSD extended gains above the 1.06 mark, and Cable is preparing to test the 1.23 offers.
The barrel of American crude sees solid support near the 50-DMA ($85.50pb level); mounting tensions in the Middle East threaten the bears; daring a short position in oil is risky beyond a corrective move. The good news is that OPEC now has a decent spare capacity to stabilize global oil prices thanks to their production cut strategy to push oil prices higher. The bad news is the cartel wants to see oil prices surge. In the actual geopolitical context, crude oil could further rise toward the $90 - $100pb range but a rise beyond the $100 level is unlikely with the morose global economic outlook. On the downside, we almost have insurance that the prices won’t sink below the $80pb level.
Natural Gas Prices rising further
Market movers today
Today is a quiet day on the data front and focus will likely remain on developments in the Israeli-Palestinian conflict.
US releases PPI while Fed members Bowman, Waller and Bostic will speak later today. Tonight the Fed releases minutes from the latest FOMC meeting.
The 60 second overview
Risk sentiment stayed robust yesterday with US equities adding 0.5% to Monday's gains. China is reported to weigh further stimulus by adding at least another CNY1 trillion (close to 1% of GDP) to fund infrastructure such as water conservatory projects.
Natural gas prices rose further yesterday, while oil prices stabilised. Multiple shocks have hit the natural gas market. Israel shut down part of its production and exports following the outbreak of the war with Hamas. Finland is investigating a leak on gas pipeline that may be due to external drone damage. Weather has turned colder in Northern Europe increasing heating demand. Finally, there is a risk of new strikes among LNG workers in Australia. The 1M TTF future rose close to EUR50/MWh yesterday - the highest since the spring, but still much lower than it was the same time last year.
The Fed's Daly said overnight that the neutral rate may be between 2.5 and 3%, higher than Fed's current long-term projection of 2.5% but still quite a bit below the 4% level that the market is pricing short rates to stay around for years to come. She also repeated her view that the run-up in long yields could substitute for another rate hike by the Fed. Another Fed member Neal Kashkari was a bit less dovish on the back of the rise in long yields than some of his colleagues saying that if the rise in yields reflected higher expectations of Fed hikes, the Fed would have to follow through on that to keep yields higher.
IMF yesterday released its World Economic Outlook and lifted its' global inflation forecast while stating that rates would have to stay high for longer. It is in line with what most central banks are communicating already, though.
In the Israel-Palestine conflict, Israel's military said it is building a base for thousands of soldiers in preparation for the next phase of its retaliation involving a ground offensive. Hamas said it was prepared to kill hostages if Israel attacks. In an emotional speech from the White House US President Biden reiterated his full support for Israel and called the deadly attacks by Hamas "an act of sheer evil".
Equities: Global equities were higher yesterday as yields came lower, while the conflict in Israel and Gaza seems to have little impact on investors. It was not a surprise that cyclicals were outperforming but more importantly, banks did well despite yields coming lower. In our opinion this illustrates the risk of being too negative and defensive currently. US indices were higher yesterday but ended quite a bit off the highest levels with Dow +0.4%, S&P 500 +0.5%, Nasdaq +0.6% and Russell 2000 +1.1%. Asian markets are mostly higher this morning with South Korea leading the advances. US futures are flat while European futures are a bit lower.
FI: There was a solid rally in US Treasuries heading into yesterday's session and yields finished the day 15bp lower as comments from various Federal Reserve officials indicate that the Federal Reserve is on hold for now. Bond markets will focus on more Fed speeches today as well as the minutes from the recent FOMC meeting up to the US inflation data released on Thursday.
FX: Benign risk sentiment, on the back of reports of looming Chinese stimulus and dovish Fed speeches, supported the SEK yesterday with EUR/SEK trading around 11.50. Natural gas prices rose further yesterday as multiple shocks hit the natural gas market including Israel shutting down part of its production following the outbreak of the conflict. EUR/NOK rose after a significant downside surprise in September inflation.
Credit: Credit markets rallied strongly yesterday after US equities brushed off the flare-up of the Israel-Palestine conflict over the weekend. Itrax main tightened 4.2bp to close at 82.8bp, while Itrax Xover tightened 19.8bp to close at 441.1bp. Primary market activity also returned, with among others Danish ship finance (BBB+) launching a euro benchmark deal.