Sample Category Title
Technical Outlook and Review
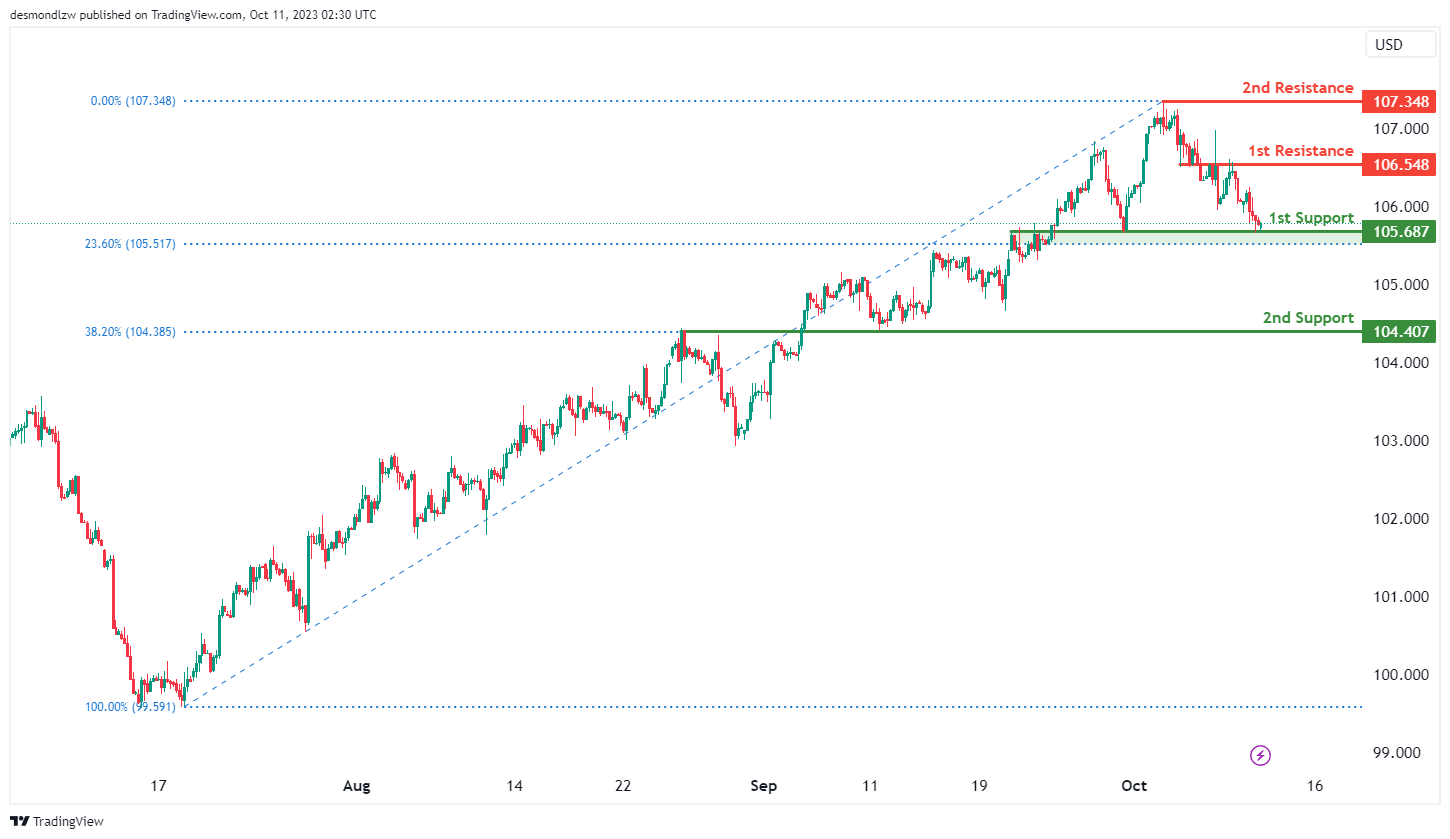
DXY:
The DXY (US Dollar Index) chart currently exhibits a weak bullish momentum with a potential for price to make a bullish bounce off the 1st support level and move higher.
The 1st support level at 105.69 is identified as an overlap support that aligns close to the 23.60% Fibonacci retracement level. Additionally, the 2nd support level at 104.41 is also noted as an overlap support that aligns with the 38.20% Fibonacci retracement level, further reinforcing its significance as a potential area where price could find support.
To the upside, the 1st resistance level at 106.55 is identified as an overlap resistance. Further up, the 2nd resistance level at 107.35 is noted as a swing-high resistance, indicating its potential role as a barrier to upward movements.
EUR/USD:
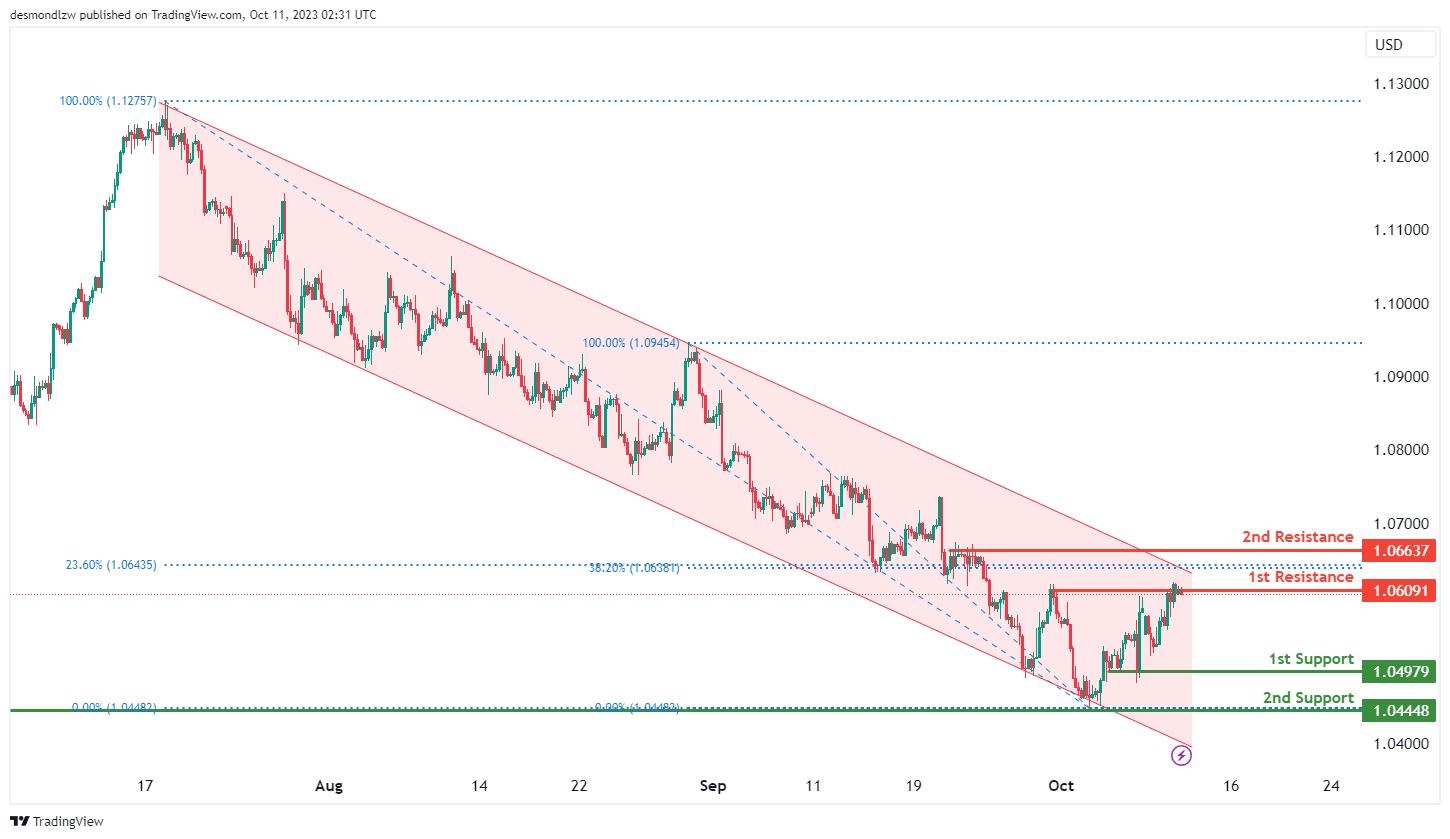
The EUR/USD chart currently exhibits a weak bearish momentum with price trading within the bearish descending channel. There is a potential for price to make a bearish reaction off the 1st resistance level and fall towards the 1st support level.
The 1st resistance level at 1.0609 is identified as a pullback resistance. Additionally, the 2nd resistance level at 1.0664 is also noted as a pullback resistance that aligns close to a confluence of Fibonacci levels i.e. the 23.60% retracement and the 38.20% retracement levels, suggesting that it may act as a barrier to upward movements.
To the downside, the 1st support level at 1.0498 is identified as a pullback support while the 2nd support at 1.0445 is also noted as a pullback support, making it an important level for potential price support.
EUR/JPY:
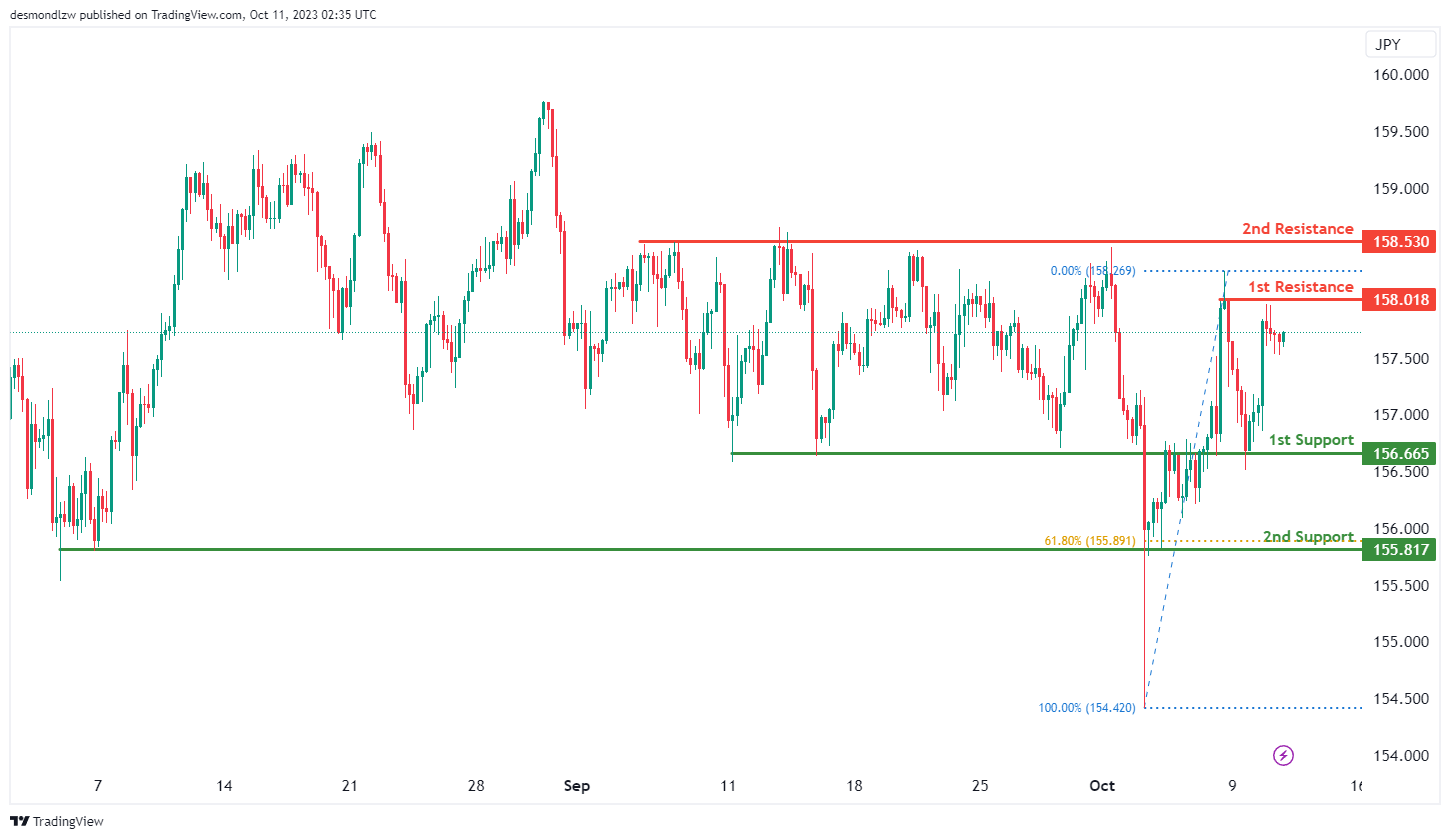
The EUR/JPY chart currently exhibits an overall bullish momentum with a potential for price to make a bullish continuation towards the 1st resistance level.
The 1st resistance level at 158.02 is identified as a swing-high resistance. Higher up, the 2nd resistance level at 158.53 is noted as a multi-swing-high resistance, suggesting that it may act as a barrier to upward movements.
To the downside, the 1st support level at 156.67 is identified as an overlap of support. Additionally, the 2nd support level at 155.82 is marked as a pullback support that aligns with a 61.80% Fibonacci retracement level, making it an important level for potential price support.
EUR/GBP:
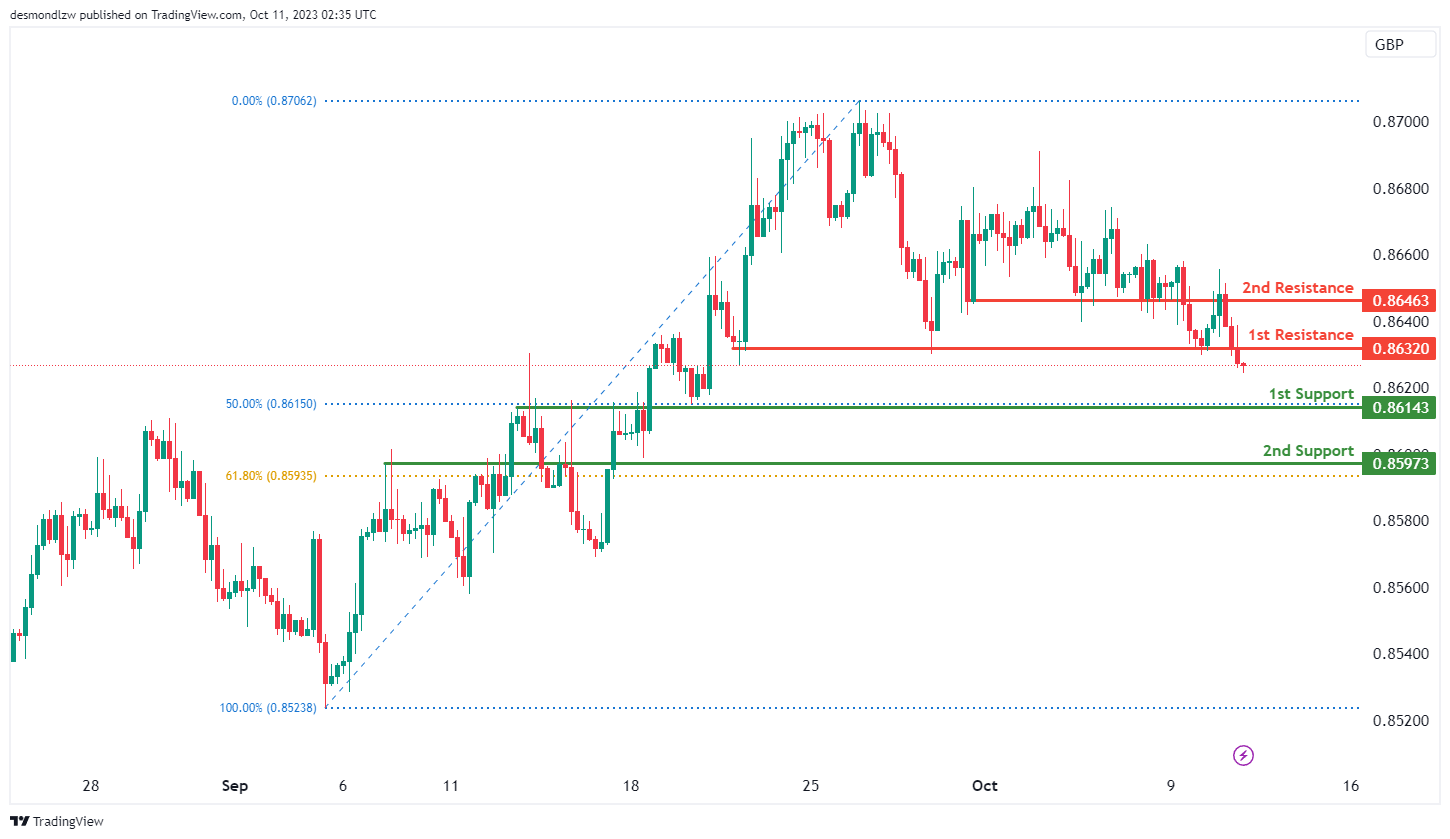
The EUR/GBP chart currently exhibits an overall bearish momentum with a potential for price to make a bearish continuation towards the 1st support level.
The 1st support level at 0.8614 is identified as an overlap support that aligns with the 50.00% Fibonacci retracement level. Additionally, the 2nd support level at 0.8597 is also marked an overlap of support that aligns with the 61.80% Fibonacci retracement level, making it an important level for potential price support.
To the upside, the 1st resistance level at 0.8632 is identified as a pullback resistance. The 2nd resistance level at 0.8646 is also noted as a pullback resistance, suggesting that it may act as a barrier to upward movement.
GBP/USD:
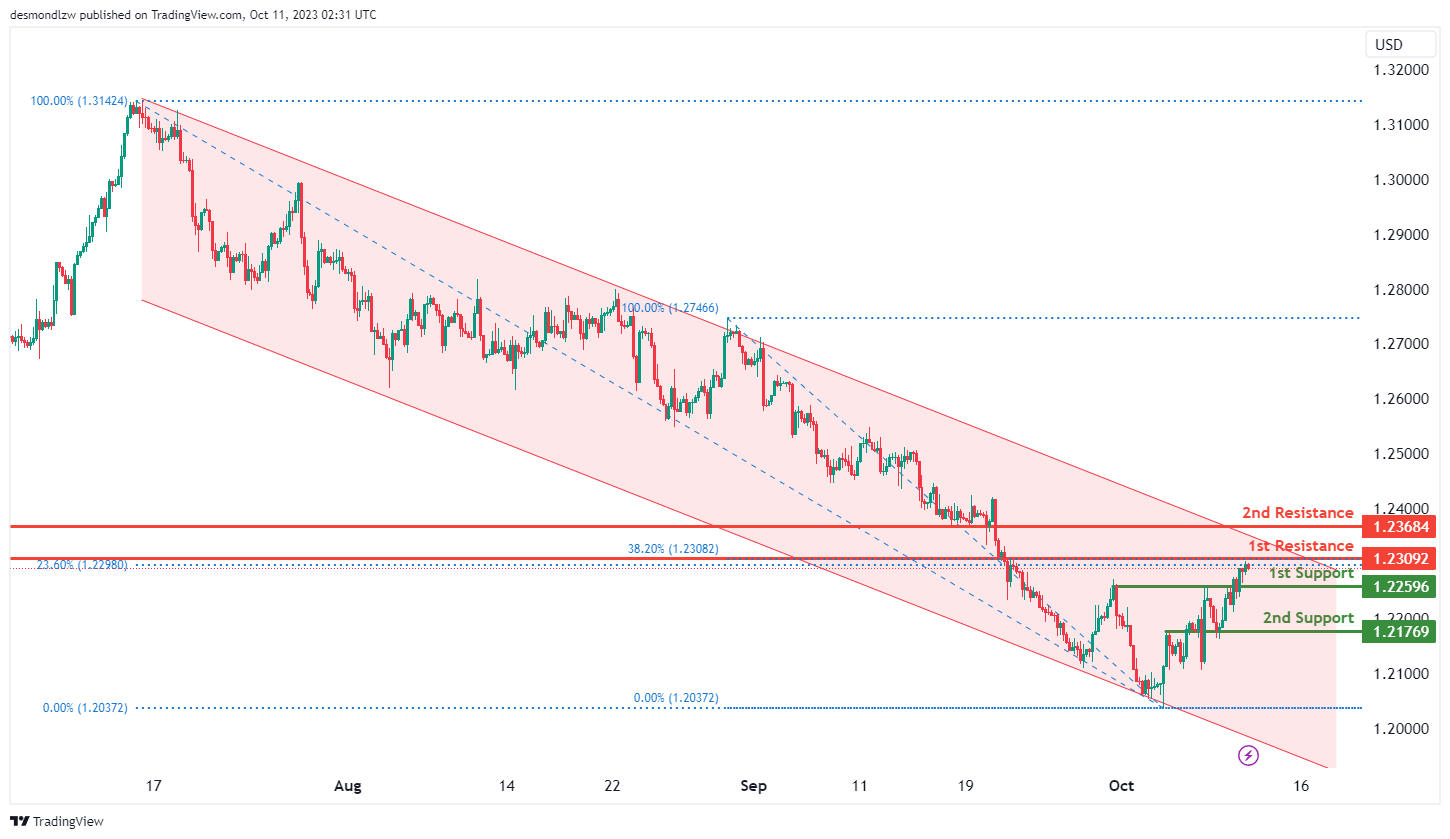
The GBP/USD chart currently exhibits an overall bearish momentum with price trading within the bearish descending channel. There is a potential for price to make a bearish reaction off the 1st resistance level and fall towards the 1st support level.
The 1st resistance level at 1.2309 is identified as a pullback resistance that aligns with a confluence of Fibonacci levels i.e. the 23.60% retracement and the 38.20% retracement levels. Beyond this, the 2nd resistance level at 1.2368 is also noted as a pullback resistance, suggesting it may act as a barrier to upward movements.
To the downside, the 1st support level at 1.2259 is identified as a pullback support. Additionally, the 2nd support level at 1.2177 is noted as an overlap support, further reinforcing its significance as a potential area where price could find support.
GBP/JPY:
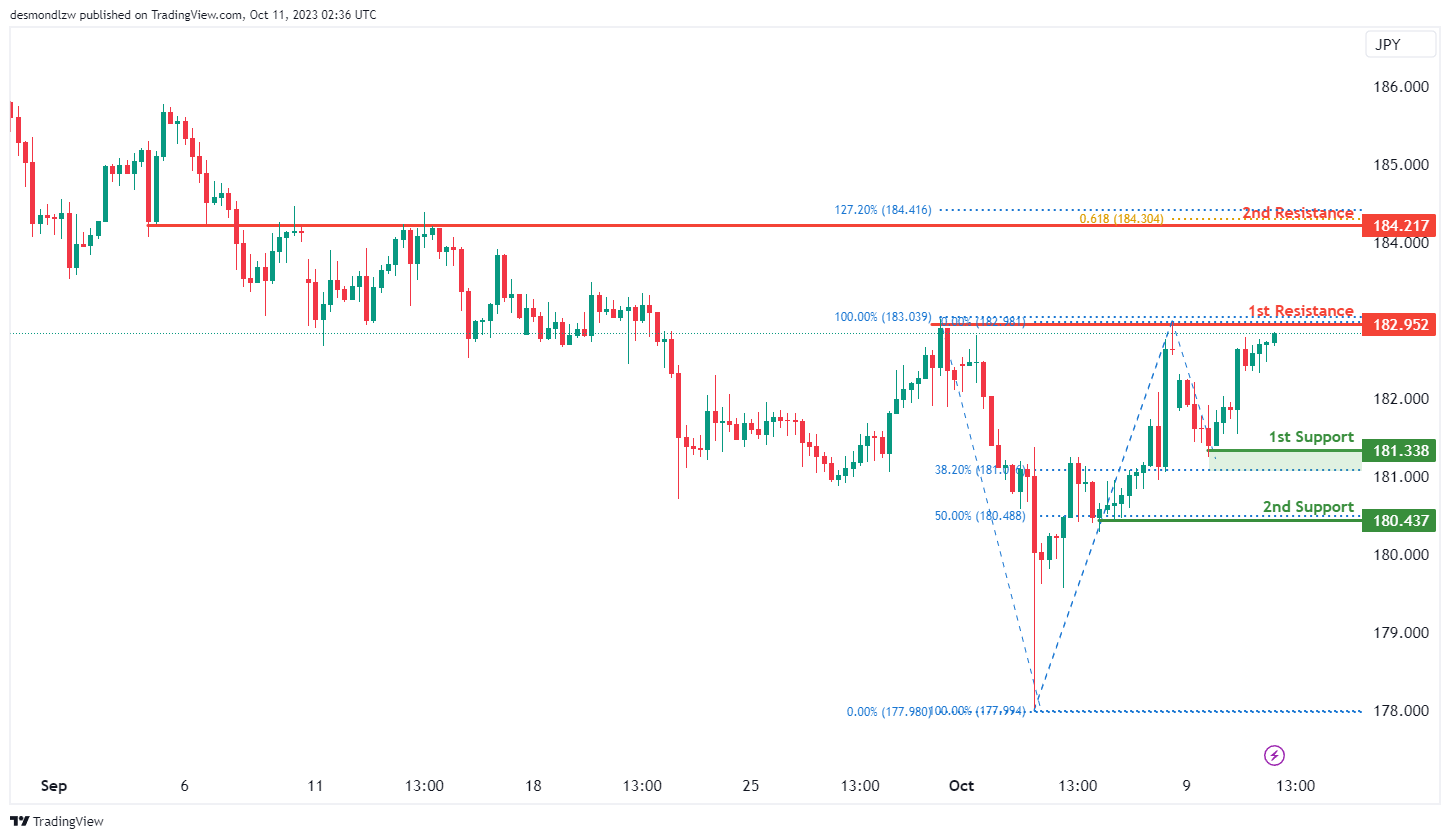
The GBP/JPY chart currently exhibits an overall bullish momentum with a potential for price to make a bullish continuation towards the 1st resistance level.
The 1st resistance level at 182.95 is identified as a multi-swing-high resistance. Beyond this, the 2nd resistance level at 184.22 is noted as an overlap resistance that aligns with a confluence of Fibonacci levels i.e. the 127.20% extension and the 61.80% projection levels.
To the downside, the 1st support level at 181.34 is identified as a pullback support that aligns close to the 38.20% Fibonacci retracement level. Additionally, the 2nd support level at 180.44 is also marked as a pullback support that aligns with the 50.00% Fibonacci retracement level.
USD/CHF:
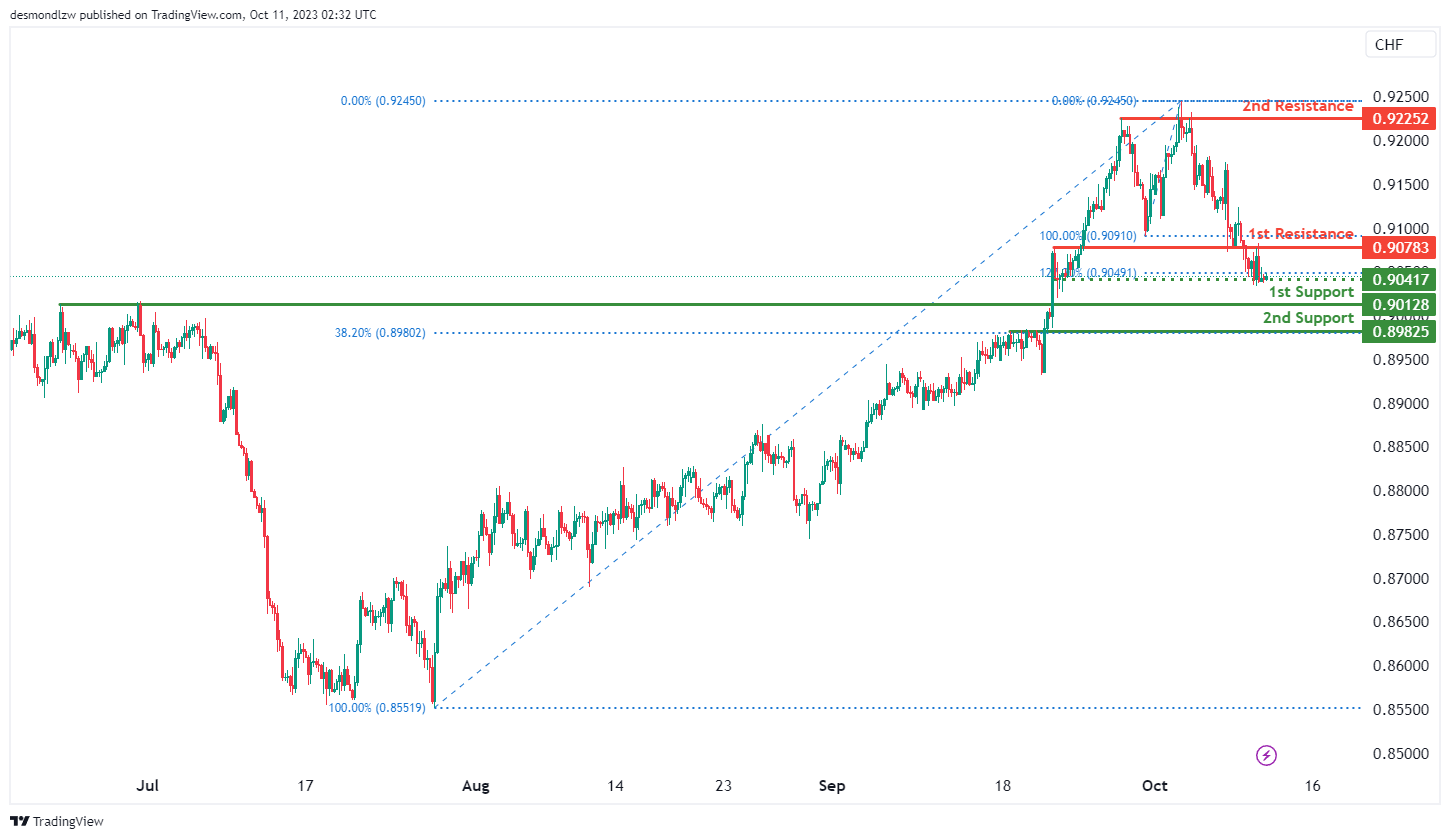
The USD/CHF chart currently exhibits an overall bearish momentum. Should price break below the intermediate support level, there is a potential for price to make a bearish continuation towards the 1st support level.
The intermediate support level at 0.9042 is identified as a pullback support that aligns close to the 127.20% Fibonacci extension level while the 1st support level at 0.9013 is also noted as a pullback support. Additionally, the 2nd support level at 0.8983 is identified as a pullback support that aligns with the 38.20% Fibonacci retracement level, further reinforcing its significance as an area where the price may find support.
To the upside, the 1st resistance level at 0.9078 is identified as an overlap resistance. Higher up, the 2nd resistance level at 0.9225 is noted as a multi-swing-high resistance, acting as a potential barrier to further price increases.
USD/JPY:
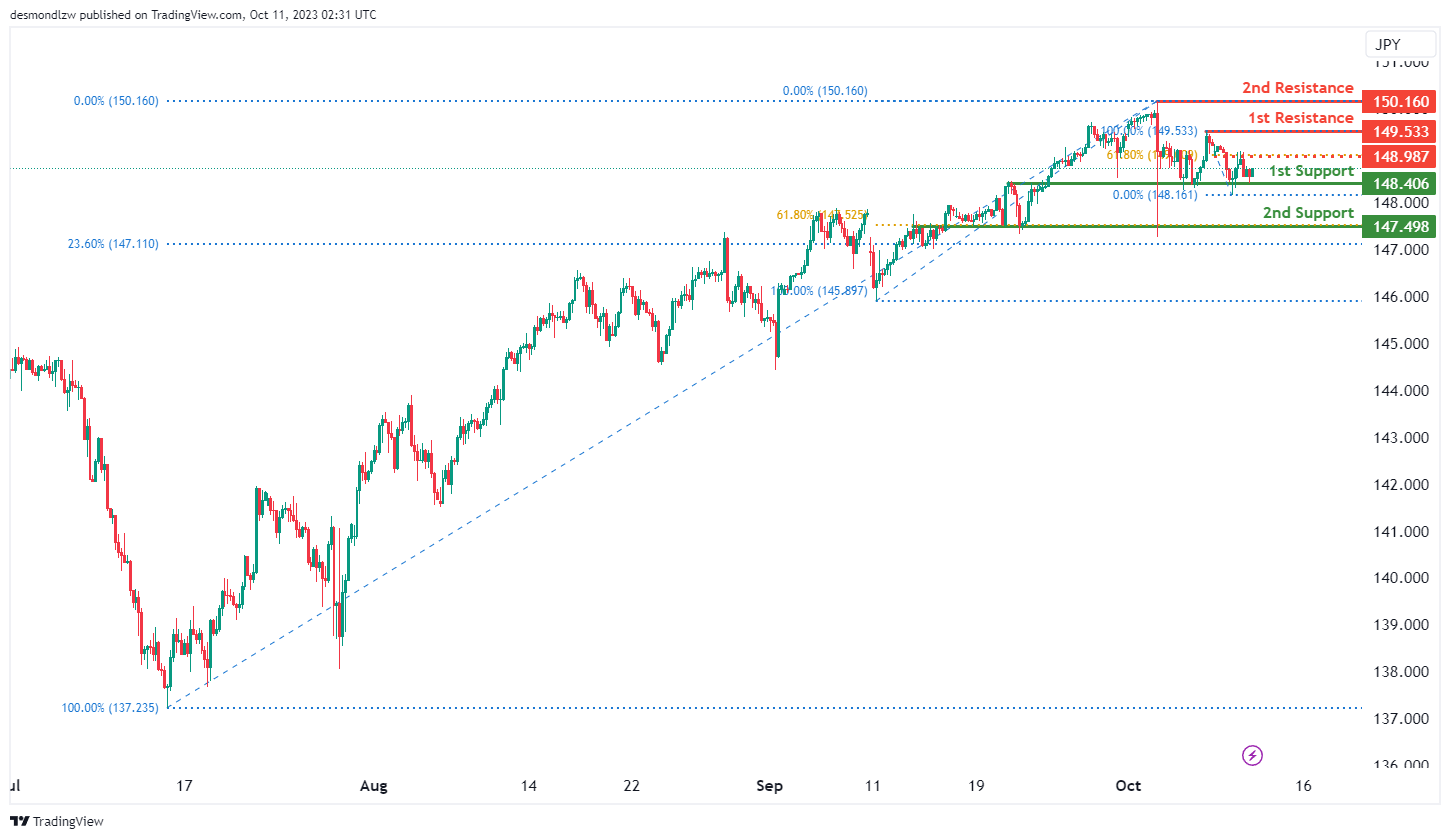
The USD/JPY chart currently exhibits a weak bullish momentum with a potential for price to make a bullish bounce off the 1st support level and rise towards the 1st resistance level should price break above the intermediate resistance.
The intermediate resistance level at 148.99 is identified as an overlap resistance that aligns with the 61.80% Fibonacci retracement level while the 1st resistance level at 149.53 is noted as a pullback resistance. Higher up, the 2nd resistance level at 150.16 is identified as a swing-high resistance, acting as a potential barrier to further price increases.
The 1st support level at 148.41 is identified as an overlap support. Further below, the 2nd support at 147.49 is also noted as an overlap support that aligns with a confluence of Fibonacci levels i.e. the 23.60% retracement and the 61.80% retracement levels, further reinforcing its significance as an area where the price may find support.
USD/CAD:
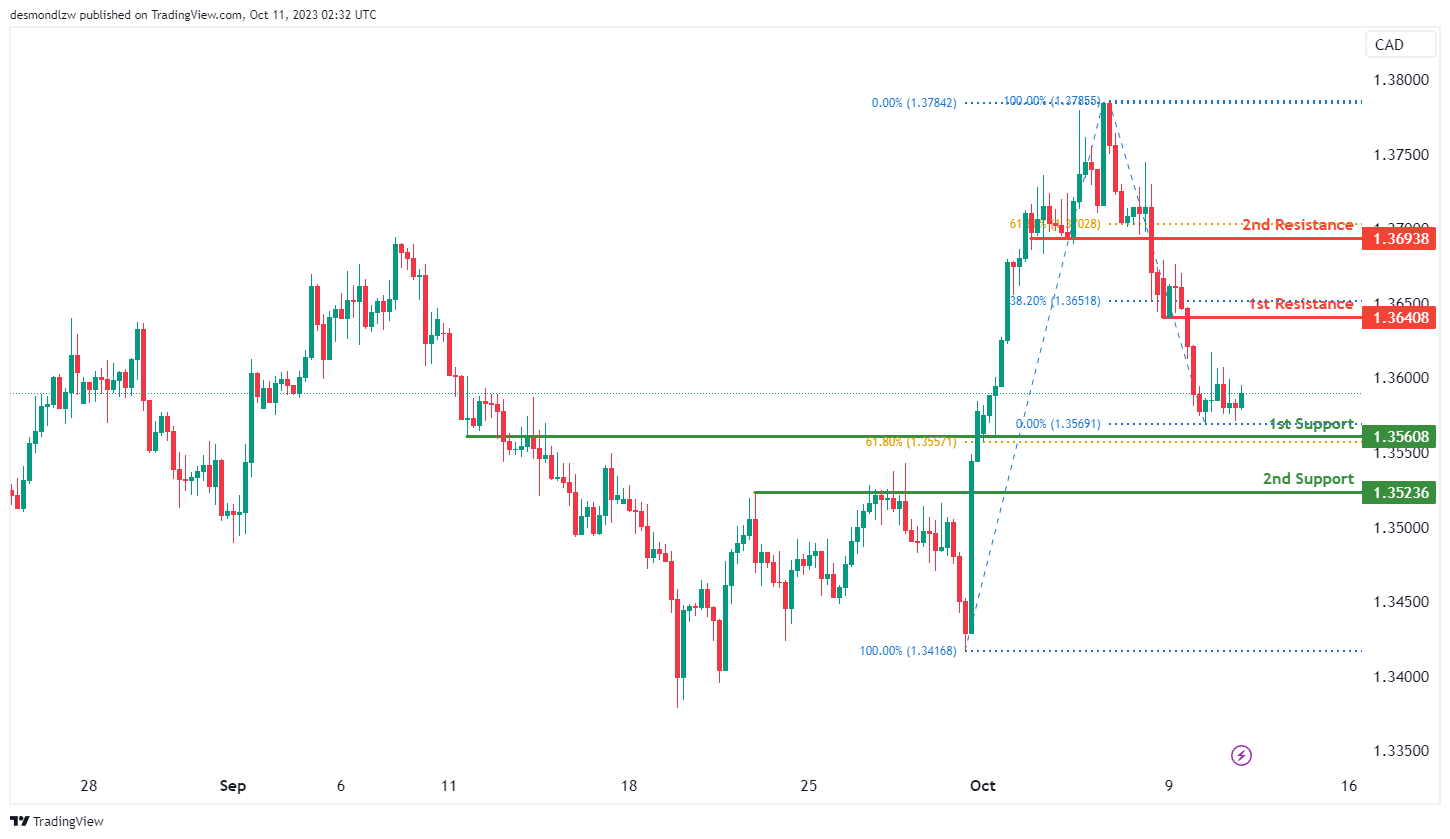
The USD/CAD chart is currently showing an overall bullish momentum with a potential for price to make a bullish bounce off the 1st support level and rise towards the 1st resistance level.
The 1st support level at 1.3561 is identified as an overlap support that aligns with the 61.80% Fibonacci retracement level. Additionally, the 2nd support level at 1.3524 is noted as a pullback support, further reinforcing its significance as an area where the price may find support.
To the upside, the 1st resistance level at 1.3641 is identified as a pullback resistance that aligns close to the 38.20% Fibonacci retracement level. Higher up, the 2nd resistance level at 1.3694 is also noted as a pullback resistance that aligns close to the 61.80% Fibonacci retracement level, further emphasizing its significance as a barrier for future price increases.
AUD/USD:
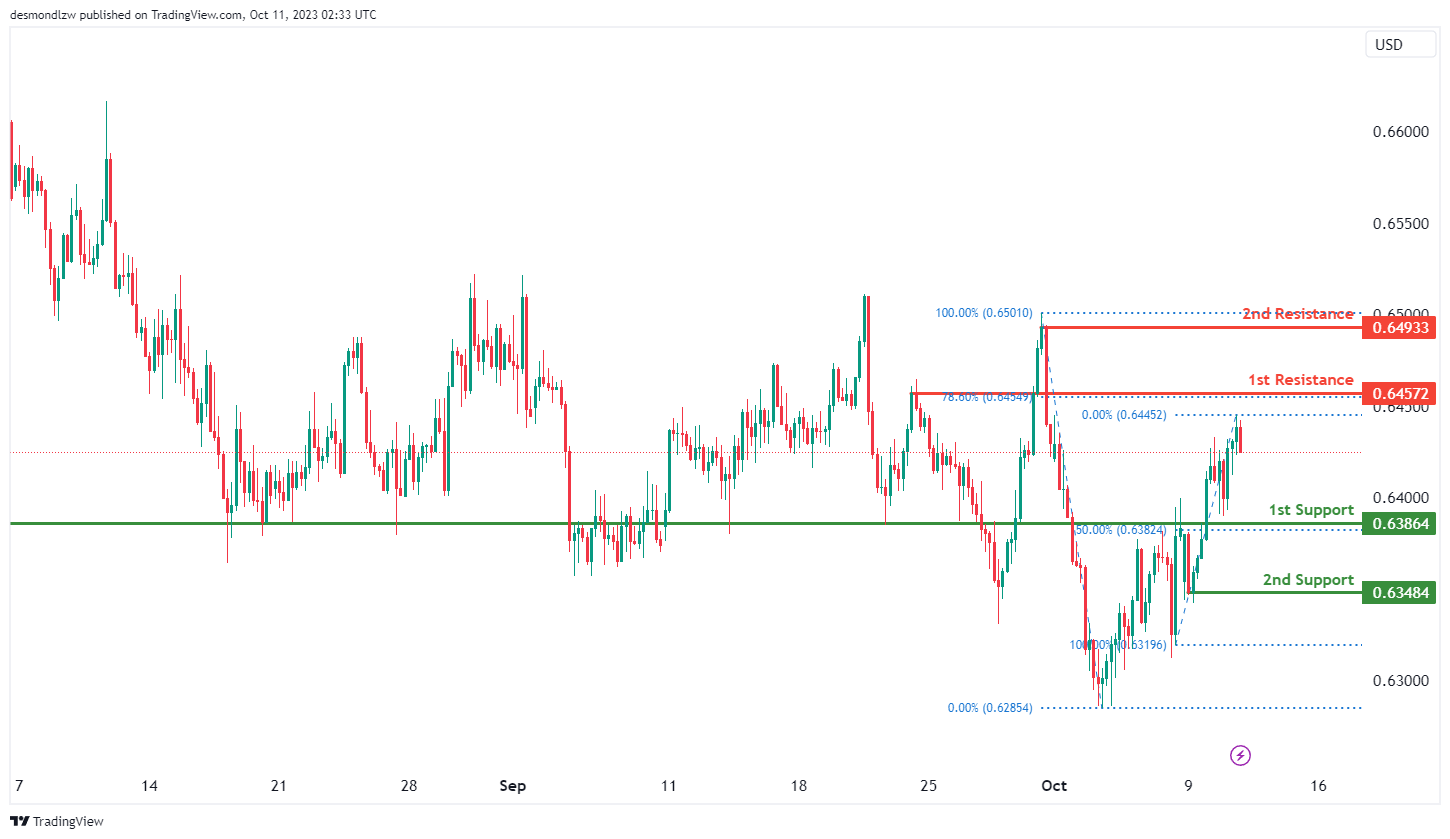
The AUD/USD chart currently exhibits a neutral momentum with a potential scenario for price to fluctuate between the 1st resistance and the 1st support levels.
The 1st support level at 0.6386 is identified as an overlap support that aligns with the 50.00% Fibonacci retracement level. Further below, the 2nd support level at 0.6348 is marked as a pullback, reinforcing its importance as a potential support level.
To the upside, the 1st resistance level at 0.6457 is identified as a swing-high resistance that aligns with the 78.60% Fibonacci retracement level. Additionally, the 2nd resistance level at 0.6493 is also noted as a swing-high resistance, further emphasizing its significance as a barrier for future price increases.
NZD/USD
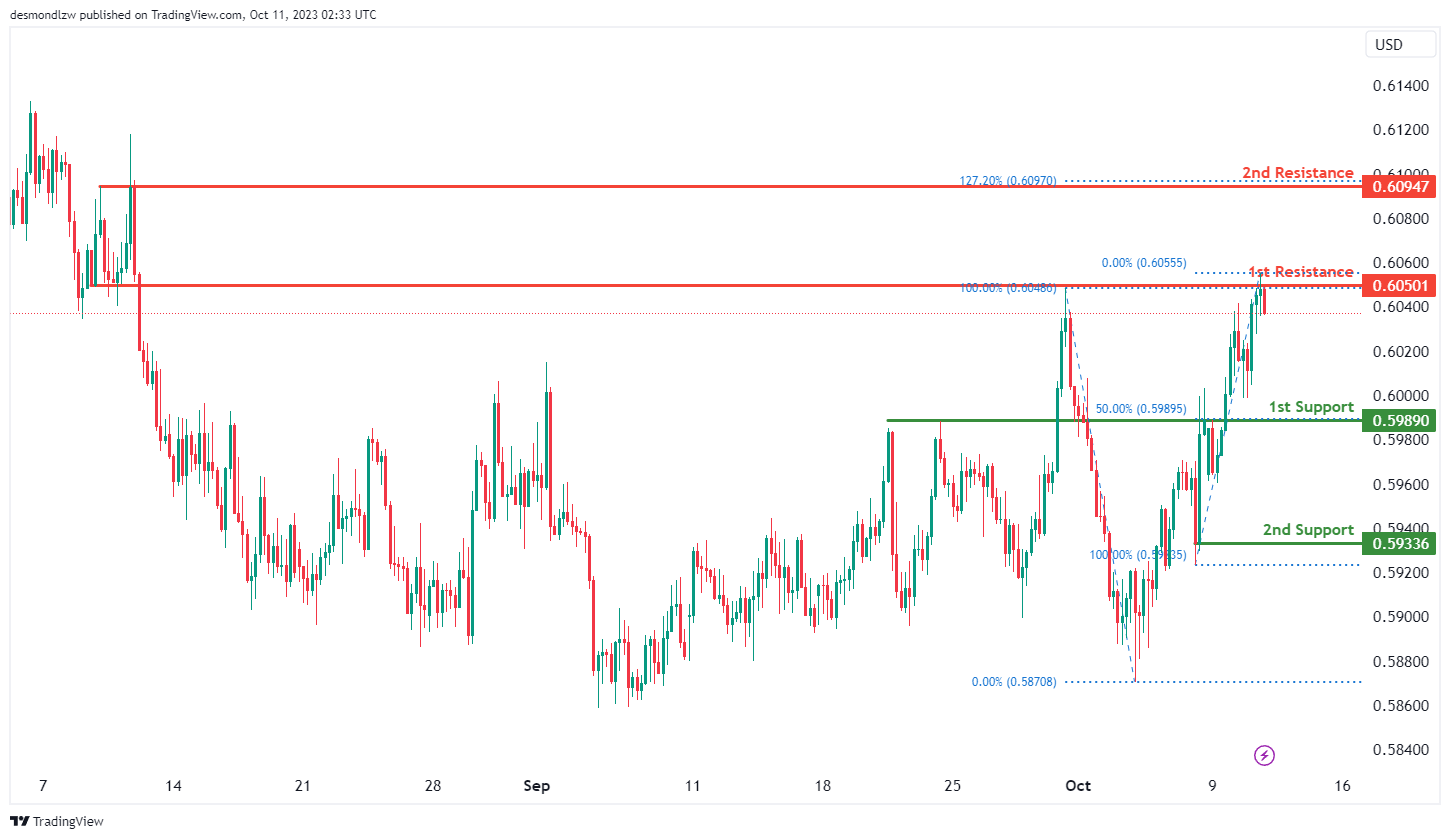
The NZD/USD chart currently exhibits an overall bearish momentum with a potential scenario for price to make a bearish reaction off the 1st resistance level and fall towards the 1st support level.
The 1st resistance level at 0.6050 is identified as an overlap resistance. Additionally, the 2nd resistance level at 0.6095 is marked as a pullback resistance that aligns with the 127.20% Fibonacci extension level, further emphasizing its significance as a barrier for future price increases.
To the downside, the 1st support level at 0.5989 is identified as an overlap support that aligns with the 50.00% Fibonacci retracement level. Further below, the 2nd support level at 0.5934 is noted as a pullback support, further reinforcing its significance as an area where price may find support.
DJ30:
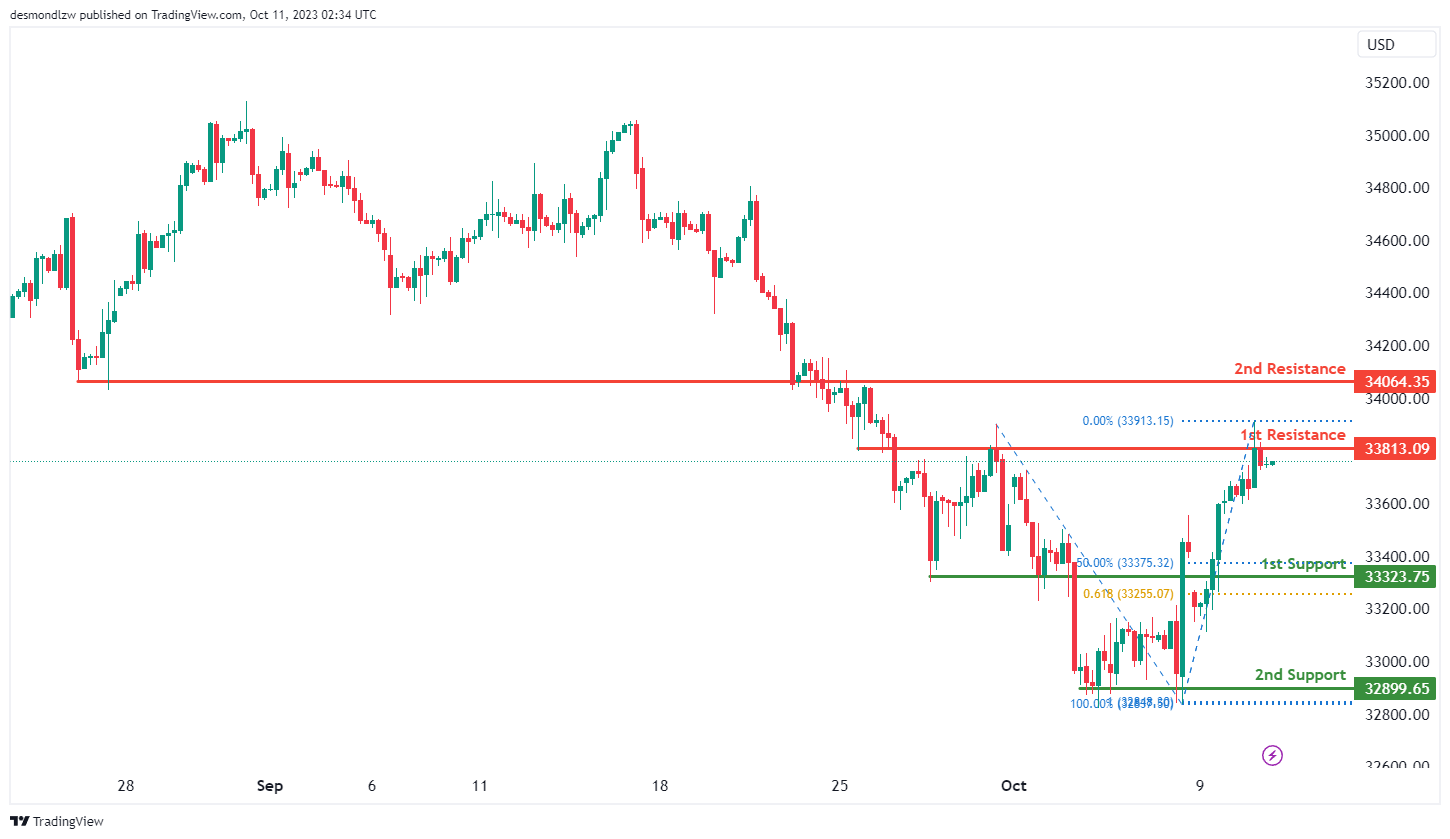
The Dow Jones (DJ30) chart is currently showing an overall bullish momentum with a potential for price to make a bullish continuation towards the 1st resistance level.
The 1st resistance level at 33,813.09 is identified as an overlap resistance. Beyond this, the 2nd resistance level at 34,060.35 is also noted as an overlap resistance.
To the downside, the 1st support level at 33,323.75 is identified as a pullback support that aligns with a confluence of Fibonacci levels i.e. the 50.00% retracement and the 61.80% projection levels. Additionally, the 2nd support level at 32,899.65 is also marked as a pullback support.
GER40:
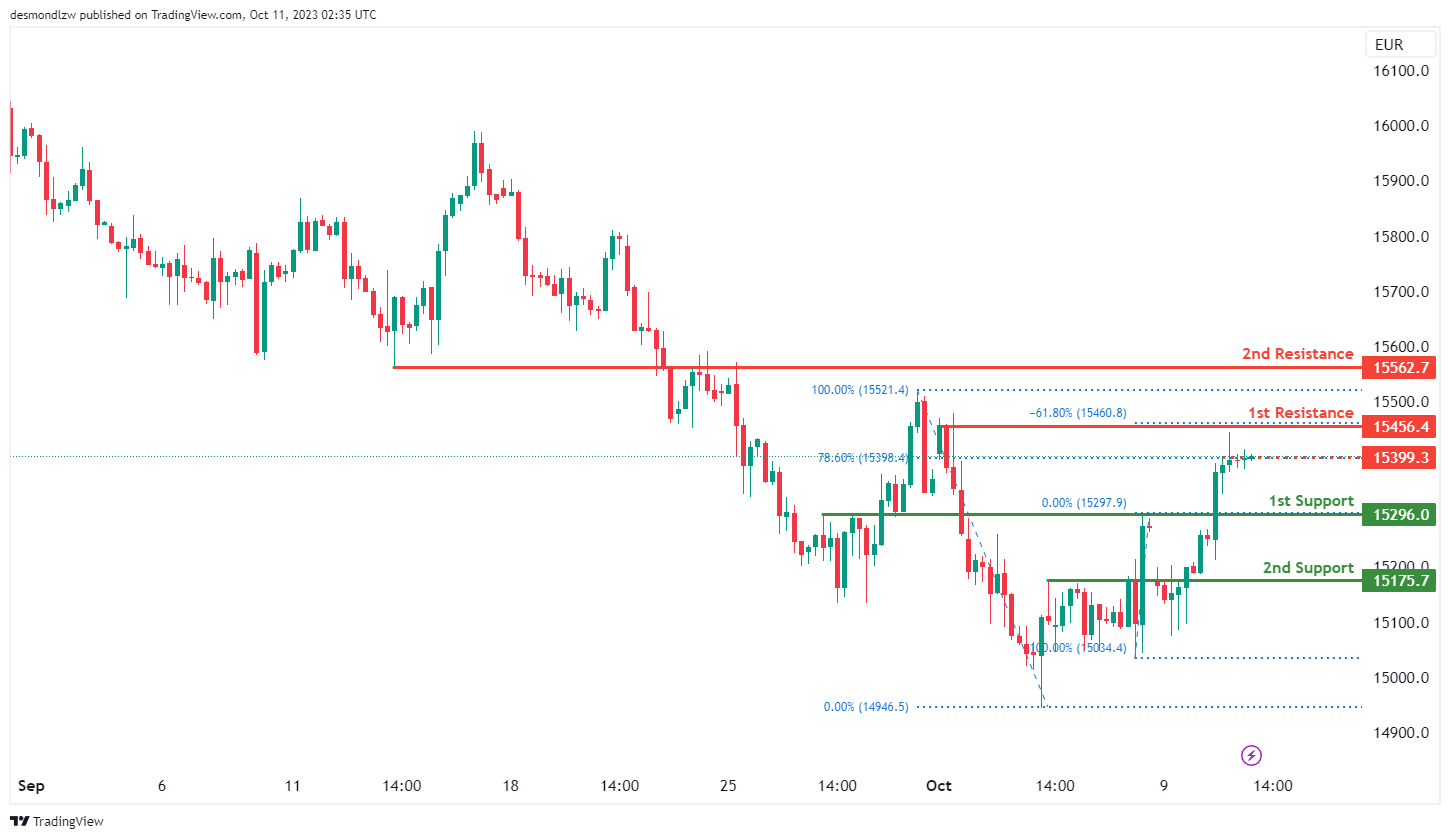
The German 40 (GER40) chart is currently showing an overall bullish momentum with a potential for price to make a bullish continuation towards the 1st resistance level should the price break above the intermediate resistance.
The intermediate resistance level at 15,399.30 is identified as a pullback resistance that aligns with the 78.60% Fibonacci retracement level while the 1st resistance level at 15,456.40 is also noted as a pullback resistance. Beyond this, the 2nd resistance level at 15,562.70 is identified as an overlap resistance.
To the downside, the 1st support level at 15,296.00 is identified as an overlap support. Additionally, the 2nd support level at 15,175.70 is also marked as an overlap support..
US500
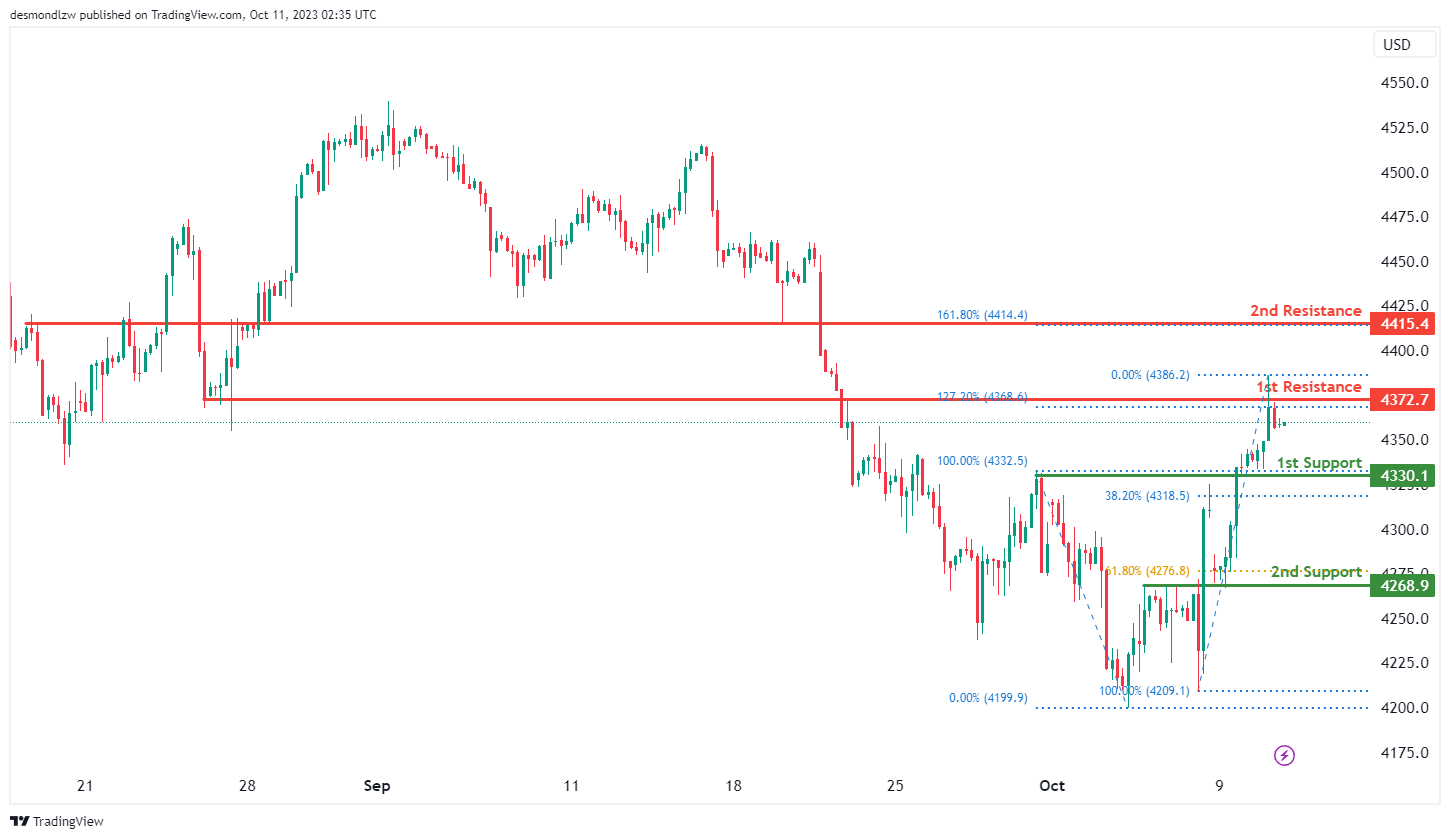
The S&P 500 (US500) chart is currently showing an overall bullish momentum with a potential for price to make a bullish continuation towards the 1st resistance level.
The 1st resistance level at 4,372.70 is identified as an overlap resistance that aligns with the 127.20% Fibonacci extension level. Higher up, the 2nd resistance level at 4,415.40 is also noted as an overlap resistance that aligns with the 161.80% Fibonacci extension level.
To the downside, the 1st support level at 4,330.10 is identified as an overlap support that aligns close to the 38.20% Fibonacci retracement level. Additionally, the 2nd support level at 4,268.90 is also marked as an overlap support that aligns close to the 61.80% Fibonacci retracement level.
BTC/USD:
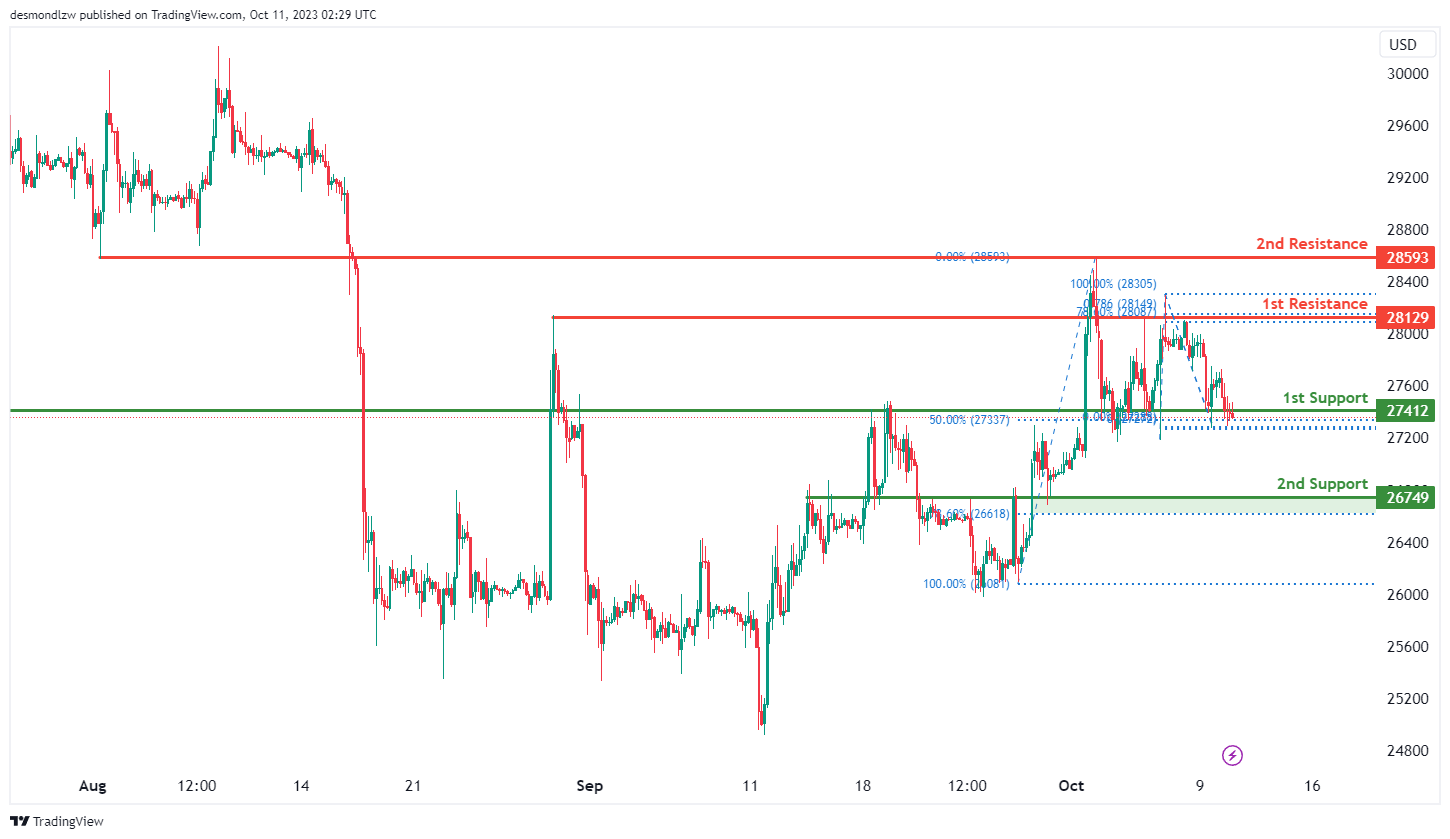
The Bitcoin (BTC/USD) chart currently exhibits an overall bearish momentum with a potential scenario for price to make a bearish breakout below the 1st support level and drop towards the 2nd support level.
The 1st support level at 27,412.00 is identified as an overlap support that aligns with the 50.00% Fibonacci retracement level. Further below, the 2nd support level at 26,749.00 is also noted as an overlap support that aligns close to the 78.60% Fibonacci retracement level.
To the upside, the 1st resistance level at 28,129.00 is identified as a pullback resistance that aligns with the 78.60% Fibonacci retracement level. Higher up, the 2nd resistance level at 28,593.00 is marked as a pullback resistance.
ETH/USD:
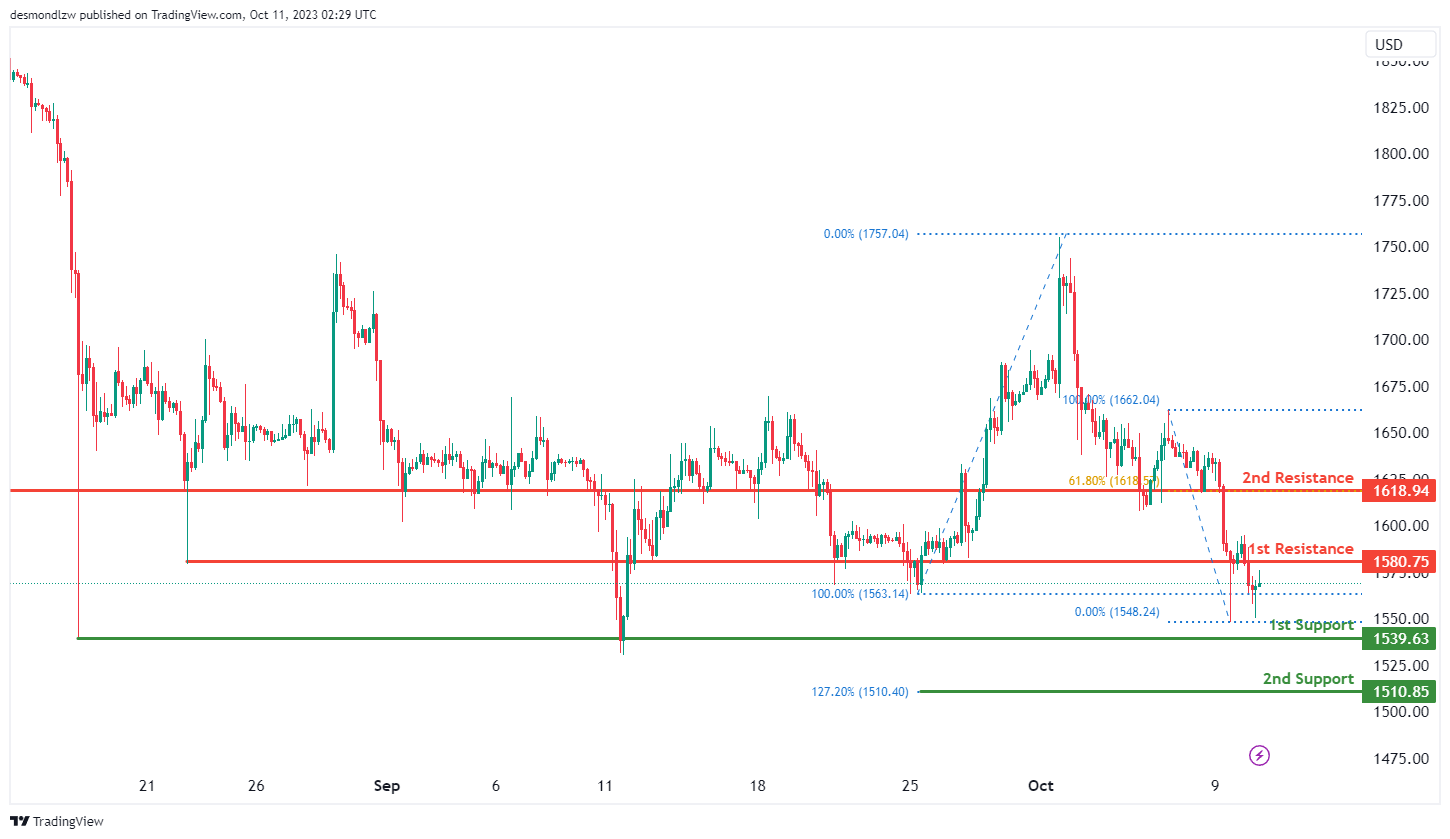
The Ethereum (ETH/USD) chart currently exhibits an overall bearish momentum with a potential scenario for price to make a bearish continuation towards the 1st support level.
The 1st support level at 1,539.63 is identified as a pullback support. Further below, the 2nd support level at 1,510.85 is noted as a support level that aligns with the 127.20% Fibonacci extension level.
To the upside, the 1st resistance level at 1,580.75 is identified as a pullback resistance. Higher up, the 2nd resistance level at 1,618.94 is marked as an overlap resistance that coincides with the 61.80% Fibonacci retracement level.
WTI/USD:
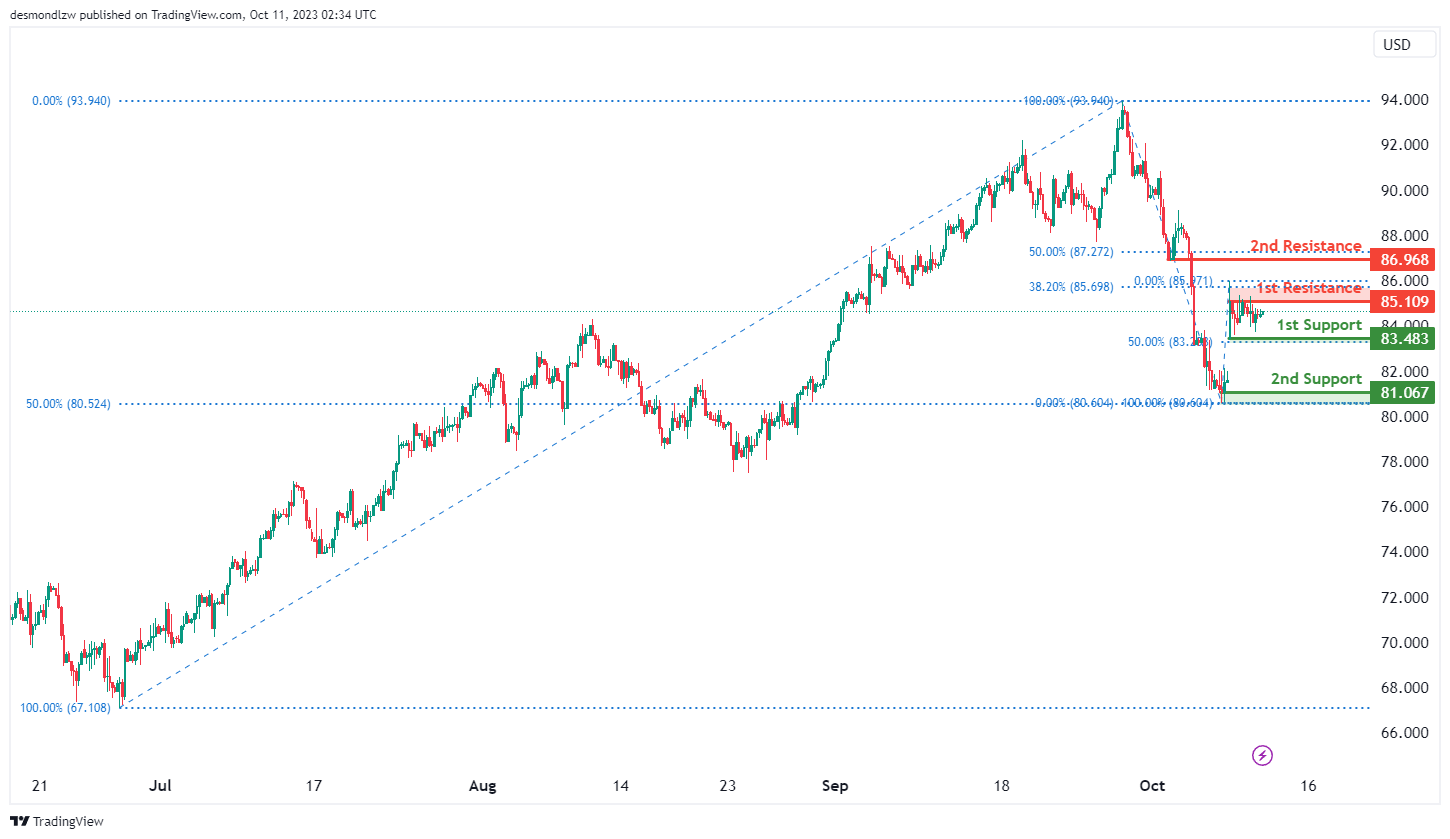
The WTI chart currently exhibits a neutral momentum with a potential scenario for price to fluctuate between the 1st resistance and the 1st support levels.
The 1st resistance level at 85.11 is identified as a pullback resistance that aligns close to the 38.20% Fibonacci retracement level. Higher up, the 2nd resistance level at 86.97 is also noted as a pullback resistance that aligns close to the 50.00% Fibonacci retracement level, potentially acting as a barrier to further upward movement.
To the downside, the 1st support level at 83.48 is identified as a pullback support that aligns with the 50.00% Fibonacci retracement level. Additionally, the 2nd support level at 81.07 is noted as a swing-low support that aligns with the 50.00% Fibonacci retracement level, further reinforcing its significance as an area where price may find support.
XAU/USD (GOLD):
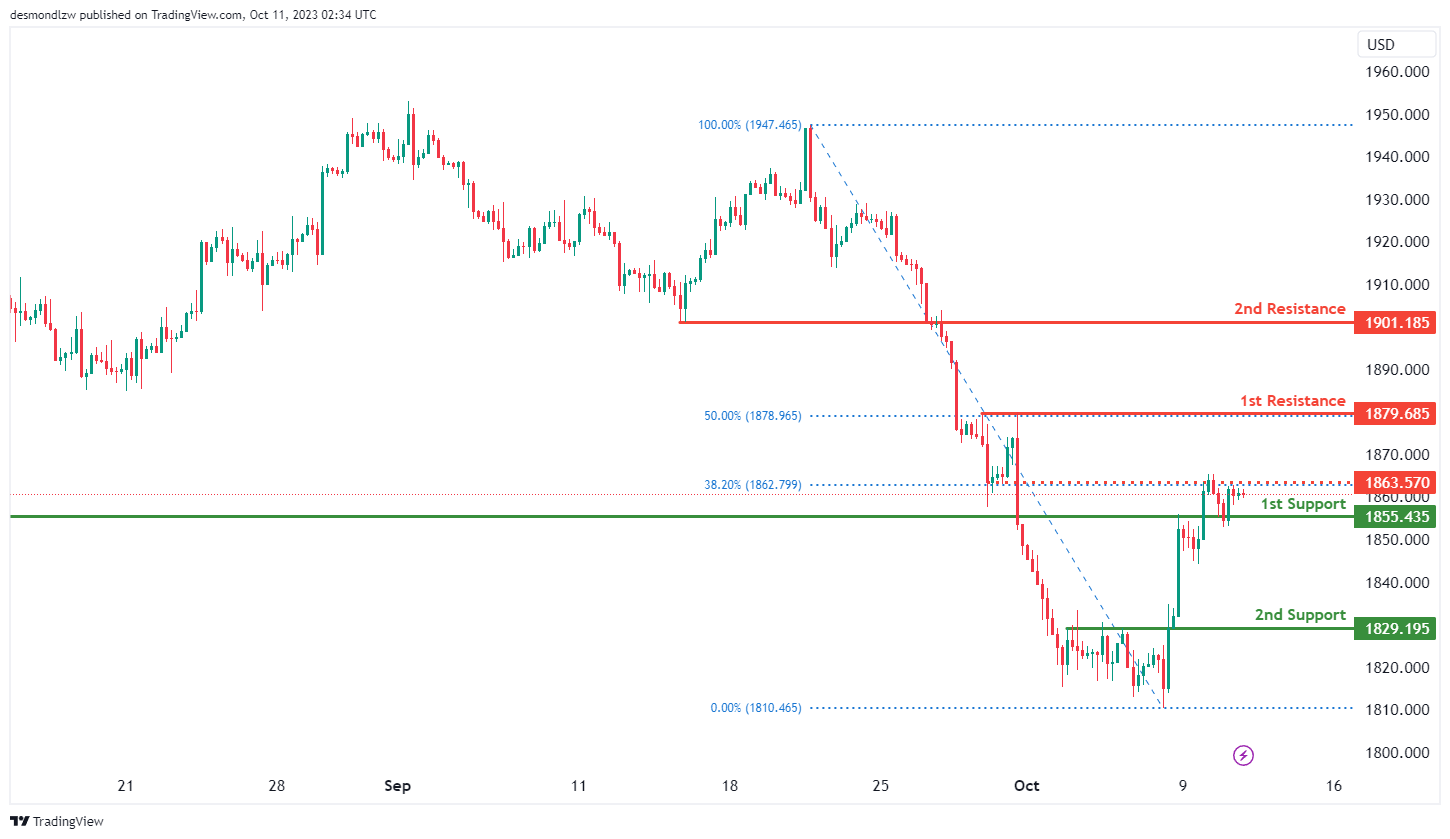
The XAU/USD chart currently exhibits a weak bullish momentum, with a potential scenario of a bullish continuation towards the 1st resistance level should price break above the intermediate resistance level.
The intermediate resistance level at 1,863.57 is identified as a pullback resistance that aligns with the 38.20% Fibonacci retracement level while the 1st resistance level at 1,879.69 is also noted as a pullback resistance that aligns with the 50.00% Fibonacci retracement level. Higher up, the 2nd resistance level at 1,901.19 is identified as a pullback resistance, potentially acting as a barrier to further upward movement.
To the downside, the 1st support level at 1,855.44 is identified as a pullback support. Additionally, the 2nd support level at 1,829.19 is also marked as a pullback support, further reinforcing its significance as an area where price may find support.
GBP/JPY Daily Outlook
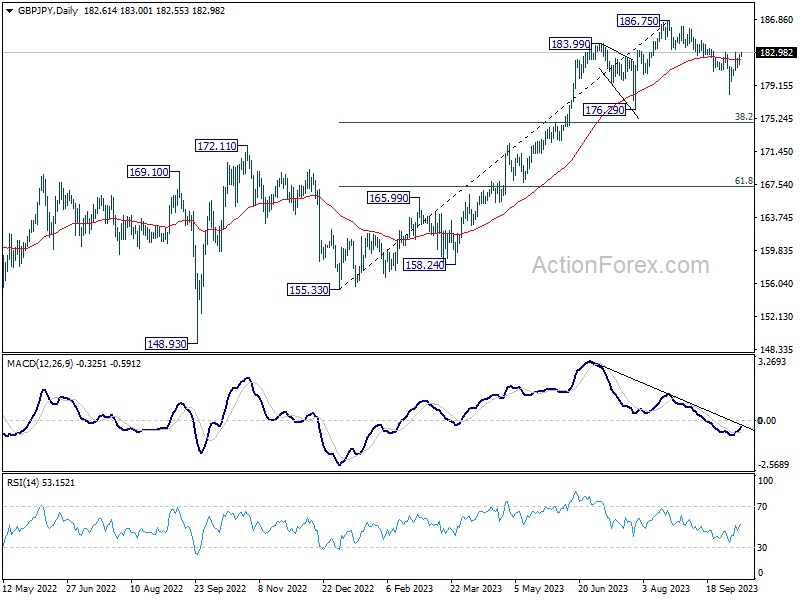
Daily Pivots: (S1) 181.90 (P) 182.35; (R1) 183.14; More...
Immediate focus is no won 183.00 resistance in GBP/JPY. Firm break there will argue that the pull back from 187.65 has completed, and turn bias back to the upside for retesting this high. On the downside, below 180.26 minor support will turn bias back to the downside for 178.02 again.
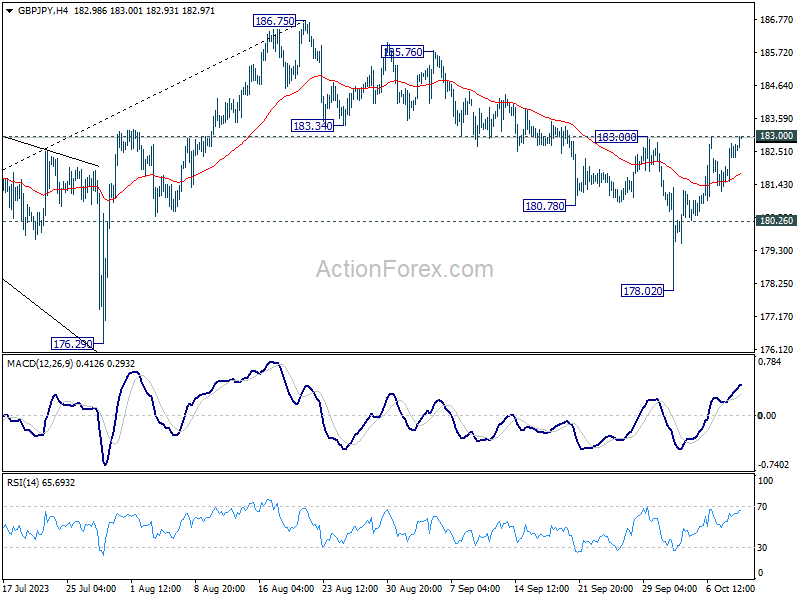
In the bigger picture, fall from 186.75 is currently seen as a corrective move only. As long as 176.29 support holds, larger up trend from 123.94 (202 low) should still be in progress. Break of 186.75 will target 195.86 (2015 high). Nevertheless, firm break of 176.29 will confirm medium term topping, and bring lengthier and deeper consolidations.
EUR/JPY Daily Outlook
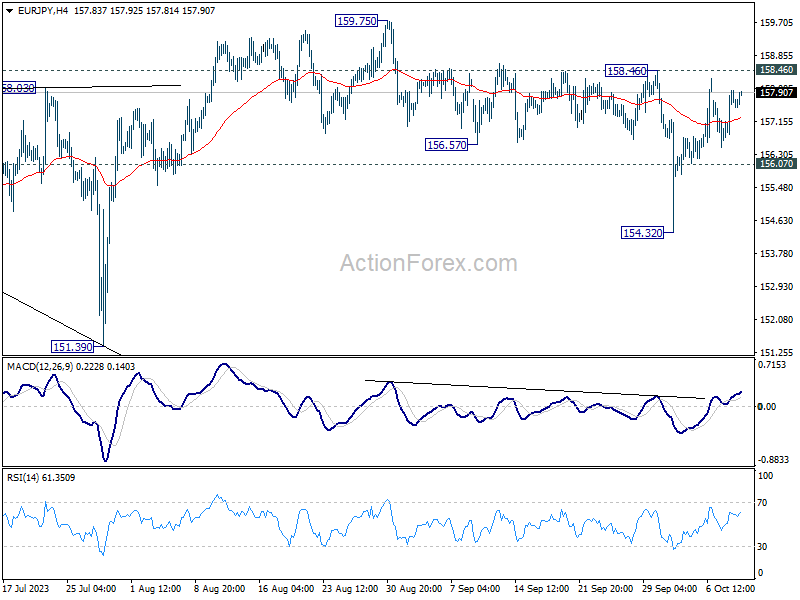
Daily Pivots: (S1) 156.99; (P) 157.49; (R1) 158.20; More....
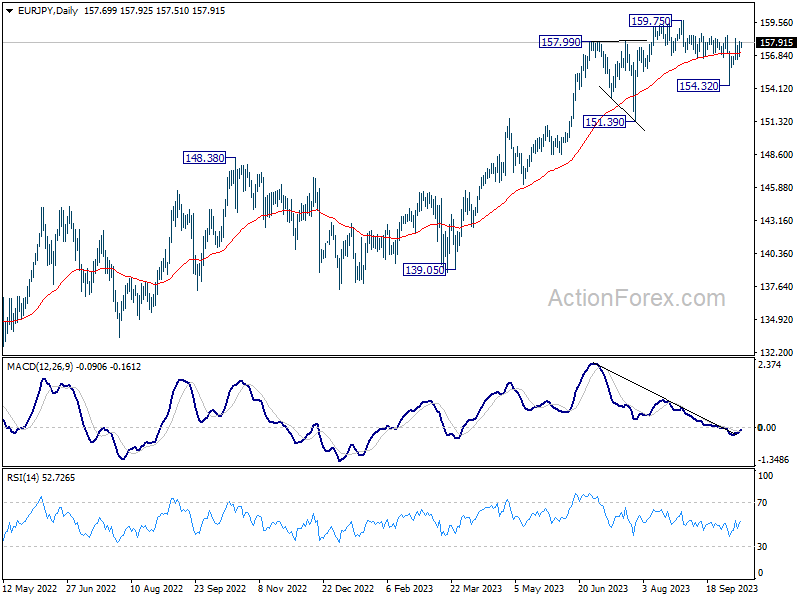
Intraday bias in EUR/JPY remains neutral as sideway trading continues. On the upside, firm break of 158.464 will argue that the pull back has from 159.75 is completed. Bias will be turned back to the upside for resuming larger up trend through 159.75 high. On the downside, below 156.07 minor support will resume the fall from 159.75 through 154.32 support.
In the bigger picture, price actions from 159.75 are views as a corrective pattern for now. As long as 151.39 support holds, rise from 114.42 (2020 low) is still expected to continue through 159.75 at a later stage. Nevertheless, firm break of 151.39 will confirm medium term topping, and bring lengthier and deeper correction.
EUR/GBP Daily Outlook
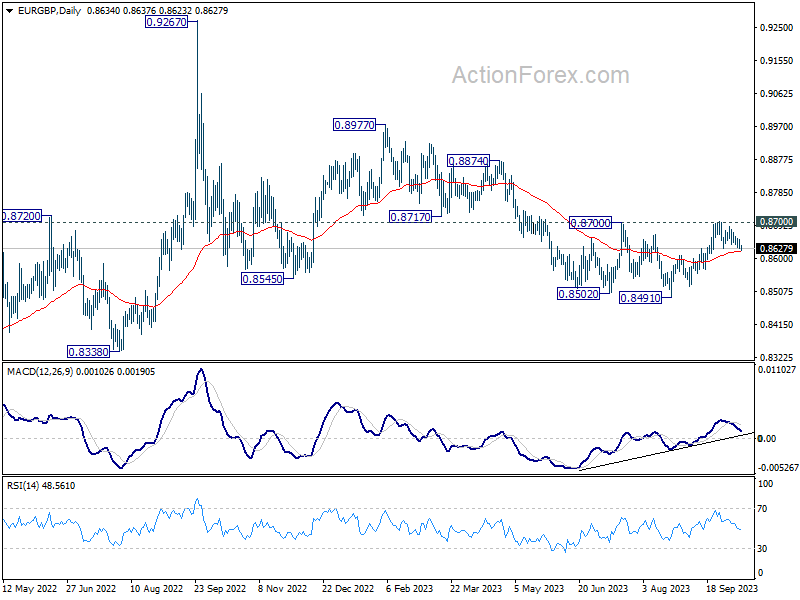
Daily Pivots: (S1) 0.8622; (P) 0.8639; (R1) 0.8648; More....
Break of 0.8629 support indicates resumption of the choppy decline from 0.8704. Intraday bias is back on the downside for 0.8568 support next. Whole rebound form 0.8491 could have completed after rejection by 0.8700 resistance. Break of 0.8568 will bring retest of 0.8491 low. On the upside, though, above 0.8654 minor resistance will turn intraday bias neutral first.
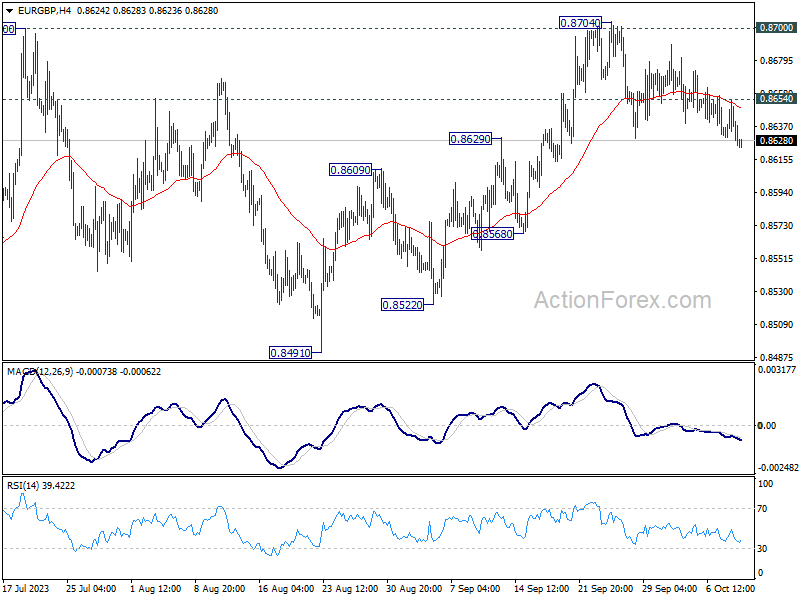
In the bigger picture, the down trend from 0.9267 (2022 high) is seen as part of the long term range pattern from 0.9499 (2020 high). Decisive break of 0.8700 resistance will argue that this decline has completed with three waves down to 0.8491. Rise from 0.8491 could then be another leg inside the pattern and targets 0.8977 and above. However, rejection by 0.8700 will keep the down trend alive for another fall through 0.8491 at a later stage.
EUR/AUD Daily Outlook
EUR/AUD Daily Outlook
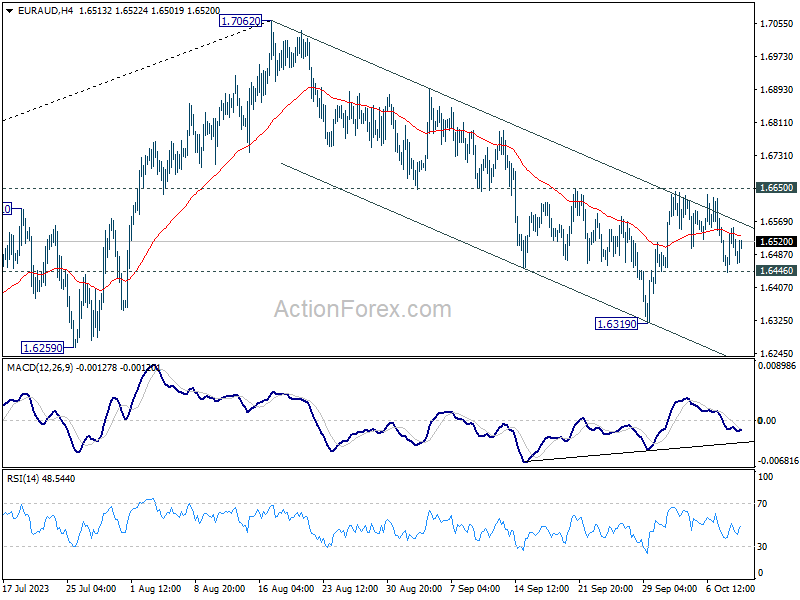
Daily Pivots: (S1) 1.6436; (P) 1.6497; (R1) 1.6549; More...
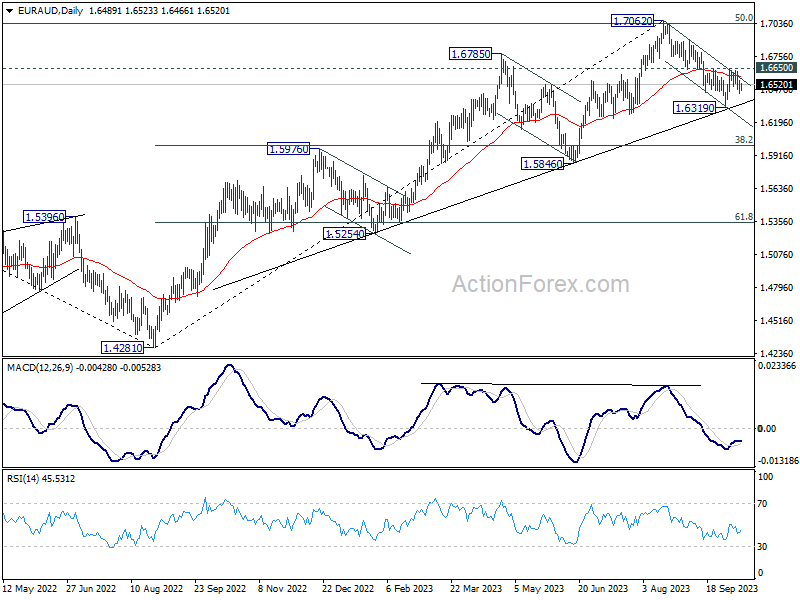
Intraday bias in EUR/AUD remains neutral as sideway trading continues. On the downside, below 1.6446 minor support will bring retest of 1.6319. Break there will resume the decline from 1.7062 to 1.6000 fibonacci level. On the upside, firm break of 1.6650 resistance will argue that pull back from 1.7062 has completed, after drawing support from medium term rising trend line. Further rally would be seen back to retest 1.7062.
In the bigger picture, fall from 1.7062 is probably correcting whole up trend from 1.4281 (2022 low). Deeper decline would be seen to 38.2% retracement of 1.4281 to 1.7062 at 1.6000. Strong support could be seen there to bring rebound, at least on first attempt. This will remain the favored case as long as 1.6650 resistance holds.
EUR/CHF Daily Outlook
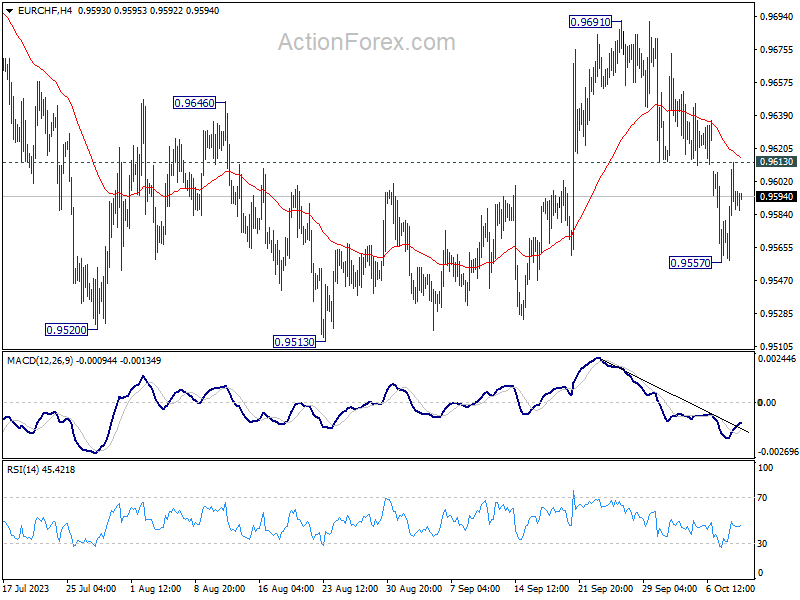
Daily Pivots: (S1) 0.9566; (P) 0.9590; (R1) 0.9620; More...
Intraday bias in EUR/CHF is turned neutral first with current recovery. Another fall is mildly in favor as long as 0.9613 resistance holds. Below 0.557 will bring retest f 0.9513 low. Decisive break there will resume larger down trend from 1.0095. On the upside, above 0.9613 will turn bias back to the upside for 0.9691 instead.
In the bigger picture, medium term outlook will stay bearish as long as the cross is capped well below falling 55 W EMA (now at 0.9793). That is, down trend from 1.2004 (2018 high) could still resume through 0.9407 (2022 low). However, sustained trading above the 55 W EMA will raise the chance that 0.9470 is already a long term bottom. Further rise would then be seen to 1.0095 resistance to indicate bullish trend reversal.
USD/CAD Daily Outlook
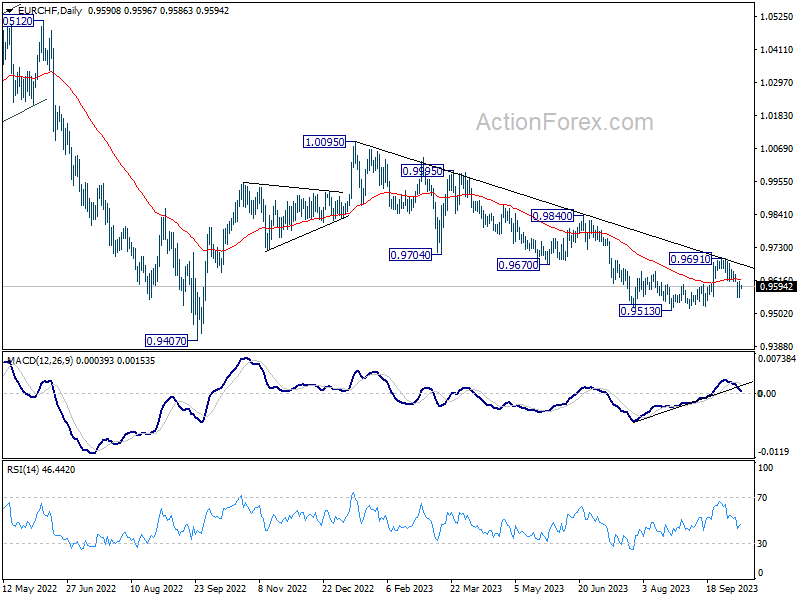
Daily Pivots: (S1) 1.3562; (P) 1.3590; (R1) 1.3609; More....
Intraday bias in USD/CAD remains mildly on the downside and outlook is unchanged. While pull back from 1.3784 could extend lower, outlook will stay bullish as long as 1.3378 support holds. On the upside, above 1.3675 minor resistance will turn bias back to the upside for retesting 1.3784 next.
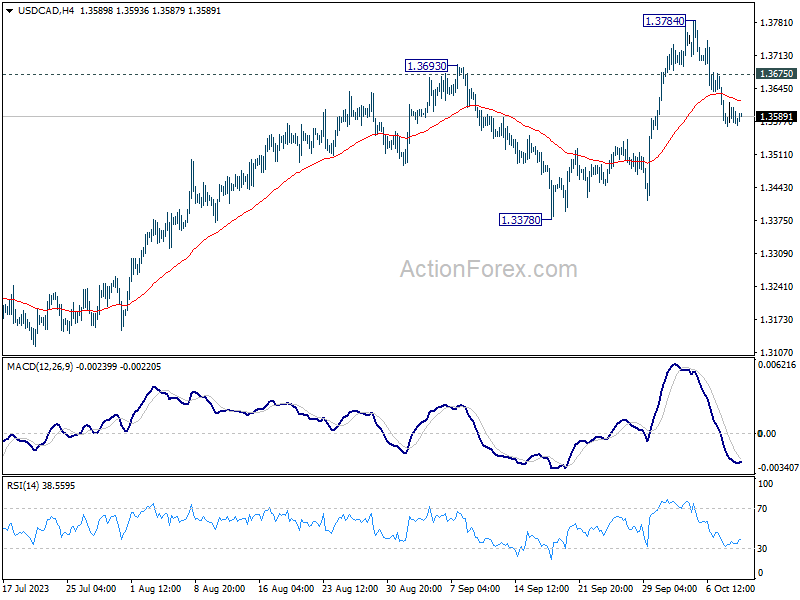
In the bigger picture, current development revives the case that corrective pattern from 1.3976 (2022 high) has completed with three waves down to 1.3091. Decisive break of 1.3976 high will confirm resumption of up trend from 1.2005 (2021 low). Next target will be 61.8% projection of 1.2401 to 1.3976 from 1.3091 at 1.4064. This will now remain the favored case as long as 1.3378 support holds.
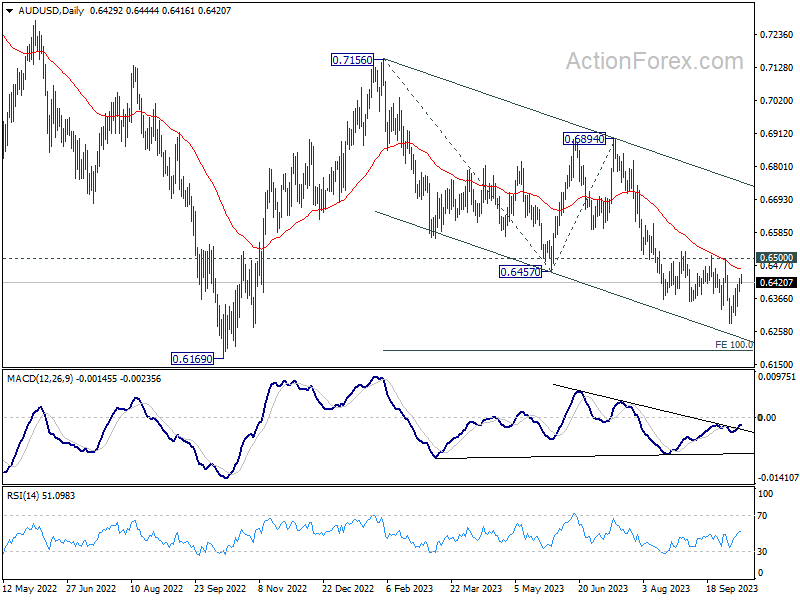
AUD/USD Daily Report
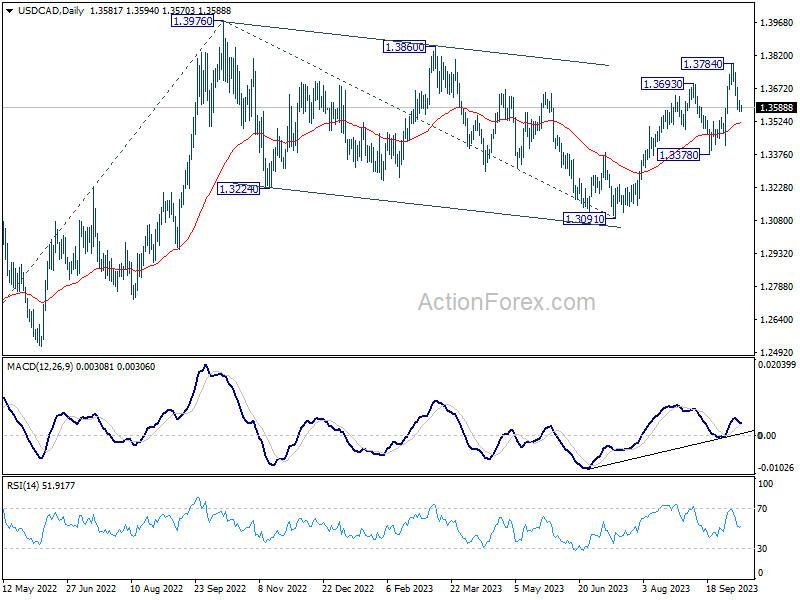
Daily Pivots: (S1) 0.6404; (P) 0.6419; (R1) 0.6446; More...
Intraday bias in AUD/USD stays neutral and outlook is unchanged. While recovery from 0.6284 could extend higher, outlook will stay bearish as long as 0.6500 resistance holds. Below 0.6284 will resume the fall from 0.7156. Next target is 100% projection of 0.7156 to 0.6457 from 0.6894 at 0.6195.
In the bigger picture, down trend from 0.8006 (2021 high) is possibly still in progress. Decisive break of 0.6169 will target 61.8% projection of 0.8006 to 0.6169 to 0.7156 at 0.6021. This will now remain the favored case as long as 0.6894, in case of strong rebound.
USD/JPY Daily Outlook
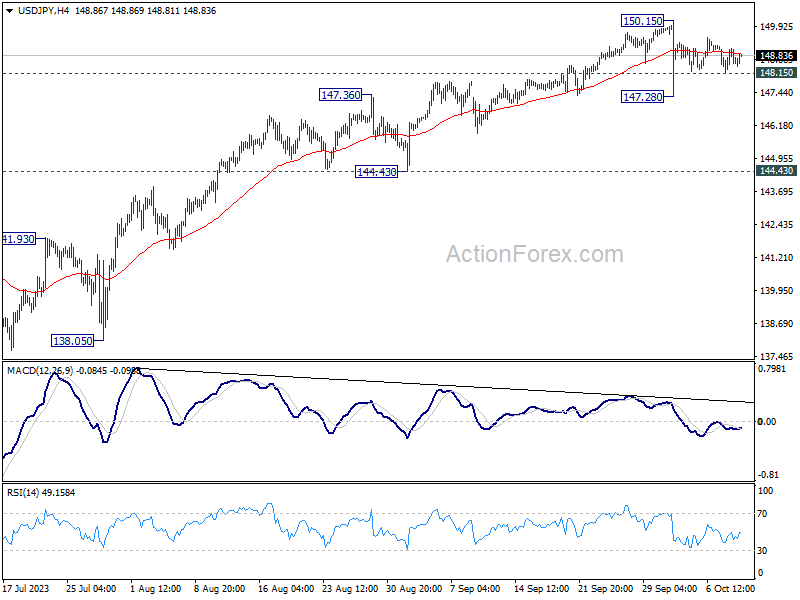
Daily Pivots: (S1) 148.21; (P) 148.66; (R1) 149.15; More...
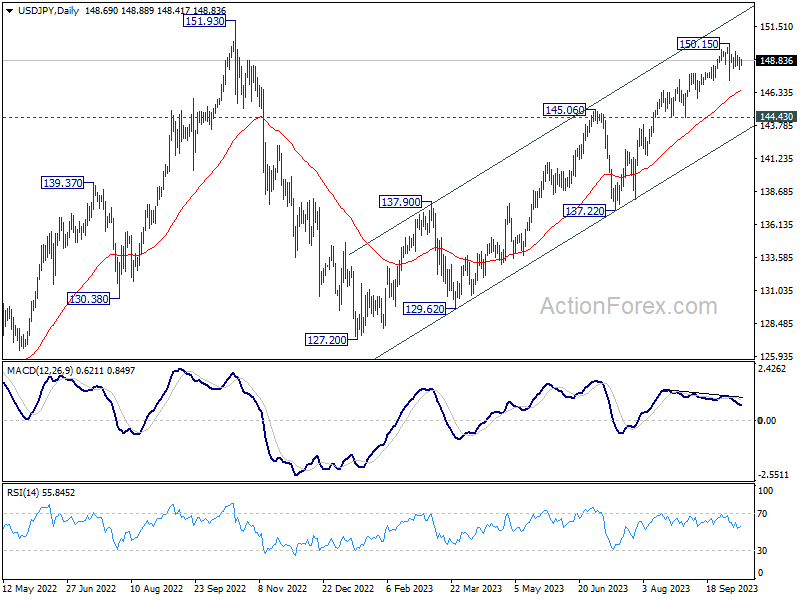
Intraday bias in USD/JPY stays neutral as consolidation form 150.15 is still extending. On the downside, below 148.24 minor support will turn bias to the downside for another down leg through 147.28. But there is no confirmation of bearish trend reversal before firm break of 144.43 support. Another rally remains mildly in favor through 150.15 to retest 151.93 high.
In the bigger picture, while rise from 127.20 is strong, it could still be seen as the second leg of the corrective pattern from 151.93 (2022 high). Rejection by 151.93, followed by sustained break of 145.06 resistance turned support will be the first sign that the third leg of the pattern has started. However, sustained break of 151.93 will confirm resumption of long term up trend.
USD/CHF Daily Outlook
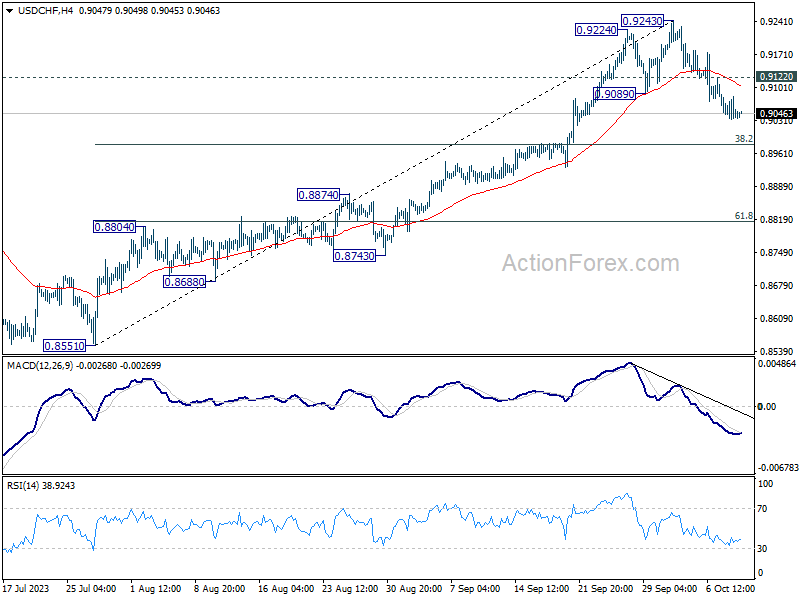
Daily Pivots: (S1) 0.9026; (P) 0.9055; (R1) 0.9075; More....
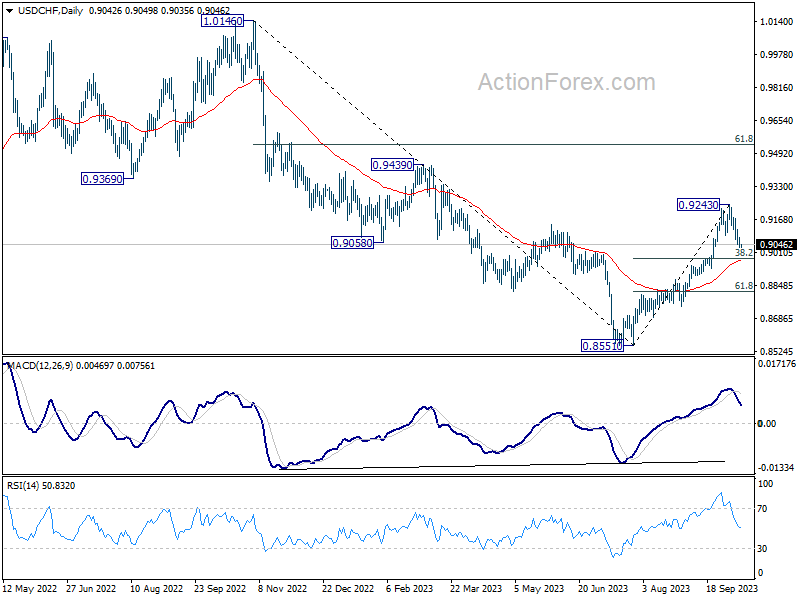
No change in USD/CHF's outlook and intraday bias stays on the downside. Corrective fall from 0.9243 could extend further to 38.2% retracement of 0.8551 to 0.9243 at 0.8979. On the upside, above 0.9122 minor resistance will turn intraday bias neutral first. But risk of another fall will remain as long as 0.9243 resistance holds.
In the bigger picture, current development indicates that rise from 0.8551 is reversing whole down trend from 1.0146. Further rally would then be seen to 61.8% retracement at 0.9537 and above. For now, this will be the favored case as long as 55 D EMA (now at 0.8969) holds, even in case of deep pullback.