Sample Category Title
AUDNZD Wave Analysis
- AUDNZD reversed from resistance level 1.0665
- Likely to fall to support level 1.0600
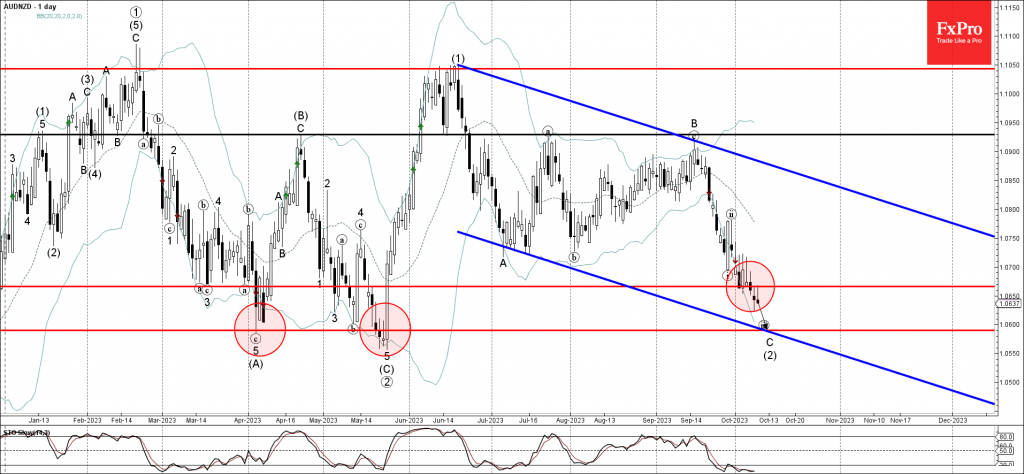
AUDNZD currency pair recently reversed down from the resistance level 1.0665 (former support from the start of October).
The downward reversal from the resistance level 1.0665 continues the C-wave of the active intermediate ABC correction (2) from the middle of June.
Given the strength of the active impulse wave C, AUDNZD can be expected to fall further toward the next support level 1.0600 (target for the completion of the active C-wave).
Fed’s Bostic: Current policy rate sufficient to curb inflation
Atlanta Fed President Raphael Bostic made a clear stance today, expressing confidence in the prevailing policy rate's ability to bring inflation down to the desired 2% mark. In his words, "I think that our policy rate is at a sufficiently restrictive position to get inflation down to 2%." Contrary to some speculations about further hikes, he stated, "I actually don't think we need to increase rates anymore."
Bostic's comments come at a crucial juncture when the market is closely monitoring the bond market dynamics, especially recent sharp rise in Treasury yields. Responding to queries about the possible impact of rising Treasury yields on the Fed's policy approach, Bostic highlighted that the present rates are "clearly" on the restrictive side, hinting at a visible slowdown in economic activities. He also hinted at more repercussions from the Fed's past hikes that might manifest in the near future.
In addition to domestic economic indicators, Bostic also touched upon the geopolitical developments, particularly the recent violent episodes in Israel. Recognizing the potential of such geopolitical events to infuse further uncertainty in the global economic landscape, Bostic underscored the need for the Federal Reserve to remain agile. He emphasized the importance of being nimble and ready to adapt in light of rapidly evolving global scenarios.
Oil Bounces Back, Set for More Declines
Oil’s bounce at the start of the week’s trading was an essential step in correcting the short-term oversold condition, but it may only fuel the interest of new sellers.
The oil price is down 12.8% in the six trading sessions since 28 September. A local low was recorded immediately after the release of the labour market data. However, interest in oil was soon fuelled by speculation that, along with a strong labour market in the US, there was no increase in inflationary pressure. On Monday, investors speculated about the risks of energy supply reduction due to the involvement of other Muslim countries in the conflict, which will put oil and gas supplies at risk.
But let’s look at the situation without emotion and speculation – purely from a tech analysis perspective. From this point of view, the latest bounce was a critical correction that could clear the way for a subsequent decline.
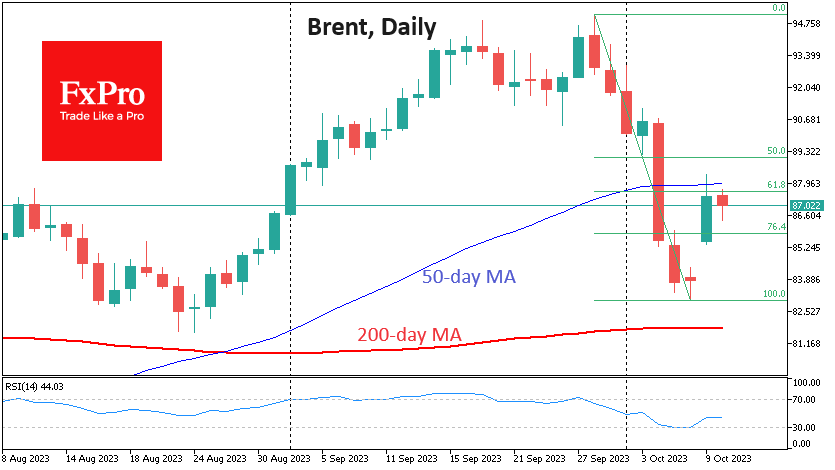
Brent oil turned downwards from $95 and quickly reached $83, falling sharply under the 50-day moving average. Last Wednesday’s dip signals that the bears are firmly in market control.
By Friday, the RSI on the daily charts began to flirt with the oversold area. Since the end of 2020, this signal has consistently triggered a reversal. The same thing happened this time around.
Thanks to the US data and the military conflict in the Gaza Strip on Monday, the price made a classic rebound to the 61.8% area from the initial decline. But its recovery stalled there. We also note that on Monday, the price tried to return above the 50-day average but closed the day lower.
There was no upward momentum in oil for most of the day on Tuesday despite the strengthening of stock indices, indicating a recovery in risk appetite.
If the bears keep an upper hand over the oil market, we could see a gap close at the start of the week’s trading in the next couple of days. The following support line in oil looks to be the 200-day moving average, now just below $82.
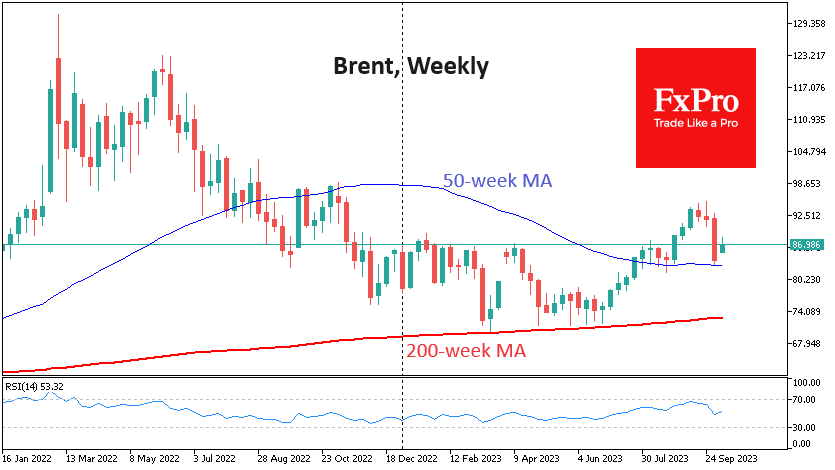
A more ambitious downside target is $75, where the most crucial separator of market cycles in the form of the 200-week average and the 161.8% level of the last downside impulse may cross by the end of the year.
Israel-Gaza Conflict Views & Potential Implications
Summary
After years of geopolitical developments altering the direction of the global economy and financial markets, the conflict in Israel and Gaza has the potential to further disrupt economic and financial markets trends. In this report, we provide perspective on the possible implications—geopolitical, economic, markets and political—of military conflict between Israel and Hamas.
Israel-Gaza Conflict Views & Potential Implications
Hamas' attack on Israel marks another major geopolitical challenge permeating across the globe. Arguably, geopolitical developments have had the most material impact on the global economy and financial markets in recent years. U.S.-China tensions and Russia's invasion of Ukraine have been the most consequential; however, increased Chinese military incursions in Taiwan, military coups in Africa, the Nagorno-Karabakh conflict in Armenia and Azerbaijan as well as renewed violence between Kosovo and Serbia have all contributed to a worsening global geopolitical environment and present risks to the economic outlook. Military conflict in Israel contributes to and elevates this geopolitical uncertainty. Predicting the evolution of the Israel-Gaza conflict is difficult; however, Prime Minister Netanyahu's declaration of war against Hamas and subsequent rhetoric seem to suggest a speedy deescalation is not on the horizon. Regional escalation—in the form of intensified Israel-Iran proxy battles, direct Israel-Iran military conflict or the military involvement of other influential actors such as Saudi Arabia and Qatar—would shift the global geopolitical climate in an even less favorable direction. While the likelihood of an escalation to a regional conflict is outside our scope, broader military conflict in the Middle East would likely result in reduced oil supply and a spike in crude prices. As evidenced during the initial phases of the Russia-Ukraine conflict, rising oil and natural gas prices can inflict severe damage on select economies around the world, particularly G10 countries and key emerging market nations that contribute materially to global growth, such as China and India. In the coming days and weeks, we will be watching for evidence and/or rhetoric that implicates Iran as a hostile actor in the attack on Israel. Should proof be presented that Iran knew about, coordinated or outright supported Hamas' aggressions by supplying resources, Israel's military offensive could extend beyond Gaza and toward Tehran. Direct Israel-Iran conflict would worsen the geopolitical backdrop significantly and would have direct economic implications around the world via higher oil prices and deteriorating sentiment. In the event of regional escalation, safe-haven assets such as the U.S. dollar and U.S. Treasuries would likely outperform, and we would adjust our forecasts to reflect more greenback strength and more risk-sensitive currency depreciation at least through the end of this year.
The Israel-Gaza conflict is likely to compound and exacerbate deglobalization. We have touched on deglobalization multiple times this year and how the interconnectedness of the world's economies is in decline. Our latest report highlights the role of geopolitics in deglobalization and how geopolitical hostilities have already resulted in the fragmentation of the global economy and will likely be the driving force of further economic fractures. Prior to the Israel-Gaza conflict, relations in the Middle East were on an improving trajectory. Saudi Arabia and Iran tentatively restored diplomatic ties, while the United States was making progress toward brokering formal ties between Saudi Arabia and Israel that would have included Palestinian concessions. The latest Israel-Gaza conflict likely ends the near-term possibility of Saudi Arabia recognizing Israel as a sovereign state, diminishes chances of Israeli concessions to Palestine, and creates new impediments to regional peace. Recent improvements in regional relations are now likely to backtrack, and a reset of Middle East relations could begin to materialize. Should these fissures take shape in the Middle East, globalization will take yet another hit. More broadly, major geopolitical players, not just in the Middle East but globally, will need to take a stance on either voicing explicit support for Israel or taking another position. As these geopolitical fault lines set in, alongside already existing geopolitical barriers, deglobalization could pick up pace. To gauge sovereign sentiment toward Israel and where geopolitical fault lines could be erected or reinforced, voting in the United Nations General Assembly (e.g., to “condemn” the attack on Israel) will provide the most insight. We will be paying particular attention to how regional stakeholders vote as well as countries that previously abstained or voted against condemning Russia's invasion of Ukraine. Should countries with economic influence or political sway not vote in unison with Israel, geopolitical borders could be redrawn and new forces of deglobalization could be applied.
Israel's focus to shift away from local political divisions and toward geopolitical risk management. Israel's financial markets have come under pressure this year in response to the Netanyahu administration's pursuit of judicial reforms and social backlash to the perceived weakening of Israel's institutions. The focus of the current administration has been on implementing the reform package, either unilaterally or in cooperation with opposition parties; however, with the larger risk to Israel's sovereignty and institutions now geopolitically driven, local political divisions are not likely to be a focus of financial markets nor the administration for the time being. If any silver lining exists, the attack on Israel's sovereignty could be a catalyst for local political cohesion, at least in the near term or over the course of the conflict. Along with the announcement of a large Bank of Israel (BoI) FX intervention program designed to stabilize the shekel, easing local political divisions could be a source of stability for the shekel following the initial depreciation after markets reopened from the weekend. With that said, the shekel—along with other Israeli financial assets such as sovereign debt, equities and measures of sovereign default risk—are likely to remain on the defensive, and we do not anticipate an ILS rebound at this time. The shekel has already sold off around ~15% against the dollar since judicial reforms were announced in late January. Even so, in our view, the more likely ILS path is further depreciation, albeit at a gradual pace, in the months ahead. This view stems from our FX vulnerability analysis, which is designed to gauge potential currency depreciation in an exogenous shock or global risk-off scenario. Our framework suggests the shekel could weaken as much as 20% on a peak-to-trough basis under shock circumstances. While Israel's fundamentals are sound (current account surplus, an educated and diversified economy and adequate FX reserve coverage even with the latest BoI intervention program), as the current shock scenario continues to unfold, combined with broad-based U.S. dollar strength on investors' desire for safe-haven assets, we believe another 5% ILS depreciation could still be forthcoming by the end of this year and into early 2024. Shekel depreciation is likely to be smoothed by the Bank of Israel, and we now expect the USD/ILS exchange rate to trend toward ILS4.15 by early 2024. Risks are, however, tilted toward a sharper and quicker depreciation as uncertainties are abundant and other actors becoming involved in the conflict is still a real possibility.
Geopolitics can play an outsized role in many of next year's elections. 2024 is likely to be a year defined by elections, and we expect geopolitics to be a point of contention for voters as many developed and emerging market countries host general and legislative elections next year. We have already seen geopolitics cause political fracturing in the United States with additional funding for Ukraine a sticking point that nearly caused a government shutdown earlier this month. U.S. politicians will discuss appropriation bills again in November with no bi-partisan longer-term resolution on additional Ukraine support since the short-term funding deal in early October. Ukraine aid will likely still be a source of dispute in November, and with Israel already a large recipient of U.S. aid, conversations will now likely include increasing support to Israel as well. Federal spending plans could play a role in determining voter intentions during the U.S. election cycle next year, especially as aid fatigue has started to set in. Similar sentiment could spread around the world and could result in more protectionist and domestically focused policy platforms gathering momentum internationally. Not only could new protectionist policies result in additional deglobalization forces, but unorthodox policy platforms could also disrupt local financial markets and economic activity. Israel and Ukraine will likely be a topic of debate leading into the 2024 U.S. election; however, geopolitics can also be a theme in Narendra Modi's campaign for another term as prime minister of India, President Putin's re-election bid in Russia and Taiwan's presidential election. Many African nations will also host elections in 2024. Africa has become a geopolitical hotspot not just because of recent military coups, but also due to most of Africa signing up for China's Belt and Road Initiative (BRI) as well as China being a major sovereign creditor to many debt-distressed countries in Africa. African nations can benefit from China's BRI-related infrastructure plans, but at the same time, have had difficulties restructuring sovereign debt with China as a majority bondholder. Should policy platforms across the continent shift toward developing closer relations with the U.S. as opposed to China, Africa could become the next source of global geopolitical tensions.
Will China’s Data Confirm that the Economy is Bottoming Put?
- Latest Chinese data offer signs of stabilization
- Inflation and trade numbers may corroborate that view
- But the slump in property market continues to cast a shadow
- The releases are scheduled for Friday, during Asian trading
Is the Chinese economy bottoming out?
Following a temporary boost just after the removal of COVID-related ultra-restrictive policies, the Chinese economy faced a steep economic slowdown, with the property sector being the biggest drag as major developers are struggling with mountains of debt and missing payments to lenders, which brought an end to a long-running building boom that propelled China’s growth.
However, a streak of recent economic indicators is suggesting that the world’s second-largest economy may have begun bottoming out, with the manufacturing PMI pointing to expanding activity in September for the first time in six months, and the composite index rising to 52.0 from 51.3. Earlier signs of improvement had emerged in August, with factory output and retail sales accelerating, imports and exports falling at a slower pace than in July and deflationary pressures easing. On top of that, industrial profits unexpectedly surged 17.2%, more than reversing July’s 6.7% slump.
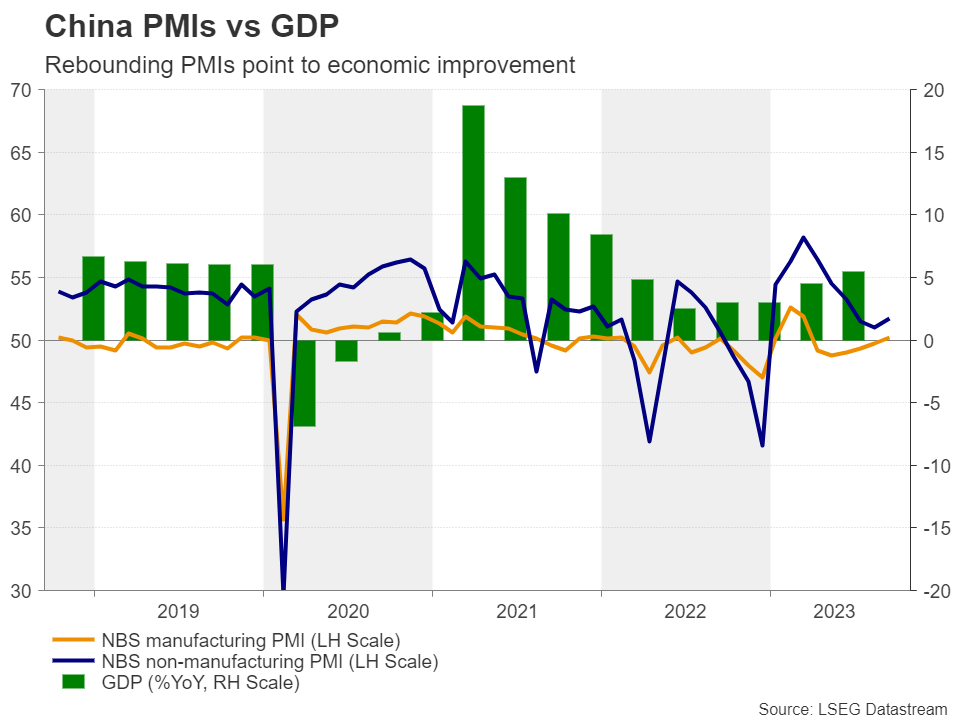
Spotlight turns to inflation and trade numbers
On Friday, the agenda includes the CPI and PPI numbers, as well as trade data for the month of September, with expectations confirming the stabilization narrative. The CPI is expected to have ticked up to 0.2% y/y from 0.1%, while the PPI rate is forecast to have risen to -2.4% from -3.0%. Both imports and exports are expected to have continued falling, but at an even slower pace than in August, resulting in a 2.4% increase in the nation’s trade surplus.
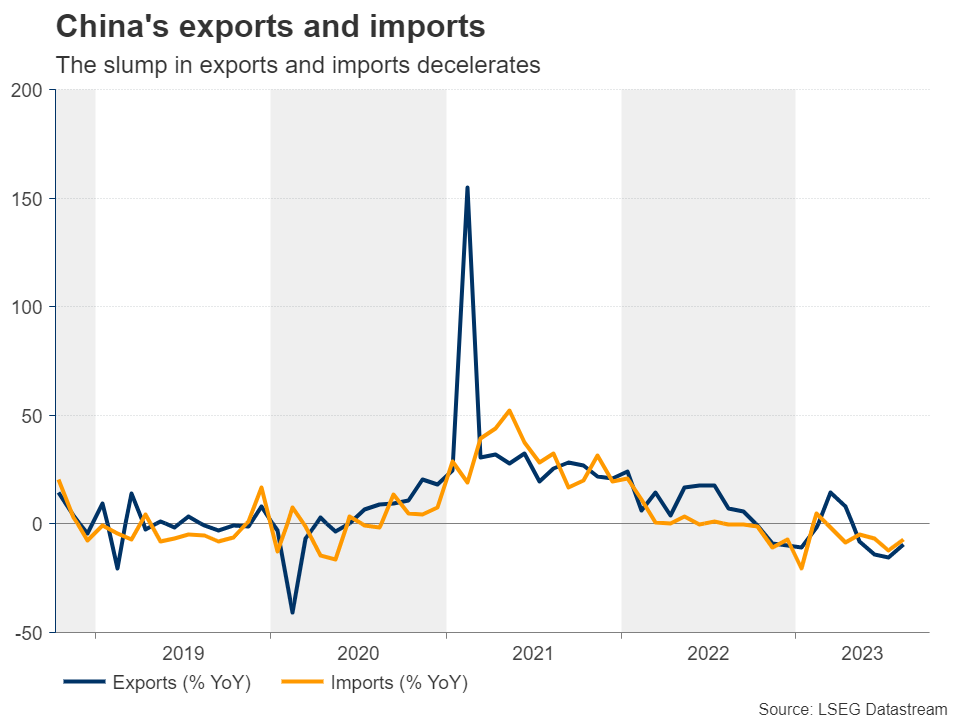
This, combined with a record number of Chinese choosing to travel home last week for the Golden Week holiday and thereby boosting domestic consumption, could further add to the case of a steadying Chinese economy. Ergo, given the close trading ties Australia and New Zealand have with China, the aussie and the kiwi may extend their latest recoveries.
The property sector continues to suffer
Nonetheless, assuming that the worst is over and that Chinese authorities can claim victory after announcing a series of measures to shore up activity may be unwise. The slump in the property sector worsened in August, with home prices, property investments and sales falling at steeper rates than in July. Home prices dipped at the fastest monthly pace in 10 months, while property investment and sales slumped for the 18th and 26th consecutive month respectively. In yearly terms, house prices were down 0.1%, the same rate as in July.
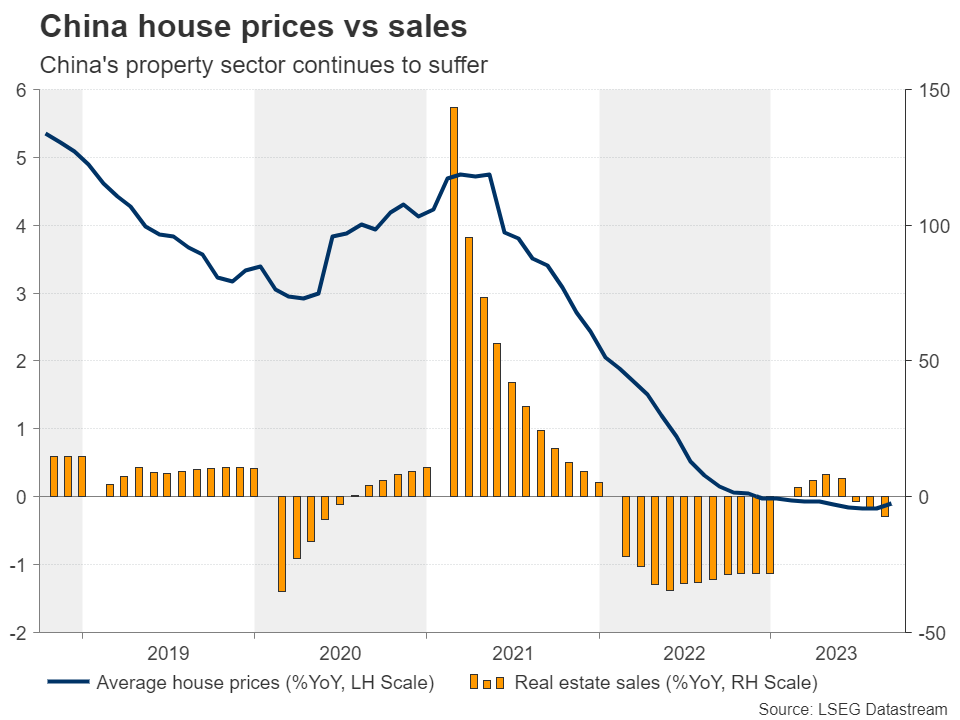
And as if the data is not enough, China’s Evergrande, the world's most indebted developer said a couple of weeks ago that its founder was being investigated over “illegal crimes”, while just today, the nation’s largest private property developer Country Garden Holdings warned that it might not be able to meet all its offshore payment obligations within the relevant grace periods.
The trade tensions between the West and China, ranging from tit-for-tat trade tariffs to tech rivalry and spying allegations, are not helping either.
Recovery in aussie and kiwi may be limited
Therefore, even if the aussie and kiwi extend their gains for a while longer, a long-lasting uptrend is unlikely. Equity markets are also likely to continue feeling the heat of China’s slowdown, on top of any additional pressure due to speculation of ‘higher for longer’ interest rates in the US.
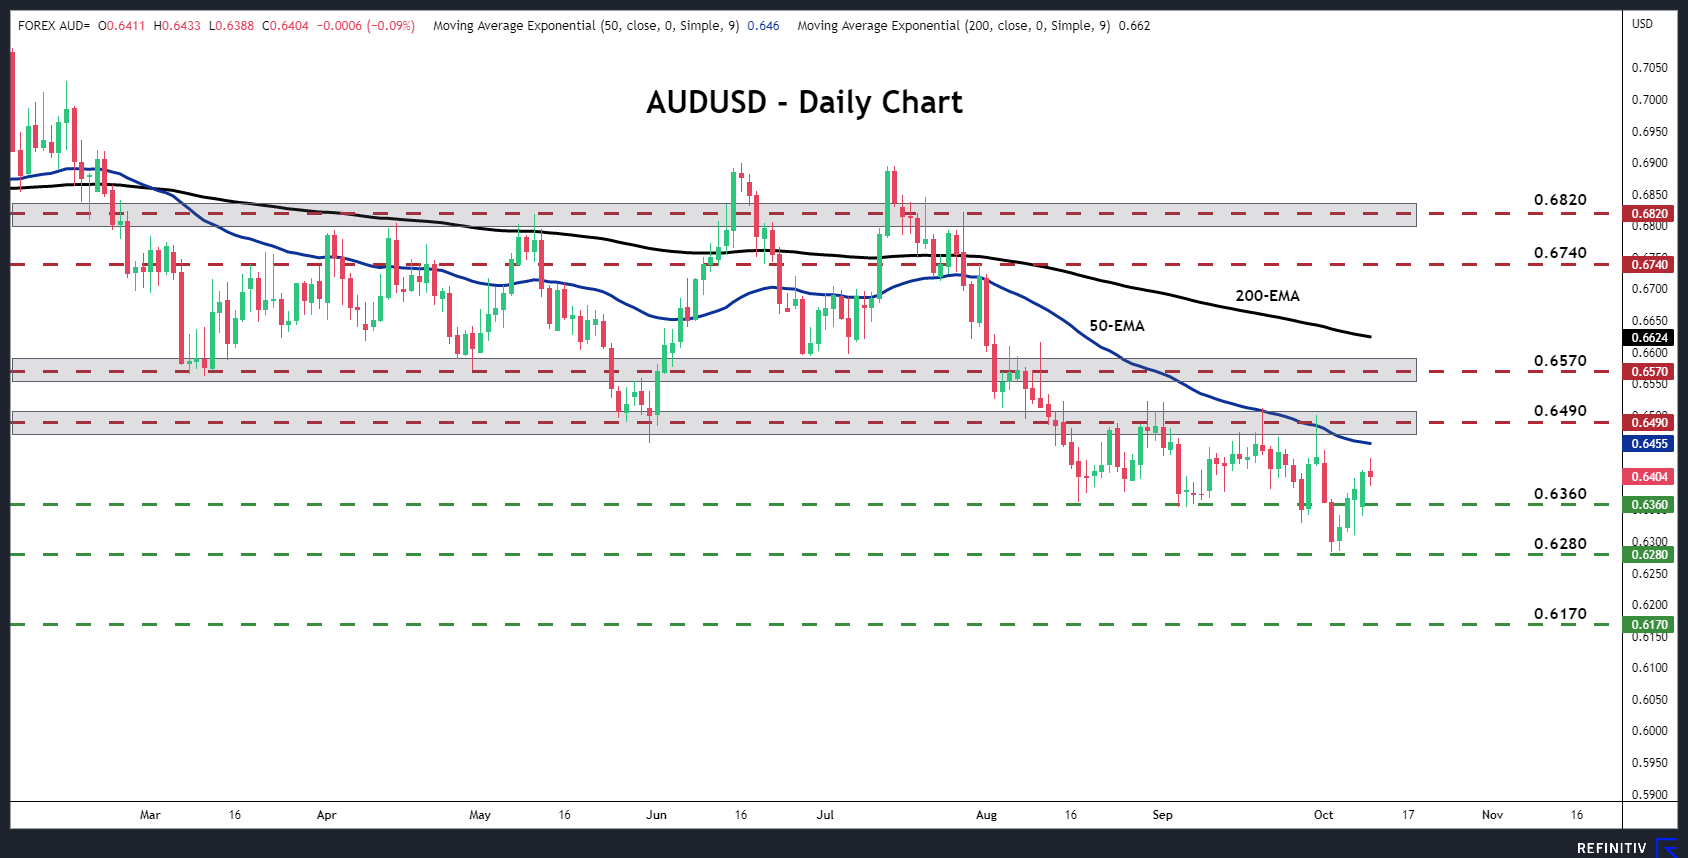
Ausse/dollar has been trading in a recovery mode since October 4, when it hit support at the 0.6280 zone. However, the pair is still trading below the key resistance barrier of 0.6490 and well below the lower bound of the sideways range that contained most of the price action between February and August. This suggests that the bears could claim control again soon and perhaps push for another test at around 0.6280. A break lower would confirm a lower low and may see scope for extensions towards the low of October 2022, at around 0.6170.
For the bearish outlook to be dismissed, aussie/dollar may need to climb all the way above the 0.6570 zone, a jump that would signal its return within the aforementioned sideways range.
Sunset Market Commentary
Markets:
Risk-on? Risk-off? Ongoing geopolitical tensions in the Middle East suggest the latter at least should have some role to play. However, with (European) equity indices adding about 1.5%+, investors clearly see other drivers for trading. In this respect, the sharp decline in US bond yields this morning in our view is driven by recent Fed talk rather than geopolitical uncertainty. Fed’s Jefferson yesterday evening joined colleagues Daly and Logan elaborating on the idea that higher LT (real) yields recently did (part of) the Fed’s job to further tighten monetary conditions. A ‘final’ Fed rate hike to 5.50/5.75% might be necessary, or at least can be delayed. During the morning session, risk sentiment was further supported by news that the Chinese government is considering a new round of fiscal stimulus (> 1 trillion yuan?) and a higher budget deficit to reaccelerate domestic growth. The EuroStoxx 50 currently gains 1.8% . US indices open marginally in green after already a nice intraday rebound yesterday. Even so, a risk-rebound combined with lower (US) yields remain a difficult balance. Stocks are rebounding on the prospect of less aggressive Fed tightening. However, if this move goes too far monetary conditions would ease again, potentially undermining Jefferson’s call. To be continued. US yields currently ease between 9 bps (30-y) and 11 bps (5-y), compared to 15+ bps declines registered this morning. The focus now turns to this evenings’ $46bn 3-y US Note auction and Thursday’s US CPI release. German yields already regain 5.5-6.0 bps (after yesterday’s correction of about 10 bps). ECB’s Villeroy repeated the standard mantra that rates are currently at the right level and need to stay at a plateau for sufficiently long. On the hawkish side of the ECB spectrum, Austrian board member Holzmann warned that, if additional shocks enfold, the ECB might still have to hike rates further. Easing global market conditions also take some pressure off intra-EMU government bond spreads, with Italy (and Portugal) outperforming (10-y spread -5 bps). On FX markets, the dollar is still looking for direction. DXY struggles not to fall below the 106 barrier, but the decline is limited given the risk-on and fall in US yields. EUR/USD briefly surpassed the 1.06 barrier, but the 1.0617 end September up-tick was left intact (currently 1.059). USD/JPY outperforms most other USD cross rates regaining the 149 barrier. With again little UK specific news, EUR/GBP is captured in order-driven trading near the 0.865 pivot.
News & Views:
Czech inflation fell by more than expected in September (-0.7% M/M vs -0.2% M/M). The Y/Y-outcome slowed from 8.5% to 6.9% (vs 7.5%), the lowest since December 2021. Inflation figures were significantly below the Czech National Bank’s projections as well (7.2% Y/Y). This was due mainly to a stronger-than-expected slowdown in food price inflation (6% vs 7.3% CNB forecast), lower core inflation (5% Y/Y vs 5.5%) and to a lesser extent weaker administered price inflation (15.3% vs 15.6%). By contrast, the Y/Y-decline in fuel prices (-6.6% vs -15.3%) was less pronounced than forecasted. Growth in goods prices slowed in particular, while growth in services prices moderated to a lesser extent. The decline in services price inflation was due to most categories together with a continued decrease in the contribution of imputed rent. CNB expects the downward trend in Y/Y-inflation to temporarily halt in October due to a lower comparison base last year before falling rapidly to the upper bound of the tolerance band around the 2% target early next year. Czech swap rates drop up to 15 bps at the front end of the curve as today’s data suggest the CNB might start its rate cut cycle at the next, November, meeting. EUR/CZK tests the YTD high at 24.60.
Headline Norwegian inflation unexpectedly declined for a second consecutive month. Prices fell by 0.1 M/M while consensus expected a 0.7% M/M increase. The Y/Y-measure consequently slowed from 4.8% Y/Y to 3.3% Y/Y, the lowest since January 2022. Underlying core inflation rose by 0.4% M/M (vs 0.7%) and with the Y/Y-figure decelerating from 6.3% to 5.7% (vs 6.1%), the lowest since November of last year. Details showed housing, water, electricity, gas and other fuels dropping by 1.8% M/M with prices for food and non-alcoholic beverages 1.2% M/M lower. Norwegian swap rates lose up to 12 bps at the front end of the curve with money markets reducing the likelihood that the Norges Bank will deliver on its flagged December rate hike from around 65% to 50%. The Norwegian krone was one of yesterday’s outperformers on the back of a higher oil price, but posts a U-turn today with the pair currently changing hands around EUR/NOK 11.50 from 11.40.
NFIB Small Business Optimism Index Pulls Back in September
NFIB's Small Business Optimism Index fell 0.5 points to 90.8 in September, coming broadly in line with market expectations for a moderate decline. September’s reading marks the 21st consecutive month below the historical average of 98.
Four of the ten subcomponents pulled back the month, five improved and one remained unchanged. Sizable declines were recorded in two indicators: expectations about an improvement in the economy (down 6 points to -43%) and expected credit conditions (down 4 points to -10%).
The labor market data was somewhat more upbeat. The net share of businesses planning to increase employment rose one point to 18%, while the share of firms with unfilled job openings rose 3 points to 43%, reversing the decline in the month prior. Quality of labor concerns fell back one point, with 23% of business owners identifying this as their top business problem. Inflation concerns held flat, also at 23%.
The share of firms increasing compensation held steady at 36%, while 23% of firms indicated that they planned to increase compensation, only partially reversing the 5 point gain in the month prior. The share of businesses 'raising' average selling prices held flat at 30% (up seven points from the cyclical trough in April), while the share of firms 'planning’ to raise average selling prices rose two points for the second month in a row to 29%.
Key Implications
After some improvement in early summer, small business confidence appears to be souring again, with the mild decline in September marking the second consecutive pullback in the headline confidence measure. Despite this, labor market indicators continue to flash green, with job openings and plans to increase employment both ticking higher in September, and quality of labor concerns remaining top of mind. This echoes the theme of continued resilience in the U.S. labor market observed in the latest payrolls report.
Businesses continue to boost compensation to attract workers. While the share of firms increasing and planning to increase worker compensation has come off their pandemic peaks, both measures remain elevated near their pre-pandemic levels. Meanwhile, the share of firms raising and planning to raise average selling prices are still above pre-pandemic highs, and have come off their cyclical troughs recently. These elements highlight the upside threat to inflation, with the Fed expected to keep its foot on the monetary policy brakes, and perhaps press them a bit harder over the near-term.
GBP/USD: Fresh Bulls Hold Grip But Need More Work to Signal Reversal
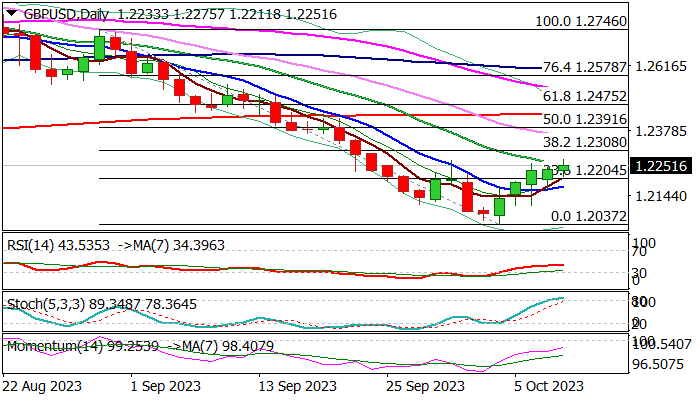
Cable rose to the highest in nearly two weeks on Tuesday, keeping in play near-term recovery which extends into fifth straight day.
Softer tone in the most recent comments from US policymakers, added to fresh but still limited risk appetite, keeping the pound underpinned for now.
Bulls probe through falling 20DMA (1.2252) with close above here to strengthen near-term structure for attack at pivotal Fibo barrier at 1.2308 (38.2% retracement of 1.2746/1.2037 downleg), violation of which would generate initial reversal signal.
On the other hand, caution is still required, as daily studies are still predominantly in bearish configuration (MA’s / momentum) and also turning overbought, warning that recovery may start running out of steam.
Dip-buying remains favored above 10DMA (1.2174) but expect the downside to be vulnerable while 20DMA caps.
Res: 1.2252; 1.2275; 1.2308; 1.2355.
Sup: 1.2204; 1.2174; 1.2105; 1.2052.
EUR/USD Mid-Day Outlook
Daily Pivots: (S1) 1.0533; (P) 1.0554; (R1) 1.0587; More...
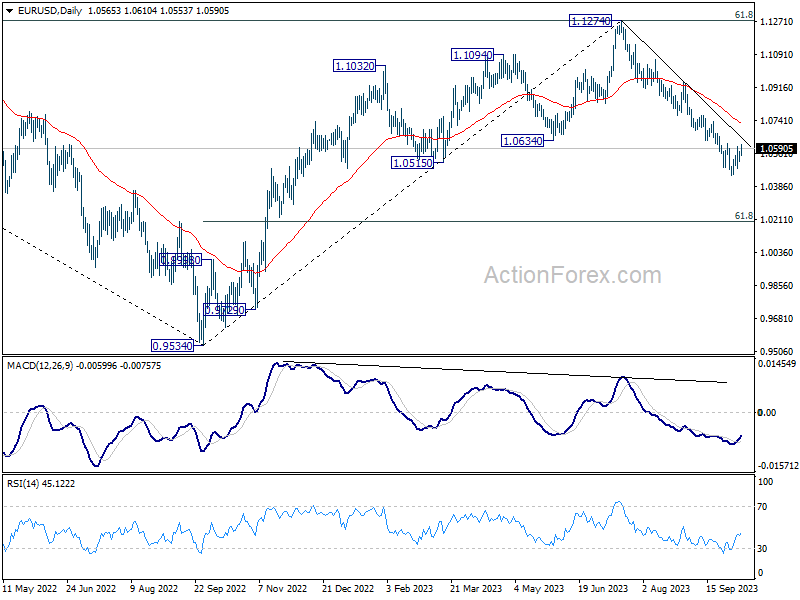
Intraday bias in EUR/USD remains neutral at this point. On the upside, firm break of 1.0616 resistance will confirm short term bottoming, and turn bias back to the upside for stronger rebound. Nevertheless, rejection by 1.0616 will retain near term bearishness. Break of 1.0447 will resume the fall from 1.1274 to 1.0199 fibonacci level next.
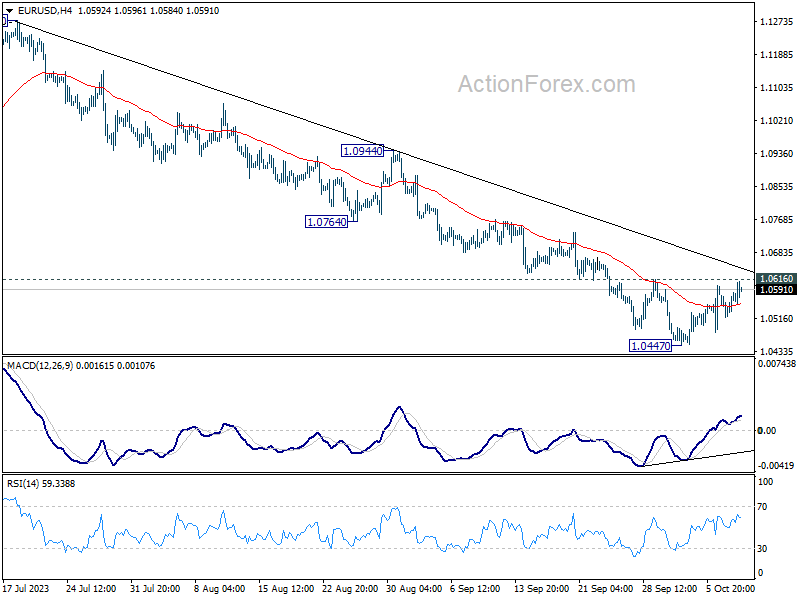
In the bigger picture, fall from 1.1274 medium term top could still be a correction to rise from 0.9534 (2022 low). But chance of a complete trend reversal is rising. In either case, current fall should target 61.8% retracement of 0.9534 to 1.1274 at 1.0199 next. For now, risk will stay on the downside as long as 55 D EMA (now at 1.0725) holds, in case of rebound.