Sample Category Title
Natural Gas Price Reaches 8-month High
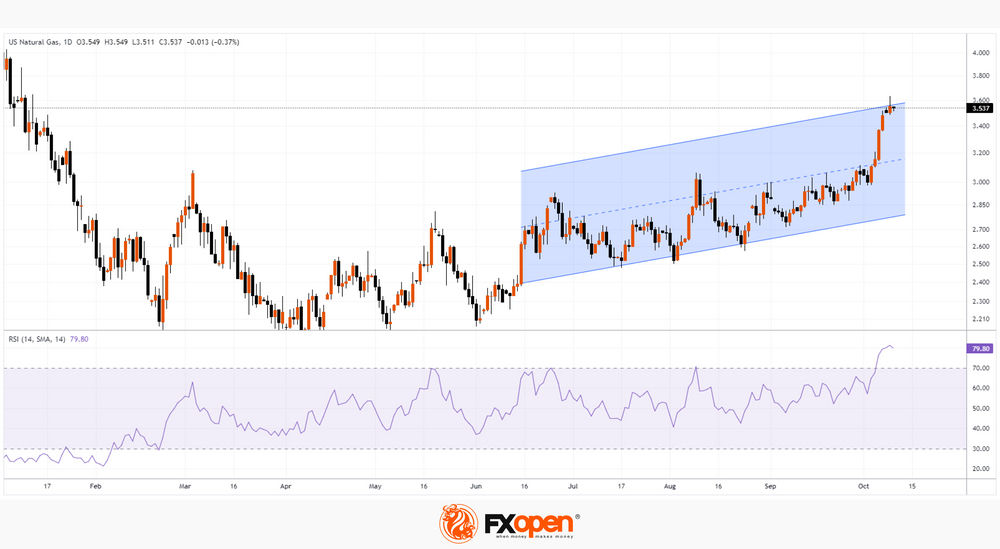
As the chart shows, yesterday, the price of gas rose above USD 3.60 for the first time since January of this year.
It can be assumed that events in Israel contributed to the price increase, since the Middle East is an important supplier of gas.
However, note that the bullish momentum started much earlier — gas prices have risen approximately 20% since the October 3 low. This confirms our assumptions about the bullish trend, which we published in the review on August 25th.
Perhaps the price of gas is influenced by seasonal factors and fears that weather conditions in the coming winter will be difficult.
Should we count on the continuation of the bullish trend?
If forecasters’ predictions worsen and the conflict in the Middle East flares up, this will certainly increase the likelihood of further price increases.
But in the short term, there are prerequisites for the formation of a rollback, since:
→ RSI indicates severe overbought;
→ the price has reached the upper limit of the parallel channel;
→ the tapering candles of the last days and the beginning of Tuesday demonstrate the presence of sellers — it is permissible to assume that buyers are taking profits.
This article represents the opinion of the Companies operating under the FXOpen brand only. It is not to be construed as an offer, solicitation, or recommendation with respect to products and services provided by the Companies operating under the FXOpen brand, nor is it to be considered financial advice.
EURJPY Reacted Strong From The Blue Box Area
In this technical blog, we will look at the past performance of the 4-hour Elliott Wave Charts of EURJPY. In which, the rally from 28 July 2023 low unfolded as an impulse sequence and showed a higher high sequence. Therefore, we knew that the structure in EURJPY is incomplete to the upside & should extend higher. So, we advised members not to sell the pair & buy the dips in 3, 7, or 11 swings at the blue box areas. We will explain the structure & forecast below:
EURJPY 4-Hour Elliott Wave Chart From 9.30.2023
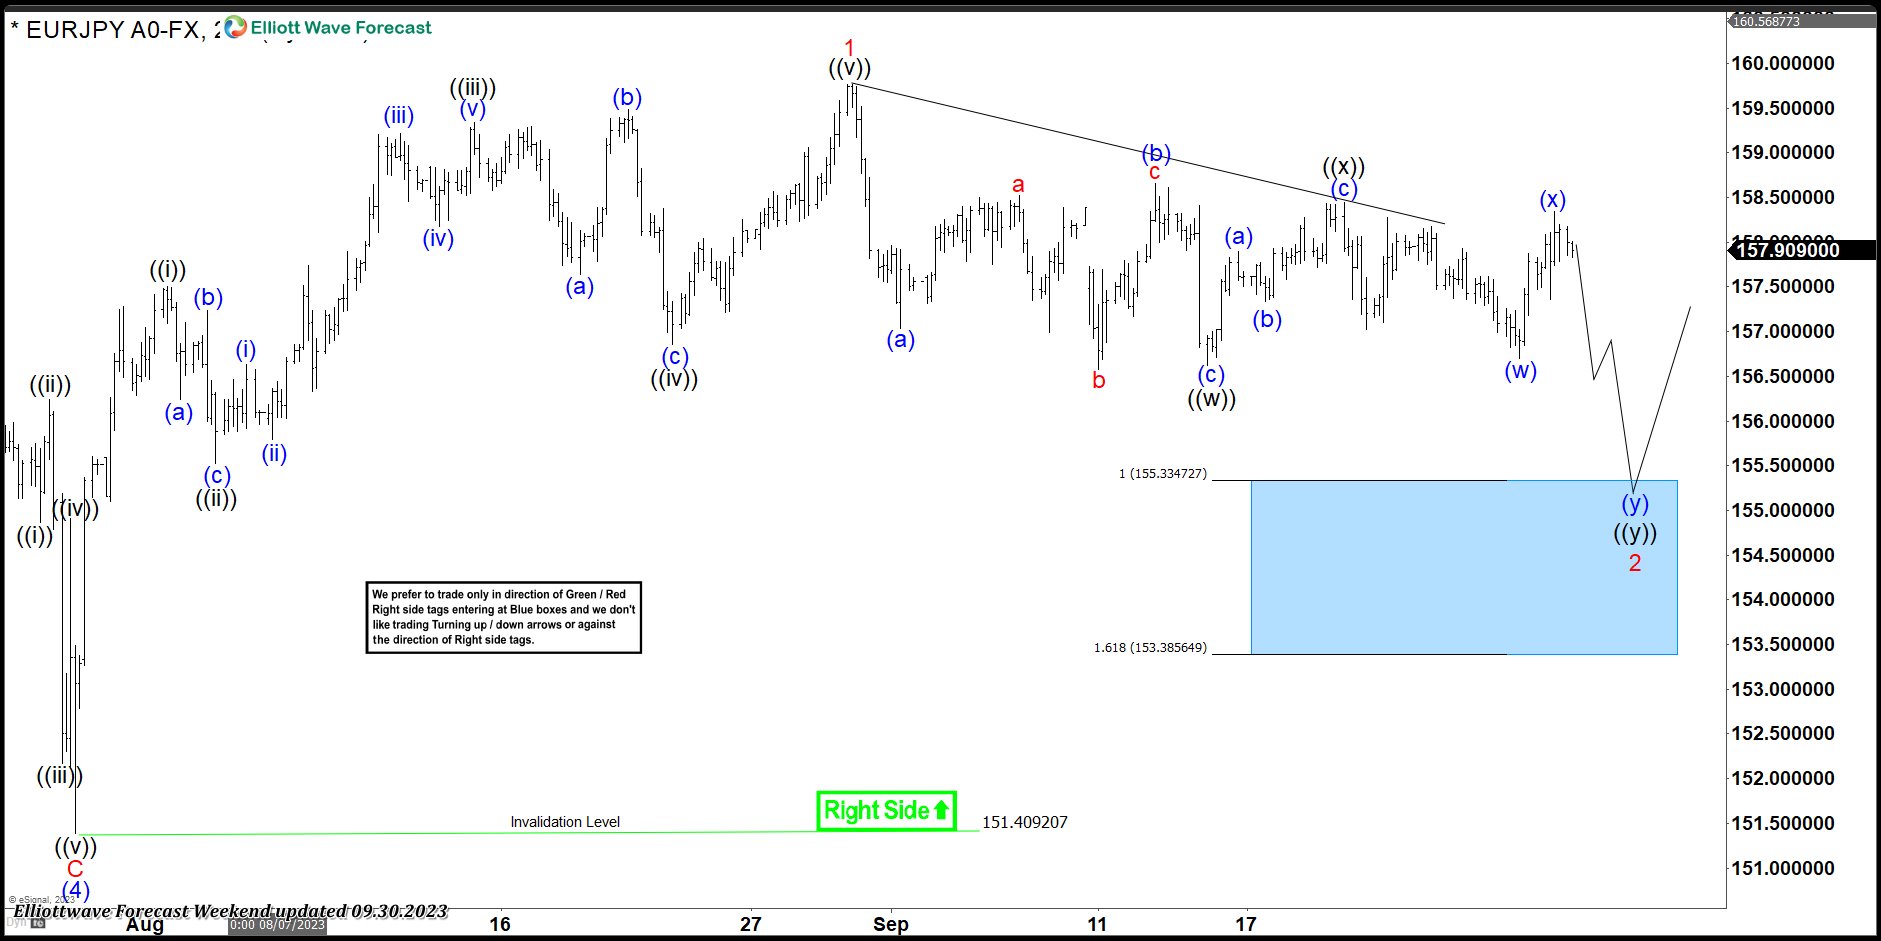
Here’s the 4hr Elliott wave Chart from the 9/30/2023 update. In which, the rally to 159.76 high ended wave 1 & made a pullback in wave 2. The internals of that pullback unfolded as Elliott wave double three correction where wave ((w)) ended in 3 swings at 156.62 low. Then a bounce to 158.47 high ended wave ((x)) & started the next leg lower in wave ((y)) towards 155.33- 153.38 blue box area. From there, buyers were expected to appear looking for new highs ideally or for a 3 wave bounce minimum.
EURJPY Latest 4-Hour Elliott Wave Chart
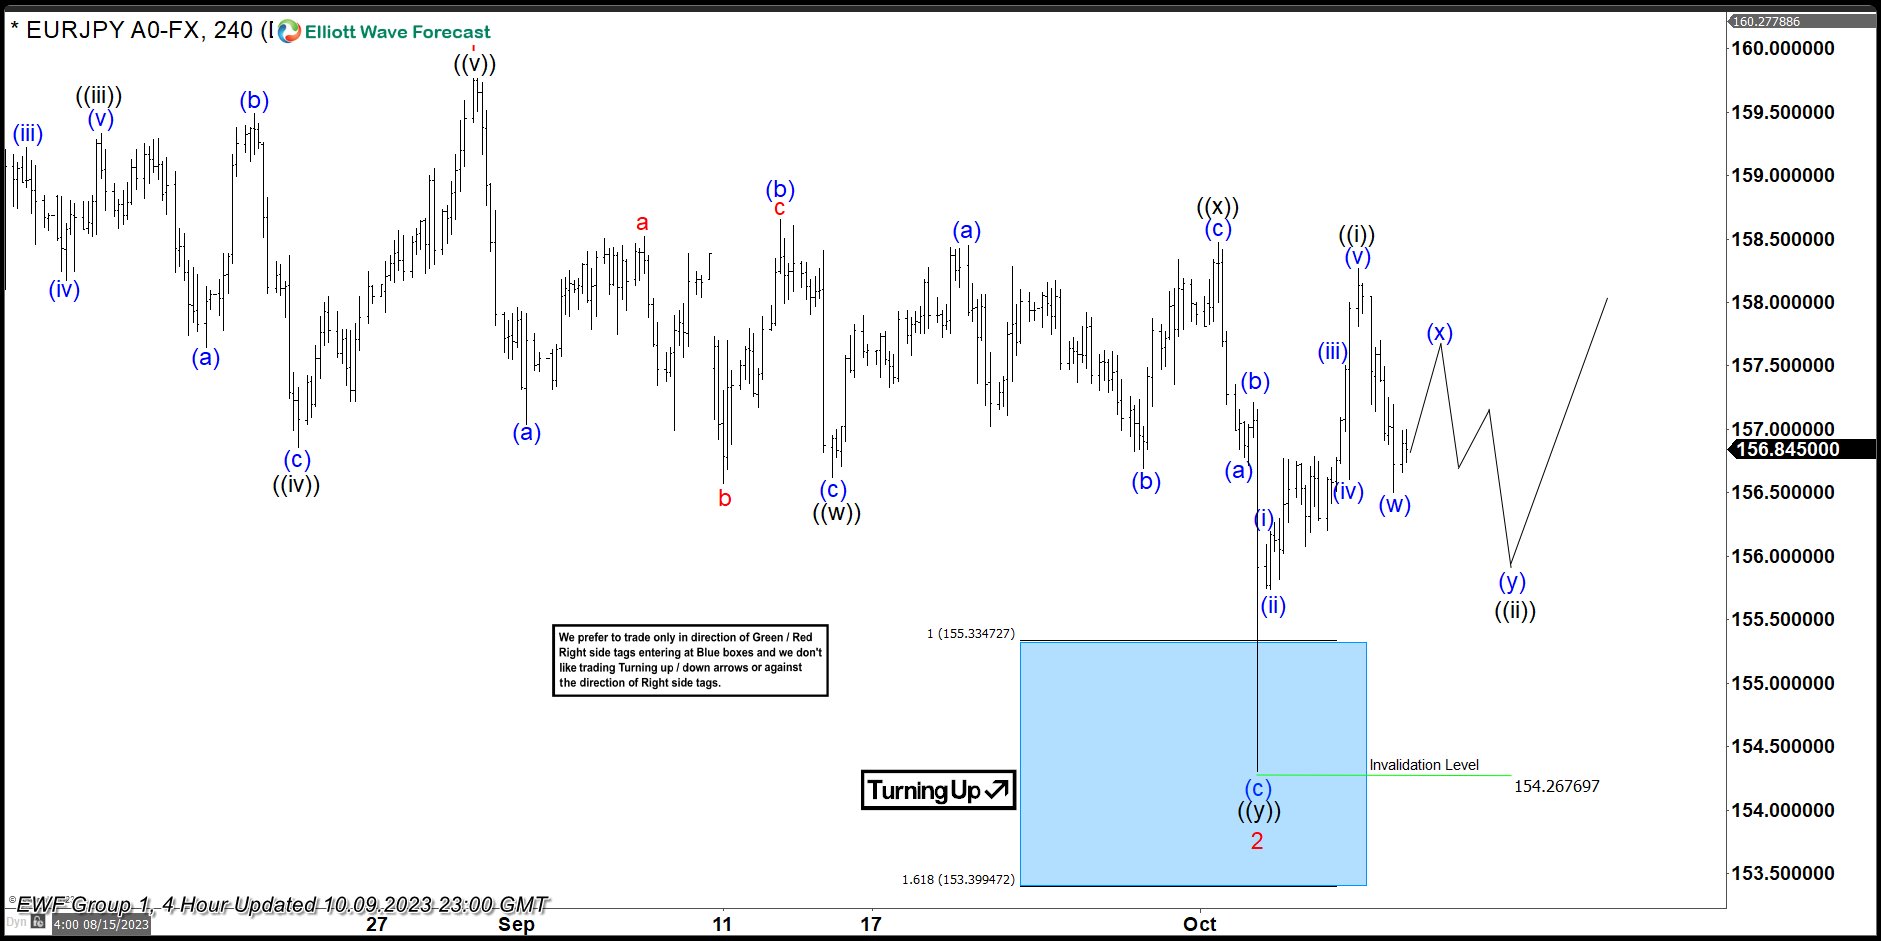
This is the latest 4hr Elliott wave Chart from the 10/09/2023 update. In which the pair is showing a strong reaction higher taking place, right after ending the double correction within the blue box area. Allowed members to create a risk-free position shortly after taking the long position at the blue box area. However, a break above 159.76 high is still needed to confirm the next extension higher & avoid further correction lower.
We Don’t See a Strong Case for Sustained USD Setback
Markets
Markets started the week with a guarded risk‐off bias as investors tried to assess the impact of the conflict between Hamas and Israel. However, with US bond markets closed (Columbus Day), the market dynamic evidently was kind of ‘incomplete’. Initial declines in German yields were limited to about 5 bps, but European bonds (and the US Treasury futures) gained traction later in the session. Aside from the uncertainty on the Middle East conflict, the move was at least partially inspired by Fed (and ECB) comments that markets interpreted as raising the case for a prolonged pause in the hiking cycles. Fed’s Logan and especially Fed vice Chair Jefferson again raised the point that the rise in long term (real) rates might have done some of the additional tightening that the Fed was aiming for to restore the supply/demand balance and cool inflation. ECB’s De Cos indicated that he sees ever more evidence that the transmission of recent policy tightening is becoming stronger and will continue in the near future. The bond rally accelerated. German yields closed between 9.3 bps (30‐y) and 11.6 bps (5‐y) lower. European equities finished in red (Eurstoxx 50 ‐0.77%), but US indices reversed initial softness to close up to 0.63% higher (S&P 500). The ‘mixed’ risk‐off with lower yields and at the same time equity resilience left the USD indecisive. DXY initially touched 106.60 but closed slightly lower at 106.08. EUR/USD also finished the day little changed at 1.057 even as the 10‐y spread between Italy and Germany ‘settled’ above the 200 bps mark. Oil is looking for a new ‘equilibrium’ in the $ 88/b area (Brent).
US yields open sharply lower, declining up to 15‐16 bps at maturities of 5 y(+) as investors adapt positions to rising geopolitical tensions and recent Fed comments. Most Asian indices open higher, with China being the exception to the rule. The eco calendar is thin. US NFIB small business confidence and the NY Fed inflation expectations are interesting but no market movers. Fed (Waller, Kashkari, Bostic) and ECB (Villeroy) speeches are wildcards. As is the $46bn 3‐y Note auction. With headlines on the tension in the Middle East still omnipresent, some order driven, maybe even ‘erratic’ repositioning might further enfold going into the key US CPI release on Thursday. The peak levels in yields touched last week, for now, look to have become strong resistance levels. For the US 10‐y yield, the 4.50% area (23% retracement of the uptrend since early May) might be a first support. EUR/USD currently holds a ST consolidation pattern between 1.0619 and 1.0448. Even as the USD didn’t convince post‐payrolls and given the geopolitical tensions, we don’t see a strong case for a sustained USD setback, with the euro also vulnerable to a shaky global sentiment.
News and views
The British Retail Consortium reported slowing September sales growth this morning. UK Total retail sales increased by 2.7% in September, against a growth of 4.1% in August. This was in line with the 3‐month average growth of 2.7% and below the 12‐month average growth of 4.2%. Food sales increased by 7.4% over the three months to September with non‐food sales decreasing by 1.2% over that period. The proportion of Non‐Food items bought online (penetration rate) decreased to 34.9% in September from 35.1% in September 2022. The CEO of the BRC said that the high cost of living continues to bear down on households with big ticket items performing poorly and the Indian summer delaying sales of autumnal clothing, knitwear and coats. The coming months are crucial for retailers as they enter the “Golden Quarter” and they’re investing heavily to support customers and bring prices down.
The Japanese Economic and Social Research Institute published its September Economy Watchers Survey this morning. The outcome disappointed both for the current situation (49.9 from 53.6 vs 53.2 expected) and the outlook (49.5 from 51.4 vs 51.3 expected). For both, it was the softest reading since January this year. In the forward looking component, we highlight a significant further decline in the employment component, from 52.2 to 48.9 and form levels as high as 58.2 in May.
Oil Rally Slows, US Yields and Dollar Fall
Oil prices surged more than 5% on Monday on rising geopolitical tensions in the Middle East. Rumours that Iran helped Hamas plan the attack added fuel to fire. Iran denied the allegations by the way, but an escalation of tensions between Iran, Israel, hence the US, could have severe consequences for global oil production as despite restrictions, Iran could increased its exports and shouldered a part of the global production since the Ukrainian war, as Russian oil was banned, and the West had little choice to let someone sell its oil. In August, Iran’s crude exports exceeded 1.4mbpd. It’s not much compared to the roughly 100 mio barrel demand per day, but it makes up for some of OPEC’s production cuts for example, and it has a potential to export up to 3-4mbpd. Therefore, pushing Iran out of the picture could be a nightmare. And this is exactly why the US is now going toward other sanctioned countries to see if there is something that could be done. Reuters says that the US makes progress in talks with Venezuela to relief sanctions to allow at least one more foreign oil company to take Venezuelan oil under some conditions.
The reaction rally in oil is easing, with the barrel of crude settling around $86pb this morning. Brent crude remains offered near the 50-DMA, near $88pb level. Upside risks prevail.
Elsewhere
Safe haven assets and oil companies amassed important capital inflows on Monday. Exxon Mobil jumped 3.5% and rally in oil stocks helped the British FTSE 100 limit gains in an otherwise depressive European trading session. Gold hit $1860 per ounce, as the US 10-year yield fell by a big chunk, around 18bp, on the back of increased inflows into the ten-year papers. The 2-year yield slipped below the 5% mark. That was on the back of some dovish comments from Federal Reserve (Fed) members yesterday. Dallas Fed President Lorie Logan said that the recent rally in US long term bond yields may mean that there’s less need for the Fed to tighten again. The S&P500 – which opened the week on a bearish note, rapidly recovered losses and closed the session 0.63% higher. Nasdaq advanced above the 100-DMA, but the European Stoxx 600 started the week on a bearish note. Besides the war news and the spike in oil prices, the news that Chinese spending during the Golden Week fell short of expectations, also hinted that they might buy less Louis Vuitton bags and Hermes scarfs – even with a cheaper euro.
In currencies, the US dollar gave back early gains, the EURUSD stabilized between 1.0560 and 1.0580 while the USDJPY eased to 148. More Fed members will be speaking today, and their comments could influence the intraday price moves in one way or the other. It is true that the recent rise in US yields is soothing for the Fed, which is trying to tighten the financial conditions in an economy that just wouldn’t slow. European Central Bank (ECB) Chief Christine Lagarde said that IMF cut its forecast for global growth, except for the US. We will soon hear more details about new forecasts as the IMF and World Bank hold their annual meeting in Africa this week. Any weakness in global growth prospects could help take the air off the oil rally, while any upside revision for the US growth could help stocks recover if the dovish Fed expectations don’t get smashed by hawkish comments.
US Yields Sharply Lower on Dovish Fed Comments
Market movers today
Focus continues to be on developments in the war between Israel and Hamas.
On the data front we get US NFIB small business optimism index. We also have more Fed speakers on tap and it will be interesting to see if they follow up on the comments from other Fed members yesterday highlighting the financial tightening from the recent rise in US yields.
In the Nordics focus will be on Norwegian CPI, see more below. Sweden also releases data on industrial orders as well as household consumption and monthly GDP indicator.
The 60 second overview
Risk sentiment improved overnight as dovish comments from Fed members fuelled a strong rally in US bonds in Asia after the US market was closed overnight. Fed Vice Chair Philip Jefferson said Monday officials could "proceed carefully" following the recent rise in Treasury yields. Fed member Lorie Logan from Fed Bank of Dallas stated the surge in long-term rates may mean less need for further tightening. Also risk markets calmed down from the initial uncertainty in the Middle East as there are not yet signs of a broader escalation of the conflict.
A top US general yesterday warned Iran to stay out of the conflict and US National Security Adviser John Kirby said the first tranche of a security aid package was on the way. US President Biden stated that at least 11 Americans had died in the attack by Hamas, which killed around 900 Israelis. Israel's Prime Minister Benjamin Netanyahu said the response had "only started," and "what we will do to the enemy will echo down through generations."
Equities: Global equities ended yesterday higher as investors to a large extent concluded that the Middle East conflict would not end up having a material impact on the global economy. US cash bond trading was closed yesterday for Columbus Day holiday, but equity investors took notice of the futures market indicating the massive drop we see in yields this morning as cash bond trading reopened. Hence, bond markets ultimately had a bigger impact on equity markets yesterday than the conflict in the Middle East. In the US, Dow +0.6%, S&P 500 +0.6%, Nasdaq +0.4% and Russell 2000 +0.6%. Asian markets are higher this morning led by Japan bouncing back. European futures are catching up on the strong afternoon session in US yesterday. US futures are marginally higher.
FI: European rates staged a strong rally in the late trading hours, where the most dramatic moves were seen in the real yields as the 10y German real rate was 18bp lower on the day. 10y German Bunds ended 11bp lower at 2.77%. During the afternoon, Fed's Logan said that the recent sell-off may reduce the need for additional rate hikes, and while the comments from Logan and the start of the rally coincided we find it unlikely that her comments were the catalyst for the rally as such. US was out for Columbus Day.
FX: Energy prices rose yesterday as the market digested the potential implications of the war between Hamas and Israel with oil rising above USD85/barrel. Sour risk sentiment across markets led to safe-haven currencies appreciating vs peers with both USD, JPY and CHF posing significant gains. Likewise, commodity sensitive currencies gained on the back of higher energy prices most notably EUR/NOK edging below 11.50. Today, the big event for NOK FX is the release of September inflation.
Credit: Markets were in risk-off mode after the resurgence of the Israel-Palestine conflict and credits were no exception. Itrax main widened 2.2bp to close at 87.7bp, while Itrax Xover widened 9.6bp to close at 463.2bp. The poor sentiment also quenched primary markets, which were fairly inactive.
Nordic macro
In Sweden the GDP indicator for August is due for release and we expect it to confirm the positive GDP momentum going into Q3 2023.
Growth in retail sales and net export of goods indicate growth, while a decline in hours worked points in a more negative direction. Also manufacturing production is likely to be on the weak side given a plunge in new orders in July and some weakness in NIER/PMI manufacturing index. All in all, data seems to suggest a positive trend in demand indicators (net exports, consumption) while the supply indicators (PVI, hours worked) are showing rather the opposite. Overall, however, we expect demand to have the upper hand.
In Norway, we expect core inflation to slow to 6.1% y/y, due mainly to base effects. This would be in line with Norges Bank's projections in the September monetary policy report. Besides base effects, there are some signs that inflationary pressures may now be easing. After tumbling in the first half of the year, the krone has now stabilised. Together with lower global price pressures this will soon start to bring imported inflation down somewhat. We have also seen that producer prices for food have stopped rising, which could mean that food inflation at the consumer level has peaked.
CHF/JPY Technical: Continuation of Potential Bullish Impulsive Up Move
- The 4-week of decline from late August 2023 has reached a key inflection point where the CHF/JPY may kickstart another bullish impulsive up move within its major uptrend.
- Price actions of CHF/JPY have cleared above its prior downward sloping 20-day moving average last Friday, 6 October.
- Watch the key short-term support at 163.60.
The CHF/JPY cross-pair has indeed tumbled as expected and hit the 162.10 support as highlighted in our report. It has declined by -515 pips from its 15 September 2023 minor swing high to 3 October 2023 intraday low of 160.01 reinforced by the unconfirmed Bank of Japan (BoJ) intervention to buy up JPY under the instructions of Japan’s Ministry of Finance.
In the past week, the CHF/JPY has staged a significant upside reversal of +425 pips from the 3 October 2023 low to today’s 10 Oct Asian session intraday high of 164.28 at this time of the writing which recouped almost 80% of its prior losses. This remarkable turnaround has also been attributed to the rising geopolitical risk premium where the CHF benefited as a “traditional” safe haven currency triggered by last weekend’s surprise large-scale attack on Israel that may have long-lasting negative ramifications in the Middle East region.
Major uptrend phase remains intact
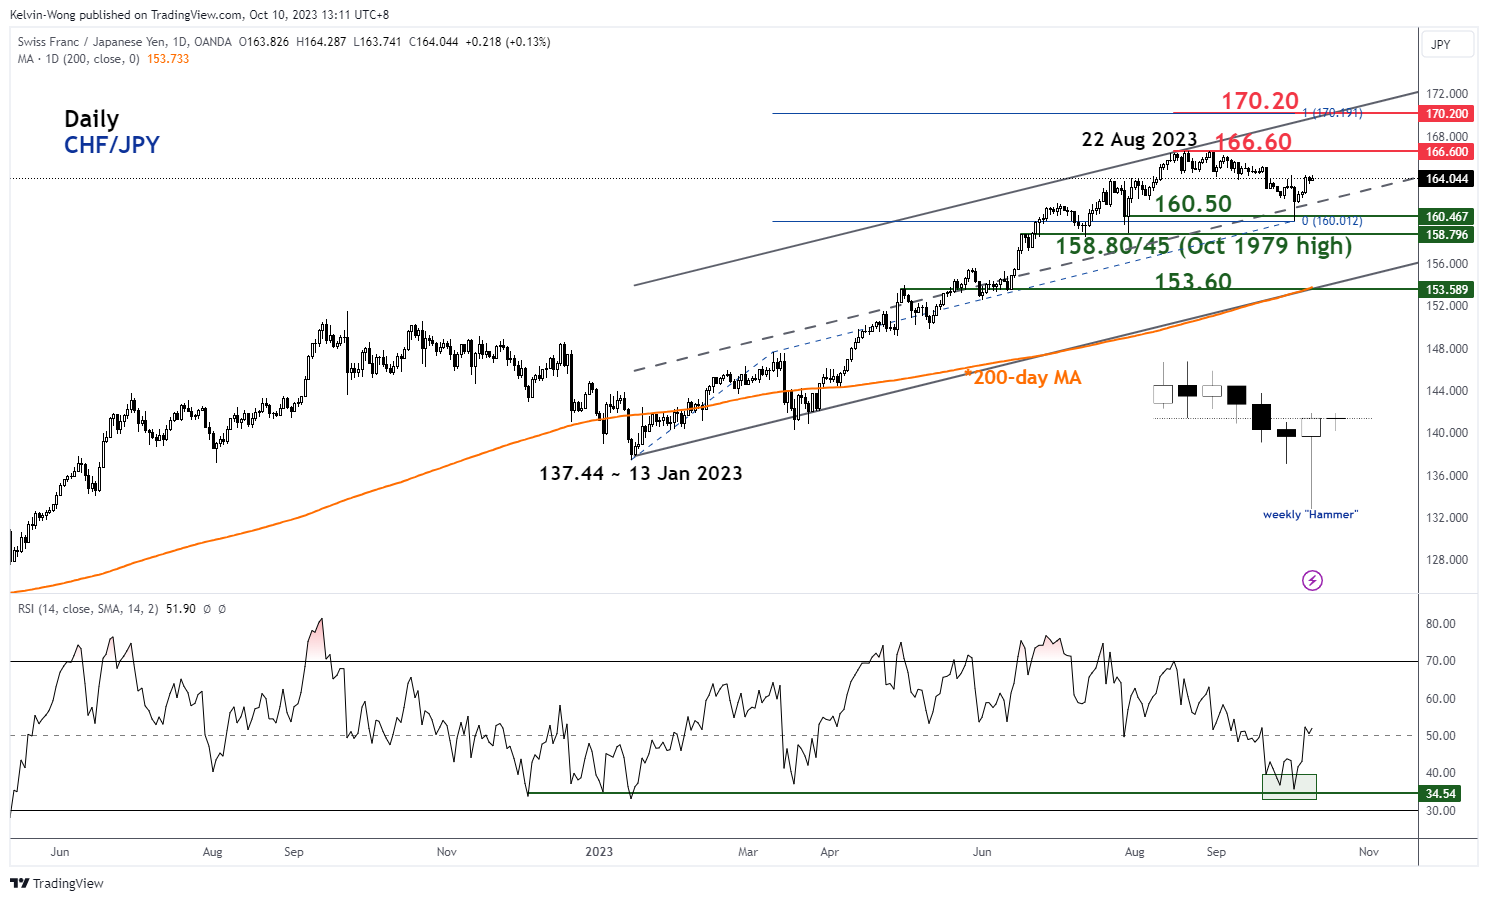
Fig 1: CHF/JPY major & medium-term trends as of 10 Oct 2023 (Source: TradingView, click to enlarge chart)
Despite the -657 pips/-3.95% decline seen in the CHF/JPY from its 22 Aug 2023 high of 166.60 to the recent 3 October 2023 low, the major uptrend phase from 13 January 2023 swing low remains intact.
Several positive elements have emerged in recent days that indicate, the current upside movement in the CHF/JPY is likely the start of a new impulsive up move sequence within its major uptrend phase.
Firstly, the CHF/JPY shaped a weekly “Hammer” bullish reversal candlestick for the week ended 6 October 2023 after a test on the median line of the major ascending channel that acted as support at 160.50. Secondly, the daily RSI indicator, a gauge of momentum has managed to reverse up from a parallel support at the 34 level which is close to the oversold region. These observations indicate a revival of medium-term upside momentum.
Reintegrated above 20-day moving average
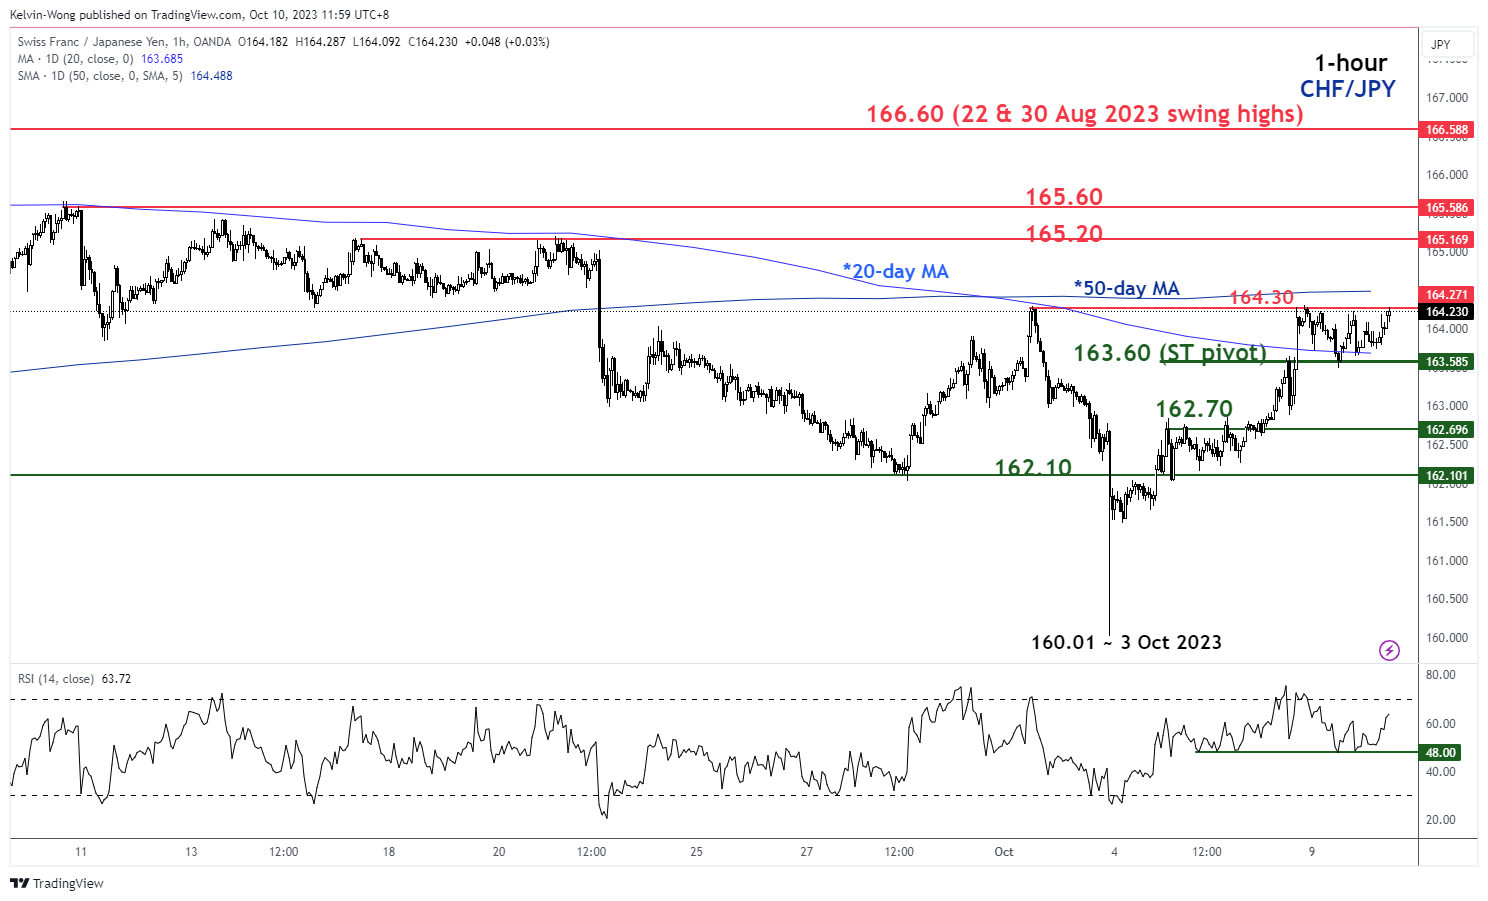
Fig 2: CHF/JPY minor short-term trend as of 10 Oct 2023 (Source: TradingView, click to enlarge chart)
As seen on the shorter-term 1-hour chart, the price actions of the CHF/JPY from the 3 October 2023 low of 160.01 has oscillated in a series of “higher highs and higher lows”, cleared above the 20-day moving average and yesterday’s retracement in price actions have managed to stall right at the 20-day moving now acting as a support at around 163.60.
Watch the 163.60 key short-term pivotal support to maintain the current short-term bullish tone and clearance above 164.30 near-term resistance (also the 50-day moving average) increases the odds of a further potential push up to test the next intermediate resistance at 165.20/165.60 in the first step.
On the flip side, a break below 163.60 negates the bullish tone to expose the next intermediate supports of 162.70 and 162.10.
GBP/JPY Daily Outlook
Daily Pivots: (S1) 181.23; (P) 181.77; (R1) 182.29; More...
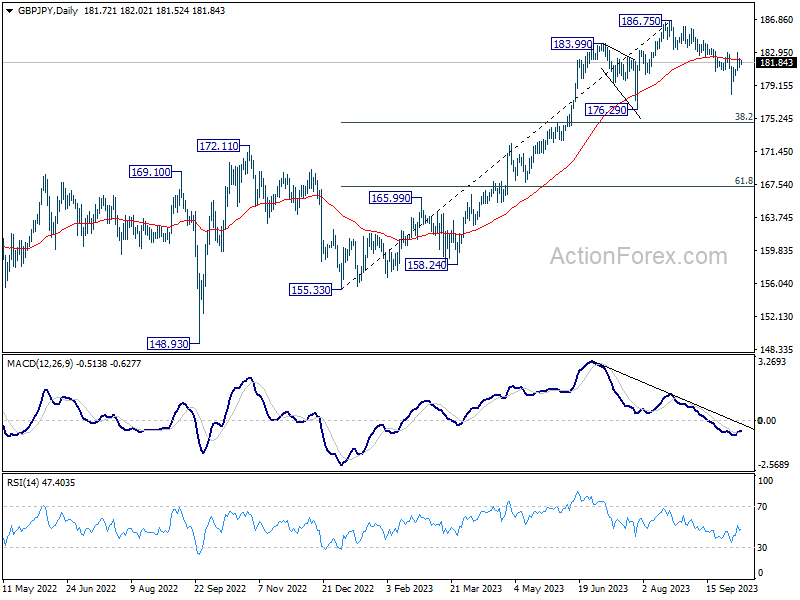
Range trading continues in GBP/JPY and intraday bias stays neutral. On the upside, firm break of 183.00 will argue that the pull back from 187.65 has completed, and turn bias back to the upside for retesting this high. On the downside, below 180.26 minor support will turn bias back to the downside for 178.02 again.
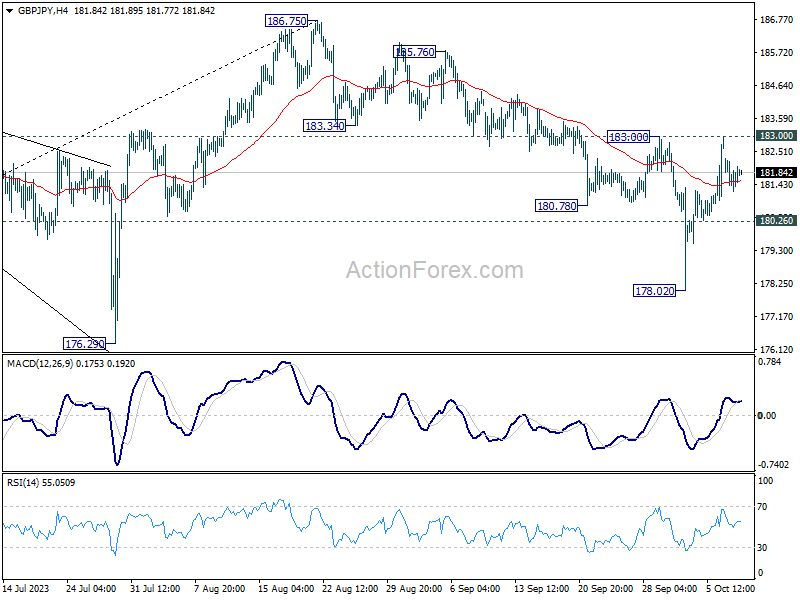
In the bigger picture, fall from 186.75 is currently seen as a corrective move only. As long as 176.29 support holds, larger up trend from 123.94 (202 low) should still be in progress. Break of 186.75 will target 195.86 (2015 high). Nevertheless, firm break of 176.29 will confirm medium term topping, and bring lengthier and deeper consolidations.
EUR/JPY Daily Outlook
Daily Pivots: (S1) 156.40; (P) 157.05; (R1) 157.58; More....
Range trading continues in EUR/JPY and intraday bias stays neutral at this point. On the upside, firm break of 158.464 will argue that the pull back has from 159.75 is completed. Bias will be turned back to the upside for resuming larger up trend through 159.75 high. On the downside, below 156.07 minor support will resume the fall from 159.75 through 154.32 support.
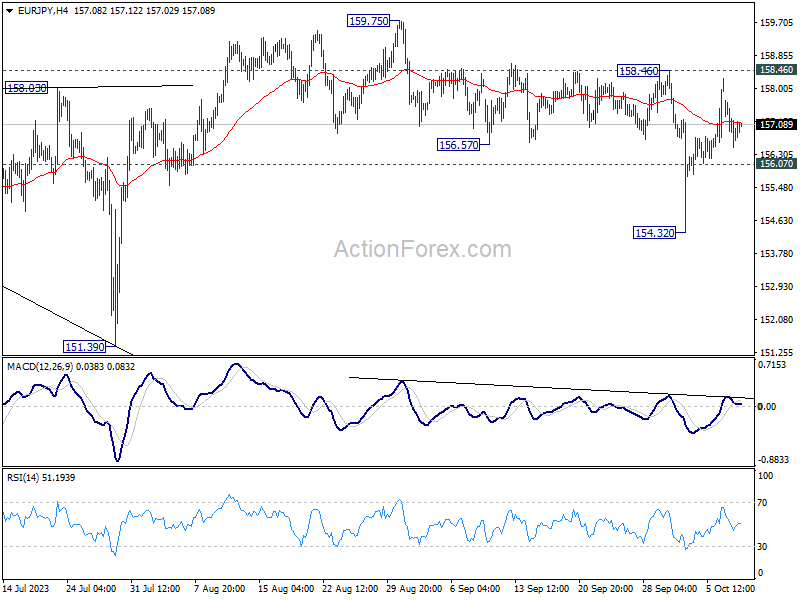
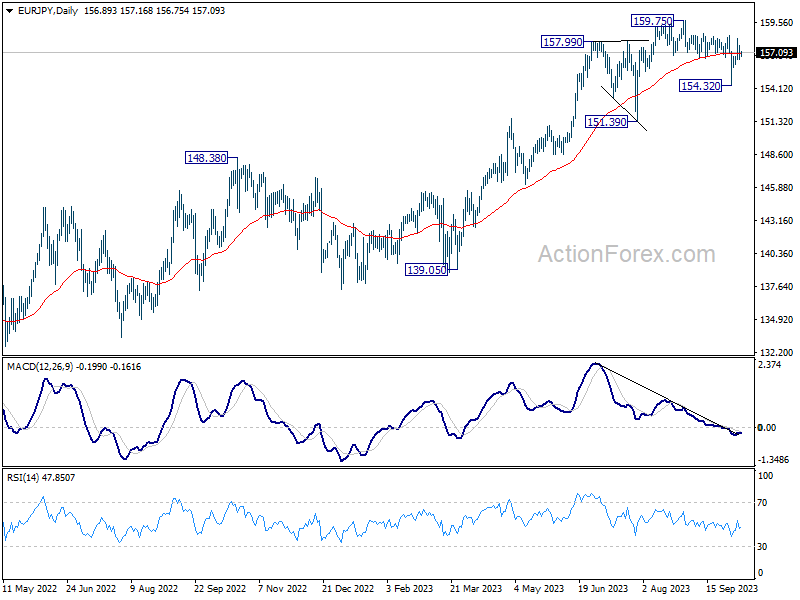
In the bigger picture, price actions from 159.75 are views as a corrective pattern for now. As long as 151.39 support holds, rise from 114.42 (2020 low) is still expected to continue through 159.75 at a later stage. Nevertheless, firm break of 151.39 will confirm medium term topping, and bring lengthier and deeper correction.
EUR/GBP Daily Outlook
Daily Pivots: (S1) 0.8625; (P) 0.8642; (R1) 0.8651; More....
Range trading continues in EUR/GBP and intraday bias stays neutral. On the upside, decisive break of 0.8700 resistance will carry larger bullish implication and bring stronger rally to 0.8874 resistance next. Nevertheless, rejection by this resistance will maintain bearish outlook that larger down trend is not over. Firm break of 0.8629 resistance turned support will turn bias back to the downside for 0.8568 support first.
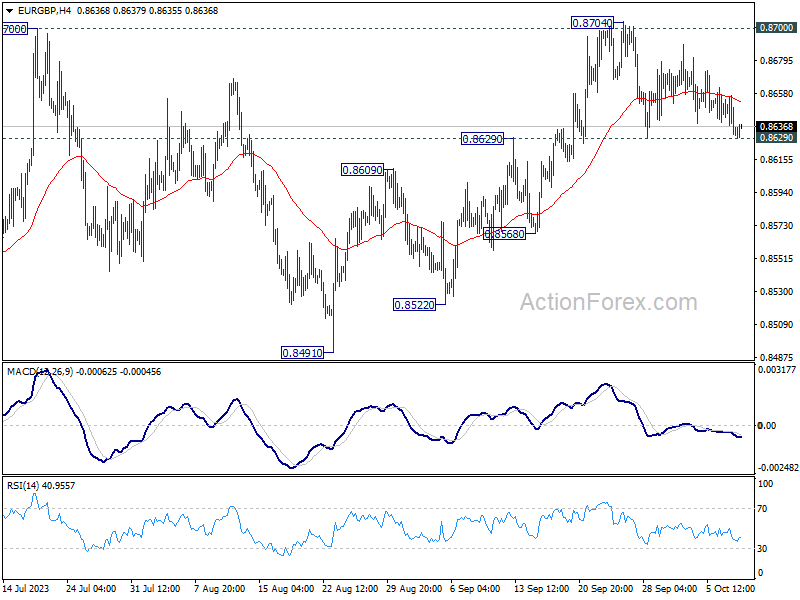
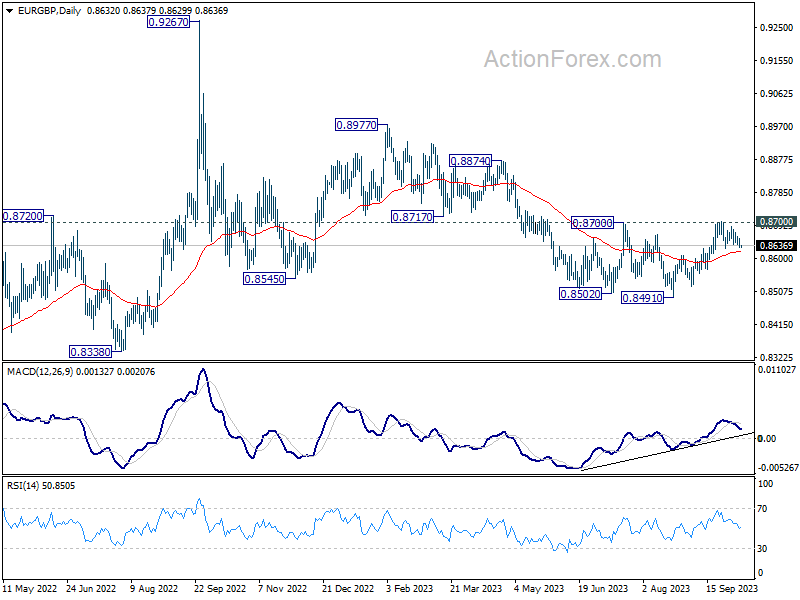
In the bigger picture, the down trend from 0.9267 (2022 high) is seen as part of the long term range pattern from 0.9499 (2020 high). Decisive break of 0.8700 resistance will argue that this decline has completed with three waves down to 0.8491. Rise from 0.8491 could then be another leg inside the pattern and targets 0.8977 and above. However, rejection by 0.8700 will keep the down trend alive for another fall through 0.8491 at a later stage.
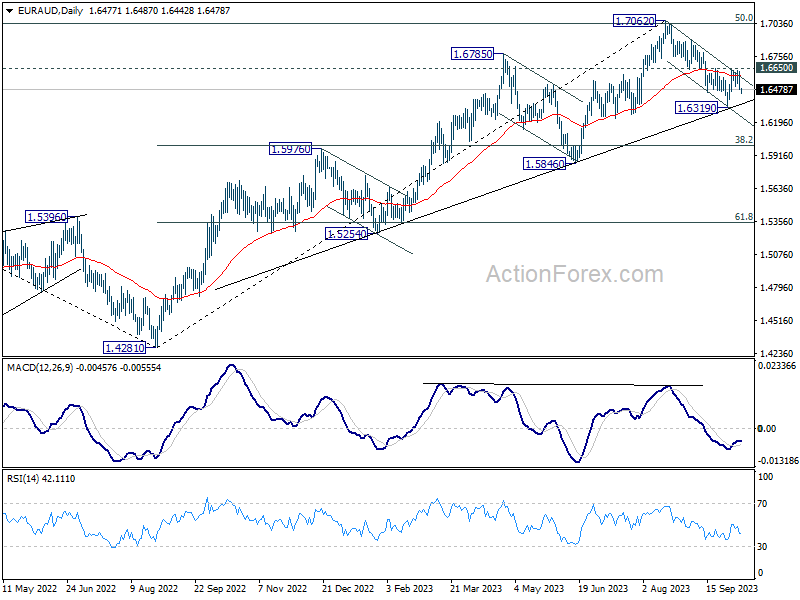
EUR/AUD Daily Outlook
Daily Pivots: (S1) 1.6428; (P) 1.6529; (R1) 1.6584; More...
Range trading continues in EUR/AUD and intraday bias stays neutral for the moment. On the downside, below 1.6446 minor support will bring retest of 1.6319. Break there will resume the decline from 1.7062 to 1.6000 fibonacci level. On the upside, firm break of 1.6650 resistance will argue that pull back from 1.7062 has completed, after drawing support from medium term rising trend line. Further rally would be seen back to retest 1.7062.
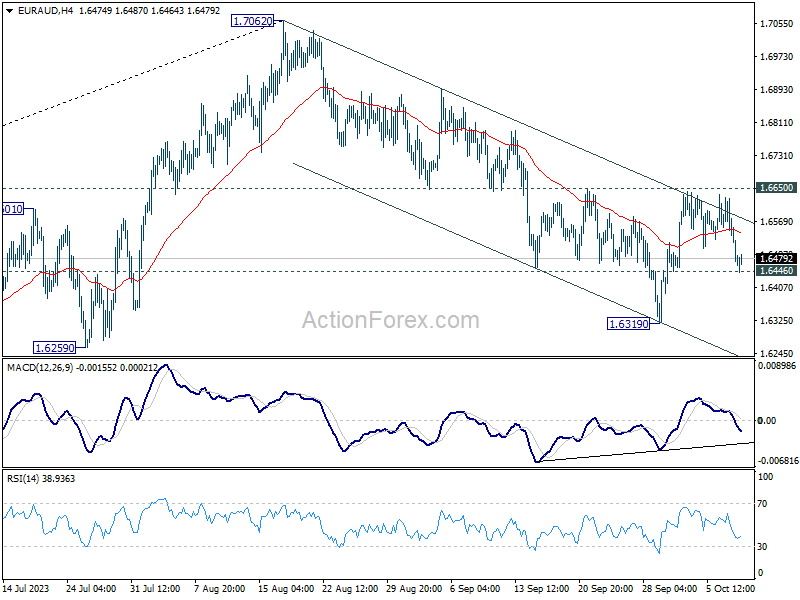
In the bigger picture, fall from 1.7062 is probably correcting whole up trend from 1.4281 (2022 low). Deeper decline would be seen to 38.2% retracement of 1.4281 to 1.7062 at 1.6000. Strong support could be seen there to bring rebound, at least on first attempt. This will remain the favored case as long as 1.6650 resistance holds.