

Sample Category Title
Will Natural Gas Futures Shift to a Bull Market?
- Natural gas futures reach caution area
- Market structure sends encouraging signals
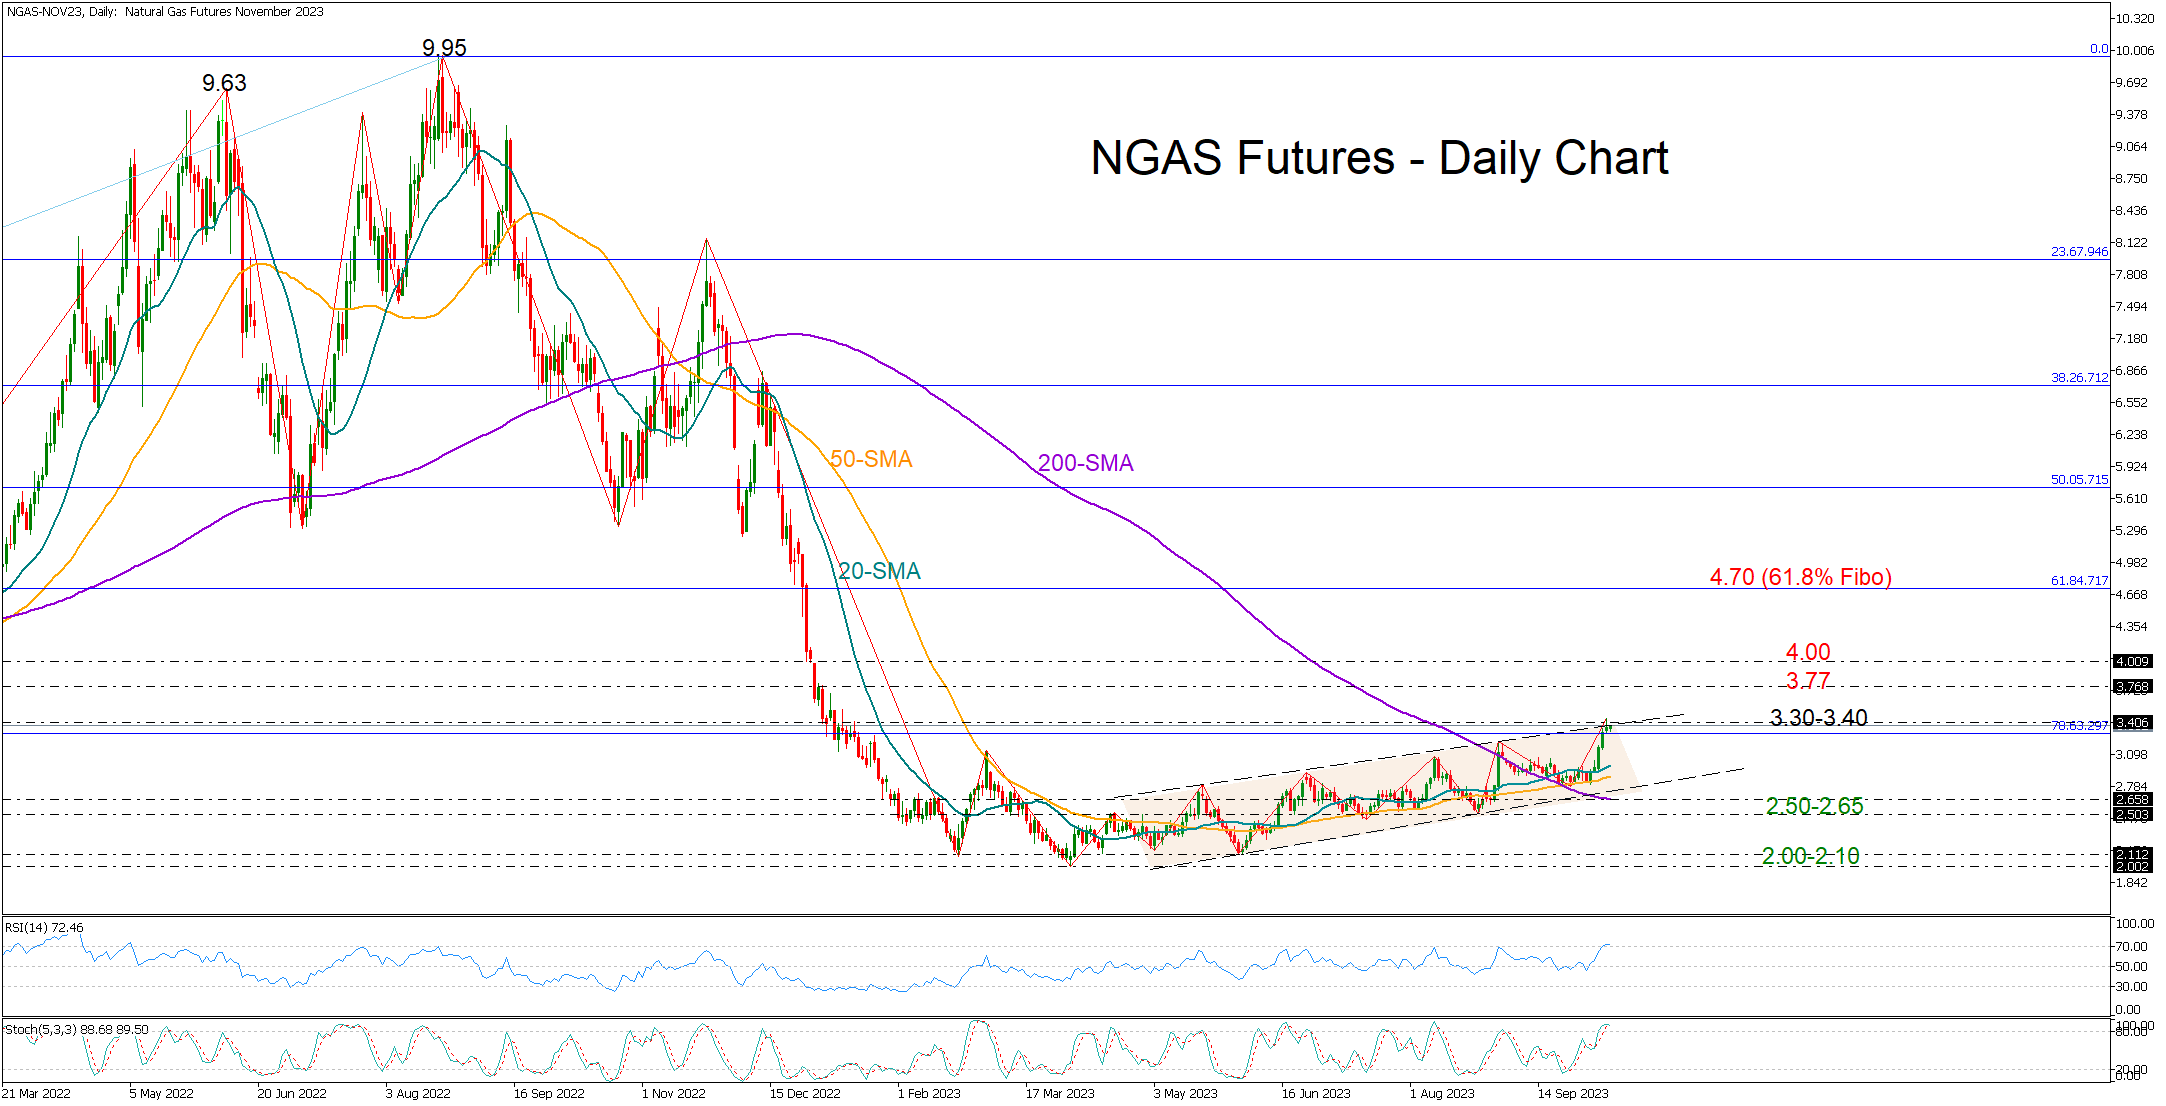
Natural gas futures (November delivery) have been gently trending up since April’s 32-month lows, marking new higher highs and higher lows at a soft pace.
The recent upturn in the price brought the January 2023 resistance territory of 3.40 under the spotlight. Interestingly, this is where the bulls faced confluence at the end of October 2020 before they cracked that wall and staged an impressive rally to 6.44 in June 2021.
Monday's candlestick, with a small body at the top of an upward channel, has raised concerns about an upcoming bearish wave. Note that the RSI and the stochastic oscillator have entered overbought waters.
Yet, the positive crossings of the short and long-term SMAs show an upward trend forming.
The 78.6% Fibonacci retracement of the 2020-2022 uptrend is currently buffering downside pressures around 3.30. If that floor stays firm, with the price ascending above the channel too, resistance could next emerge somewhere between 3.77 and the 2023 high of 4.00. A successful battle there could activate new buying orders up to the 61.8% Fibonacci of 4.70.
Alternatively, a slide below 3.30 could see a test of the 20- and 50-day SMAs, while the channel’s lower band and the 200-day SMA could reject any declines towards the 2.50 base. Should the latter give way, the bears may re-challenge the 2023 floor of 2.10-2.00 with scope to expand the downtrend to the 2020 base of 1.50.
In a nutshell, natural gas futures could experience some profit taking in the short-term following a week of gains. As regards the market trend though, there are signs of improvement.
AUD/USD Drifting After Mixed Confidence Data
- Australian consumer confidence rebounds, business confidence eases
- Fed members say higher bond yields could cool inflation
The Australian dollar is unchanged on Tuesday, trading at 0.6412.
Australian consumer confidence rebounds, business confidence ticks lower
Australia’s Westpac consumer confidence index rebounded in October with a 2.9% gain to 82, up from 79.7 in September. This was the highest level in six months, but consumer confidence remains deep in pessimistic territory, below the neutral 100 level. The survey found that consumers remain concerned about high inflation and the possibility of higher interest rates. The latter is somewhat surprising, as the Reserve Bank of Australia has held rates for four straight months, but nevertheless, consumers are wary about further rate hikes.
The Westpac survey found that family finances remain under pressure, which dovetails with the Reserve Bank of Australia’s finance stability report, which found a large number of households are experiencing stress over their mortgage payments.
Australia’s NAB Business Confidence came in at 1 in September, unchanged after the August reading was revised from 2 to 1. Business conditions eased in August to 11, down from 14, with the employment sub-index component declining.
The RBA has paused four straight times and the futures markets have priced in another pause at the November 7th meeting at 95%. At the meeting earlier this month, RBA Governor Bullock said that additional rate hikes were a possibility, but the markets are viewing this as lip service in order not to lose credibility in the event that the central bank unexpectedly raises rates.
With no major US releases until Wednesday, the focus has been on Fedspeak, with a host of Fed members making public statements early in the week. On Monday, Fed members Jefferson and Logan said the spike in long-term bond rates could mean less of a need for the Fed to raise rates. The reason is that borrowing had become more expensive and inflation could ease without the Fed needing to raise rates.
US 10-year yield rates rose as high as 4.8% last week, a 16-year high, compared to 4.0% in July. Higher yields on Treasuries have led to an increase in other borrowing costs, including mortgages and consumer loans. This could put the Fed’s hopes for a soft landing in jeopardy and are providing support for the Fed to hold rates until next year. The odds of a rate hike before the end of 2023 have fallen to 27%, compared to 39% just one week ago, according to the CME FedWatch Tool.
AUD/USD Technical
- 0.6372 is a weak support line. Below, there is support at 0.6338
- There is resistance at 0.6458 and 0.6531
USD/JPY: Daily Studies Point to Further Gains after Consolidation
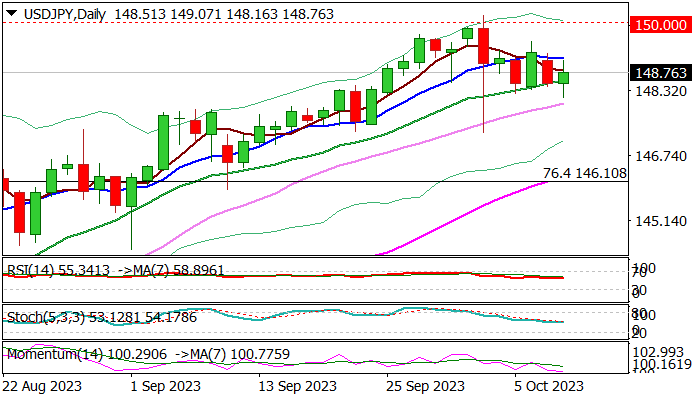
USDJPY regained traction on Tuesday but remains within a congestion which extends into fourth consecutive day.
Pullback from 2023 peak (150.16) was repeatedly limited by rising 20DMA (currently at 148.58) which signals strong bids.
Larger uptrend from 127.22 (2023 low) remains intact and near-term action so far points to a shallow correction before bulls resume.
Initial bullish signal to be expected on close above 10DMA (149.12) which will open way for retest of pivotal barriers at 150.00 (psychological) and 150.16 (2023 high), guarding 2022 peak / multi-decade high (151.94).
Strong positive momentum on daily chart, Tenkan-sen/Kijun-sen in bullish setup and the action being underpinned by rising and thickening daily Ichimoku cloud, keep the upside in focus and point to further gains.
Caution on break below 20DMA which would weaken near-term structure, but extension and close below Oct 3 spike low (147.29) is needed to sideline bulls and signal deeper correction.
Res: 149.12; 149.53; 150.00; 150.16.
Sup: 148.00; 147.29; 146.10; 145.90.
Risk Appetite Improves Amid More Balanced Fed Commentary
Equity markets are bouncing back on Tuesday after a risk-averse start to the week, buoyed perhaps by some promising Fed commentary on Monday.
It would appear the recent surge in bond yields hasn't gone unnoticed at the central bank, to the extent that Fed officials are coming across as less hawkish in their views. Higher yields have been cited by various policymakers in what appears to be a sign that they are a little uneasy about how much influence recent commentary has had.
While the Fed has previously signalled that another rate hike is likely in the tightening cycle, the central bank is ultimately data-dependent and won't want markets getting too carried away. It's a tough balancing act and inflation data will be released on Thursday which should provide further clarity again after Friday's mixed jobs report.
It is perhaps a little surprising that markets have bounced back as quickly and strongly as they have given the clear risk aversion we saw at the start of the week. Hamas attacks in Israel created uncertainty around the Middle East and investors will no doubt continue to monitor the situation very closely.
In light of the Fed commentary on Monday and how it's contributed to the turnaround in the markets, there'll be a lot of focus on further appearances today including Raphael Bostic, Christopher Waller, Neel Kashkari, and Mary Daly from the Fed and Christine Lagarde, President of the ECB.
IMF expects lower global growth and higher inflation next year
The IMF released its world economic outlook this morning and there wasn't too many surprised in its forecasts. The global economy is expected to grow by 3% this year, unchanged from the July forecasts, and 2.9% next year, down 0.1% from previously. The US saw its growth forecast raised to 2.1% this year and 1.5% next, while China and the eurozone were less fortunate seeing cuts in both years. The UK saw its 2023 forecast revised higher by 0.1% to 0.5% but 2024 slashed from 1% to 0.6%.
It also revised its global inflation forecast to 5.8% next year from 5.2% in July, which may suggest it expects central banks to maintain a more restrictive policy for longer. All things considered, there are no major surprises in the forecasts and given the immense uncertainty and constantly changing landscape, I expect things will look very different again when the next set of forecasts are released in a few months.
Oil will remain sensitive to developments in Israel and Gaza
Oil prices will likely remain very sensitive to events in Israel and Gaza, not to mention how other countries in the Middle East respond to the attacks. Iran has been accused of assisting in the attack which it denied while supporting those that carried it out. With many other major oil-producing nations in the region, traders will be on high alert for any escalation and what the knock-on effects will be.
Brent crude has partially pared its gains at the start of the week but remains around 4% above Friday's close so traders are clearly anxious. Price action will likely remain volatile over the coming days due to the risk of significant escalation. Brent remains more than 7% from the highs a couple of weeks ago and it will be interesting to see whether this gap closes further after the sharp correction that followed those highs.
Gold pares gains as risk appetite improves
Gold rallied strongly at the start of the week in risk-averse trade, with traders drawn to traditional safe-haven assets in times of geopolitical risk and heightened uncertainty. This followed a decent rally off the lows on Friday as well, taking the rebound to around 3%.
The question now is whether there's more of a correction on the cards, especially if we continue to see more balanced commentary from Fed officials. It's already run into some resistance - perhaps some profit-taking - just above $1,860 around the 38.2% Fibonacci retracement level - 20 September highs to October lows. If it does push higher, the 50% and 61.8% levels fall close to $1,880 and $1,900 which will make those levels interesting as well.
Ethereum Loses Ground
Market picture
Another attempt by Bitcoin to break above $28K triggered a wave of selling that took the price back to $27.2K at the peak of the decline. Interestingly, the pressure on Bitcoin came when the risk appetite in traditional markets was recovering. We attribute this to Monday’s US defaulted debt markets rather than the moving of money from one asset to another.
Technically, bitcoin has established $28K as a severe resistance level but is not yet on a clear downward path.

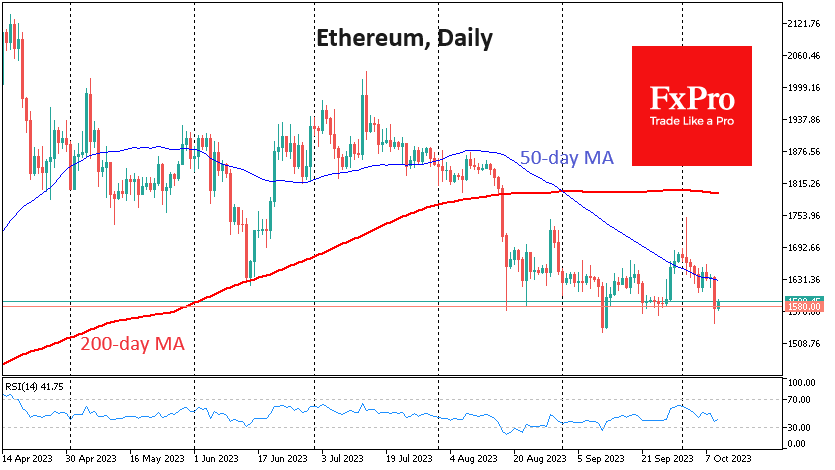
Ethereum remains weaker than the market, having pulled back below $1580 on Monday evening – the bottom of the last two months’ range. So far, the situation looks more like a smooth downtrend with a possible pause near significant support. But without a confident reversal from current levels, we can’t talk about stopping the decline.
News background
According to CoinShares, investments in crypto funds increased by $78 million last week, continuing the inflow for the second week. Bitcoin investments increased by $43 million, and Ethereum investments increased by $10 million. Solana saw its largest weekly influx since March 2022 at $24 million, continuing to establish itself as the altcoin of choice.
Last week was an essential test for Ethereum investors following the launch of six futures ETFs in the US. They raised just under $10 million in their first week, in sharp contrast to a similar bitcoin ETF that raised $1 billion in October, according to CoinShares.
Most investments in cryptocurrencies will be devalued entirely, said Charles Munger, vice chairman of Berkshire Hathaway and an associate of Warren Buffett.
The UK’s Financial Conduct Authority (FCA) has drawn up a blocklist of 143 cryptocurrency companies with which it is not advisable to do business. The list includes popular crypto exchanges HTX and KuCoin.
The Solana development team announced the rollout of the 1.16 update to the network, significantly reducing the RAM requirements of validator hardware and allowing for confidential transactions.
Binance exchange CEO Changpeng Zhao ruled out an explosive rise in bitcoin immediately after the halving. According to him, BTC usually does not reach new highs until a year after the miners’ reward is cut.
ECB’s Villeroy: We’re not at similar situation to Kippur War
In an interview with franceinfo radio, ECB Governing Council member Francois Villeroy de Galhau affirmed that the current interest rates, pegged at a historical high of 4% after ten consecutive hikes, are positioned at a "good level". Furthermore, Villeroy added that the prevailing economic climate doesn't warrant additional rate hikes.
However, Villeroy didn't mince words when expressing his apprehensions about the escalating oil prices. The surge in prices this week can be attributed to potential disruptions in supply, catalyzed by the military confrontations between Israel Palestinian Islamist group Hamas. Such geopolitical tensions have historically influenced global oil prices. A notable instance from the past is the 1973 Yom Kippur War, which had a significant bearing on oil price dynamics.
Addressing this historical context, Villeroy remarked, "I don't think that we are today in a similar situation (as the Kippur War) but we must of course remain very vigilant." He went on to underscore that such events amplify the existing economic uncertainty.
GBPUSD Retains Upswing But Needs More Backing
- GBPUSD pauses upturn from seven-month low
- Short-term signals are improving but threats exist
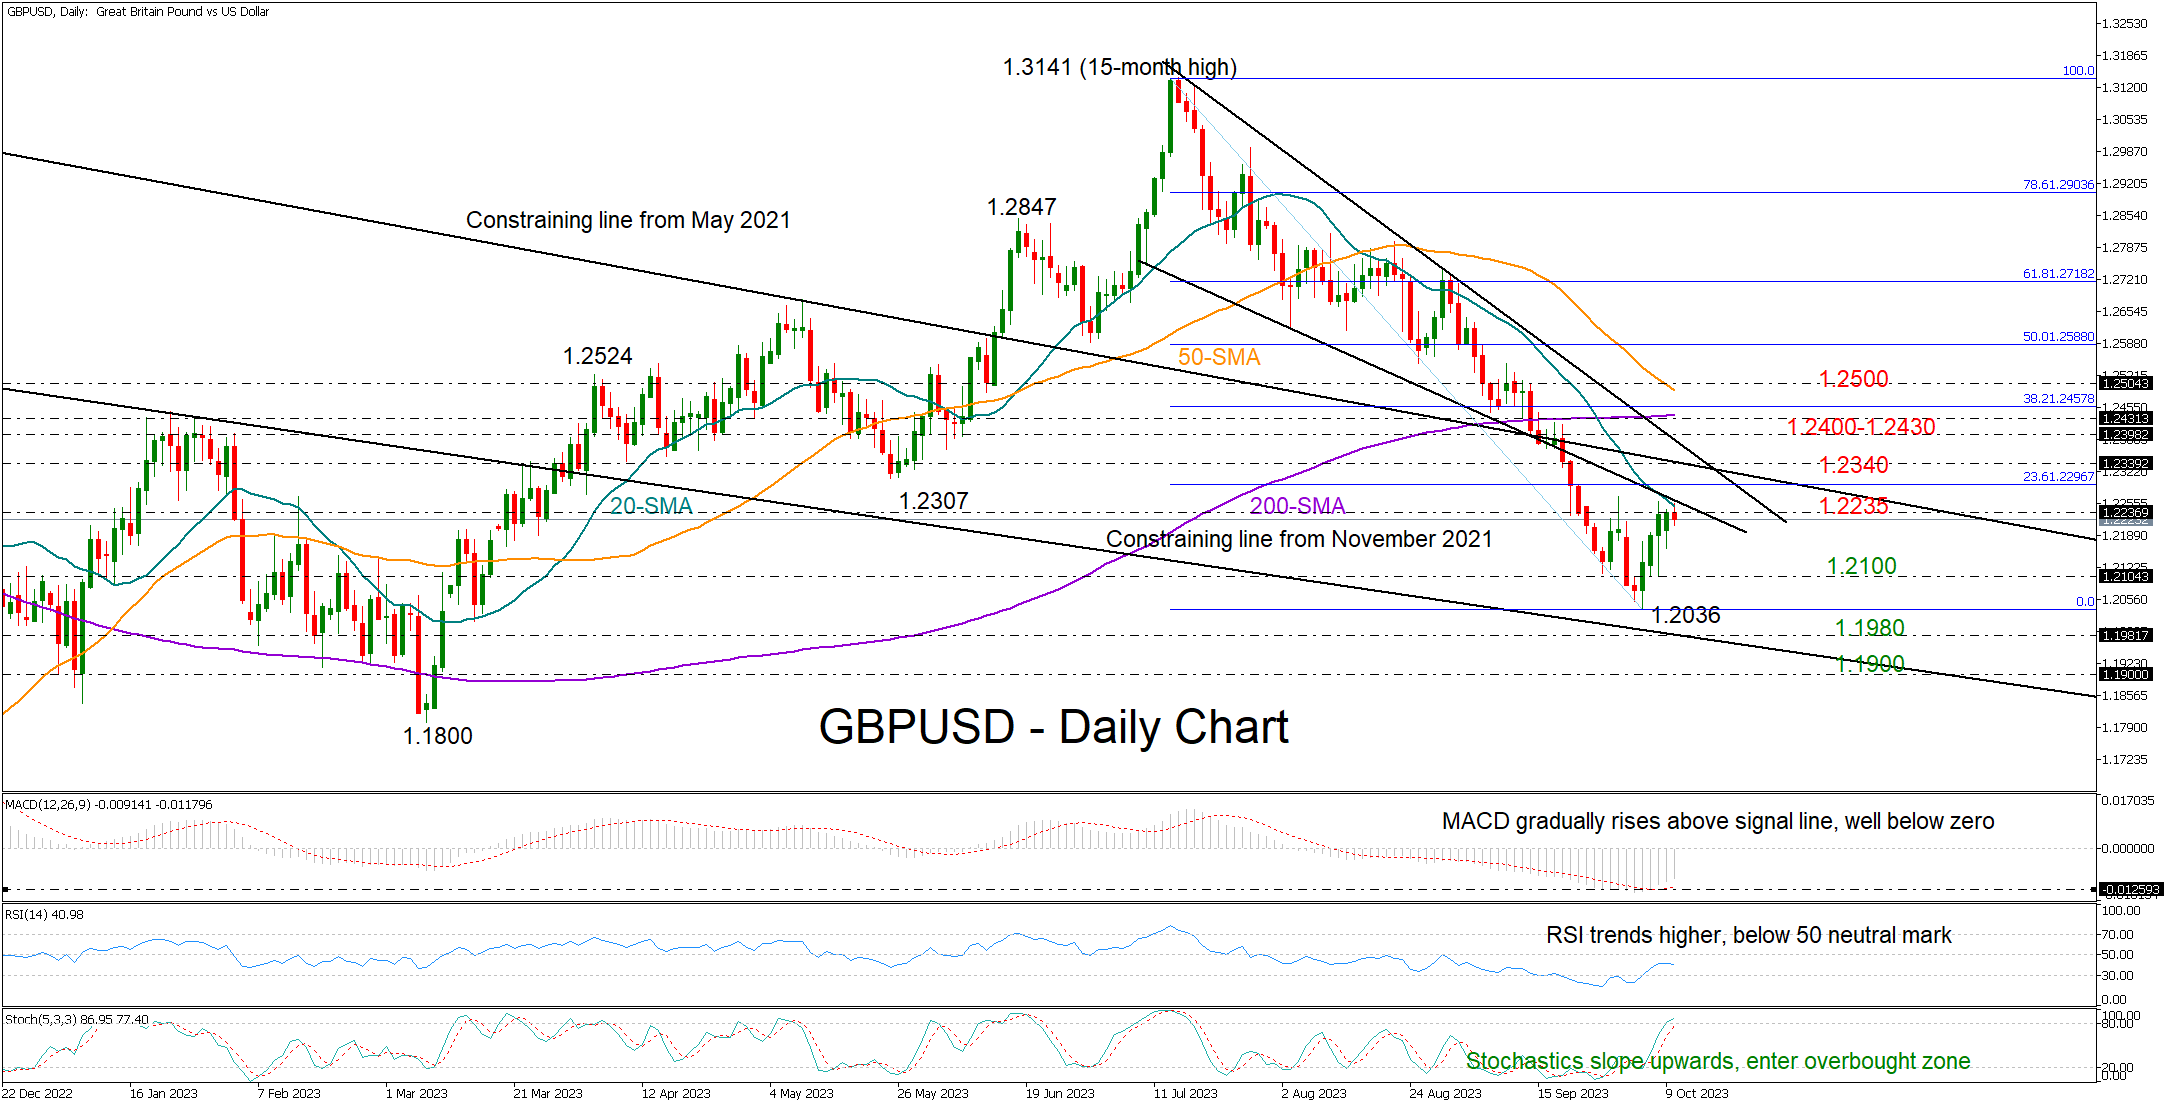
GBPUSD has been stagnant around the 1.2235 barrier for two days, hindered by the 20-day simple moving average (SMA) and the resistance line from July.
Encouragingly, the technical indicators keep pointing upwards, with the RSI further distancing itself from its 30 oversold region and the MACD recovering above its red signal line. On the other hand, the stochastic oscillator is crawling into the overbought territory, signaling the bears might be around the corner.
Nevertheless, some caution might be necessary as the journey higher is expected to be challenging. An extension above the 20-day SMA could pause near 1.2340, where the descending line from May 2021 is located. Then, the 1.2400-1.2430 zone, which encapsulates the resistance trendline from mid-July and the 200-day SMA, could immediately block the way towards the 50-day SMA and the 1.2500 round level. A decisive break above the latter would brighten the short-term outlook.
Should the price pull below the 1.2235 zone, it may initially stabilize near the 1.2100 constraining zone. Failure to pivot there could turn the spotlight to the seven-month low of 1.2036, a break of which could immediately find support near the falling line drawn from November 2021 at 1.1980. If more sellers step in, the 1.1900 psychological mark could be the next destination.
To sum up, GBPUSD is facing an improving short-term bias, but it will need a stronger performance to achieve a bullish outlook.
EURJPY Rebounds But 50-day SMA Caps Gains
- EURJPY re-enters recent range after minor slump
- Held down by 50-day SMA and Ichimoku cloud
- Momentum indicators suggest a neutral-to-negative tone
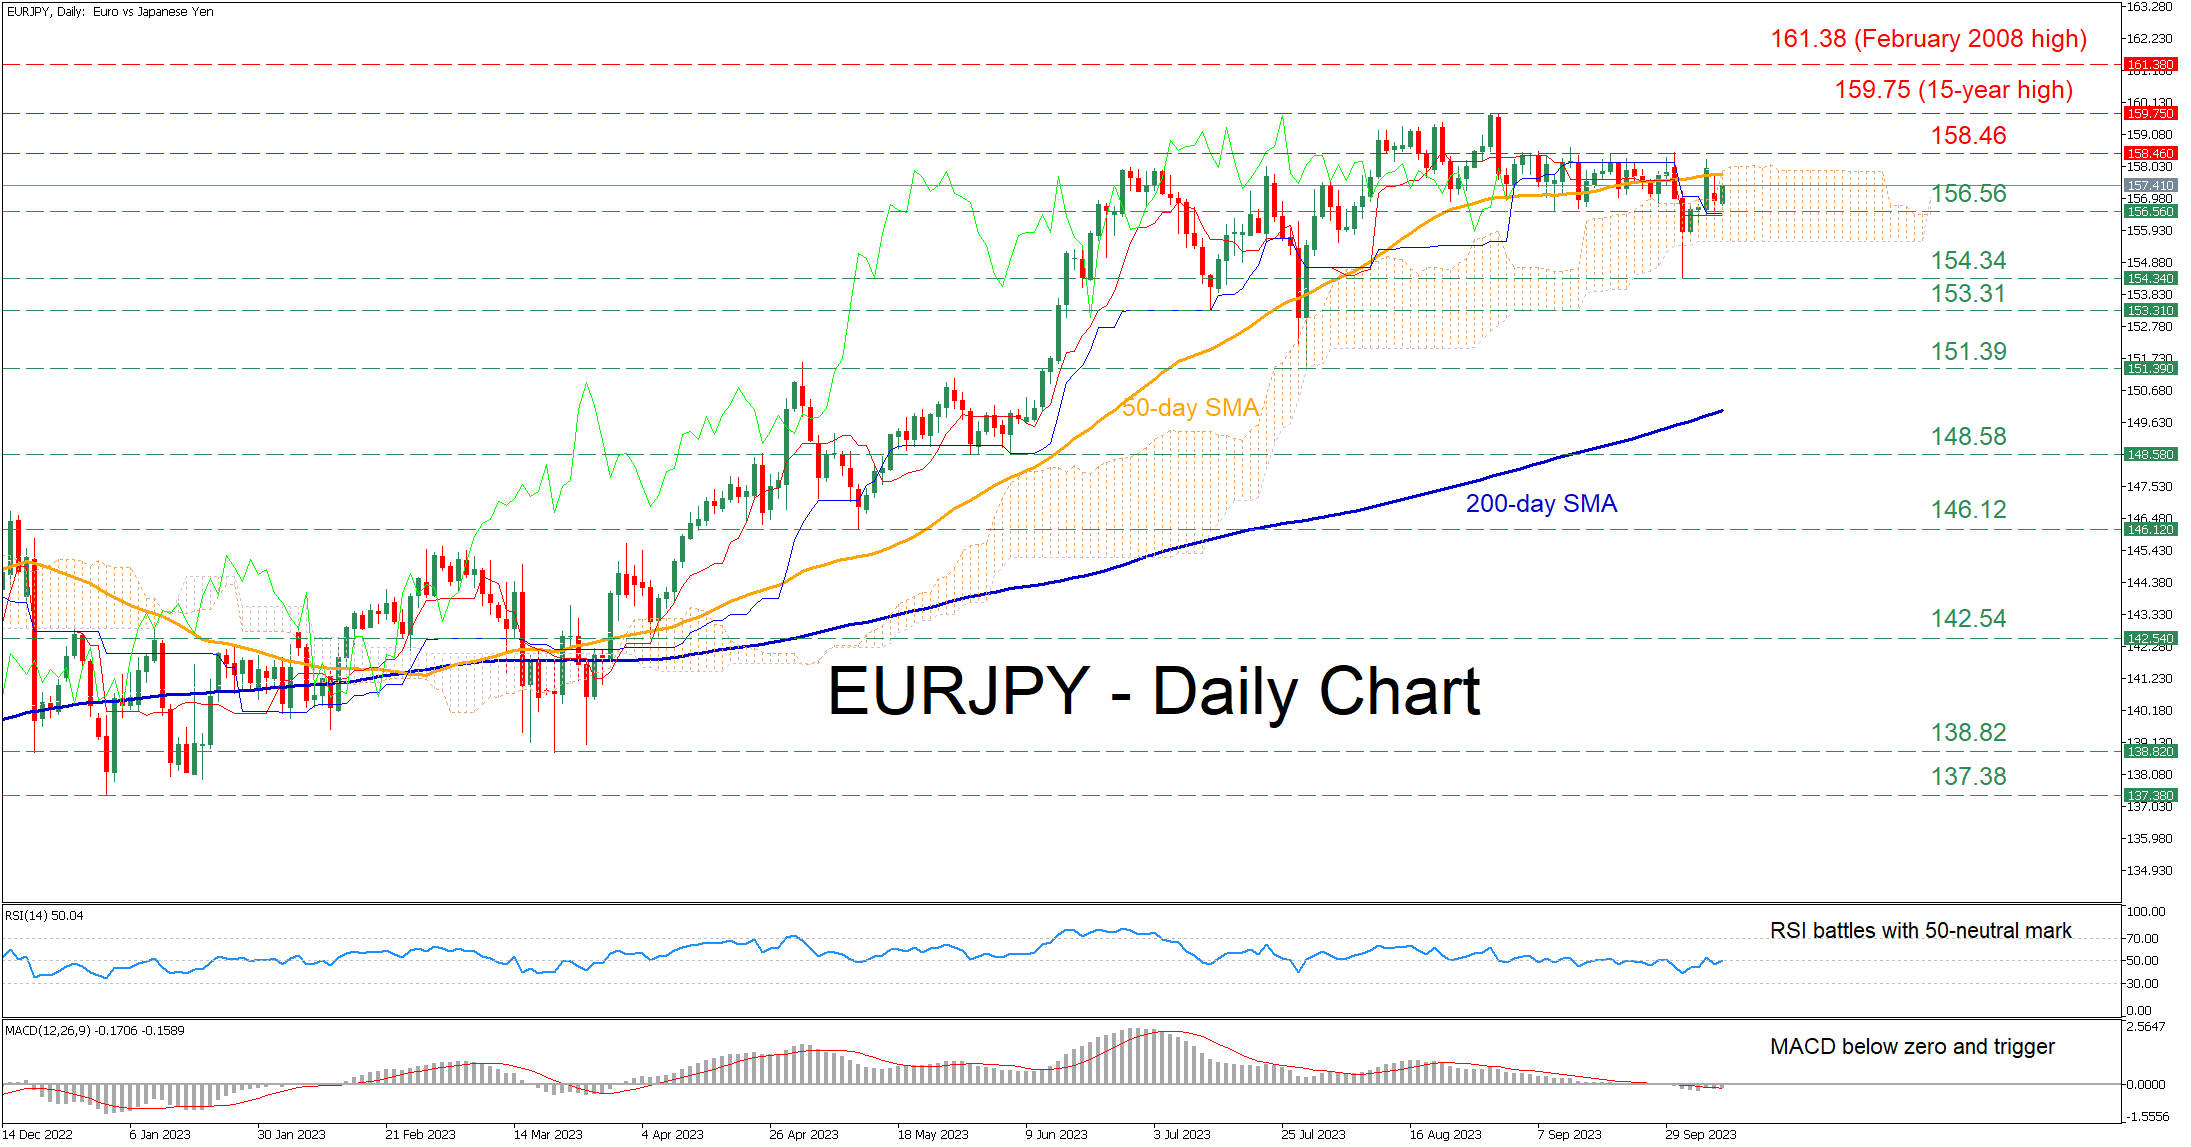
EURJPY has been in a prolonged uptrend since the beginning of the year, posting a fresh 15-year peak of 159.75 on August 31. Since then, the price has been trading without a clear direction around the 158.00 handle, while its recent spike to the downside got erased within a few sessions.
Should sellers regain the upper hand, the pair could test the recent support region of 156.56. A break below that zone could pave the way for the October low of 154.34. Failing to halt there, the price may then descend towards the July support of 153.31.
Alternatively, if the price conquers the congested region that includes the 50-day simple moving average (SMA) and the upper end of the Ichimoku cloud, the bulls could attempt to reclaim the recent resistance of 158.46. Violating that zone, the pair could revisit its 15-year peak of 159.75. Surpassing that hurdle, the price could storm to fresh multi-year highs, where the February 2008 peak of 161.38 may curb further advances.
In brief, EURJPY has been trading in a range during the past month, appearing to be lacking directional impetus.
Bitcoin Price Cannot Stay Above $28k
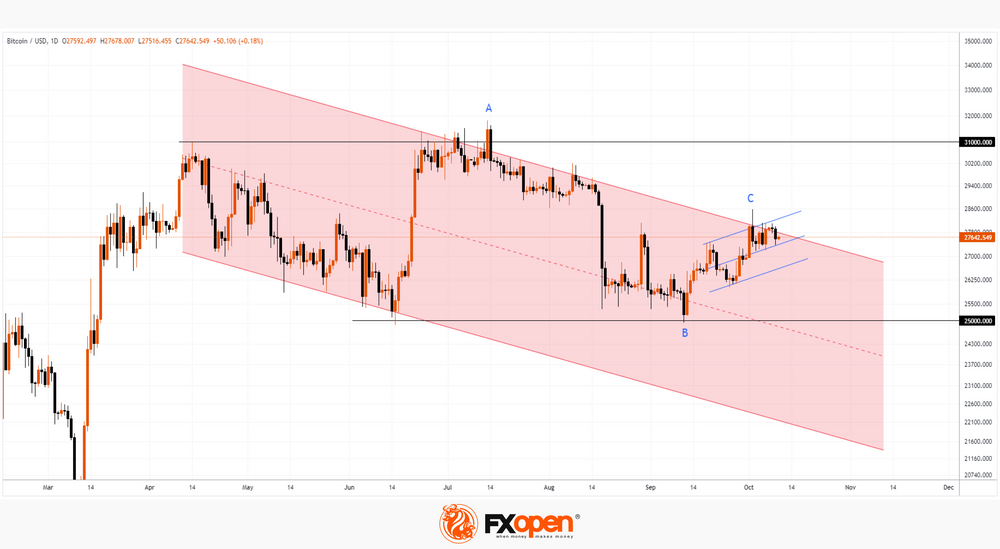
The first day of October coincided with the first attempt of the bulls to overcome the resistance level of USD 28,000 per coin, but on the 2nd of October, the sellers showed their presence. Since that time, the price has repeatedly exceeded the level of 28k, but each time not for long, after which a decline followed.
Yesterday, there was another such decline. As the BTC/USD chart shows today, the rate is around 27,600. And it seems that the bulls may no longer have the strength to make a new attempt.
Analyzing the bitcoin market on September 8, we pointed out a list of bearish arguments that give reason to doubt the positive prospects for bitcoin. The described price action of about 28k is another bearish argument in this list.
Moreover:
→ the growth of B→C is approximately 50% Fibo of the decline of A→B;
→ the top of early October provides more support for building a downward channel (shown in red). It is possible that the price may now move from its upper border to its lower border.
In the short term, longs can expect the rising trendline structure (shown in blue lines) to help push the price above the psychological USD 30k level. But, let’s say, if this does not happen, then the market will again fall to the key support zone of USD 25-25.5k. Will it be able to support bullish momentum for the third time (as it did in September and June)?
99-year-old Charlie Munger gives the hint. At October's Zoomtopia conference, he again railed against investing in digital assets, saying it was the "stupidest investment” because “[m]ost of those investments are going to zero.”
This article represents the opinion of the Companies operating under the FXOpen brand only. It is not to be construed as an offer, solicitation, or recommendation with respect to products and services provided by the Companies operating under the FXOpen brand, nor is it to be considered financial advice.
Natural Gas Price Reaches 8-month High
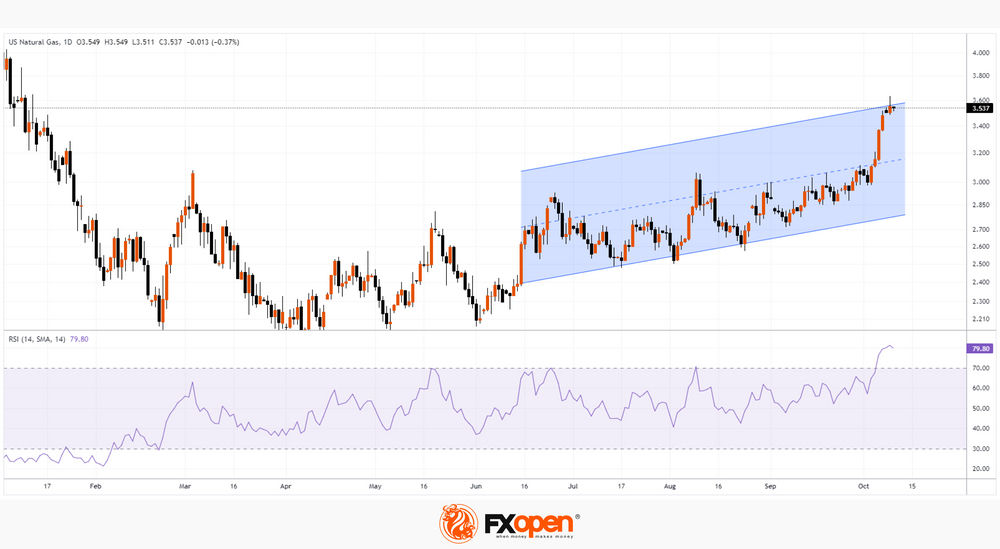
As the chart shows, yesterday, the price of gas rose above USD 3.60 for the first time since January of this year.
It can be assumed that events in Israel contributed to the price increase, since the Middle East is an important supplier of gas.
However, note that the bullish momentum started much earlier — gas prices have risen approximately 20% since the October 3 low. This confirms our assumptions about the bullish trend, which we published in the review on August 25th.
Perhaps the price of gas is influenced by seasonal factors and fears that weather conditions in the coming winter will be difficult.
Should we count on the continuation of the bullish trend?
If forecasters’ predictions worsen and the conflict in the Middle East flares up, this will certainly increase the likelihood of further price increases.
But in the short term, there are prerequisites for the formation of a rollback, since:
→ RSI indicates severe overbought;
→ the price has reached the upper limit of the parallel channel;
→ the tapering candles of the last days and the beginning of Tuesday demonstrate the presence of sellers — it is permissible to assume that buyers are taking profits.
This article represents the opinion of the Companies operating under the FXOpen brand only. It is not to be construed as an offer, solicitation, or recommendation with respect to products and services provided by the Companies operating under the FXOpen brand, nor is it to be considered financial advice.