

Sample Category Title
EUR/CHF Daily Outlook
Daily Pivots: (S1) 0.9556; (P) 0.9583; (R1) 0.9607; More...
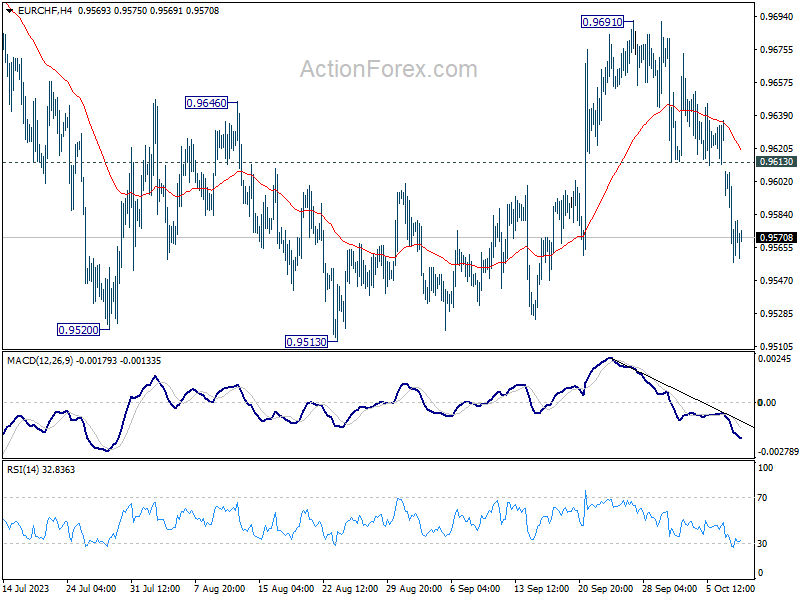
Intraday bias in EUR/CHF remains on the downside as fall from 0.9691 is extending. Deeper decline would be seen to retest 0.9513 low. Decisive break there will resume larger down trend from 1.0095. On the upside, above 0.9613 minor resistance will turn intraday bias neutral first.
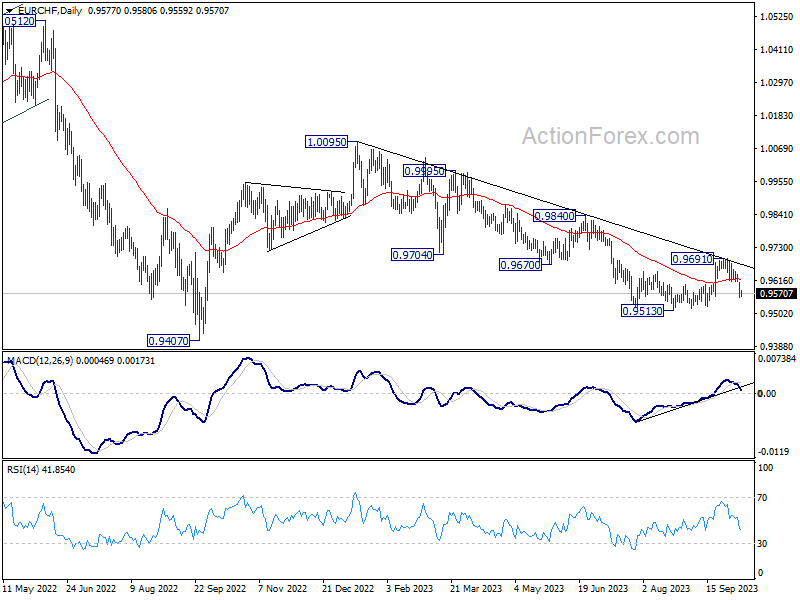
In the bigger picture, medium term outlook will stay bearish as long as the cross is capped well below falling 55 W EMA (now at 0.9793). That is, down trend from 1.2004 (2018 high) could still resume through 0.9407 (2022 low). However, sustained trading above the 55 W EMA will raise the chance that 0.9470 is already a long term bottom. Further rise would then be seen to 1.0095 resistance to indicate bullish trend reversal.
USD/CAD Daily Outlook
Daily Pivots: (S1) 1.3623; (P) 1.3684; (R1) 1.3725; More....
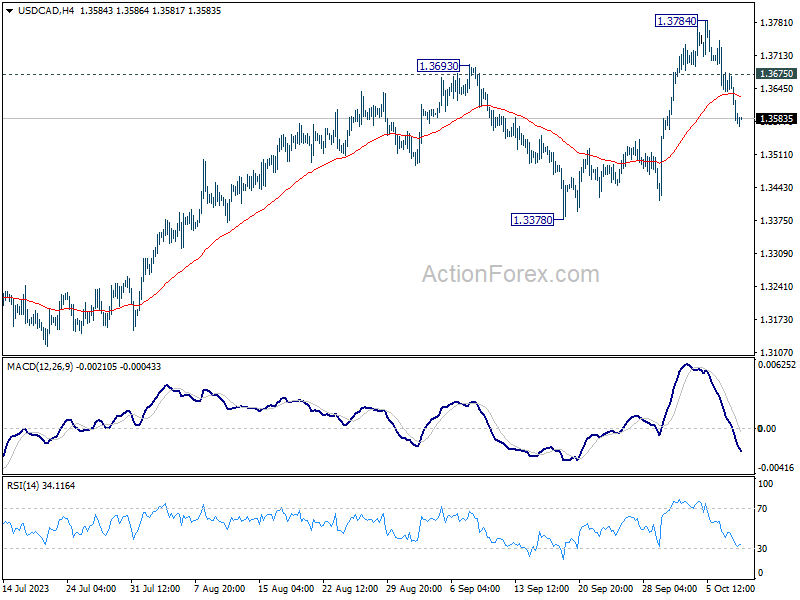
Intraday bias in USD/CAD is mildly on the downside as the pull back from 1.3784 extends. While deeper pull back cannot be ruled out, outlook will stay bullish as long as 1.3378 support holds. On the upside, above 1.3675 minor resistance will turn bias back to the upside for retesting 1.3784 next.
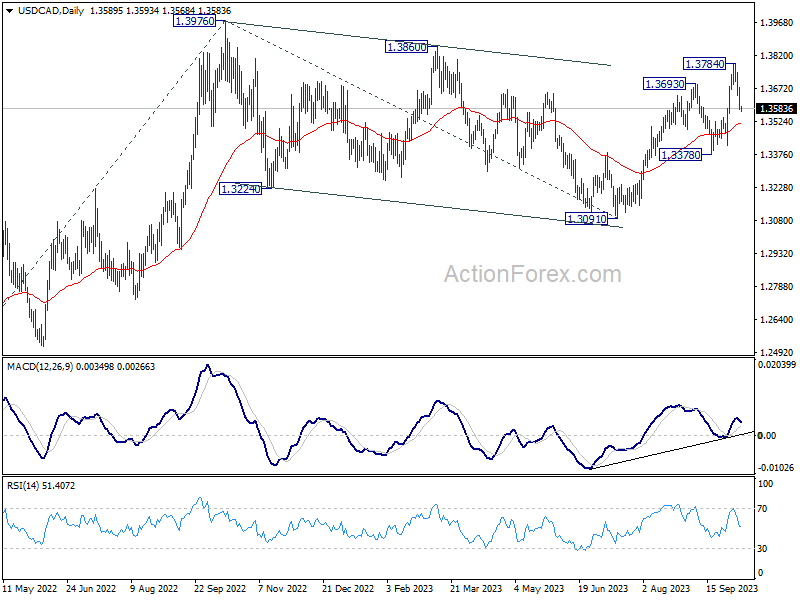
In the bigger picture, current development revives the case that corrective pattern from 1.3976 (2022 high) has completed with three waves down to 1.3091. Decisive break of 1.3976 high will confirm resumption of up trend from 1.2005 (2021 low). Next target will be 61.8% projection of 1.2401 to 1.3976 from 1.3091 at 1.4064. This will now remain the favored case as long as 1.3378 support holds.
AUD/USD Daily Report
Daily Pivots: (S1) 0.6364; (P) 0.6390; (R1) 0.6436; More...
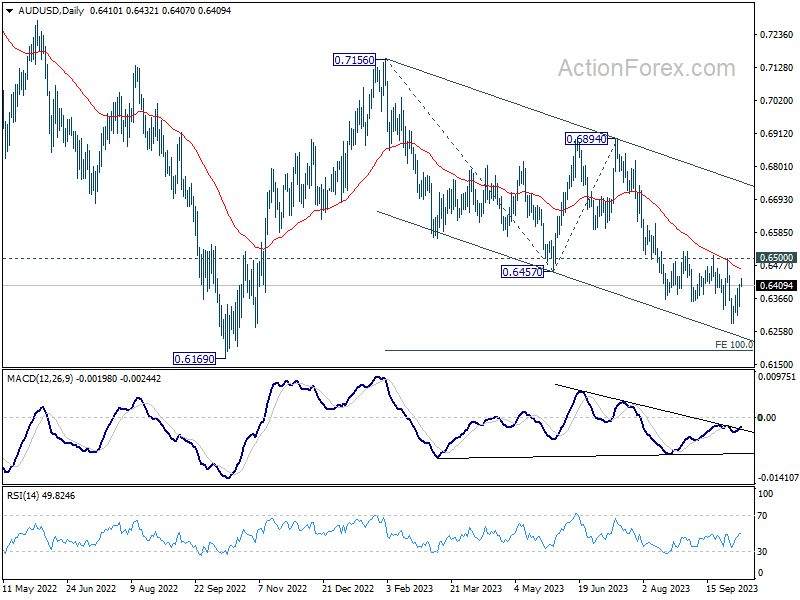
Outlook in AUD/USD is unchanged as consolidation form 0.6284 is in progress. Intraday bias stays neutral at this point. Outlook will stay bearish as long as 0.6500 resistance holds. Below 0.6284 will resume the fall from 0.7156. Next target is 100% projection of 0.7156 to 0.6457 from 0.6894 at 0.6195.
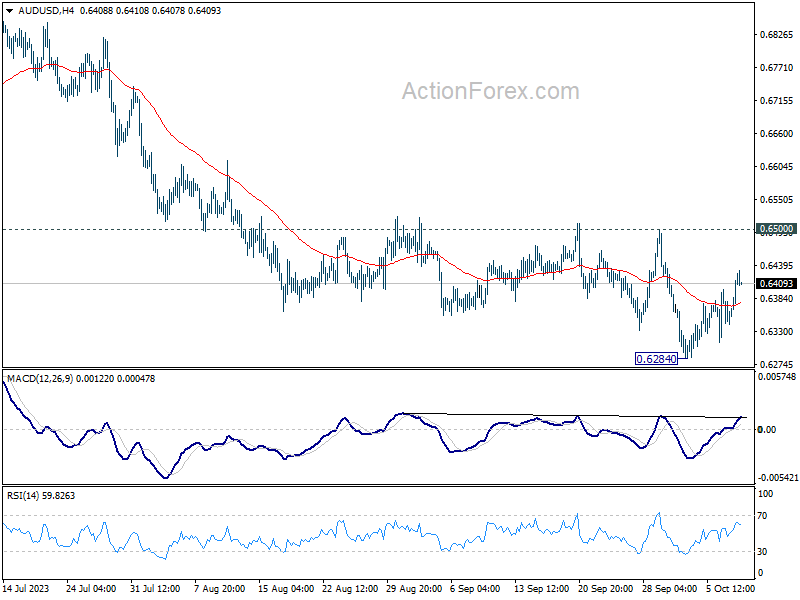
In the bigger picture, down trend from 0.8006 (2021 high) is possibly still in progress. Decisive break of 0.6169 will target 61.8% projection of 0.8006 to 0.6169 to 0.7156 at 0.6021. This will now remain the favored case as long as 0.6894, in case of strong rebound.
EUR/USD Daily Outlook
Daily Pivots: (S1) 1.0533; (P) 1.0554; (R1) 1.0587; More...
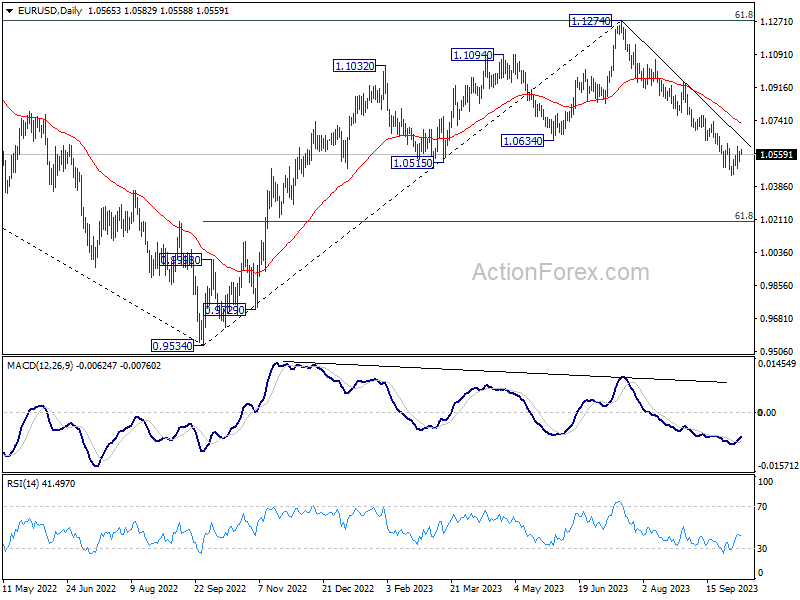
No change in EUR/USD's outlook as consolidation from 1.0447 is extending. Intraday bias remains neutral for the moment. On the upside, firm break of 1.0616 resistance will confirm short term bottoming, and turn bias back to the upside for stronger rebound. Nevertheless, rejection by 1.0616 will retain near term bearishness. Break of 1.0447 will resume the fall from 1.1274 to 1.0199 fibonacci level next.
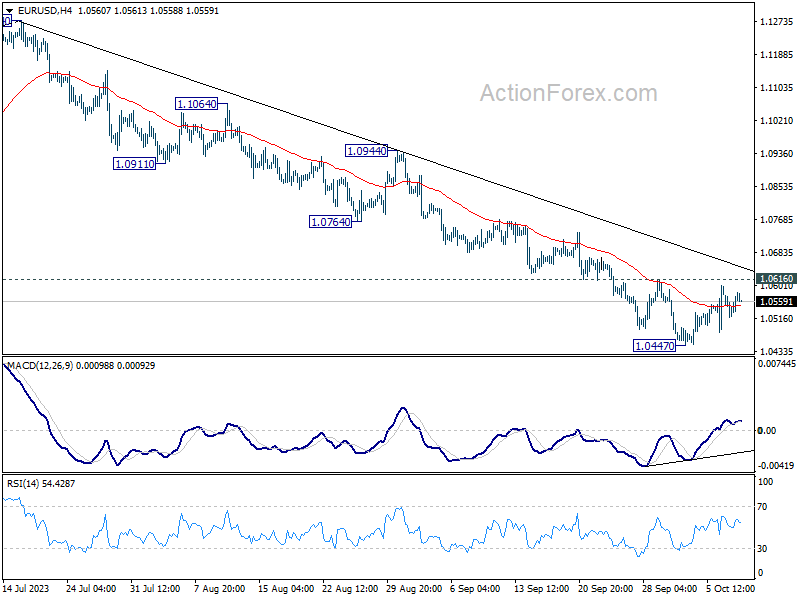
In the bigger picture, fall from 1.1274 medium term top could still be a correction to rise from 0.9534 (2022 low). But chance of a complete trend reversal is rising. In either case, current fall should target 61.8% retracement of 0.9534 to 1.1274 at 1.0199 next. For now, risk will stay on the downside as long as 55 D EMA (now at 1.0725) holds, in case of rebound.
GBP/USD Daily Outlook
Daily Pivots: (S1) 1.2185; (P) 1.2215; (R1) 1.2266; More
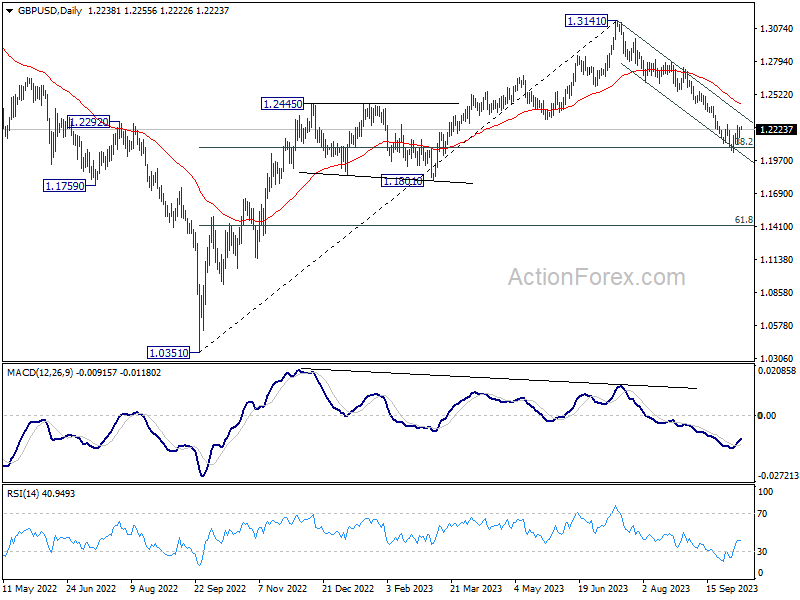
No change in GBP/USD's outlook as consolidation form 1.2036 is still in progress. On the upside, firm break of 1.2270 resistance will confirm short term bottoming. Intraday bias will be back to the upside for stronger rebound. Nevertheless, rejection by 1.2270 will retain near term bearishness. Decisive break of 1.2075 fibonacci level would carry larger bearish implication and target 1.1801 support next.
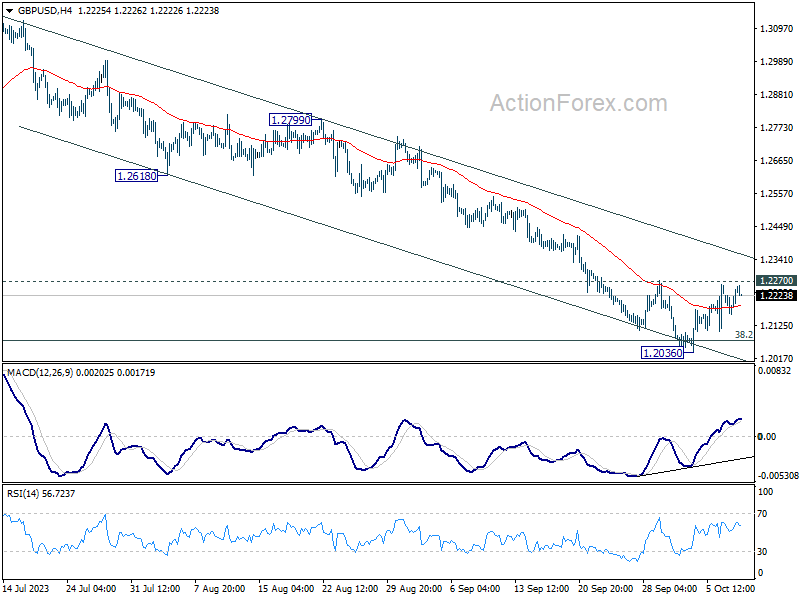
In the bigger picture, fall from 1.3141 medium term top could still be a correction to up trend from 1.0351 (2022 low) only. But risk of complete trend reversal is rising. Sustained break of 38.2% retracement of 1.0351 to 1.3141 at 1.2075 will pave the way to 61.8% retracement at 1.1417. For now, risk will stay on the downside as long as 55 D EMA (now at 1.2440) holds, in case of rebound.
USD/CHF Daily Outlook
Daily Pivots: (S1) 0.9036; (P) 0.9080; (R1) 0.9111; More....
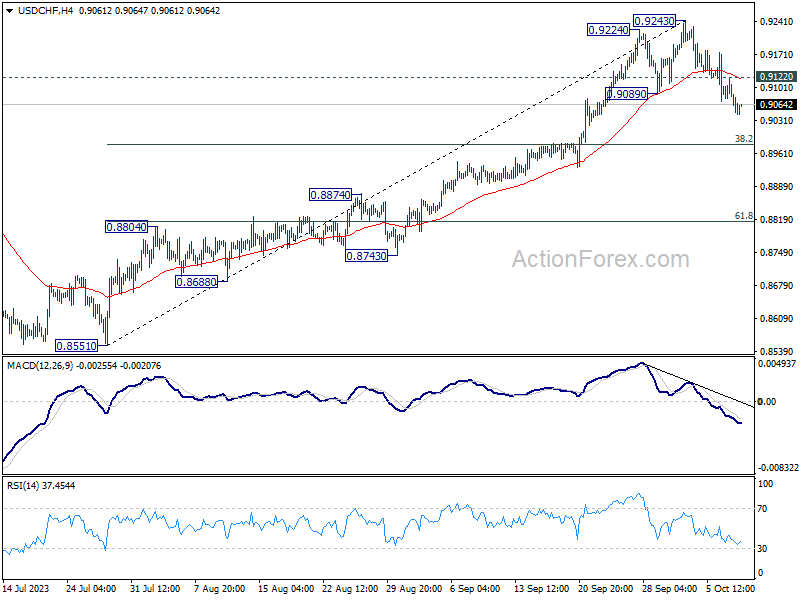
USD/CHF's correction from 0.9243 is still in progress. Intraday bias stays on the downside for 38.2% retracement of 0.8551 to 0.9243 at 0.8979. On the upside, above 0.9122 minor resistance will turn intraday bias neutral first. But risk of another fall will remain as long as 0.9243 resistance holds.
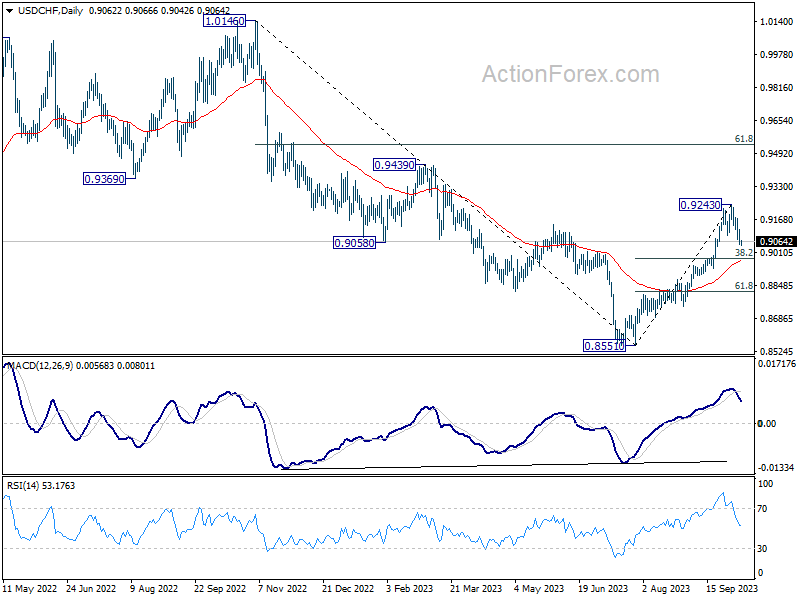
In the bigger picture, current development indicates that rise from 0.8551 is reversing whole down trend from 1.0146. Further rally would then be seen to 61.8% retracement at 0.9537 and above. For now, this will be the favored case as long as 55 D EMA (now at 0.8969) holds, even in case of deep pullback.
Technical Outlook and Review
DXY:
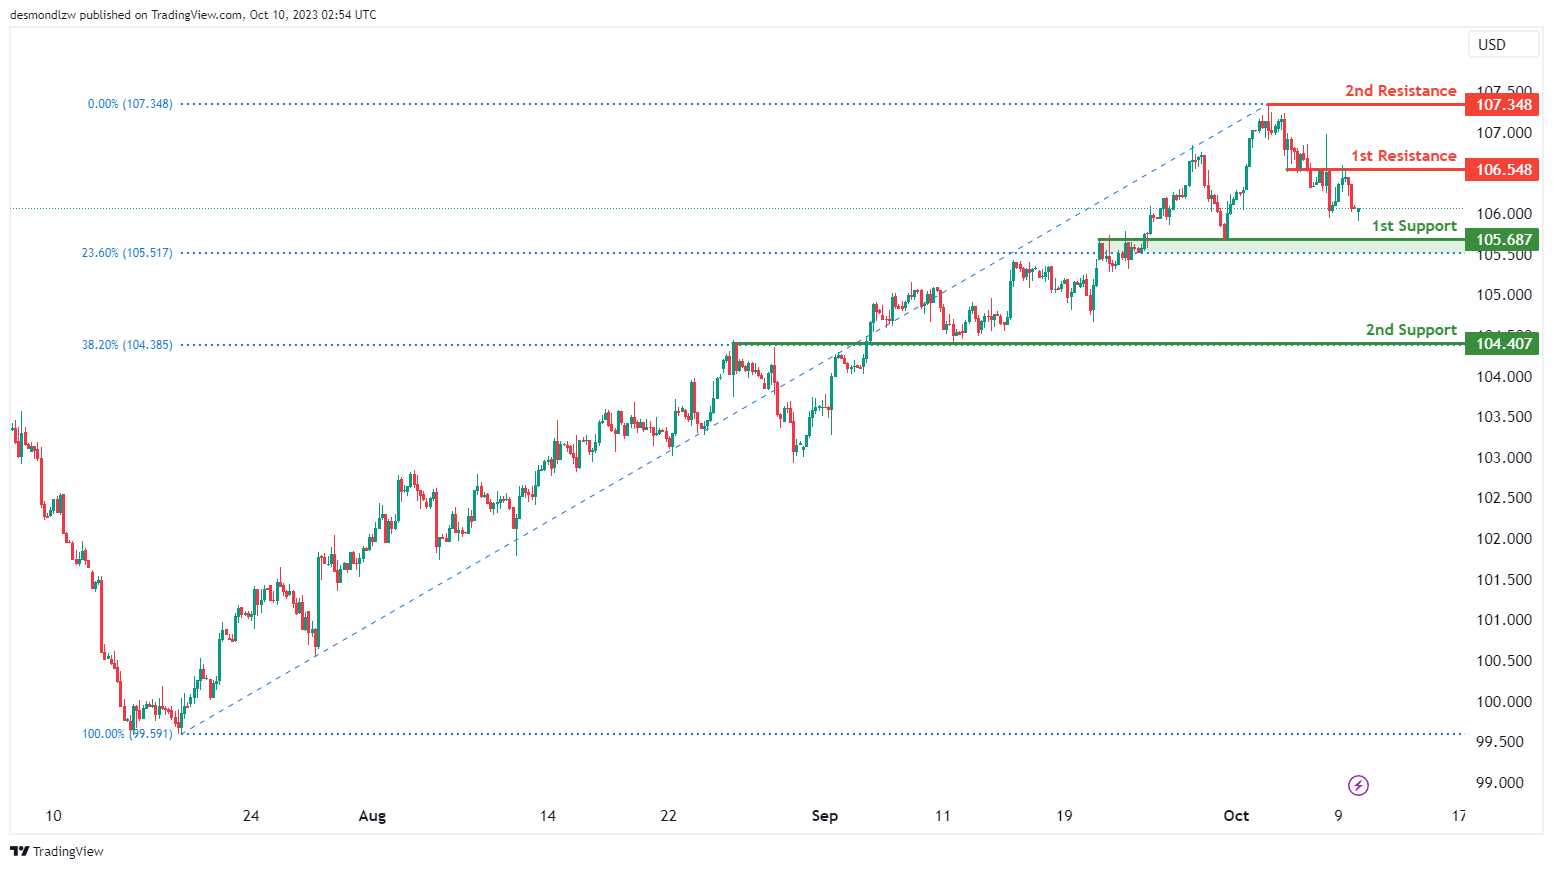
The DXY (US Dollar Index) chart currently exhibits an overall bearish momentum with a potential for price to make a bearish continuation towards the 1st support level.
The 1st support level at 105.69 is identified as an overlap support that aligns close to the 23.60% Fibonacci retracement level. Additionally, the 2nd support level at 104.41 is also noted as an overlap support that aligns with the 38.20% Fibonacci retracement level, further reinforcing its significance as a potential area where price could find support.
To the upside, the 1st resistance level at 106.55 is identified as an overlap resistance. Further up, the 2nd resistance level at 107.35 is noted as a swing-high resistance, indicating its potential role as a barrier to upward movements.
EUR/USD:
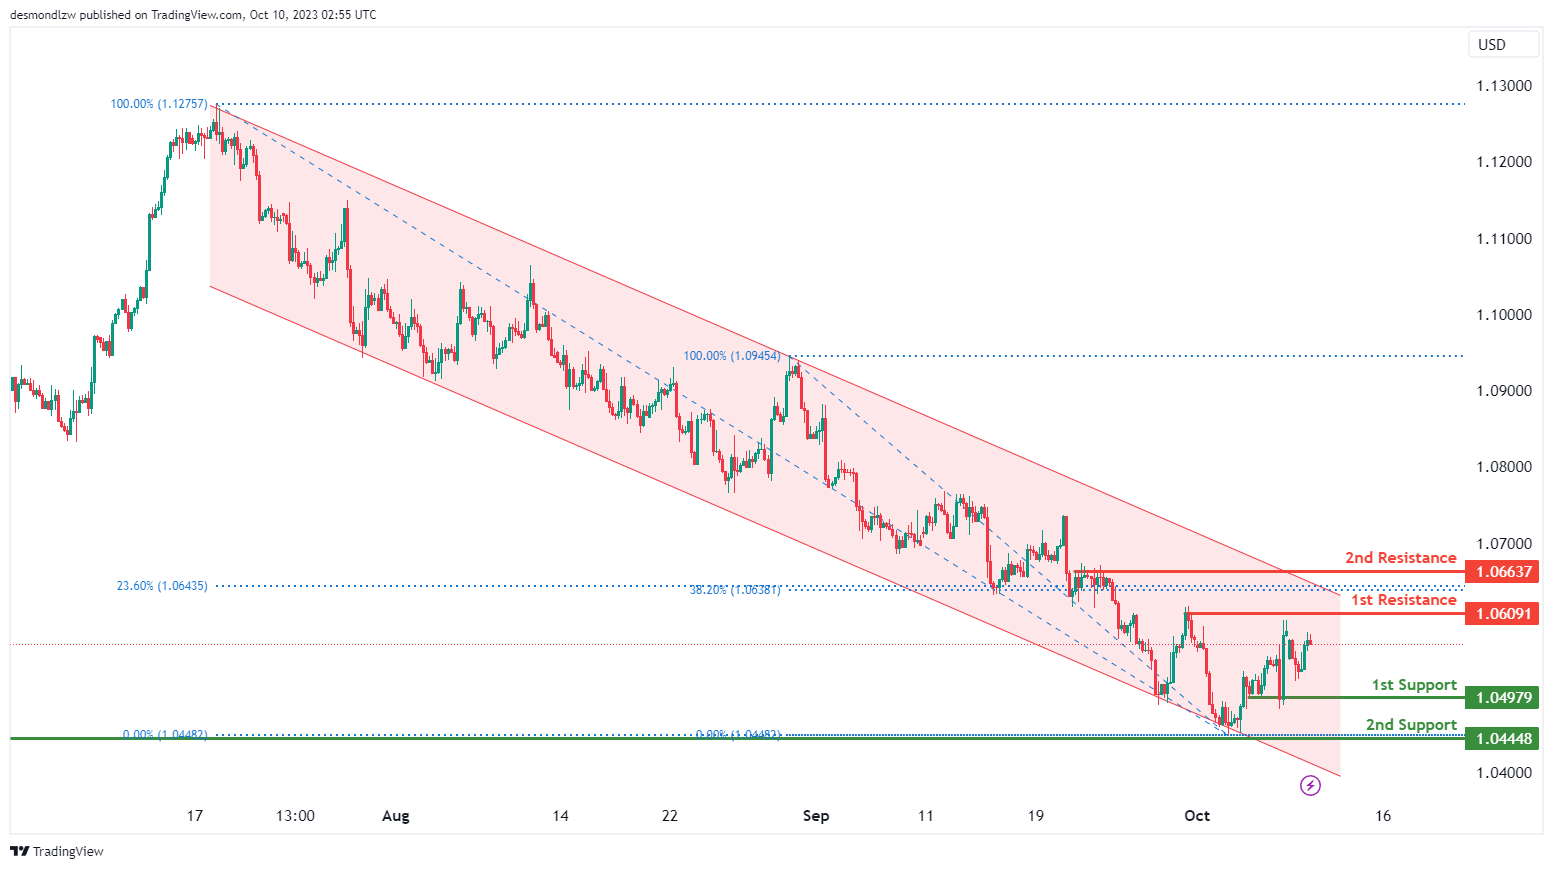
The EUR/USD chart currently exhibits an overall bearish momentum with price trading within the bearish descending channel. There is a potential for price to make a bearish reaction off the 1st resistance level and fall towards the 1st support level.
The 1st resistance level at 1.0609 is identified as a pullback resistance. Additionally, the 2nd resistance level at 1.0664 is also noted as a pullback resistance that aligns close to a confluence of Fibonacci levels i.e. the 23.60% retracement and the 38.20% retracement levels, suggesting that it may act as a barrier to upward movements.
To the downside, the 1st support level at 1.0498 is identified as a pullback support while the 2nd support at 1.0445 is also noted as a pullback support, making it an important level for potential price support.
EUR/JPY:
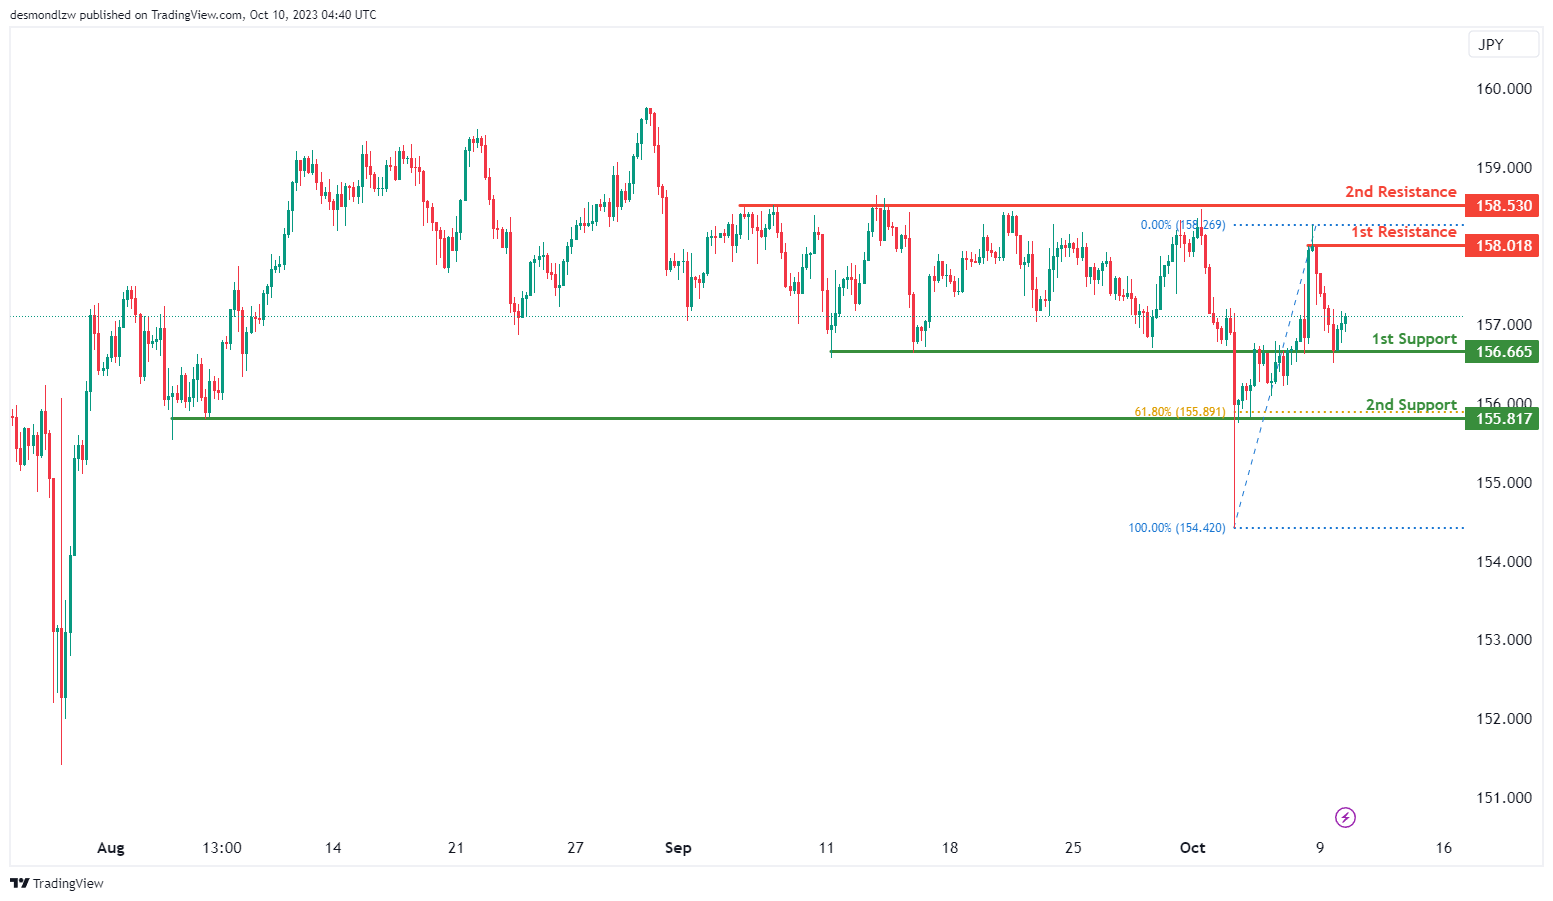
The instrument we are analyzing is EUR/JPY, and the overall momentum of the chart indicates a bullish trend.
There is a possibility that the price may continue in a bullish direction, potentially reaching the first resistance level.
The first support level is at 156.66, and it’s considered strong because it represents an overlap of support.
The second support level is at 155.81, and it’s also significant as it marks an overlap of support and aligns with a 61.80% Fibonacci Retracement.
On the resistance side, the first resistance level is at 158.01, and it’s noteworthy because it represents a swing high resistance.
The second resistance level is at 158.53, and it’s significant as well, as it represents a multi-swing high resistance.
EUR/GBP:
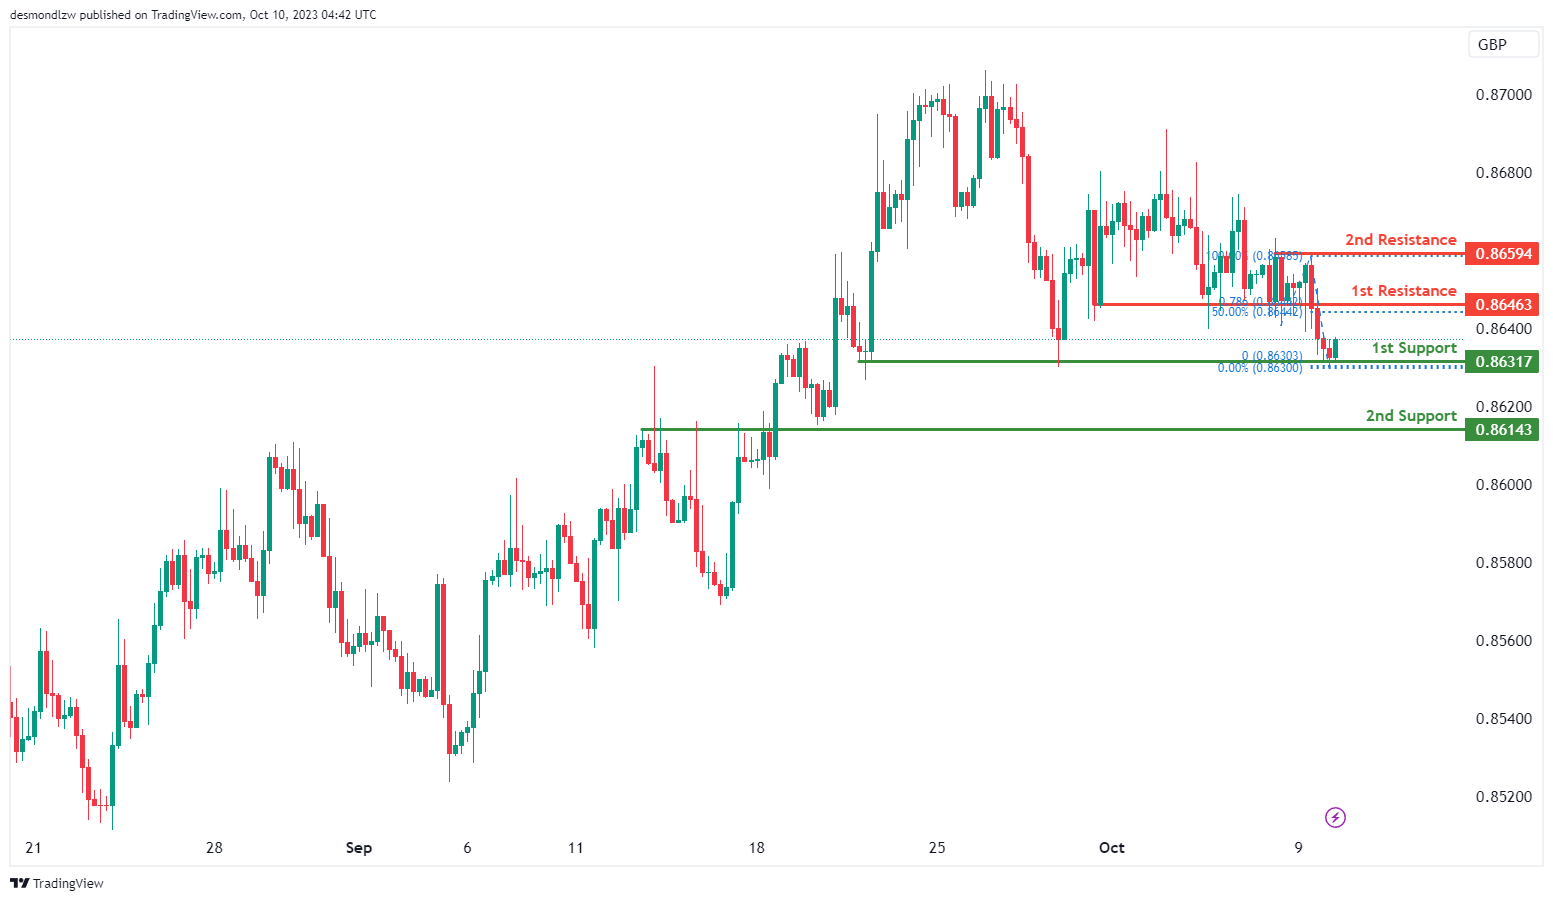
The instrument we are examining is EUR/GBP, and the overall momentum of the chart indicates a bullish trend.
There is a possibility that the price may continue in a bullish direction, potentially reaching the first resistance level.
The first support level is at 0.8631, and it’s considered strong because it represents a multi-swing low support.
The second support level is at 0.8614, and it’s also significant as it marks an overlap of support.
On the resistance side, the first resistance level is at 0.8646, and it’s noteworthy because it functions as a pullback resistance and aligns with a 50% Fibonacci Retracement and a 78.60% Fibonacci Projection, indicating a Fibonacci confluence.
The second resistance level is at 0.8659, and it’s significant as well, as it represents a multi-swing high resistance.
GBP/USD:
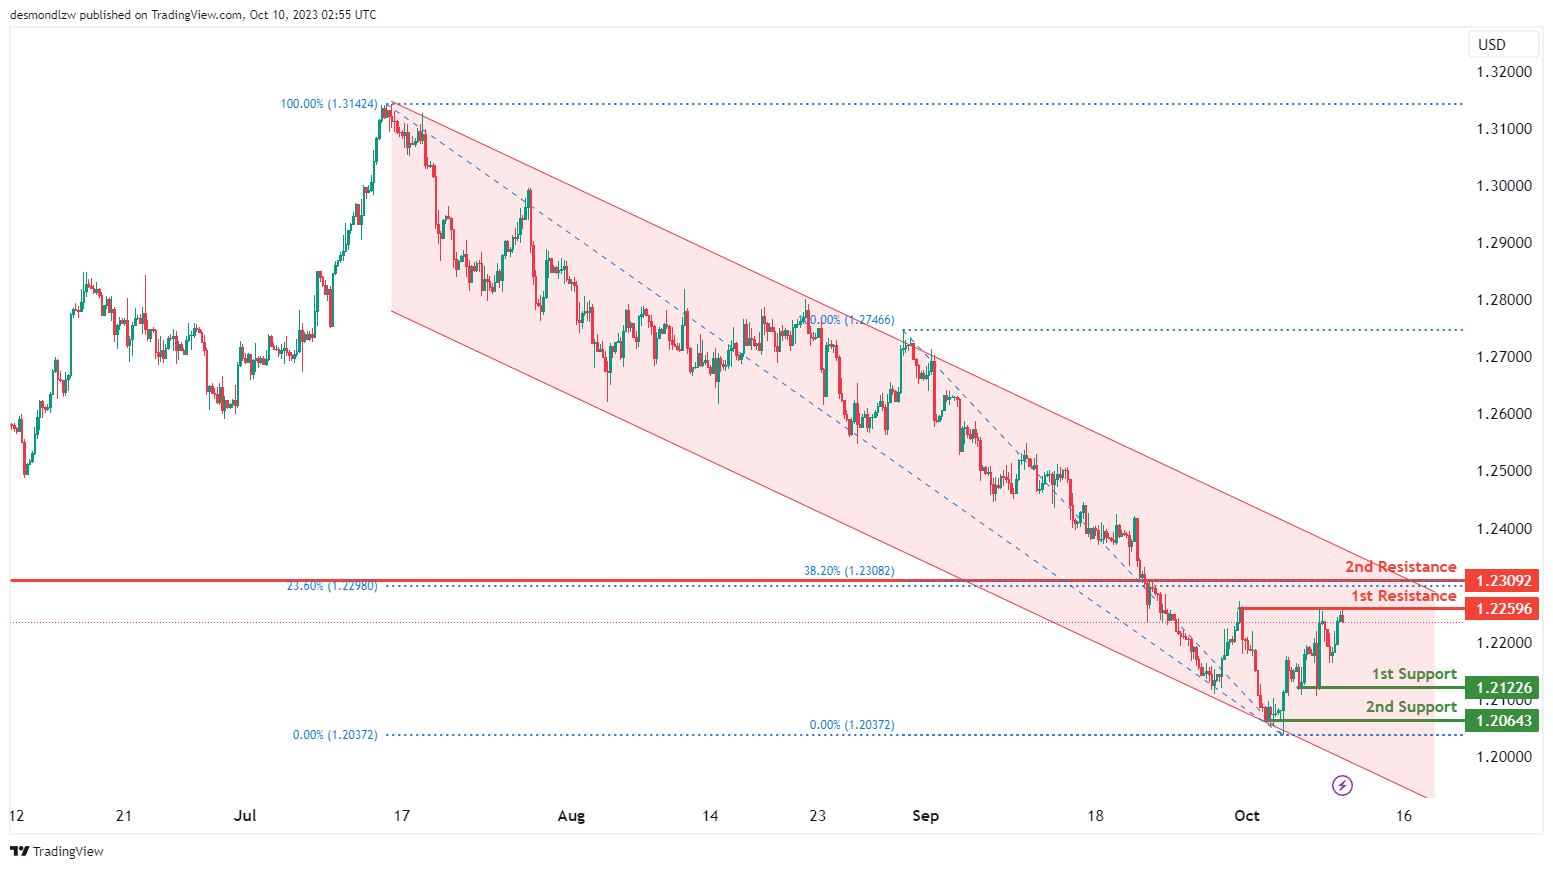
The GBP/USD chart currently exhibits an overall bearish momentum with price trading within the bearish descending channel. There is a potential for price to make a bearish reaction off the 1st resistance level and fall towards the 1st support level.
The 1st resistance level at 1.2259 is identified as a pullback resistance. Beyond this, the 2nd resistance level at 1.2309 is also noted as a pullback resistance that aligns with a confluence of Fibonacci levels i.e. the 23.60% retracement and the 38.20% retracement levels, suggesting it may act as a barrier to upward movements.
To the downside, the 1st support level at 1.2123 is identified as a pullback support. Additionally, the 2nd support level at 1.2064 is noted as a pullback support, further reinforcing its significance as a potential area where price could find support.
GBP/JPY:
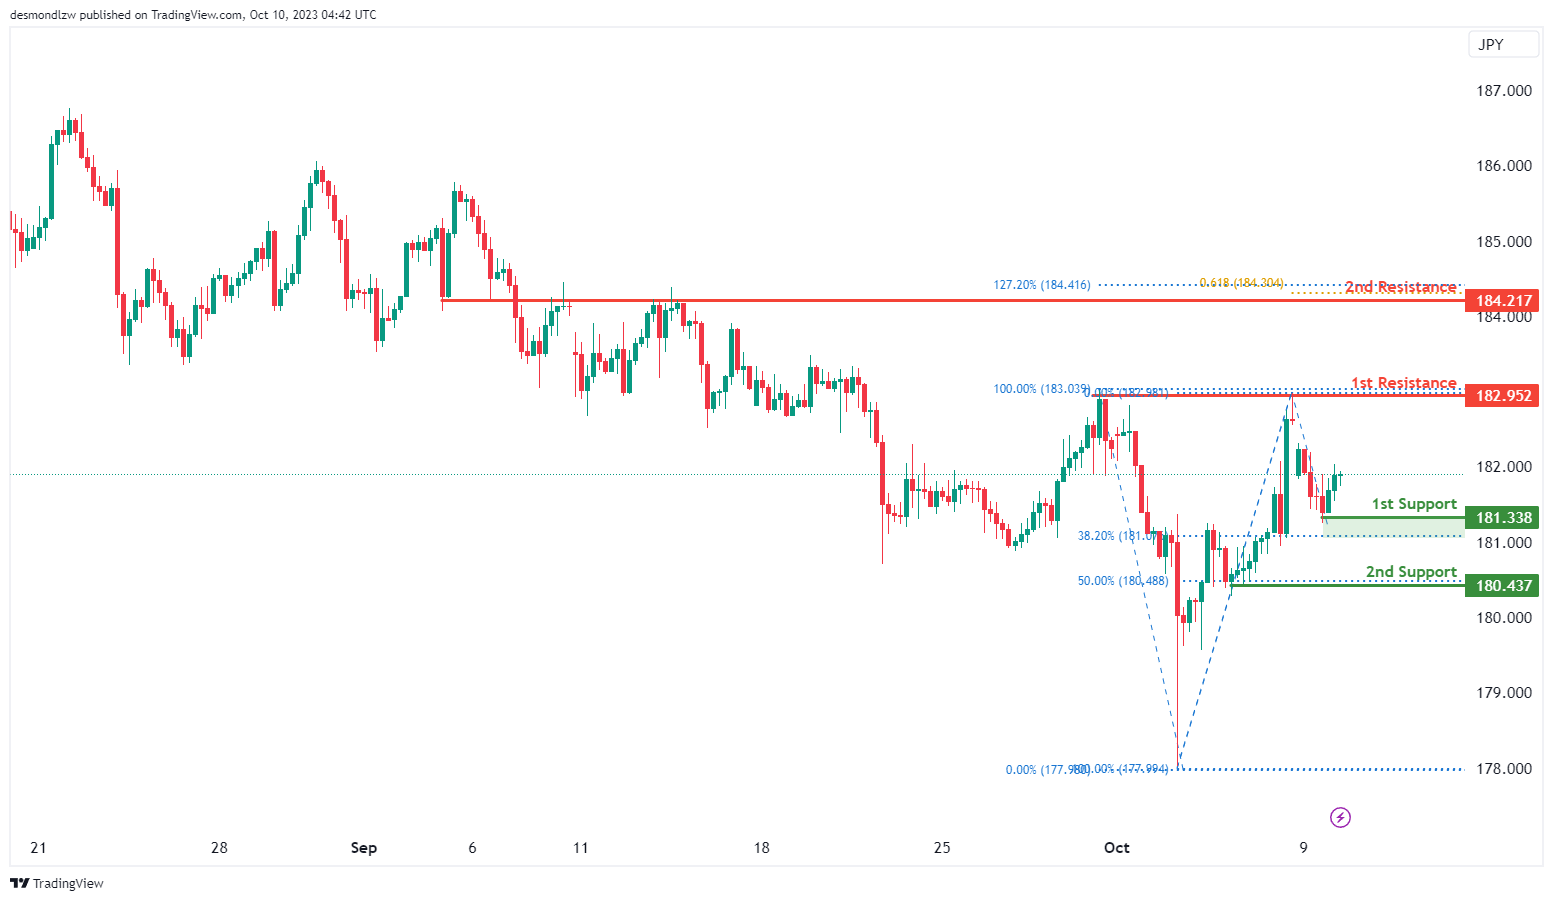
The instrument we are analyzing is GBP/JPY, and the overall momentum of the chart suggests a bullish trend.
There is a possibility that the price may continue in a bullish direction, potentially reaching the first resistance level.
The first support level is at 181.33, and it’s considered strong because it represents a swing low support and aligns with a 38.20% Fibonacci Retracement.
The second support level is at 180.43, and it’s also significant as it marks a swing low support and corresponds to a 50% Fibonacci Retracement.
On the resistance side, the first resistance level is at 182.95, and it’s noteworthy because it represents a multi-swing high resistance.
The second resistance level is at 184.21, and it’s significant as well, as it functions as an overlap resistance and aligns with a 127.20% Fibonacci Extension and a 61.80% Fibonacci Projection, indicating a Fibonacci confluence.
USD/CHF:
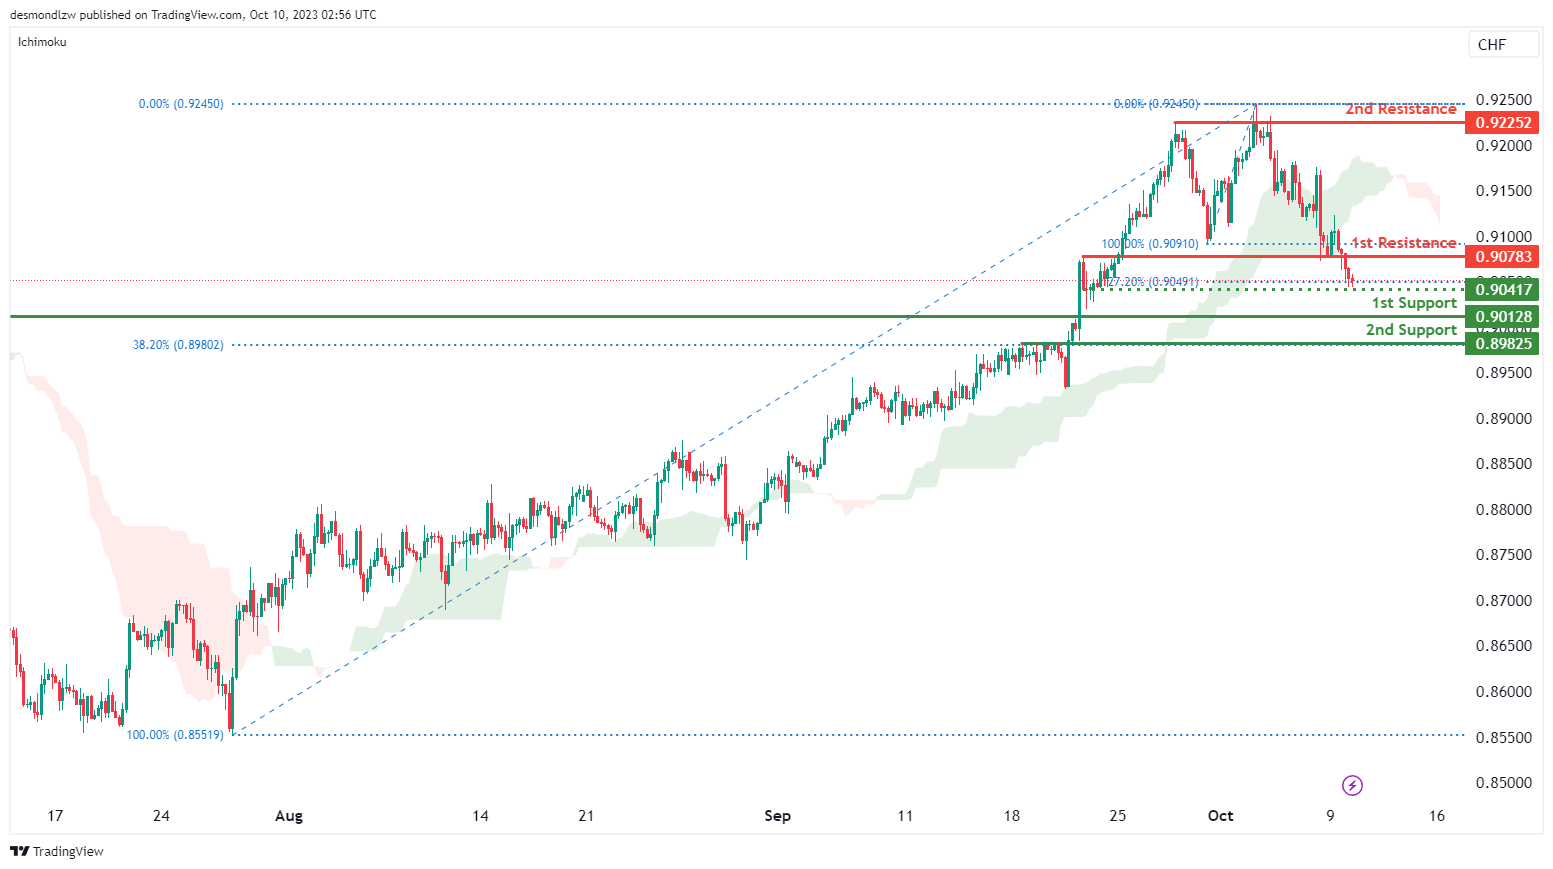
The USD/CHF chart currently exhibits an overall bearish momentum with price breaking under the bullish Ichimoku cloud. Should price break below the intermediate support level, there is a potential for price to make a bearish continuation towards the 1st support level.
The intermediate support level at 0.9042 is identified as a pullback support that aligns close to the 127.20% Fibonacci extension level while the 1st support level at 0.9013 is also noted as a pullback support. Additionally, the 2nd support level at 0.8983 is identified as a pullback support that aligns with the 38.20% Fibonacci retracement level, further reinforcing its significance as an area where the price may find support.
To the upside, the 1st resistance level at 0.9078 is identified as an overlap resistance. Higher up, the 2nd resistance level at 0.9225 is noted as a multi-swing-high resistance, acting as a potential barrier to further price increases.
USD/JPY:
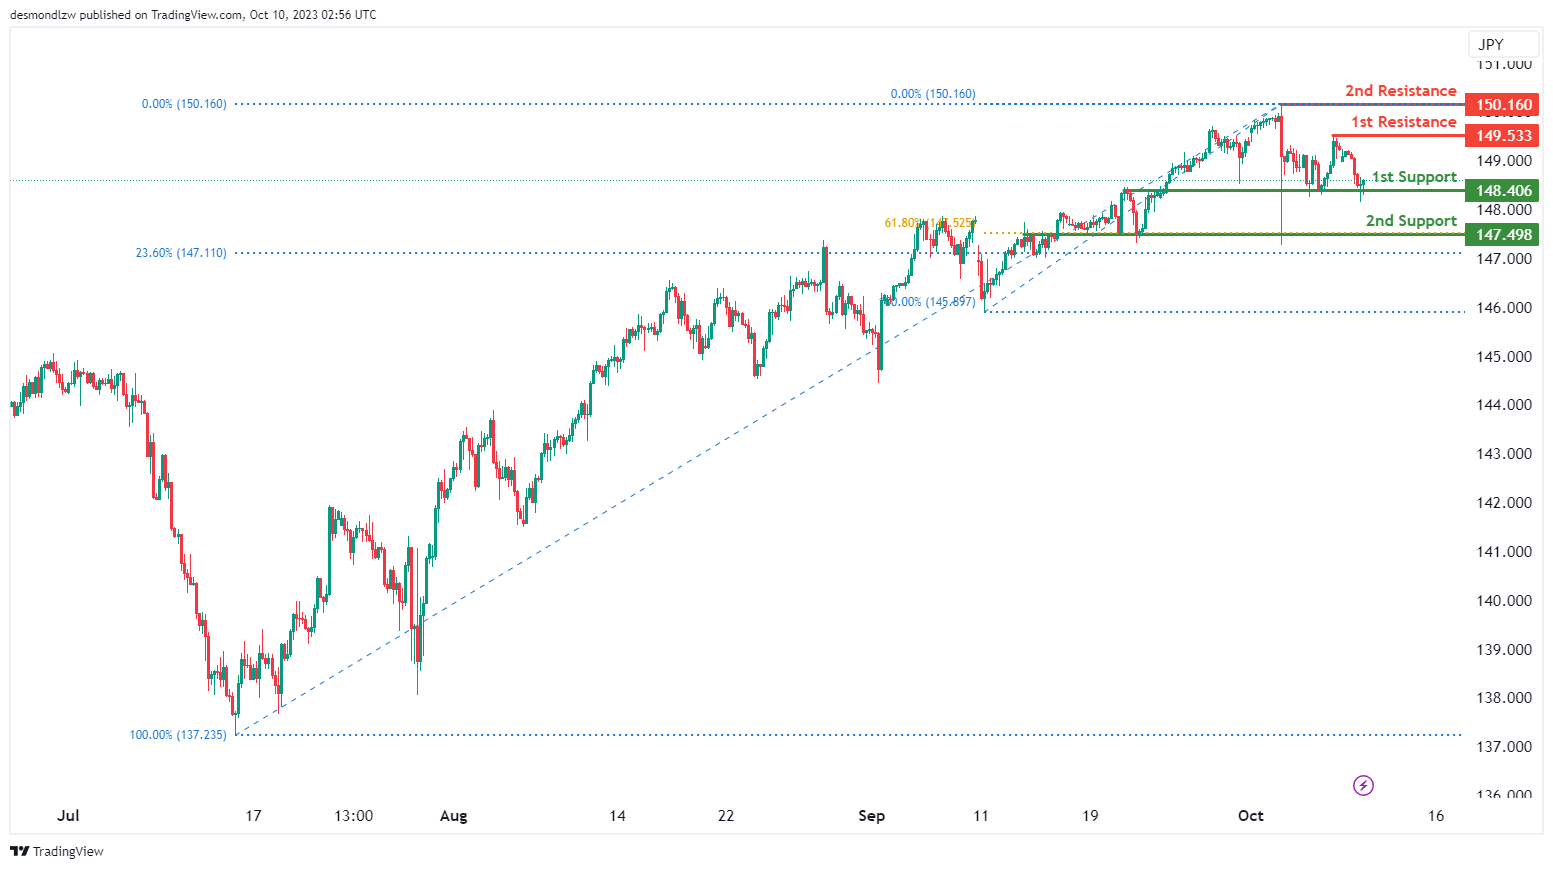
The USD/JPY chart currently exhibits a weak bullish momentum with a potential for price to make a bullish bounce off the 1st support level and rise towards the 1st resistance level.
The 1st support level at 148.41 is identified as an overlap support. Further below, the 2nd support at 147.49 is also noted as an overlap support that aligns with a confluence of Fibonacci levels i.e. the 23.60% retracement and the 61.80% retracement levels, further reinforcing its significance as an area where the price may find support.
To the upside, the 1st resistance level at 149.53 is identified as a pullback resistance. Higher up, the 2nd resistance level at 150.16 is noted as a swing-high resistance, acting as a potential barrier to further price increases.
USD/CAD:
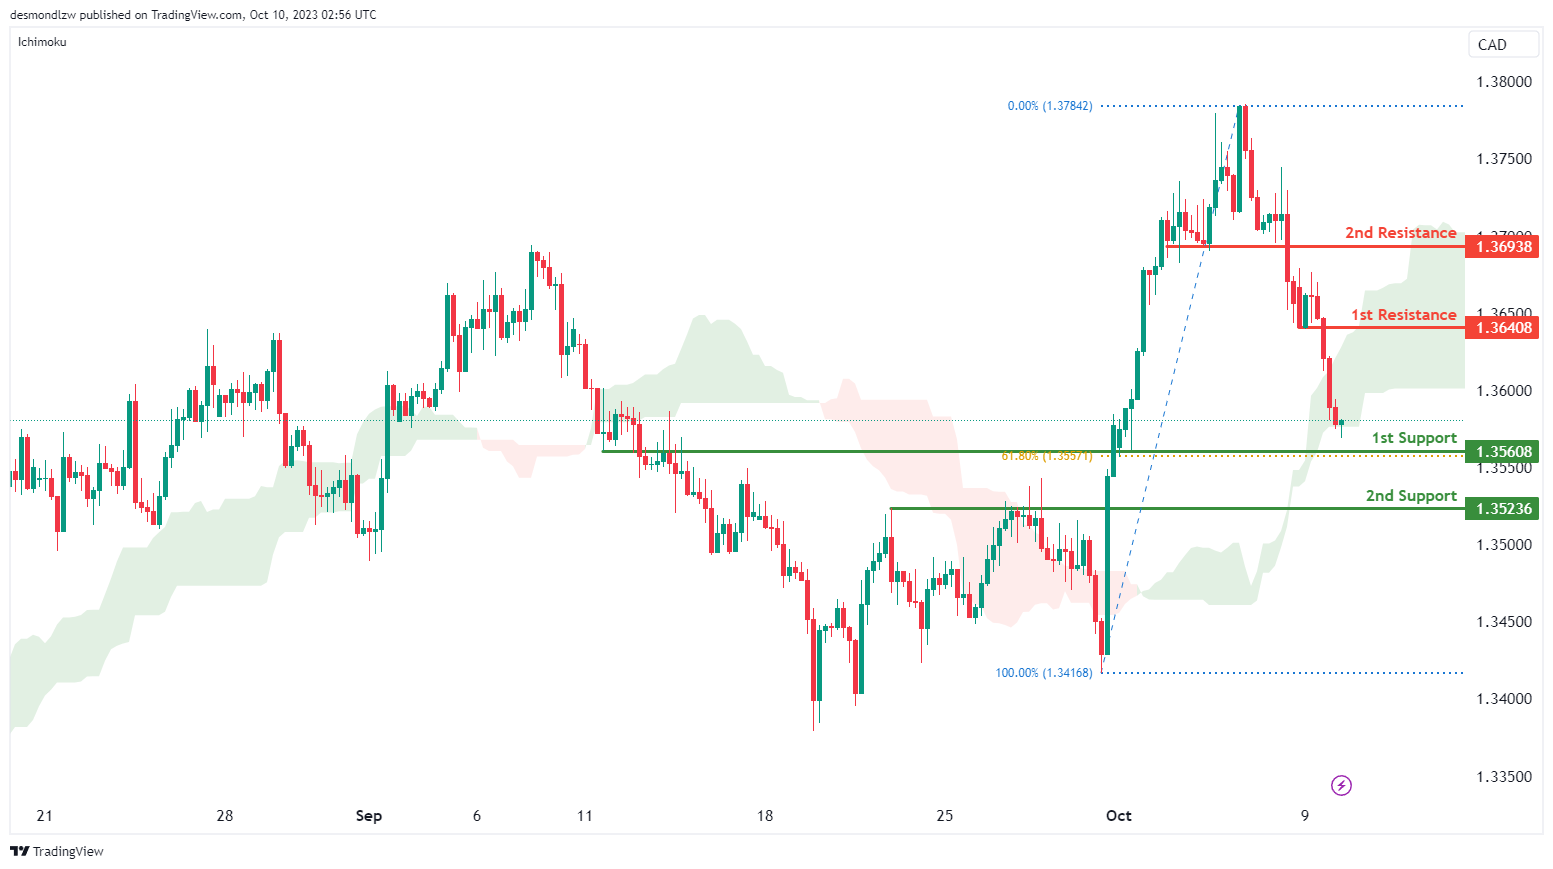
The USD/CAD chart is currently showing an overall bearish momentum, suggesting the possibility of a bearish continuation towards the 1st support should price break below the bullish Ichimoku cloud.
The 1st support level at 1.3561 is identified as an overlap support that aligns with the 61.80% Fibonacci retracement level. Additionally, the 2nd support level at 1.3524 is noted as a pullback support.
To the upside, the 1st resistance level at 1.3641 is identified as a pullback resistance. Higher up, the 2nd resistance level at 1.3694 is also noted as a pullback resistance, further emphasizing its significance as a barrier for future price increases.
AUD/USD:
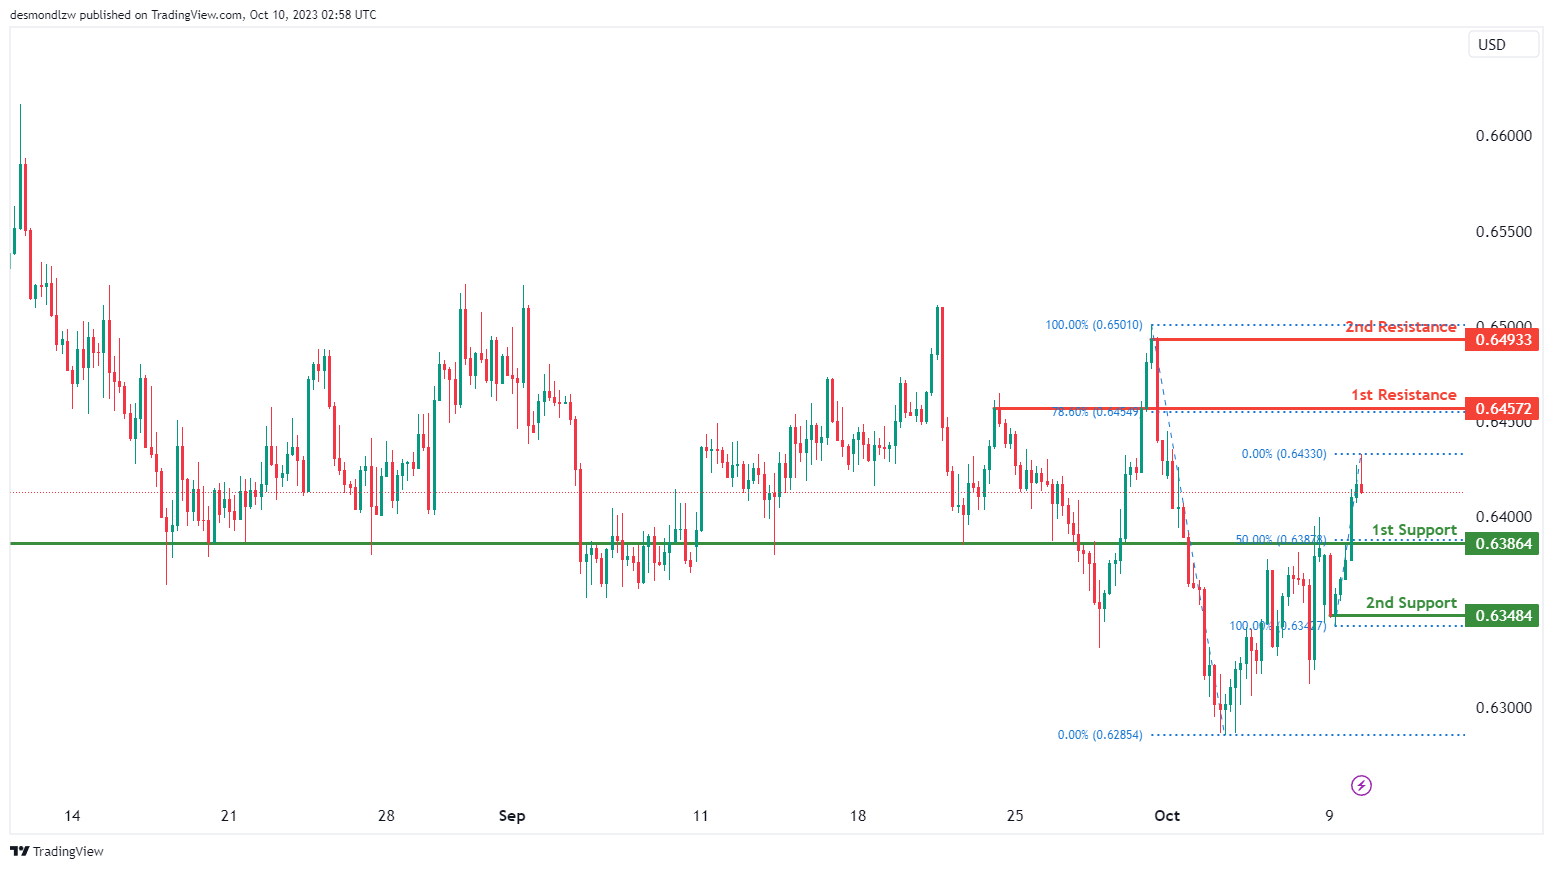
The AUD/USD chart currently exhibits a neutral momentum with a potential scenario for price to fluctuate between the 1st resistance and the 1st support levels.
The 1st support level at 0.6386 is identified as an overlap support that aligns with the 50.00% Fibonacci retracement level. Further below, the 2nd support level at 0.6348 is marked as a pullback, reinforcing its importance as a potential support level.
To the upside, the 1st resistance level at 0.6457 is identified as a swing-high resistance that aligns with the 78.60% Fibonacci retracement level. Additionally, the 2nd resistance level at 0.6493 is also noted as a swing-high resistance, further emphasizing its significance as a barrier for future price increases.
NZD/USD
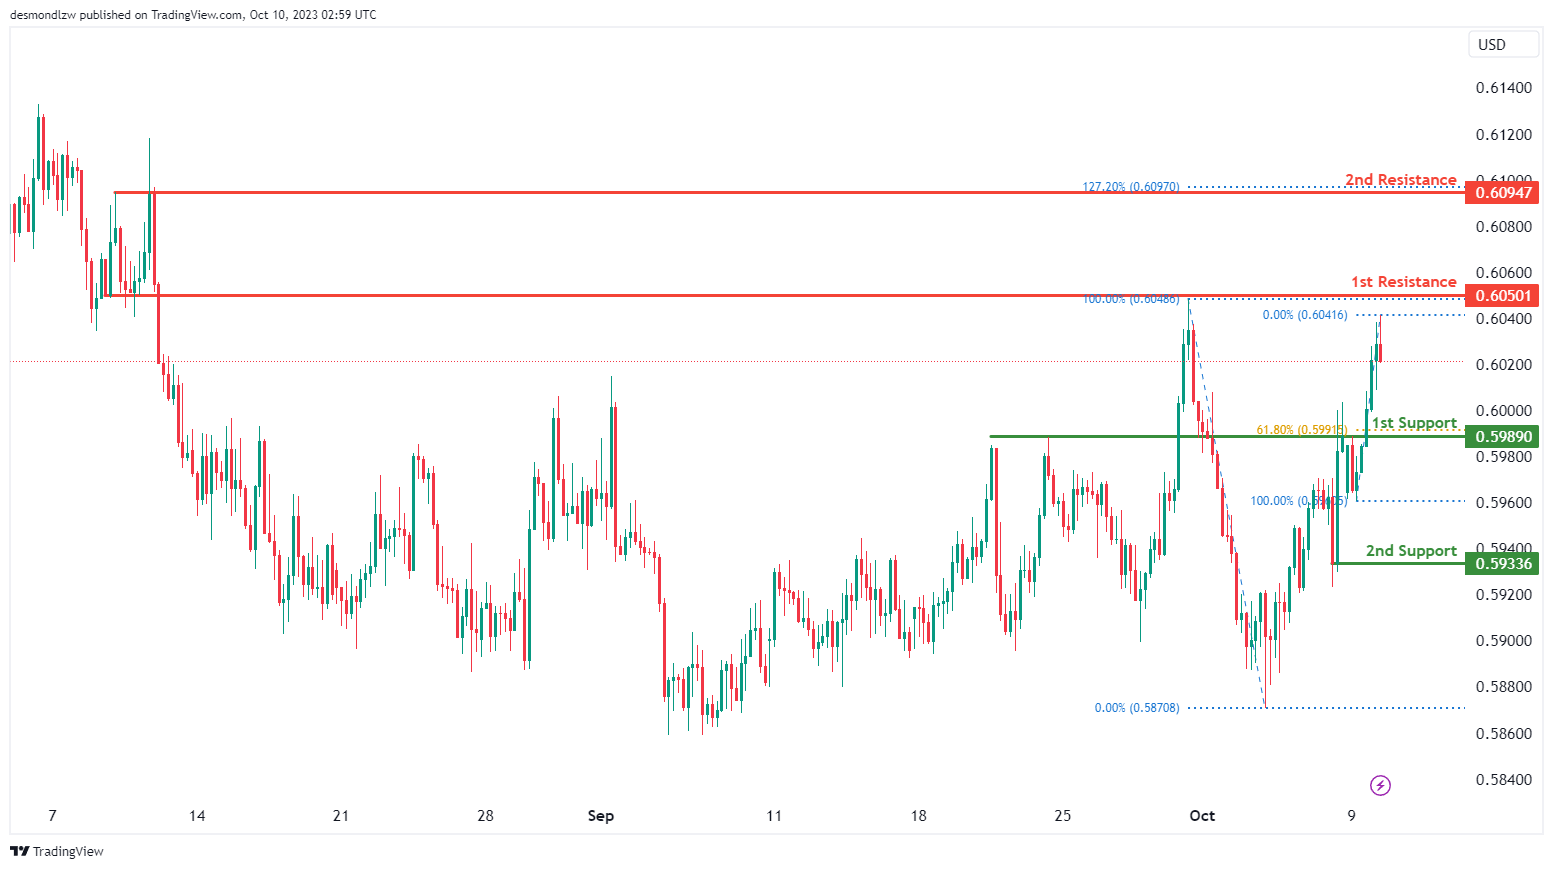
The NZD/USD chart currently exhibits a neutral momentum with a potential scenario for price to fluctuate between the 1st resistance and the 1st support levels.
The 1st resistance level at 0.6050 is identified as an overlap resistance. Additionally, the 2nd resistance level at 0.6095 is marked as a pullback resistance that aligns with the 127.20% Fibonacci extension level, further emphasizing its significance as a barrier for future price increases.
To the downside, the 1st support level at 0.5989 is identified as an overlap support that aligns with the 61.80% Fibonacci retracement level. Further below, the 2nd support level at 0.5934 is noted as a pullback support, further reinforcing its significance as an area where price may find support.
DJ30:
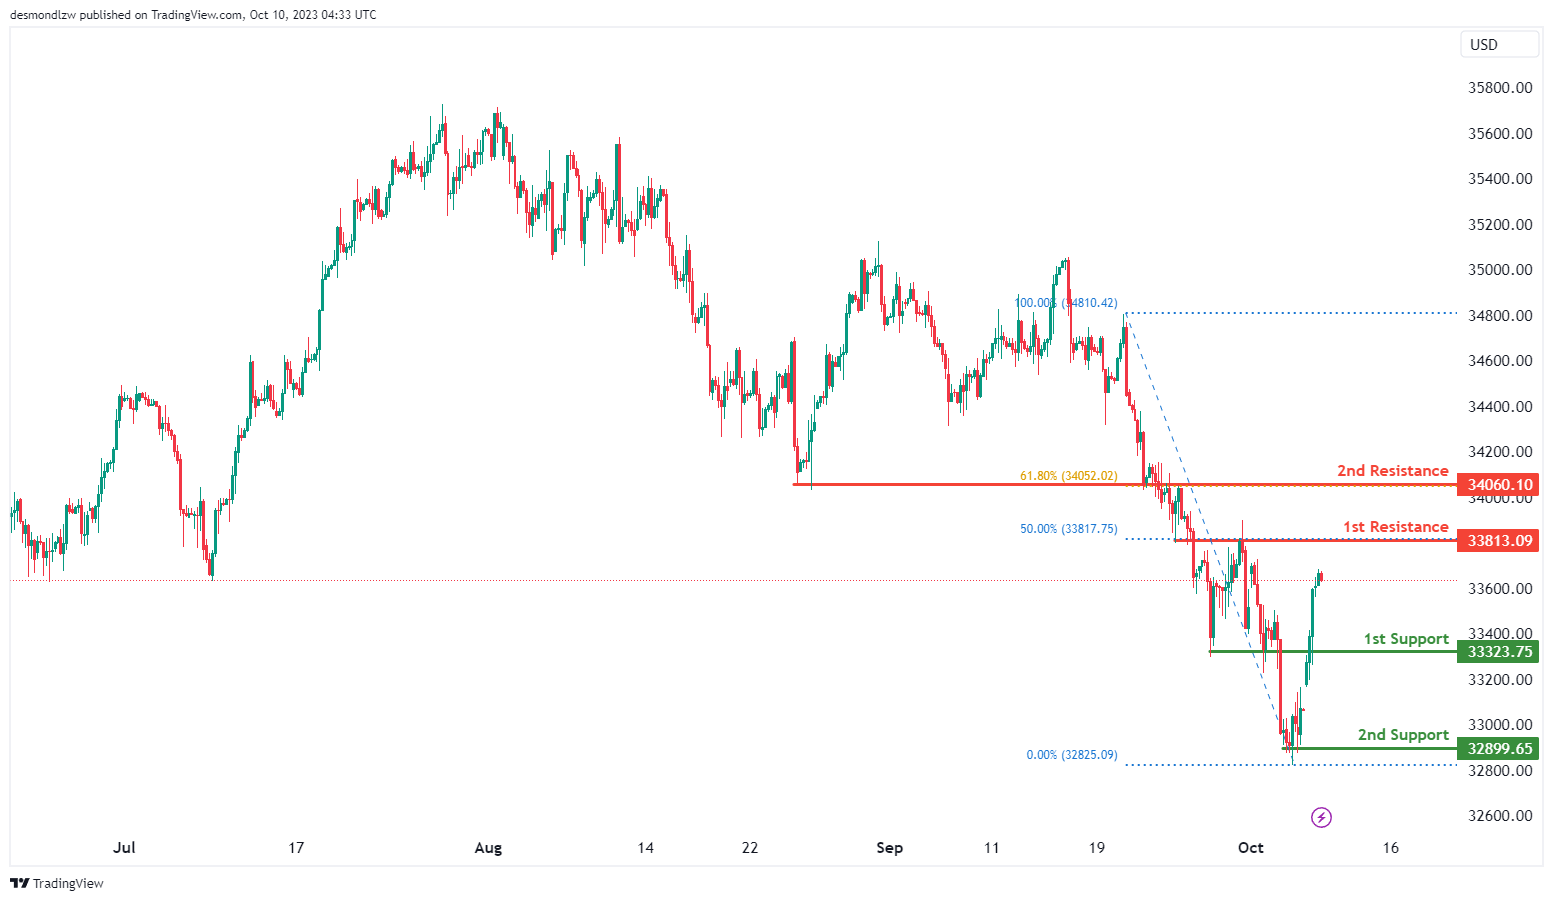
The instrument we are examining is DJ30, and the overall momentum of the chart indicates a bullish trend.
There is a possibility that the price may continue in a bullish direction, potentially reaching the first resistance level.
The first support level is at 33,323.75, and this support is considered strong due to its role as a pullback support.
The second support level is at 32,899.65, and it’s also significant as it represents a multi-swing low support.
On the resistance side, the first resistance level is at 33,813.09, and it’s noteworthy because it marks an overlap of resistance and is accompanied by a 50% Fibonacci Retracement.
The second resistance level is at 34,060.10, and it’s significant as well, as it represents an overlap of resistance and coincides with a 61.80% Fibonacci Retracement.
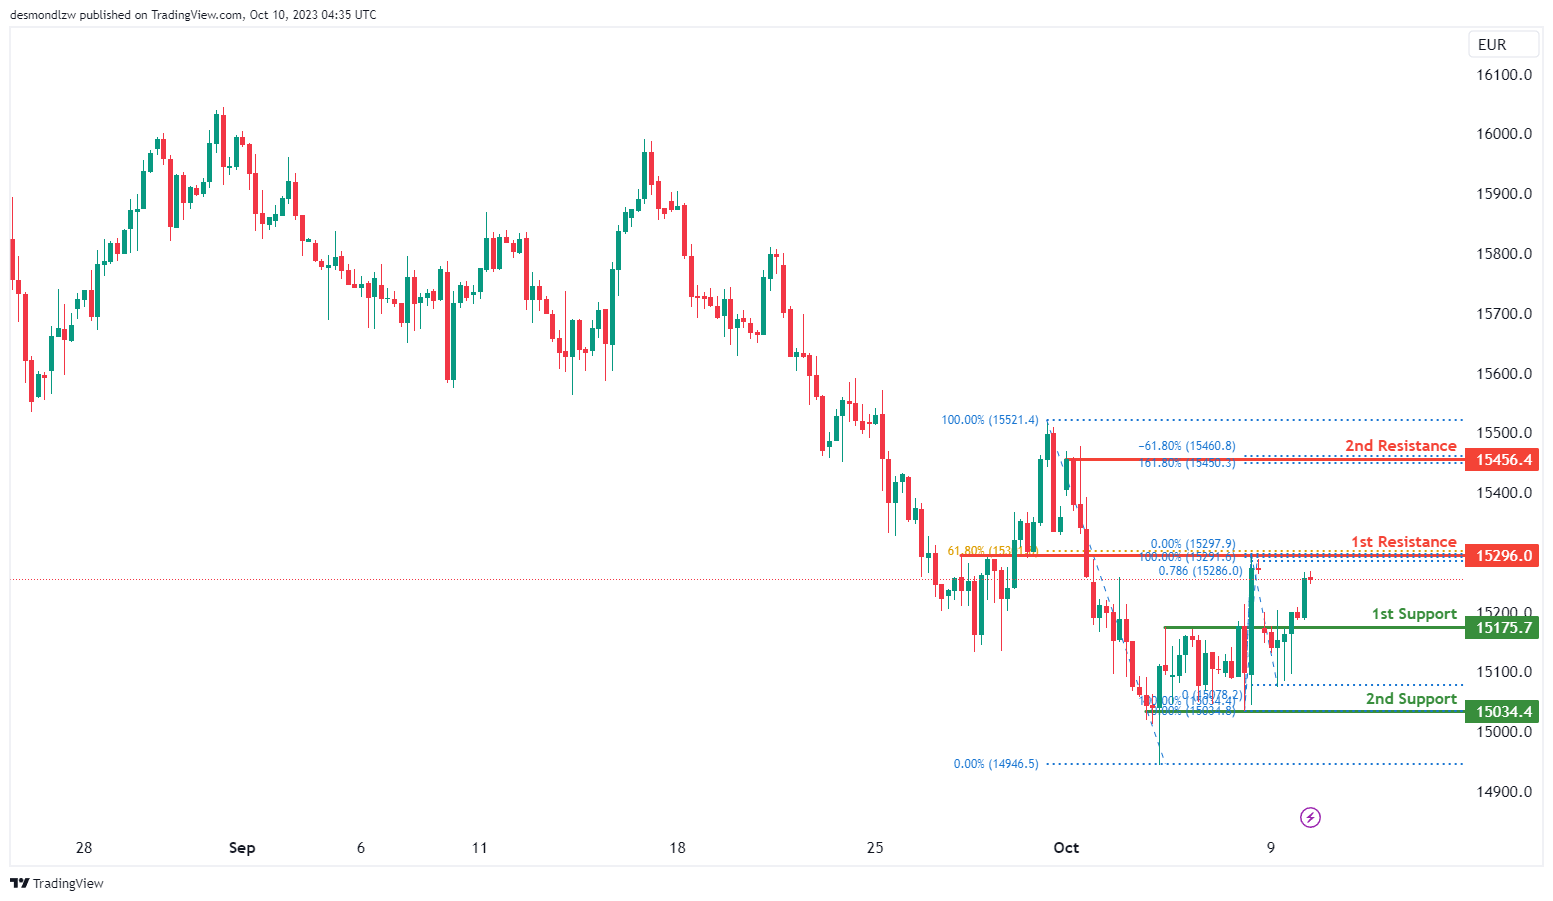
GER40:
The instrument we are examining is GER40, and the overall momentum of the chart indicates a bullish trend.
There is a possibility that the price may continue in a bullish direction, potentially reaching the first resistance level.
The first support level is at 15,175.70, and this support is considered strong due to its role as a pullback support.
The second support level is at 15,034.40, and it’s also significant as it represents a multi-swing low support.
On the resistance side, the first resistance level is at 15,296.00, and it’s noteworthy because it marks an overlap of resistance, a 61.80% Fibonacci Retracement, and a 78.60% Fibonacci Projection, indicating a Fibonacci confluence.
The second resistance level is at 15,456.40, and it’s significant as well, as it represents a swing high resistance and is associated with a -61.8% Fibonacci Expansion and a 161.80% Fibonacci Extension, indicating another Fibonacci confluence.
US500
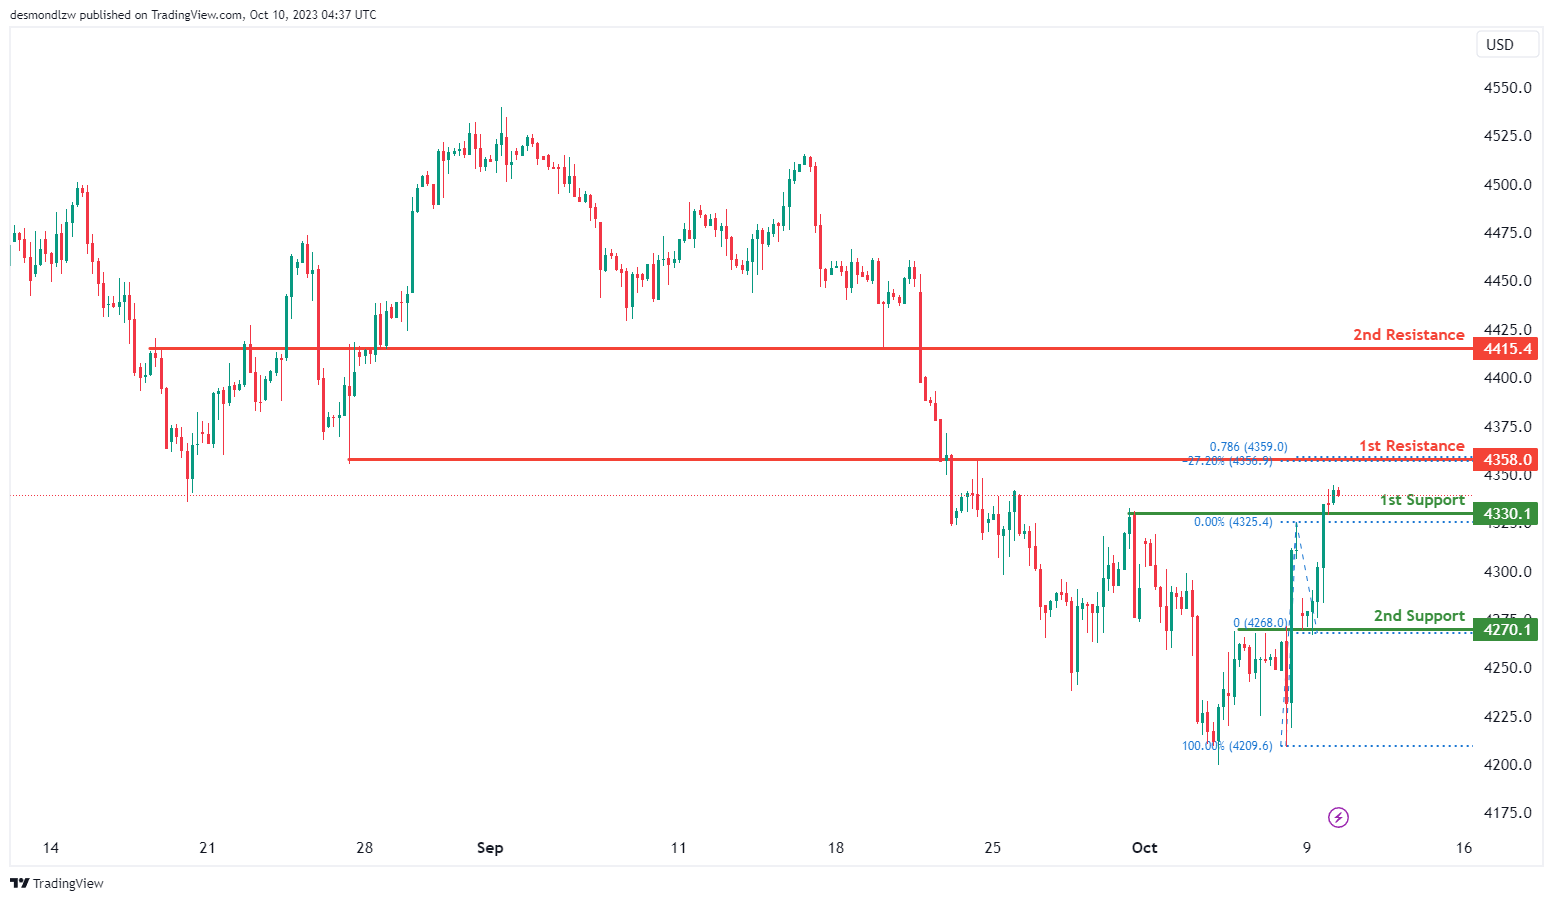
The instrument we are analyzing is US500, and the overall momentum of the chart indicates a bullish trend.
There is a possibility that the price may continue in a bullish direction, potentially reaching the first resistance level.
The first support level is at 4,330.1, and it’s considered strong because it represents an overlap of support.
The second support level is at 4,270.1, and it’s also significant as it marks another overlap of support.
On the resistance side, the first resistance level is at 4,358.0, and it’s noteworthy because it represents an overlap of resistance, a 78.60% Fibonacci Projection, and a -27% Fibonacci Expansion, indicating a Fibonacci confluence.
The second resistance level is at 4,415.4, and it’s significant as well, as it functions as a pullback resistance.
BTC/USD:
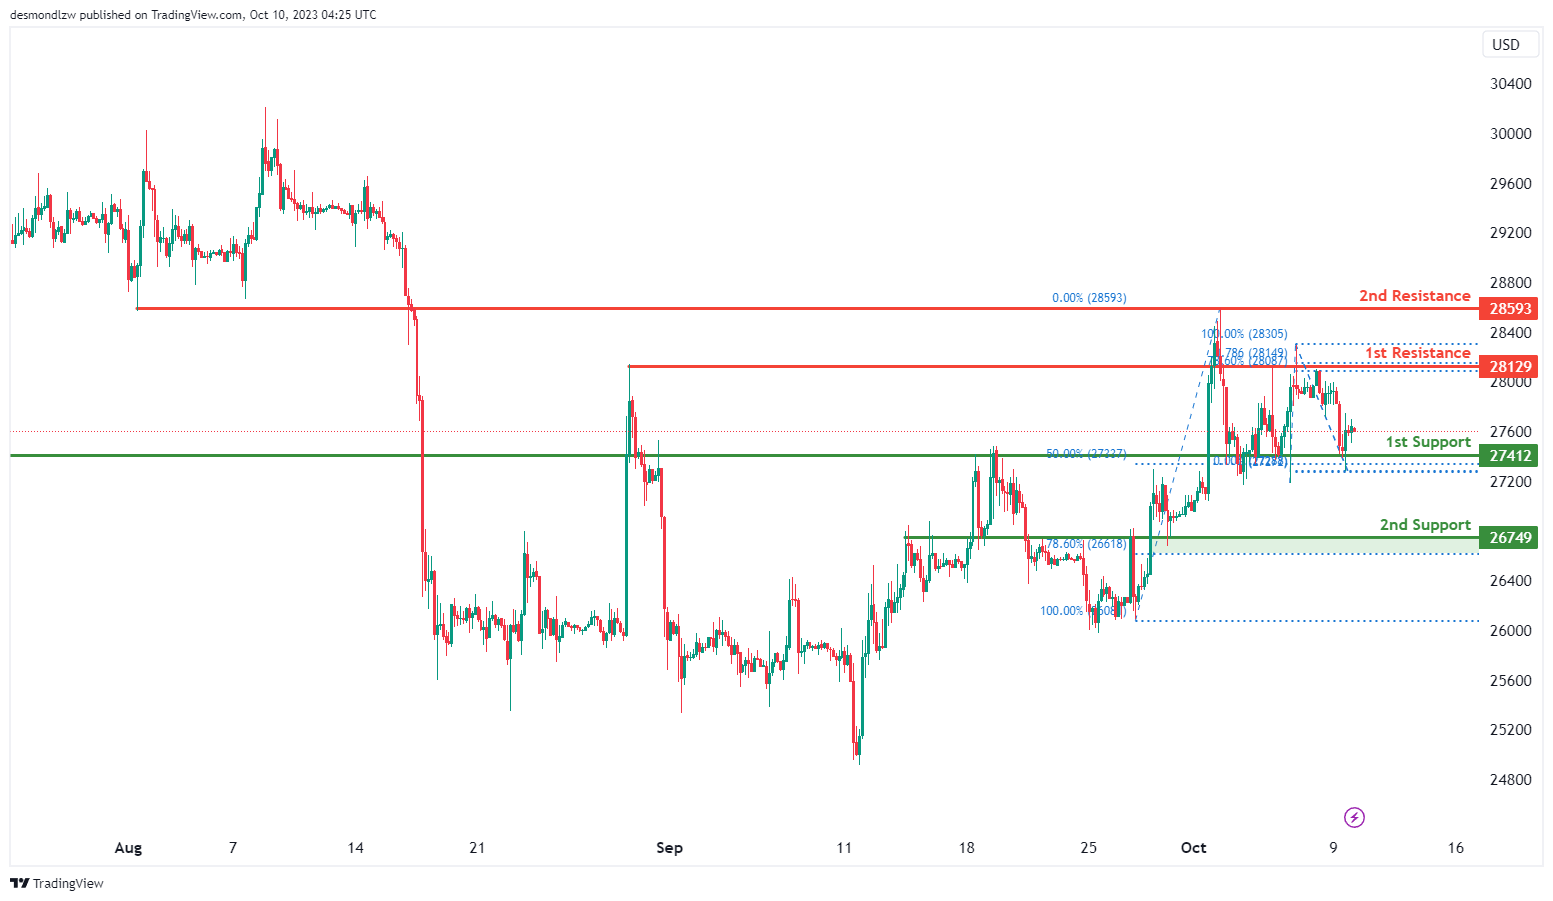
The instrument we’re looking at is BTC/USD, and the overall momentum of the chart appears to be bullish.
There is a possibility that the price could continue in a bullish direction, particularly towards the first resistance level.
The first support level is at 27,412, and this is considered a good support level due to an overlap of support and a 50% Fibonacci retracement.
The second support level is at 26,749, and it’s also considered a strong support because of an overlap of support and a 78.60% Fibonacci retracement.
On the resistance side, the first resistance level is at 28,129, and this is significant because there is an overlap of resistance, a 78.60% Fibonacci retracement, and a 78.60% Fibonacci projection, indicating a Fibonacci confluence.
The second resistance level is at 28,593 and is also noteworthy because it represents an overlap of resistance.
ETH/USD:
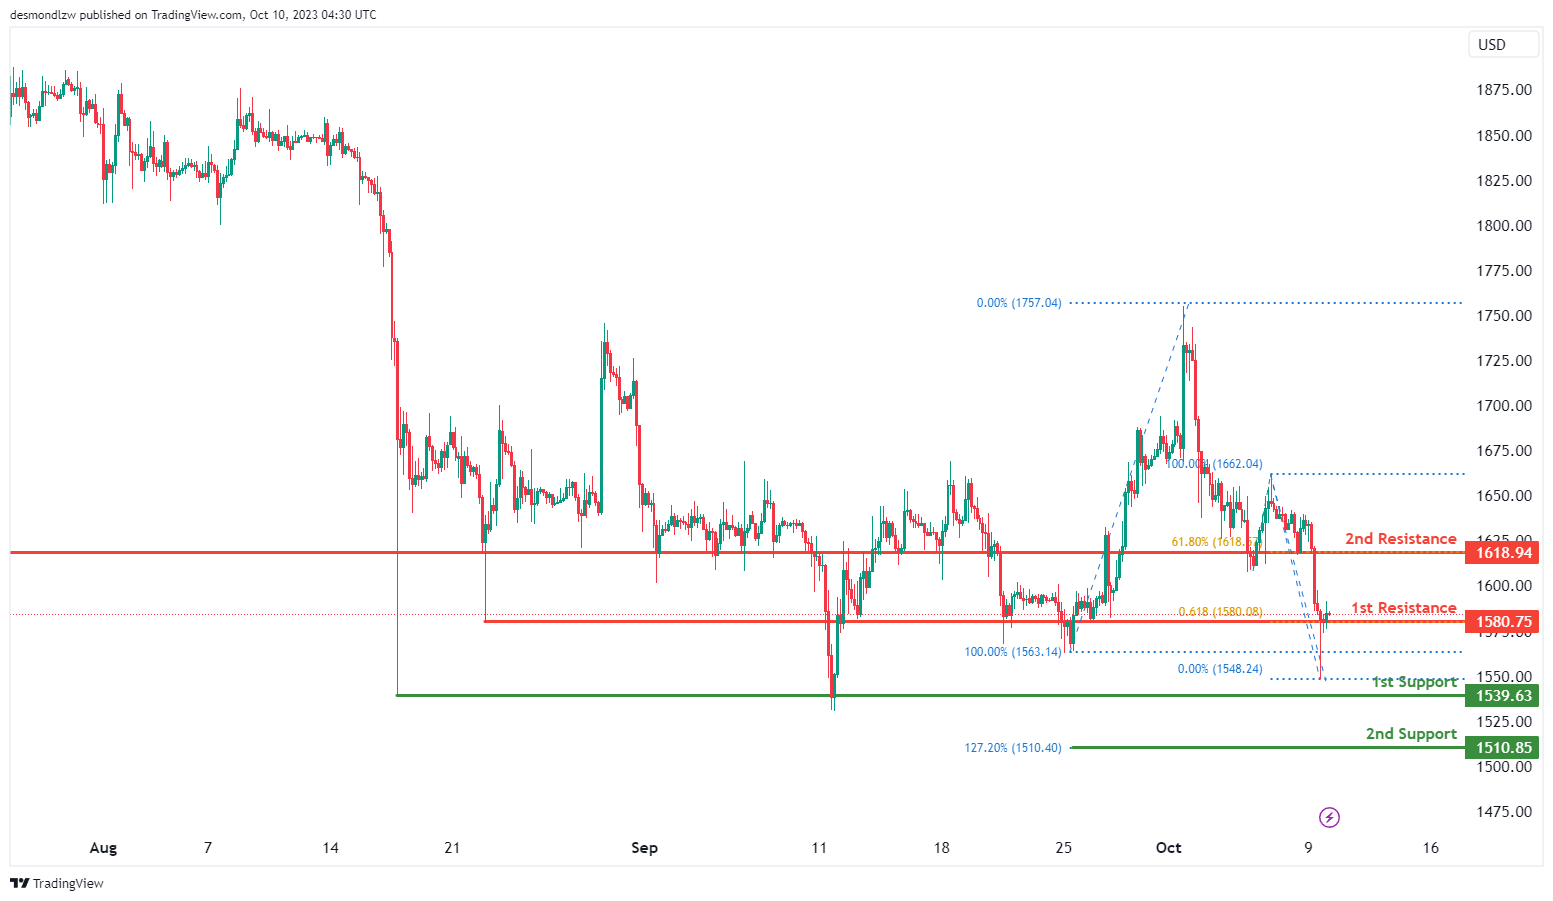
The instrument being analyzed is ETH/USD, and the overall momentum of the chart is currently bullish.
There is a possibility that the price could experience a bullish break through the first resistance and potentially rise to the second resistance level.
The first support level is at 1,539.63, and it’s considered a strong support due to its function as a pullback support.
The second support level is at 1,510.85, and it’s also notable because it aligns with the 127.20% Fibonacci Extension.
On the resistance side, the first resistance level is at 1,580.75, and it’s significant because it represents an overlap of resistance and is accompanied by a 61.80% Fibonacci Projection.
The second resistance level is at 1,618.94, and it’s noteworthy as well, as it functions as a pullback resistance and coincides with a 61.80% Fibonacci Retracement.
WTI/USD:
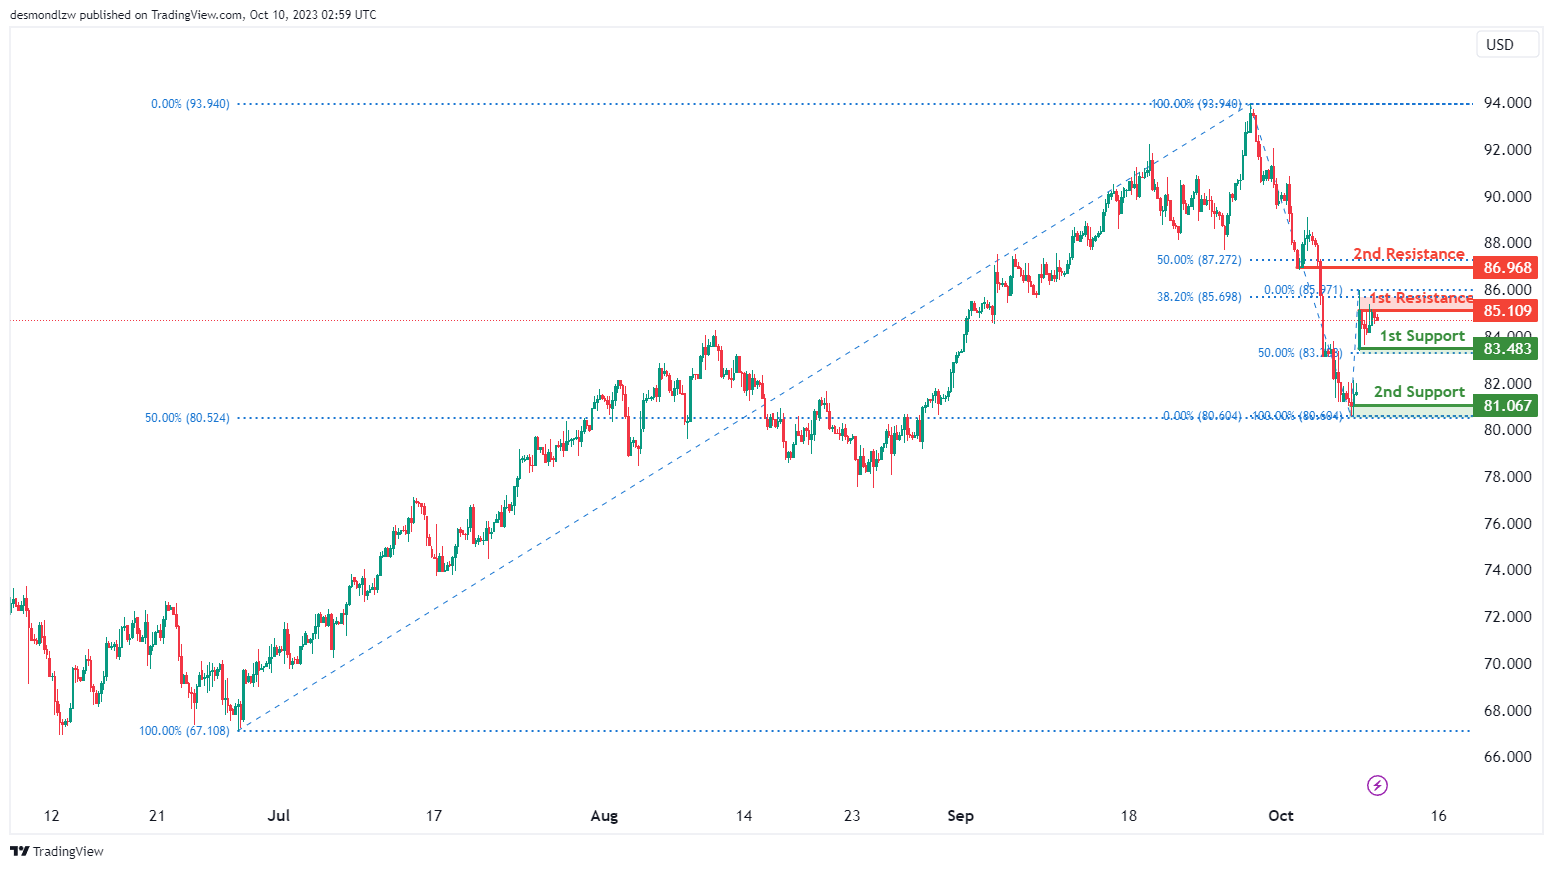
The WTI chart currently exhibits a neutral momentum with a potential scenario for price to fluctuate between the 1st resistance and the 1st support levels.
The 1st resistance level at 85.11 is identified as a pullback resistance that aligns close to the 38.20% Fibonacci retracement level. Higher up, the 2nd resistance level at 86.97 is also noted as a pullback resistance that aligns close to the 50.00% Fibonacci retracement level, potentially acting as a barrier to further upward movement.
To the downside, the 1st support level at 83.48 is identified as a pullback support that aligns with the 50.00% Fibonacci retracement level. Additionally, the 2nd support level at 81.07 is noted as a swing-low support, further reinforcing its significance as an area where price may find support.
XAU/USD (GOLD):
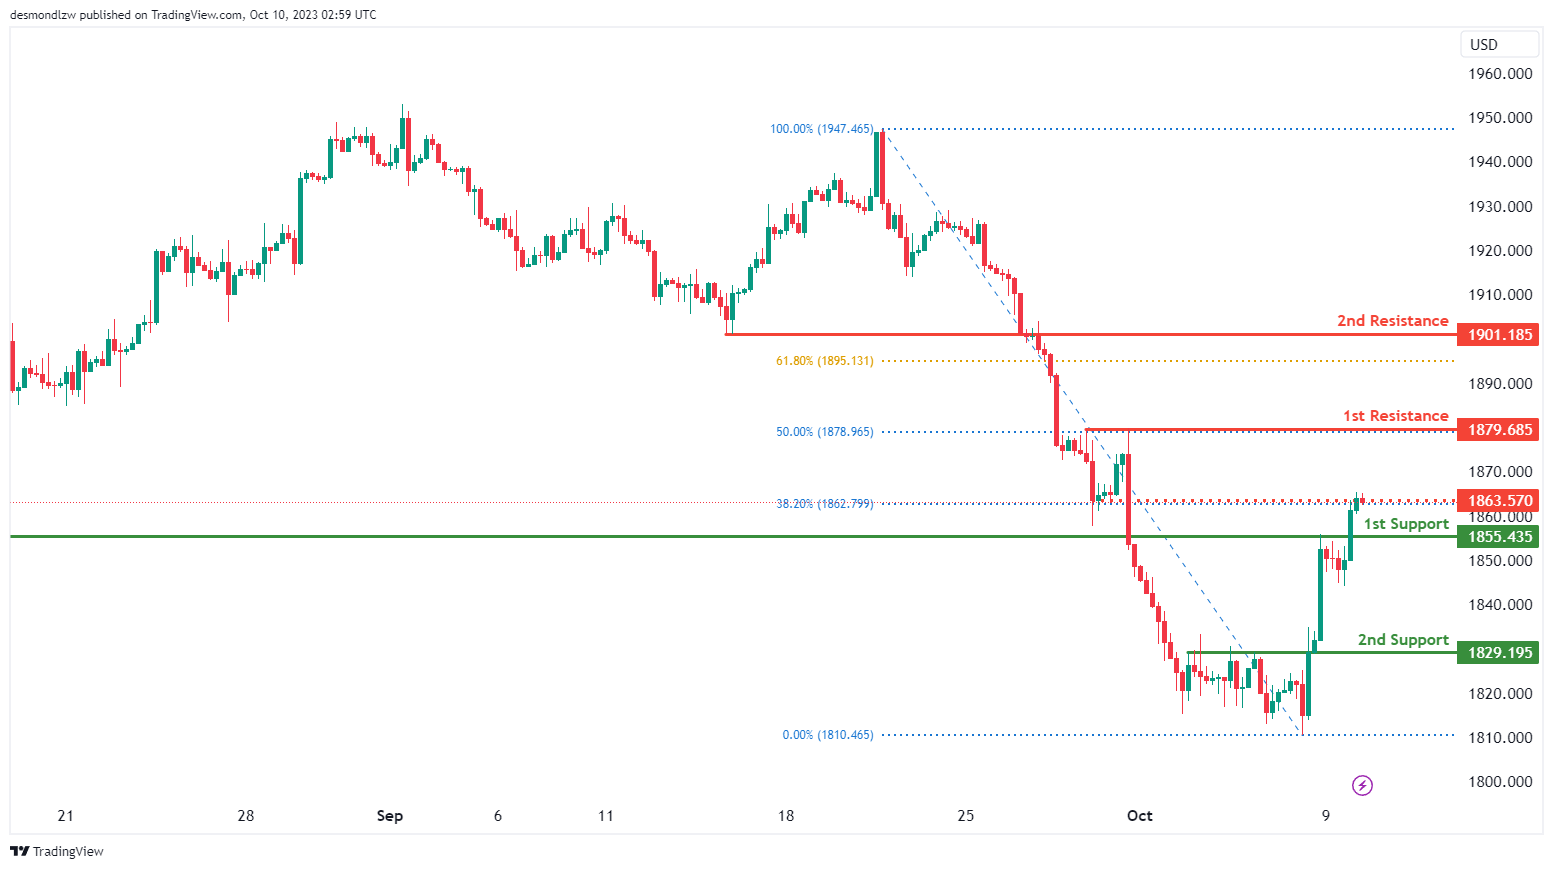
The XAU/USD chart currently exhibits bullish momentum, with a potential scenario of a bullish continuation towards the 1st resistance level should price break above the intermediate resistance level.
The intermediate resistance level at 1863.57 is identified as a pullback resistance that aligns with the 38.20% Fibonacci retracement level while the 1st resistance level at 1879.69 is also noted as a pullback resistance that aligns with the 50.00% Fibonacci retracement level. Higher up, the 2nd resistance level at 1901.19 is identified as a pullback resistance that aligns close to the 61.80% Fibonacci retracement level, potentially acting as a barrier to further upward movement.
To the downside, the 1st support level at 1855.44 is identified as a pullback support. Additionally, the 2nd support level at 1829.19 is also marked as a pullback support, further reinforcing its significance as an area where price may find support.
USD/JPY Daily Outlook
Daily Pivots: (S1) 148.22; (P) 148.73; (R1) 149.02; More...
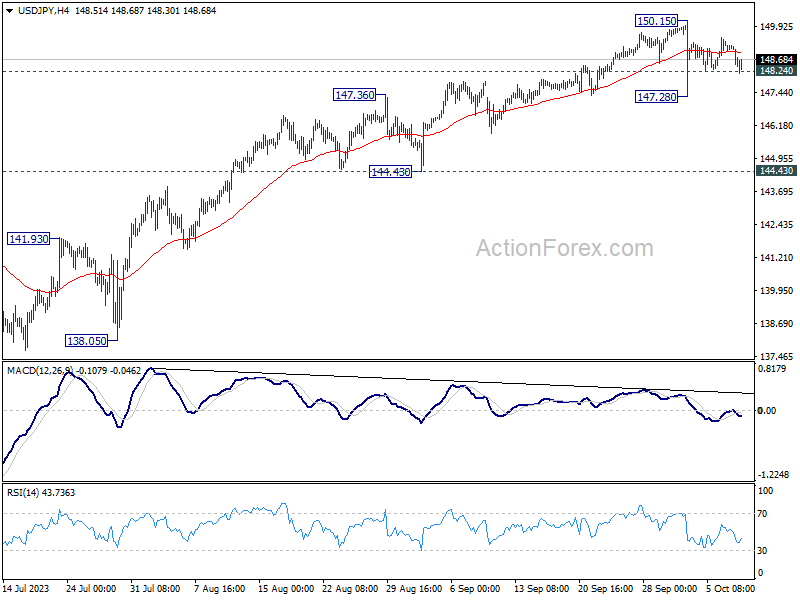
USD/JPY recovers after breaching 148.24 minor support and intraday bias stays neutral. Consolidation from 150.15 is still extending. On the downside, below 148.24 minor support will turn bias to the downside for another down leg through 147.28. But there is no confirmation of bearish trend reversal before firm break of 144.43 support. Another rally remains mildly in favor through 150.15 to retest 151.93 high.
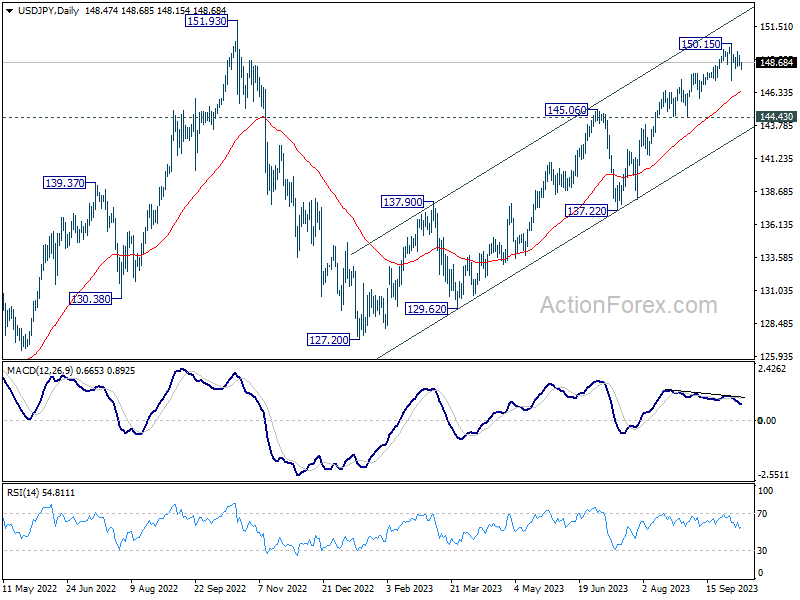
In the bigger picture, while rise from 127.20 is strong, it could still be seen as the second leg of the corrective pattern from 151.93 (2022 high). Rejection by 151.93, followed by sustained break of 145.06 resistance turned support will be the first sign that the third leg of the pattern has started. However, sustained break of 151.93 will confirm resumption of long term up trend.
Yen Weakens as Momentum Fades, Japan Shifting Currency Rhetoric
Japanese Yen is trading on a softer note in Asian session as the rebound witnessed yesterday begins to lose steam. A notable comment from Japan's Finance Minister Shunichi Suzuki raised some interest among market observers. Suzuki attributed the ongoing weakening of Yen partly to interest rate differentials, steering away from the customary practice of solely pointing fingers at speculative trading. The markets are now awaiting to see if this expanded rhetoric will hold over time. More significantly, the change in tone could potentially hint at BoJ mulling over the idea of moving away from its negative interest rate regime or could even suggest an acceptance of a further decrease in Yen's exchange range.
In contrast, Swiss Franc stands strong, buoyed by safe-haven demands stirred by escalating conflicts in the Middle East. Canadian Dollar follows suit, finding support from the buoyancy in oil prices. Australian Dollar's resilience, however, presents a puzzling scenario, given the prevailing market sentiment and uninspiring consumer and business confidence data. A plausible explanation for Aussie's performance can be linked to the rebound observed in Chinese Yuan and Hong Kong stock markets. Dollar finds itself on the weaker end of the spectrum, alongside British Pound, while Euro's performance remains mixed.
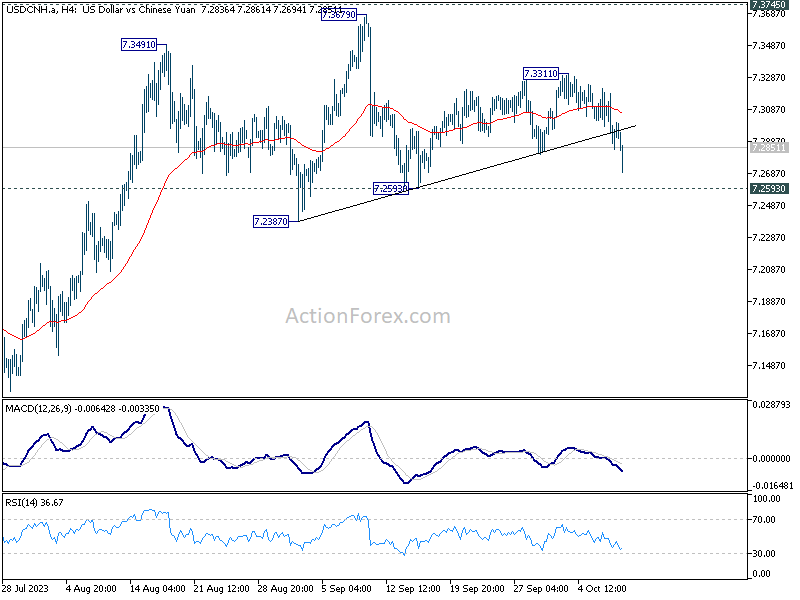
Technically, USD/CNH dips to as low as 7.2694 but quickly recovered. A head and shoulder top could be in the making (ls: 7.3491, h: 7.3679, rs: 7.3311). Further decline in USD/CNH and decisive break of 7.2593 could mark the start of reversal to the whole up trend from 6.6971 (Jan low). If materializes, the subsequent selloff could be steep and extra support could be give to AUD/USD for a take on 0.6500 near term resistance. Should this materialize, we could see a precipitous sell-off, potentially lending additional support to the AUD/USD, setting the stage for a challenge of the 0.6500 resistance in the near term.
In Asia, at the time of writing, Nikkei is up 2.31%. Hong Kong HSI is up 1.29%. China Shanghai SSE is down -0.50%. Singapore Strait Times is up 0.82%. Japan 10-year JGB yield is down -0.0339 at 0.769. Overnight, DOW rose 0.59%. S&P 500 rose 0.63%. NASDAQ rose 0.39%. 10-year yield rose 0.013 to 4.797.
Fed's Jefferson on the balance between rising yields and monetary policy
Fed Vice Chair Philip Jefferson shared in a speech overnight the insights on challenges posed by rising real long-term Treasury yields. He pointed out the complexities faced by policymakers when determining the direction of monetary policy amidst such changes.
Jefferson stated, "In part, the upward movement in real yields may reflect investors' assessment that the underlying momentum of the economy is stronger than previously recognized and, as a result, a restrictive stance of monetary policy may be needed for longer than previously thought."
However, he was quick to add a caveat, underscoring the nuances associated with interpreting yield movements. Jefferson added, "But I am also mindful that increases in real yields can arise from changes in investor's attitudes toward risk and uncertainty."
Jefferson assured his approach would be comprehensive and adaptive. "I will remain cognizant of the tightening in financial conditions through higher bond yields and will keep that in mind as I assess the future path of policy," he noted.
The Vice Chair will weight the "totality of incoming data in assessing the economic outlook and the risks surrounding the outlook".
Highlighting the delicate equilibrium that is to be maintained, Jefferson encapsulated the current scenario as a "sensitive period of risk management." Here, the dichotomy lies in "balance the risk of not having tightened enough, against the risk of policy being too restrictive."
BoE's Mann highlights concerns over extended inflation duration
BoE MPC Catherine Mann emphasized the significance of the duration of inflation in guiding her future policy decisions.
Mann pointedly remarked, "Going forward, a very important ingredient for my decision-making is the duration of inflation, and how long it is exceeding target."
The MPC member expressed concerns that prolonged inflation above the target could lead to a "drift" in medium-term expectations. Monetary policy "has to be more aggressive, because it has to address both a drift in expectations as well as the actual inflation above target," Mann further elaborated.
Mann also warned of the challenges that could arise if inflation remains persistently above the target. "If inflation gets embedded for longer above target, then getting it to target is going to require more policy action for longer and that I'd rather not have to do because people become backward looking," she said.
In the context of future economic shocks, Mann anticipates an "upward bias" in inflation, suggesting that a higher neutral rate of interest is "a very plausible outcome."
Australian consumer sentiment ticks up to 82, but interest rates concerns linger
Australia's Westpac Consumer Sentiment Index showed a positive move, climbing 2.9% from 79.7 to 82 in October. Despite the uptick, a score of 82 still paints a subdued picture, correlating with a decline in per capita spending.
One of the more pressing concerns for consumers remains the prospective upward movement in mortgage interest rates. The post-October RBA decision survey indicated that 63% of consumers anticipate mortgage interest rates to climb in the forthcoming year. This figure marks a substantial rise from 52.3% in September. N
Notably, however, these numbers don't match the heightened concerns recorded when RBA was in an active rate-hiking mode, where readings ranged between 70-80%. Meanwhile, optimism for a rate cut next year has dwindled; only 7% of consumers now hold that expectation, down from 15% the previous month.
The upcoming November 7 meeting of RBA is earmarked as a significant event, with a revised set of forecasts to accompany the Statement on Monetary Policy.
Westpac shared their viewpoint on the evolving situation: "While the RBA may need to revise its near-term forecasts for headline inflation up, on its own this will probably not be enough to trigger a further rate rise."
The September quarter CPI, slated for release on October 25, is now in sharp focus. Westpac added, "If, however, there are further surprises in the September quarter CPI, due October 25, the next few meetings could be a little more live than the one in October."
Australian NAB business confidence unchanged at 1, declining conditions and easing price pressures
Australia NAB Business Confidence for September remained stable at a level of 1. Meanwhile, a decline was observed in Business Conditions, which slid from 14 to 11. A deeper dive into the components reveals trading conditions receding from 19 to 16, profitability conditions from 14 to 8, and employment conditions registering a dip from 10 to 8.
Notably, growth in labor costs saw a deceleration, moving from a 3.2% quarterly rate down to 2.0%. Additionally, purchase costs experienced a slowdown from 2.9% to 1.8%. Both final product prices and retail prices exhibited moderated growth rates, with the former decelerating from 1.7% to 1.0% while the latter remained unchanged at 1.8%.
NAB Chief Economist Alan Oster remarked, "the economy has remained in reasonable shape through the middle of the year." He went on to note the +1 index points underscores that firms are somewhat ambivalent regarding their future prospects, with views split evenly regarding the outlook.
However, there was a silver lining in the inflation scenario. Oster highlighted that "the survey showed some positive signs for inflation with cost pressures and price growth easing in the month."
Even though the imminent Q3 CPI release is anticipated to reflect strong inflation for the quarter, Oster noted, "the September survey results suggest the momentum of some of the key cost pressures driving inflation may have started to step back in a welcome sign for the broader inflation outlook."
Looking ahead
Italy industrial production will be featured in European session. US will release NFIB business optimism index later in the day.
USD/JPY Daily Outlook
Daily Pivots: (S1) 148.22; (P) 148.73; (R1) 149.02; More...
USD/JPY recovers after breaching 148.24 minor support and intraday bias stays neutral. Consolidation from 150.15 is still extending. On the downside, below 148.24 minor support will turn bias to the downside for another down leg through 147.28. But there is no confirmation of bearish trend reversal before firm break of 144.43 support. Another rally remains mildly in favor through 150.15 to retest 151.93 high.
In the bigger picture, while rise from 127.20 is strong, it could still be seen as the second leg of the corrective pattern from 151.93 (2022 high). Rejection by 151.93, followed by sustained break of 145.06 resistance turned support will be the first sign that the third leg of the pattern has started. However, sustained break of 151.93 will confirm resumption of long term up trend.
Economic Indicators Update
| GMT | Ccy | Events | Actual | Forecast | Previous | Revised |
|---|---|---|---|---|---|---|
| 23:30 | AUD | Westpac Consumer Confidence Oct | 2.90% | -1.50% | ||
| 23:50 | JPY | Current Account (JPY) Aug | 1.63T | 2.41T | 2.77T | |
| 00:30 | AUD | NAB Business Conditions Sep | 11 | 13 | ||
| 00:30 | AUD | NAB Business Confidence Sep | 1 | 2 | ||
| 05:00 | JPY | Eco Watchers Survey: Current Sep | 53.2 | 53.6 | ||
| 08:00 | EUR | Italy Industrial Output M/M Aug | -0.60% | -0.70% | ||
| 10:00 | USD | NFIB Business Optimism Index Sep | 91.5 | 91.3 | ||
| 14:00 | USD | Wholesale Inventories Aug F | -0.10% | -0.10% |
GBP/USD Could Rally If It Surpasses 1.2300
Key Highlights
- GBP/USD is attempting a recovery wave above the 1.2150 resistance.
- A major bearish trend line is forming with resistance near 1.2250 on the 4-hour chart.
- EUR/USD is struggling to recover above 1.0600 and 1.0620.
- Gold prices climbed toward $1,855 before the bears appeared.
GBP/USD Technical Analysis
The British started a major decline below the 1.2500 level against the US Dollar. GBP/USD traded below the 1.2350 level to enter a bearish zone.
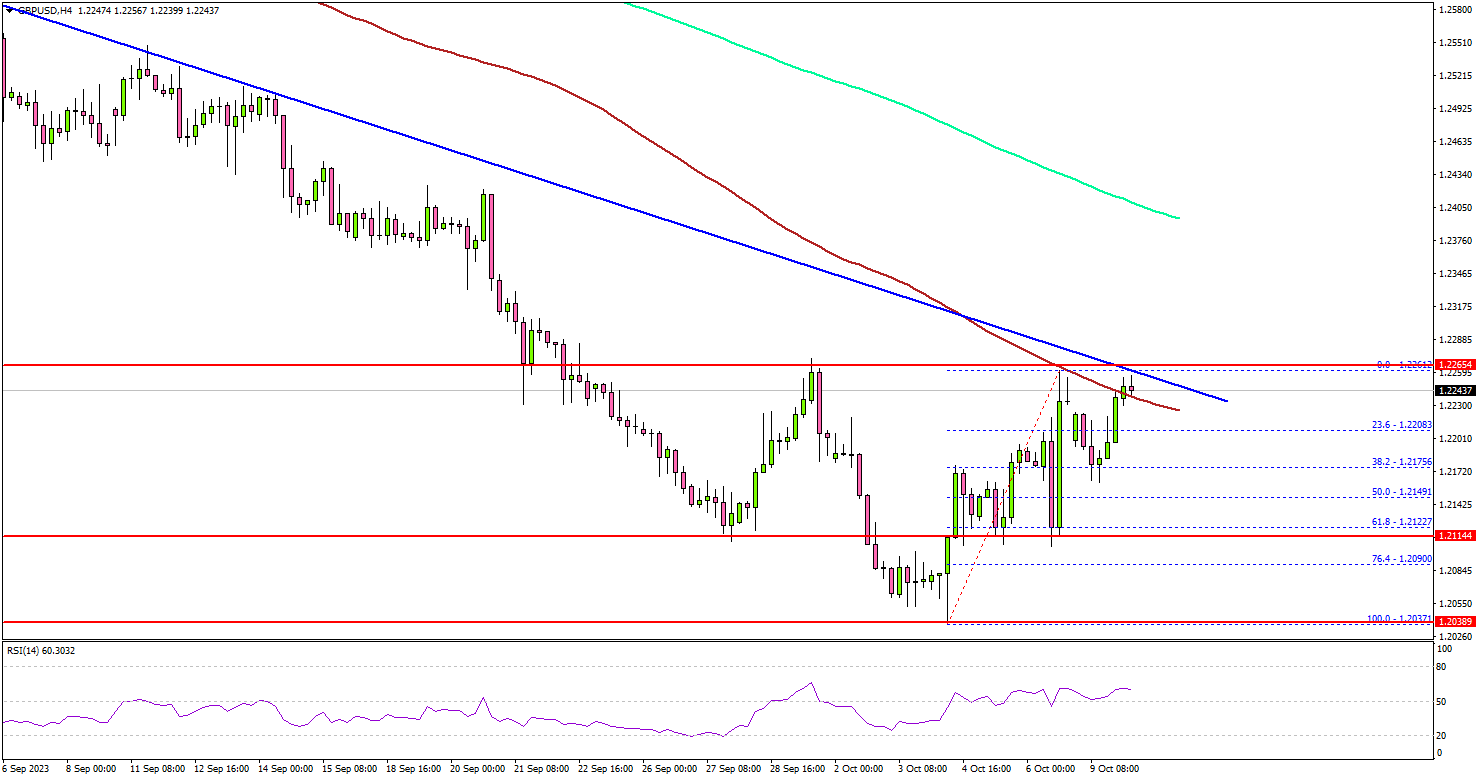
Looking at the 4-hour chart, the pair settled below the 1.2300 level, the 100 simple moving average (red, 4 hours), and the 200 simple moving average (green, 4 hours).
It even tested the 1.2035 zone. A low was formed near 1.2037 and the pair recently started a recovery wave. There was a move above the 1.2120 and 1.2150 resistance levels. It even tested the 1.2250 resistance and the 100 simple moving average (red, 4 hours).
However, the pair is now struggling to clear the 1.2250 resistance. The next key resistance is near 1.2300. A close above 1.2300 could start a steady increase.
In the stated case, GBP/USD might rise and recover toward the 1.2400 resistance zone or the 200 simple moving average (green, 4 hours). If not, the pair could start another decline from 1.2250.
Immediate support is near the 1.2150 level. The next key support is seen near the 1.2110 level, below which it could test 1.2035. Any more losses might send the pair toward the 1.2000 level.
Looking at gold, the price recovered above the $1,850 level but it seems like the bulls are struggling to push it further toward $1,880.
Economic Releases
- US Wholesale Inventories for August 2023 – Forecast -0.1%, versus -0.1% previous.