

Sample Category Title
Geopolitical Risk Premium on the Rise May Trigger Another Round of Risk-off Movement in Equities
- In the recent past three months, the 40% rally seen in the WTI crude oil has a significant direct correlation with the US 10-year US Treasury yield.
- A higher US 10-year US Treasury yield has trigged a short-term downtrend in global equities since late July 2023.
- WTI crude oil futures gapped up by +5% in today’s Asia opening session due to the ongoing hostilities between Israel and Hamas, the Palestinian militant group.
- A further up move above a key short-term resistance of US$89.70/barrel on WTI crude oil futures may trigger another potential round of “pain trade” for global equities.
The unfortunate turn of events that took place in Israel over the weekend triggered an official declaration of war on Hamas, the Palestinian militant group by the Israeli government. The scale of the surprise attack by Hamas on Israeli soil is the most drastic since the Yom Kippur War in 1973.
Given that Israel is a strategic stakeholder in international relations within the Middle East region, a further escalation of the current armed conflict may see a rise in oil price supply disruptions which tends to be used as a “choice strategic weapon” for potential bargaining chips among the stakeholders that are involved in the conflict.
Inflationary expectations have moved in tandem with WTI crude oil
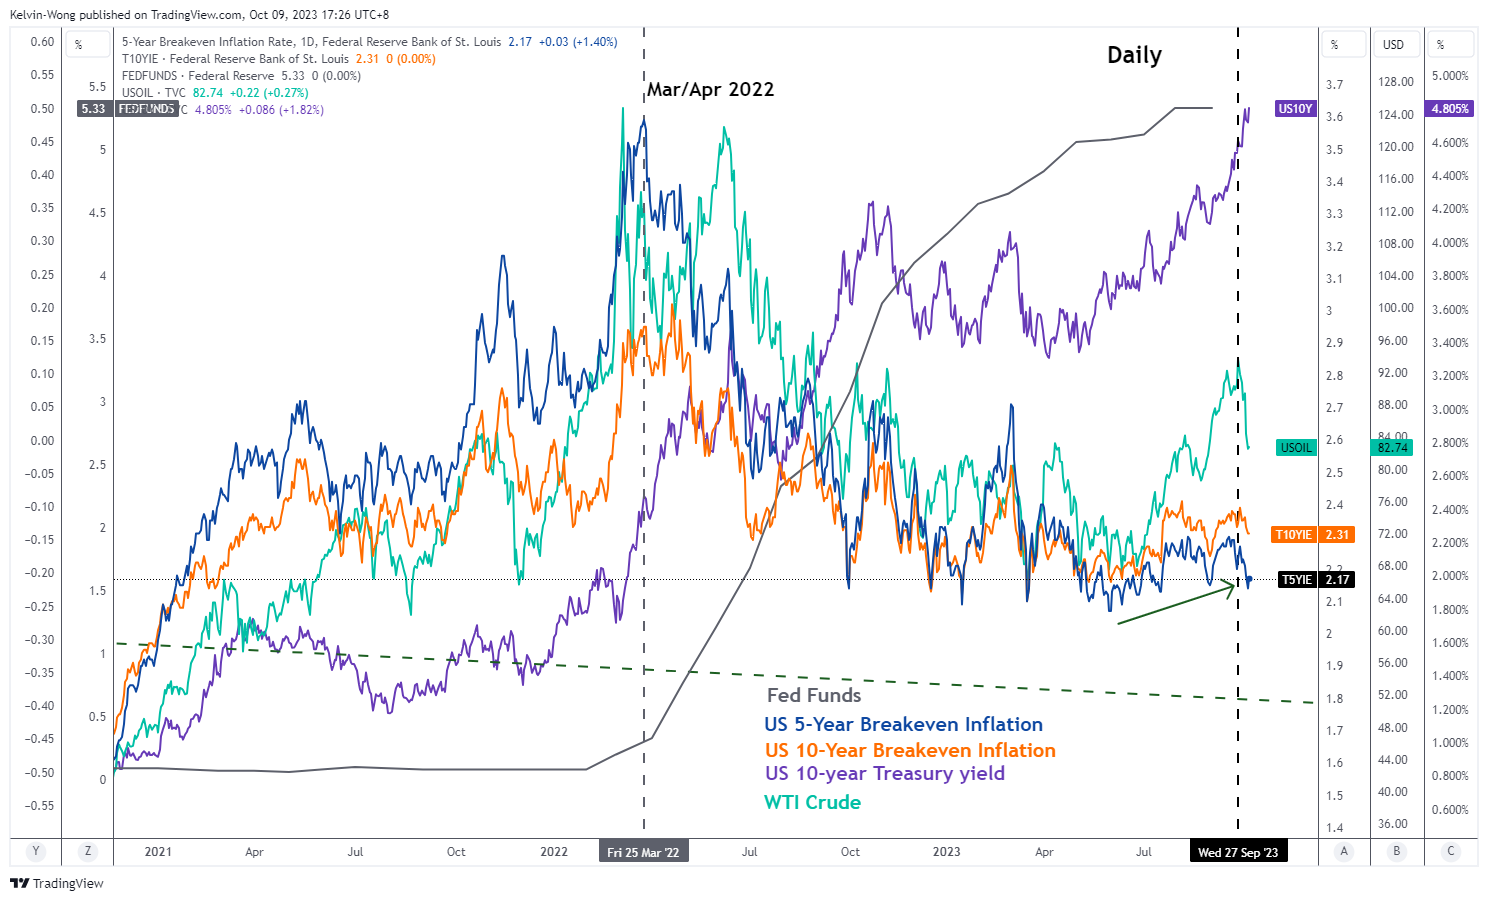
Fig 1: Correlation between WTI crude oil, US breakeven inflation rates & US 10-year Treasury yield as of 9 Oct 2023 (Source: TradingView, click to enlarge chart)
Based on intermarket analysis, the recent three-month rally of 40% seen in the WTI crude oil from mid-June to the end of September has a significant direct correlation with inflationary expectations inferred by market transacted US 10 and 5-year breakeven inflation rates. The tandem rise seen in the price movements of WTI crude oil with these breakeven inflation rates in the past three months has in turn driven up longer-term US Treasury yields such as the 10-year that jumped by 100 basis points over the same period and even continued to extend its ascend in the first week of October to print an intraday high of 4.88% on last Wednesday, 4 October, a high last seen in July 2007.
Higher longer-term US Treasury yields triggered a short-term downtrend in the S&P 500
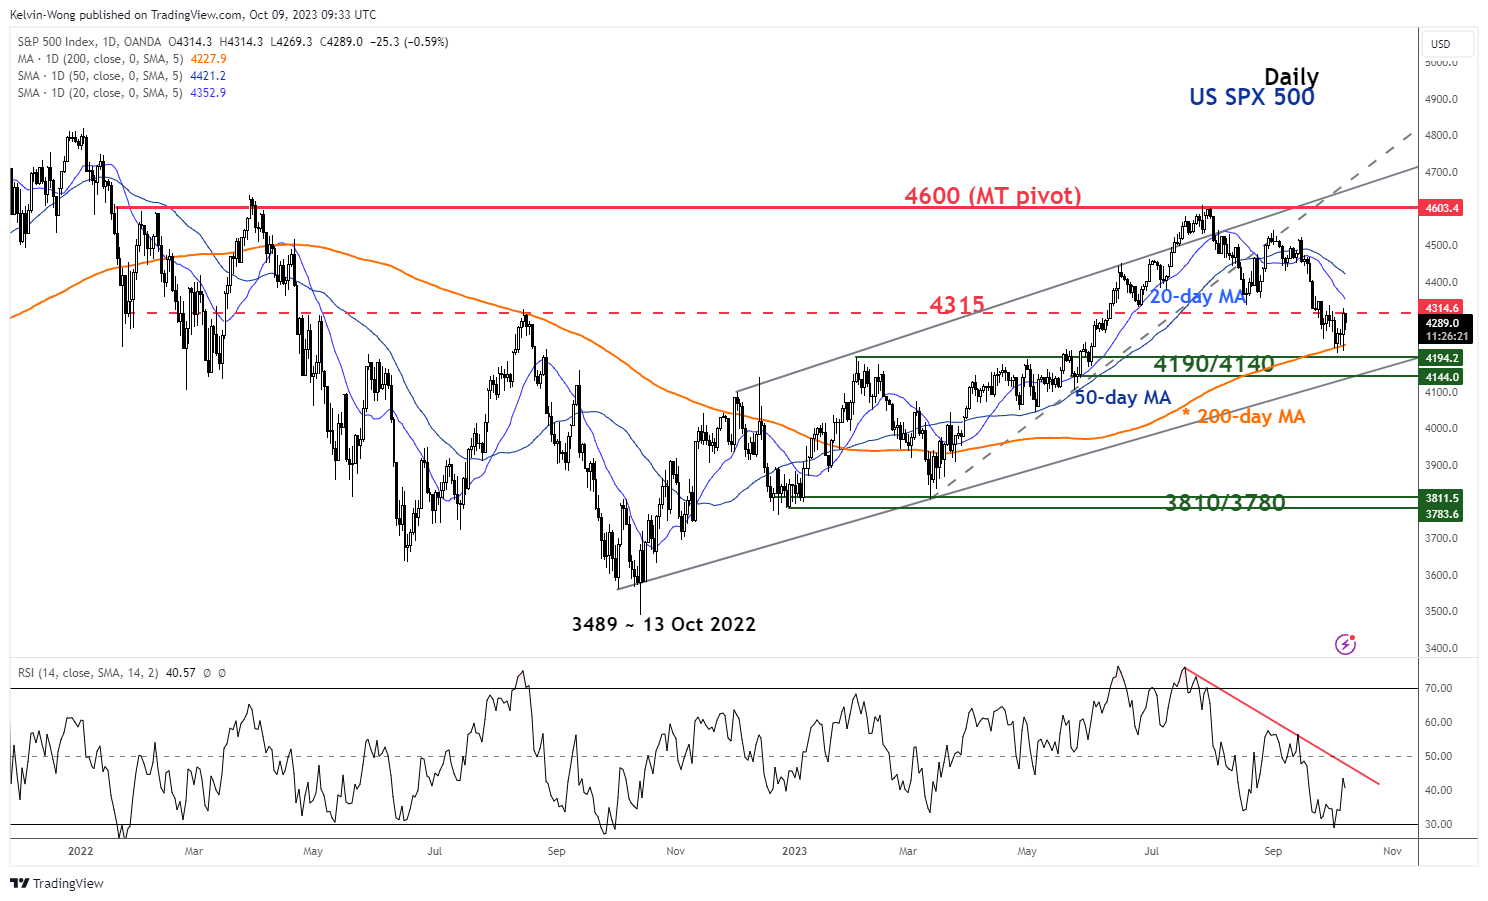
Fig 2: US S&P 500 medium-term trend as of 9 Oct 2023 (Source: TradingView, click to enlarge chart)
The push-up seen in the US 10-year Treasury yield is also one of the primary factors that led to the current short-term downtrend seen in global equities in the last two months; using the US benchmark stock index, S&P 500 as a leading global gauge that broke below its 20 and 50-day moving averages with a loss of around -8% from is 27 July 2023 high to its recent 4 October 2023 low.
The US 10-year Treasury yield is a global benchmark long-term “risk-free” interest rate and a further push up in the 10-year yield towards a key major resistance of 5.20% may trigger a “pain environment” for long-duration risk assets such as equities due to a higher cost funding that is likely to be detrimental to earnings growth which in turn increases the opportunity costs of holding equities over fixed income via the equity risk premium factor.
Hence, as highlighted earlier, the 10-year US Treasury yield has been indirectly influenced by higher WTI crude oil prices triggered by the behavioural conduit from higher inflationary expectations that are likely to maintain the US central bank, the Fed’s current stance of maintaining a higher level of interest rates for a longer period.
Therefore, it is paramount to decipher the current sentiment of the WTI crude from the lens of technical analysis and the key level that may kickstart another potential impulsive move sequence within its medium-term uptrend in place since June 2023.
WTI crude oil gapped up above its 50-day moving average
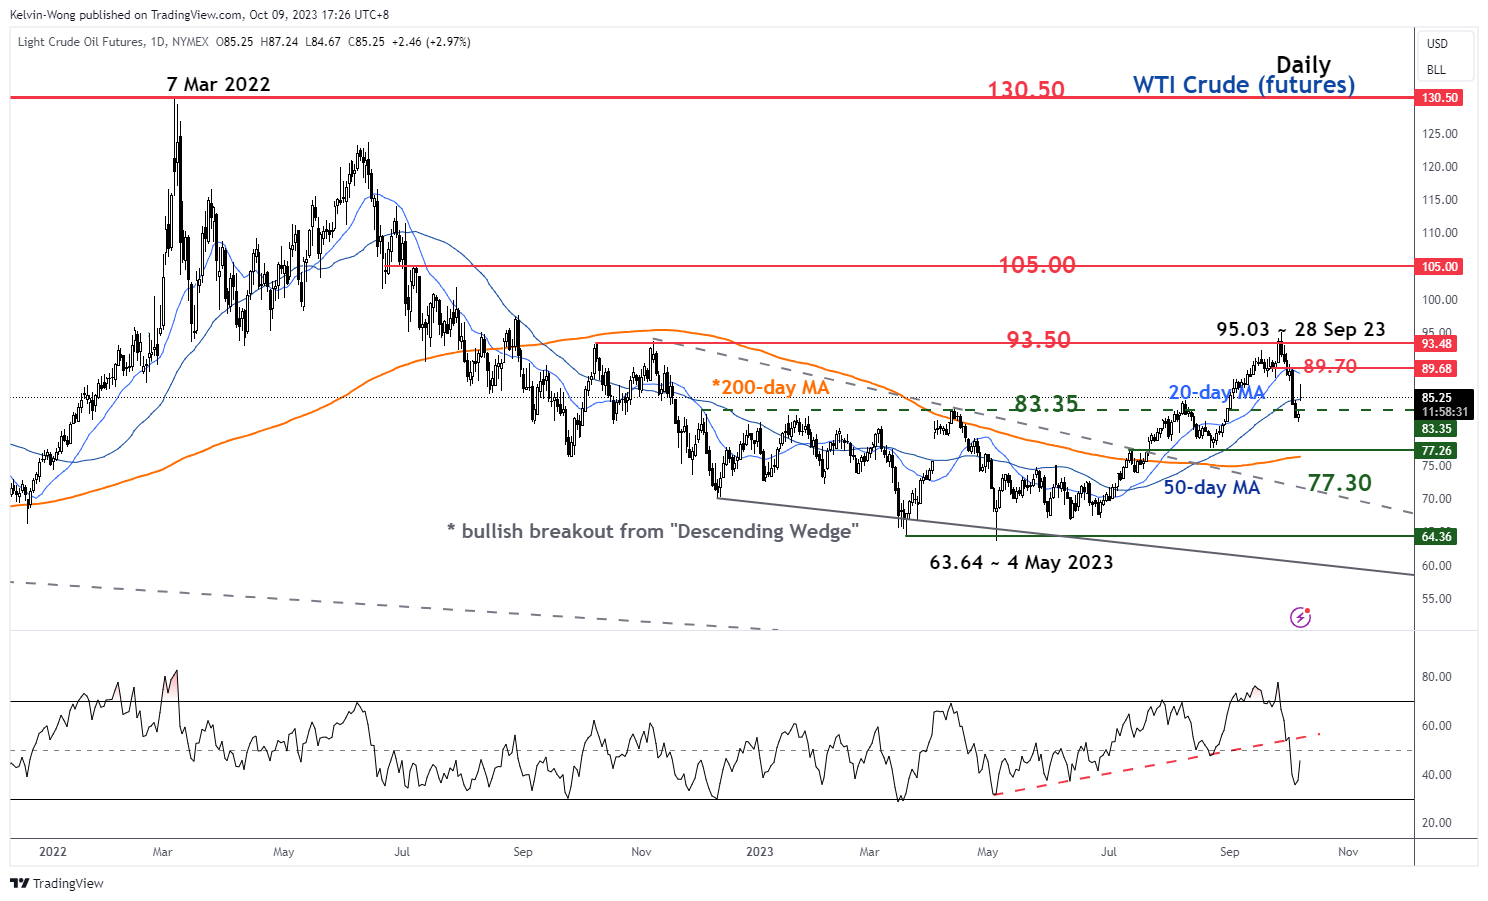
Fig 3: WTI crude oil futures medium-term trend as of 9 Oct 2023 (Source: TradingView, click to enlarge chart)
Using the daily chart of the WTI crude oil futures, the recent -12.50% decline from its 28 September 2023 high of US$95.03/barrel to 6 October 2023 low of US$81.50/barrel is likely to be a short-term downtrend movement to retrace the prior medium-term uptrend phase from 4 May 2023 low as price actions have broken and closed below the 20 and 50-day moving averages prior to the weekend’s hostilities in Israel.
In today’s Asia opening session, the WTI crude oil futures have staged a gapped up above the 50-day moving average and rallied by +5.4% to print a current intraday high of US$87.24/barrel before it trimmed some of its intraday gains to +3% and it is still trading above its “gapped up support” at US$83.35/barrel at this time of the writing.
If price actions of the WTI crude oil futures have managed to push higher and cleared above the key short-term resistance of US$89.70/barrel with a daily close above it, the odds will be skewed towards the potential start of another impulsive up movement sequence within its medium-term uptrend phase that may see a test on the US$105.00 major resistance.
Hence, how the price actions movement of WTI crude oil unfolds in the next few days and weeks is likely to have a spill-over intermarket reactionary effect on the US 10-year US Treasury yield and a further potential pain trade in risk assets such as equities may be still lingering around the corner as the implied geopolitical risk premium is likely to increase if WTI crude oil futures can stage a bullish breakout scenario above US$89.70/barrel.
WTI Oil Gaps Higher and Rises Further $2.5 as Middle-East Conflict Shakes Oil Markets
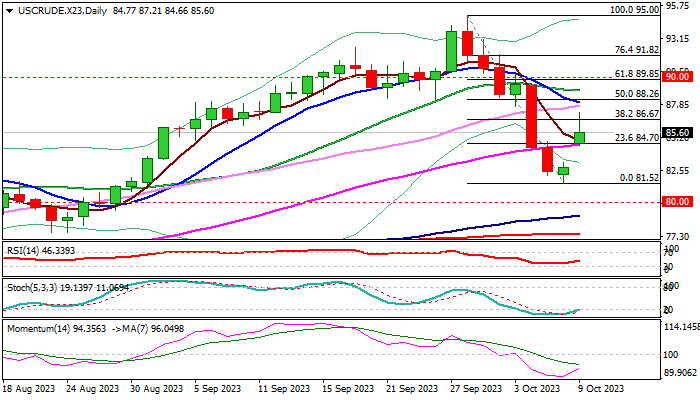
WTI oil opened with $2 gap higher on Monday and advanced further $2.5 in Asian session, as global supply concerns deepened following the latest wild clashes in the Middle East.
Fresh strength reversed so far over 38.2% of the recent $95.00/$81.52 pullback and last week’s nearly 9% drop (the biggest weekly fall since March), adding to upward prospect..
Reversal of corrective pullback occurred just above the top of rising daily cloud, which provides solid support to near-term action.
Close above cracked Fibo barrier at $86.67 (38.2% of $95.00/$81.52) is needed to boost reversal signal and expose targets at $88.26 (50% retracement) with stronger acceleration to challenge psychological $90 barrier.
On the other hand, failure to clearly break $86.67 pivot would question fresh bulls, but near-term bullish bias expected to remain in play while the action stays above broken 55DMA /Fibo 23.6% ($84.70).
Daily studies firmed (RSI / 14-d momentum are rising) though more work at the upside still needed to verify bullish signals.
The situation in the Middle East (anything that happens in this region always impacts oil markets) remains fragile, with threats of escalation which would provide additional volatility and more significantly destabilize currently unaffected supply-demand balance.
Res: 86.67; 87.21; 88.26; 88.94.
Sup: 84.70; 83.24; 81.52; 80.00.
EUR/USD: Euro Falls on Fresh Risk Aversion
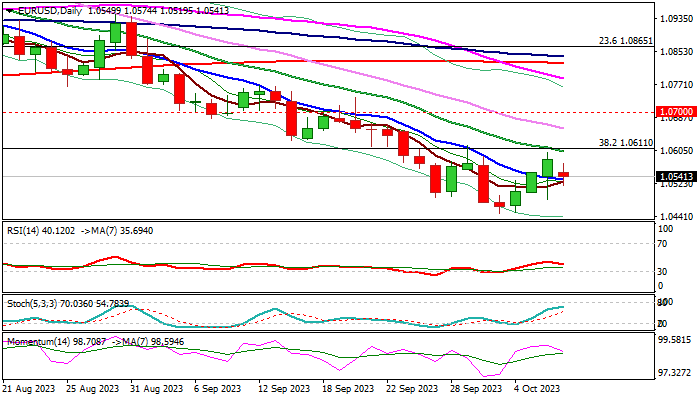
EURUSD came under pressure from fresh risk aversion as violent clashes in the Middle East boosted uncertainty, prompting investors into safety.
The pair opened with a gap lower on Monday and so far retraced slightly more than 50% of last week’s three-day recovery rally, generating initial signal of an end of corrective phase.
Fundamentals are likely to remain the main driver these days, with further weakness expected on deteriorating situation.
The single currency was also pressured by weaker than expected German Industrial production in August which contracted for the fourth consecutive month, adding to growing fears that the economy is sliding into recession.
Technical studies remain predominantly bearish on daily chart, as 14-d momentum is deeply in the negative territory and continued to head south and most of MA’s are in bearish configuration.
Larger downtrend (from 2023 peak at 1.1275) stays intact, with the latest recovery attempt to be seen as a minor correction as long as price action is capped by pivotal barrier at 1.0611 (broken Fibo 38.2% of 0.9535/1.1275 rally, now reverted to resistance and reinforced by falling 20DMA).
Today’s close below cracked 10DMA (1.0533) would add to negative signals and make the downside more vulnerable, with violation of new 2023 low (1.0448, posted on Oct 3) to risk test of next target at 1.0405 (50% retracement of 0.9535/1.1275).
Caution on repeated close above 10DMA, which would add to signals of still strong bids, but near-term price action is likely to remain in extended consolidation while limited by pivotal levels at 1.0533 and 1.0611.
Res: 1.0574; 1.0611; 1.0661; 1.0700.
Sup: 1.0519; 1.0482; 1.0448; 1.0405.
Bitcoin Joins Other Cryptos in Its Slide
Market picture
The crypto market capitalisation is down 3.2% for the week to $1.09 trillion. However, this is more of a high base effect due to a solid start to October, which quickly deflated.
Technically, bitcoin remains in an uptrend but ran into resistance at its 200-day moving average over the weekend. Having lost its ability to rally, bitcoin has returned to the general crypto market, where the major altcoins remained under pressure for most of last week. All eyes will be on BTCUSD to see if it can successfully consolidate above $28,000, the 200-day moving average. If it does, we can expect a quick rise to $29.0K-$29.3K.
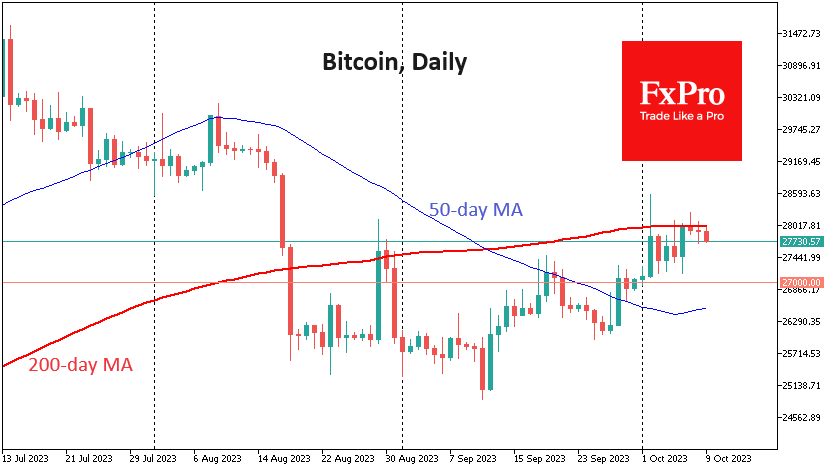
If the pressure on risk assets, including the first cryptocurrency, remains, all eyes will be on the $ 27.2K-27.0K area. Without significant support here, we could be talking about a change from a short-term trend to a downtrend.
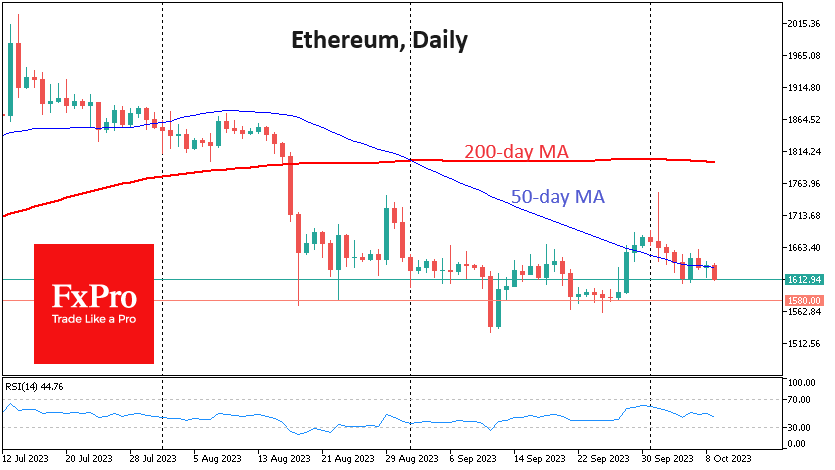
Ethereum is creeping lower, leaving the 50-day moving average as resistance. This is a bearish signal. In case the markets develop a decline, it is worth paying attention to the dynamics of the second largest cryptocurrency near $1580. A failure to hold here will open the way for a rapid decline.
News background
According to Bloomberg, the total market capitalisation of the stablecoin market fell to $123.8 billion at the end of September, the worst since 2021.
JPMorgan said Ethereum’s centralisation has increased due to the recent surge in interest in staking. The rise in validators has also resulted in lower returns for staking, while those for traditional financial assets have risen.
Binance exchange’s share of total spot trading volume fell to 34.3 per cent in September. The figure fell for the seventh consecutive month. The decline was fuelled by the termination of the stock with zero trading fees for popular pairs, coupled with concerns over regulatory scrutiny.
The US government is waging a war against the crypto industry and trying to take control of Bitcoin, said OpenAI head and Worldcoin co-founder Sam Altman.
US election race participant Robert Francis Kennedy Jr. announced his intention to protect the first cryptocurrency if elected president. He says, “freedom of transaction is as important as freedom of speech.”
Arthur Hayes, the former CEO of crypto exchange BitMEX, said that by 2026, the price of the first cryptocurrency will reach $750K to $1 million. He justified his forecast with the limited issuance of the asset, the prospect of approval of spot bitcoin-ETFs and geopolitical uncertainty.
ECB’s de Guindos urges caution on oil prices amid enormous geopolitical uncertainties
ECB Vice-President Luis de Guindos highlighting the "enormous uncertainty" that geopolitical tensions are injecting into the financial markets and the broader economy, in light of the heightened conflicts between Israeli and Hamas forces in Gaza.
"The macroeconomic environment is subject to enormous uncertainty." He further stressed the heightened unpredictability by noting, "Nobody knows what is going to happen in the future," particularly in light of the recent events over the weekend.
De Guindos still anticipates a downturn in both headline and core inflation. However, he urged stakeholders to remain vigilant. His concerns stemmed mainly from "the evolution of oil prices, the depreciation of the euro and the evolution of unit labor costs".
Eurozone Sentix fell to -21.9, current situation hits rock bottom in a year
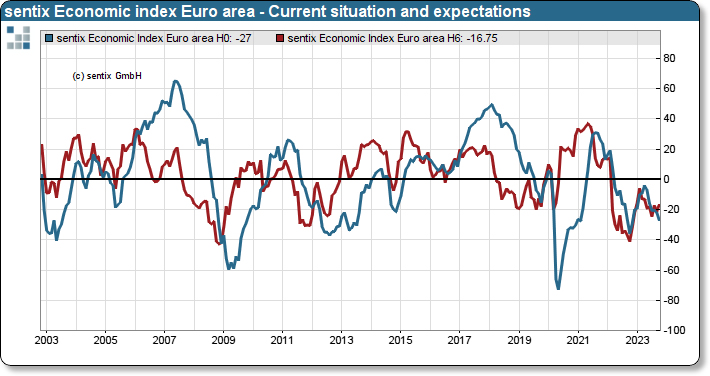
Investor confidence in Eurozone appears to be staying on shaky ground, as evidenced by the dip in Sentix Investor Confidence from -21.5 to -21.9 for October. While this decline was milder than the anticipated drop to -24.0, it still casts a shadow on the economic climate of the region.
The more granular aspects of the report offer a mixed picture. Current Situation Index slipped from -22.0 to a low of -28.0, a trough not seen since November 2022. Conversely, Expectations Index, which forecasts sentiments for the coming six months, exhibited a rally, climbing from -21.0 to -16.8, marking its zenith since April.
Sentix noted, "The economic situation in the Eurozone remains difficult." While the uptick in Expectations Index could provide a glimmer of hope, Sentix tempers this optimism by clarifying that it "does not yet indicate a turnaround." Instead, it might simply imply a slowing down in the waning momentum.
Additionally, Sentix noted investors perceive ECB as somewhat hamstrung in its ability to intervene. The bank's typical proactive stance in assisting a faltering economy is "not yet discernible."
Shifting focus to Germany, the data presents a narrative akin to Eurozone. The Overall Investor Confidence experienced a minor lift, moving from -33.1 to -31.1. Yet, this was counterbalanced by Current Situation Index, which not only fell from -38.3 to -39.5 but also reached its nadir since July 2020. On a positive note, Expectations Index saw a boost, rising from -27.8 to -22.3.
Gold Trades Higher But Not Yet Ready for a Full Reversal
- Gold jumps higher on the back of geopolitical risks
- This is the first reaction from the bulls after the strong sell-off
- Upleg could have legs if momentum indicators align
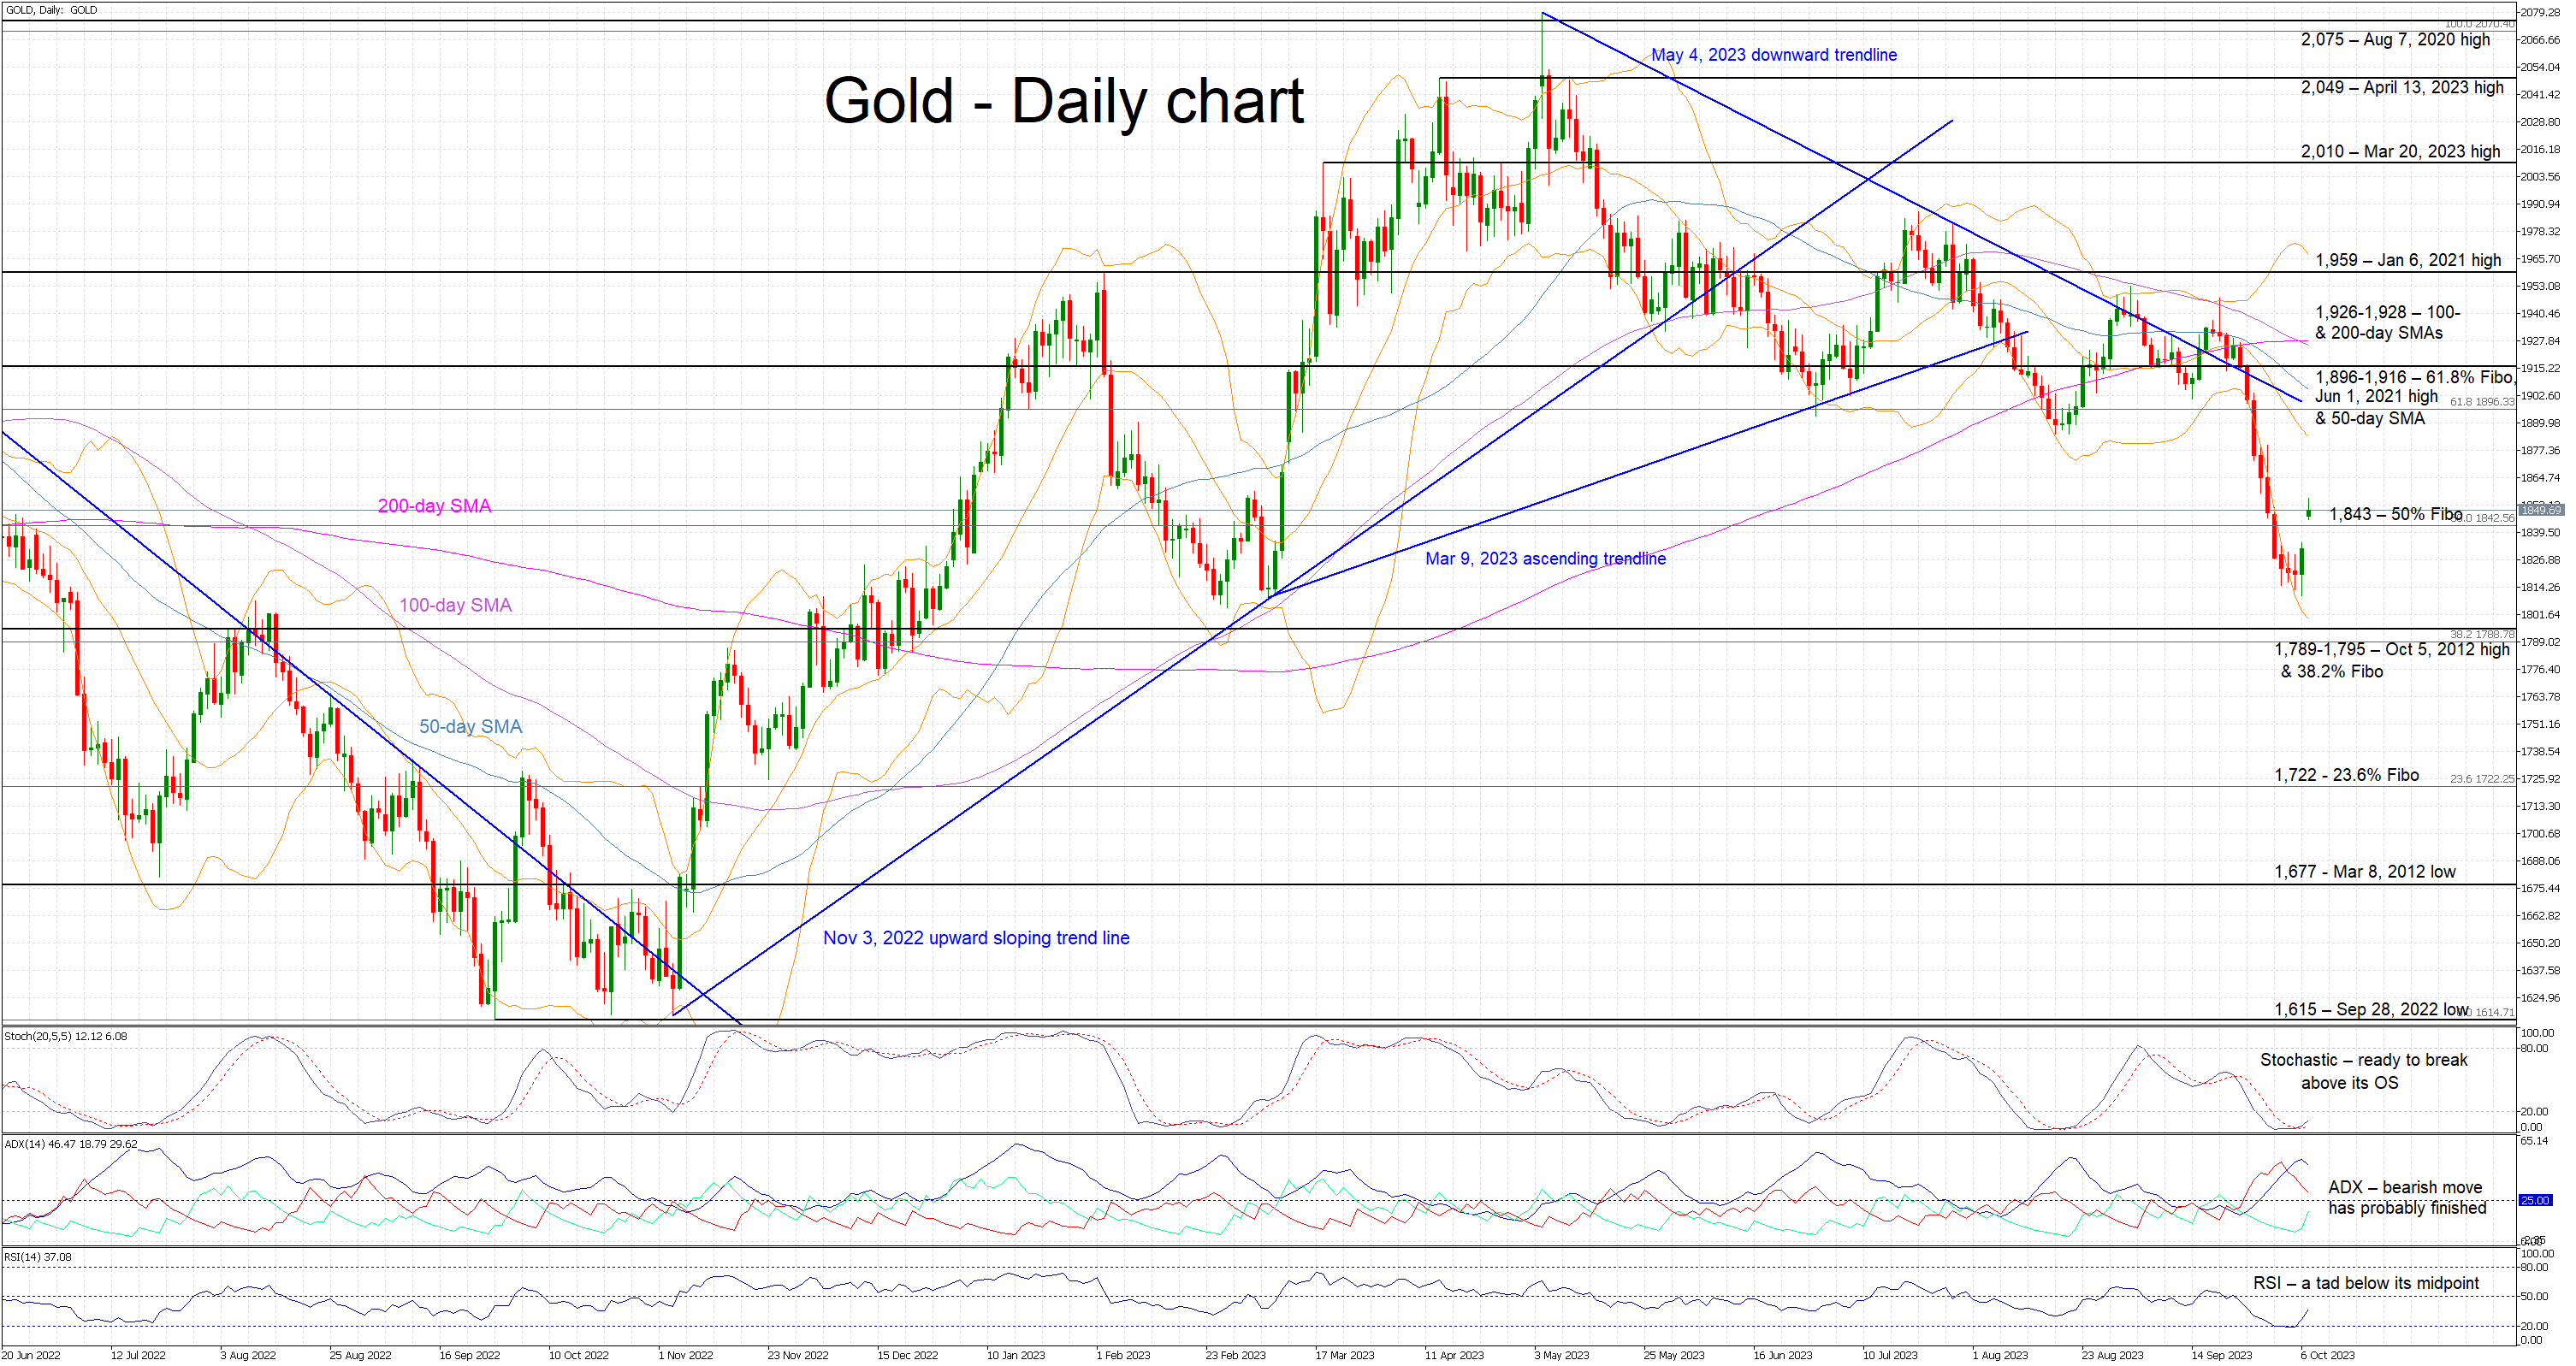
Gold is trading higher today as the bulls are trying to recover part of the significant losses incurred during the nine consecutive red candles that pushed gold from the mid-1,900s down to 1,800. The bulls’ ability to continue this upleg is critical for the short-term outlook of gold.
In the meantime, the momentum indicators are not yet fully endorsing the current move higher. The RSI is rising towards its midpoint again, confirming the weaker bearish tendency in the market. Similarly, the Average Directional Movement Index (ADX) has probably peaked and is edging lower; an indication that the recent downleg has probably ended for now. More importantly, the stochastic oscillator has crossed above its moving average (MA) and it is preparing to jump above its oversold territory. If this takes place, it could be seen as a strong bullish signal.
Should the bears regain market control, they would quickly try to break the 50% Fibonacci retracement of March 8, 2022 – September 28, 2022 downtrend at 1,843. They could then try to push gold towards the 1,789-1,795 area, which is populated by the October 5, 2012 high and the 38.2% Fibonacci retracement. This is a key area for medium-term sentiment and the bears could also be given the chance to record a new 2023 low.
On the other hand, the bulls are probably keen on building upon the current reaction. They could try to stage a move towards the busy 1,896-1,916 range that is defined by the Jun 1, 2021 high, the 61.8% Fibonacci retracement, the 50-day simple moving average (SMA) and the May 4, 2023 descending trendline respectively. Overcoming this range appears to be a very difficult task for the bulls but if successful, it will open the door for a stronger rally.
To sum up, gold bulls have found the necessary strength to react after a sizeable downleg, but for the current rally to continue they need to draw strong support from the momentum indicators.
XAU/USD: Gold Surges as Violent Clashes in Middle East Spark Strong Safe-haven Demand
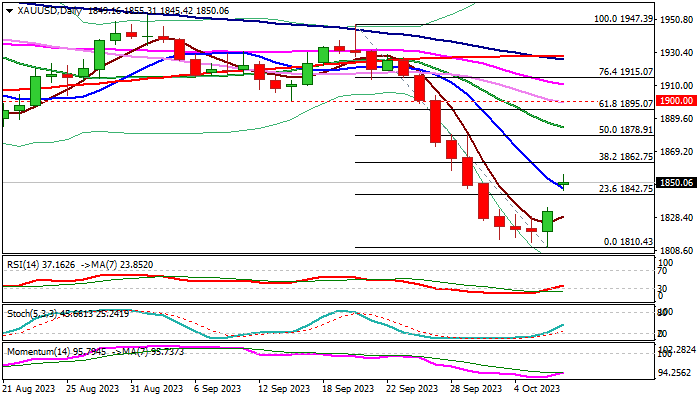
Gold opened with a gap higher, starting trading on Monday at $1850 zone, after closing on Friday at $1832.
Growing uncertainty over spiraling violence in the Middle East prompted traders into safer assets and strongly boosted demand for safe haven gold at the start of the week.
Technical picture on daily chart improved, as Friday’s positive close marked the first bullish day after nine consecutive days of losses.
Initial positive signal was generated by completion of bullish engulfing pattern on Friday, boosted by a false break below the base of weekly Ichimoku cloud, as well as bear-trap under 200WMA.
Daily RSI reversed from oversold zone and 14-momentum is heading north (though still deeply in the negative territory), supporting the action.
Fresh rise broke above 10DMA ($1846) but needs to register daily close above here to verify initial signal and expose upper pivot at $1862 (Fibo 38.2% of $1947/$1810), break of which to generate reversal signal and open way for further advance.
Near-term action is going to be highly dependent on the news and further escalation of the conflict would add support to gold price.
Caution on return and close below broken Fibo level at $1842 (23.6% of $1947/$1810), while deeper fall and filling today’s gap would signal that recovery phase might be over.
Res: 1855; 1862; 1878; 1884.
Sup: 1846; 1843; 1832; 1823.
AUD/USD Can be Searching for Support
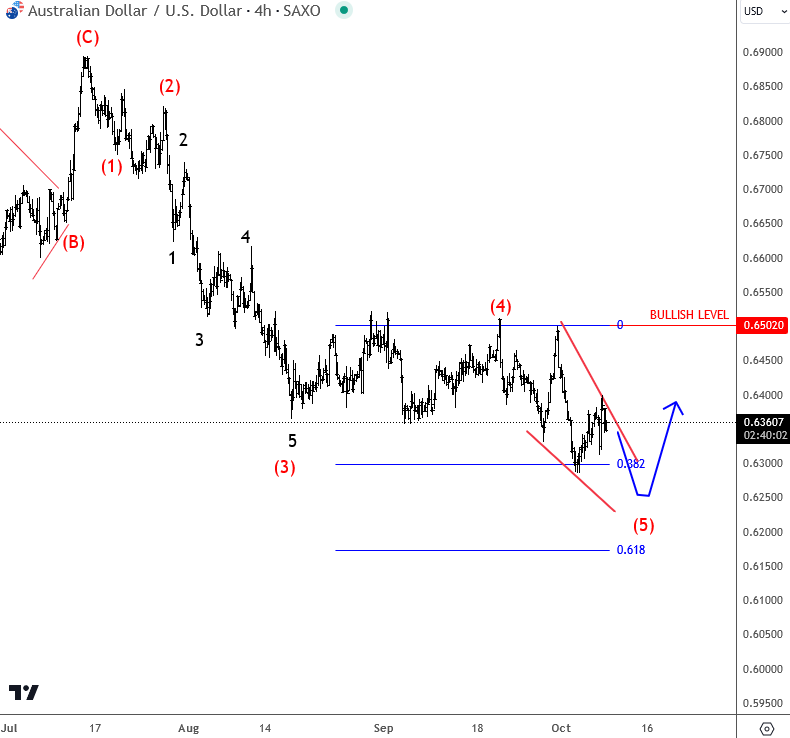
Aussie with ticker AUDUSD has been bearish since start of the year, with a higher degree A-B-C decline that can be coming into some important support at the 78.6% Fib level. In fact, notice that wave (C) down on 4h chart can still be counted in five waves with a current drop to a new low, with price now testing 38.2% Fib. Deeper support for this final leg down is at 61.8%, near 0.6170. So sooner or later, pair can start bottoming, maybe even with an ending diagonal, but for a change in trend, we will need an impulse back above 0.65 bullish level.
USD Momentum for Now Doesn’t Look that Convincing
Markets
September US payrolls confirmed that demand for labour remains much stronger than what is needed for inflation to sustainably return to the Fed’s target anytime soon. The US economy added another 336k jobs (170k expected) driven by a 234k rise in the private service sector jobs. Job growth for the previous two months was also raised by a combined 119k. Data from the Household Survey were less spectacular, with the jobless rate holding at 3.8%. Average hourly earnings even printed on the softer side of expectations at 0.2% M/M and 4.2% Y/Y (4.3% expected). Yields initially jumped sharply higher on the outsized payrolls beat. US 10 & 30‐y yields even briefly touched new intraday cycle peak levels at 4.88% and 5.05%. However, it was one step too far to force a sustained break going into the long US weekend. US yields closed well off the intraday top levels closing 6.3 bps (2‐y) to 8.25 bps (10‐y) higher. The US 10‐y real yield closed at a new cycle top of 2.483%. First Fed comments evidently kept the door open for an additional hike at the November 01 meeting. Fed Mester reiterated a balanced, data‐dependent approach. Fed Bowman outright indicated that higher rates are needed. German yields also briefly jumped higher post‐payrolls but in the end decoupled and closed with changes of less than 1 bp across the curve. A bit surprising: US equities ignored the rise in (real) yields and gained up to 1.6% (Nasdaq). Maybe softer wage data gave some comfort. The combination of higher equites and at the same time a higher US real yield provided conflicting input for the USD dollar. EUR/USD briefly spiked below 1.05, but reversed intraday losses soon to even close in positive territory (1.0586) despite a widening interest rate differential. Brent oil closed little changed at $84.6/b.
Markets try to assess the impact of rising geopolitical tensions after the Hamas attack on Israel this weekend. However, with Japan, Korea and US markets closed, it’s difficult to assess the markets’ reaction function. China reopens after the Golden week holidays with modest losses. US Treasury futures are gaining modestly as does the dollar (DXY 106.34, USD/JPY 149.21 & EUR/USD 1.056). Brent oil jumped higher this morning but at $87.5 already trades off the earlier top. The eco calendar is almost empty except for some Fed and ECB speakers. Looking at the equity futures, a (modest) risk‐off open in Europe is likely which might trigger some consolidation/correction on recent bond sell‐off. USD momentum for now doesn’t look that convincing. A break below the 1.045 short‐term low apparently isn’t that easy. Later this week the focus is on the Minutes of the Fed September meeting (Wednesday) and the US CPI release (Thursday; 0.3% M/M expected both for core and headline). Also keep an eye at the US Treasury selling 3‐,10‐ & 30‐y bonds as US yields are holding close to the cycle peak levels.
News and views
German Chancellor Scholz’s ruling coalition suffered another defeat in state elections. All members of the SPDGreens‐ FDP triangle lost votes, with conservative opposition parties (CDU/CSU) easily clinging on to power. In Bavaria, the CSU got 37% of the vote (‐0.2%) compared to 16% for the Greens (‐1.6%), 8.5% for SPD (‐1.2%) and 3% for FDP (‐2.1%). The current regional coalition between CSU and the conservative Freie Wähler (14.4%) will likely be prolonged. In Hessen, the CDU accumulated 35.5% (+8.5%) compared to 16% for SPD (‐3.8%), 15.5% for the Greens (‐ 4.3%) and 5% for FDP (‐2.5%). The current regional link‐up between CDU and Greens can be extended as well. Remarkably, the extreme‐right AfD which has its stronghold mainly in former communist eastern German states, managed to increase its influence with best results to‐date in western states: 16% of the vote in Hessen (+2.9%) and 14% in Bavaria (+4.8%).
Total US consumer credit decreased by $15.6bn in August, the most in three years. The sudden slump is related to a record drop in non‐revolving credit related (‐$30.3bn) to student loan forgiveness by the Biden administration. Outstanding revolving credit, including credit cards, rose by $14.7bn, the most since November. The average annual interest rate that consumers are paying on credit card balances hit a record high of 22.8% at the end of August, up from 16.3% a year ago.