Sample Category Title
Technical Outlook and Review
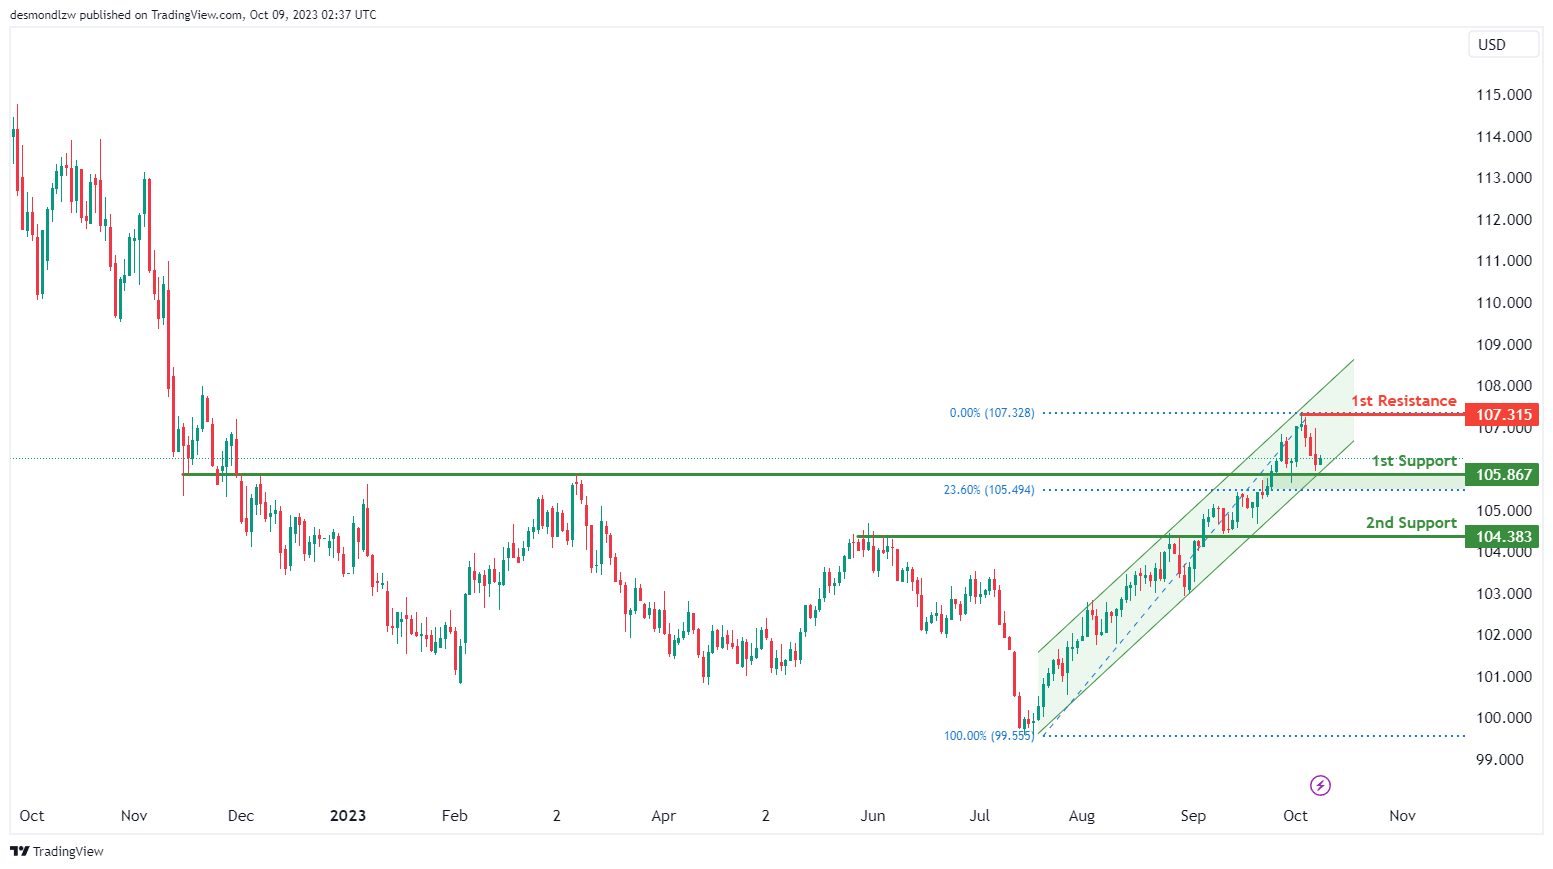
DXY:
The DXY (US Dollar Index) chart currently maintains an overall bullish momentum with a potential for price to bounce off the 1st support level and the lower channel line of the bullish ascending channel to make a bullish continuation towards the 1st resistance level.
The 1st resistance level at 107.13 is identified as a multi-swing high resistance, indicating its potential role as a barrier to upward movements.
To the downside, the 1st support level at 105.87 is identified as an overlap support that aligns with the 23.60% Fibonacci retracement level. Additionally, the 2nd support level at 104.38 is also noted as an overlap support, further reinforcing its significance as a potential area where price could find support.
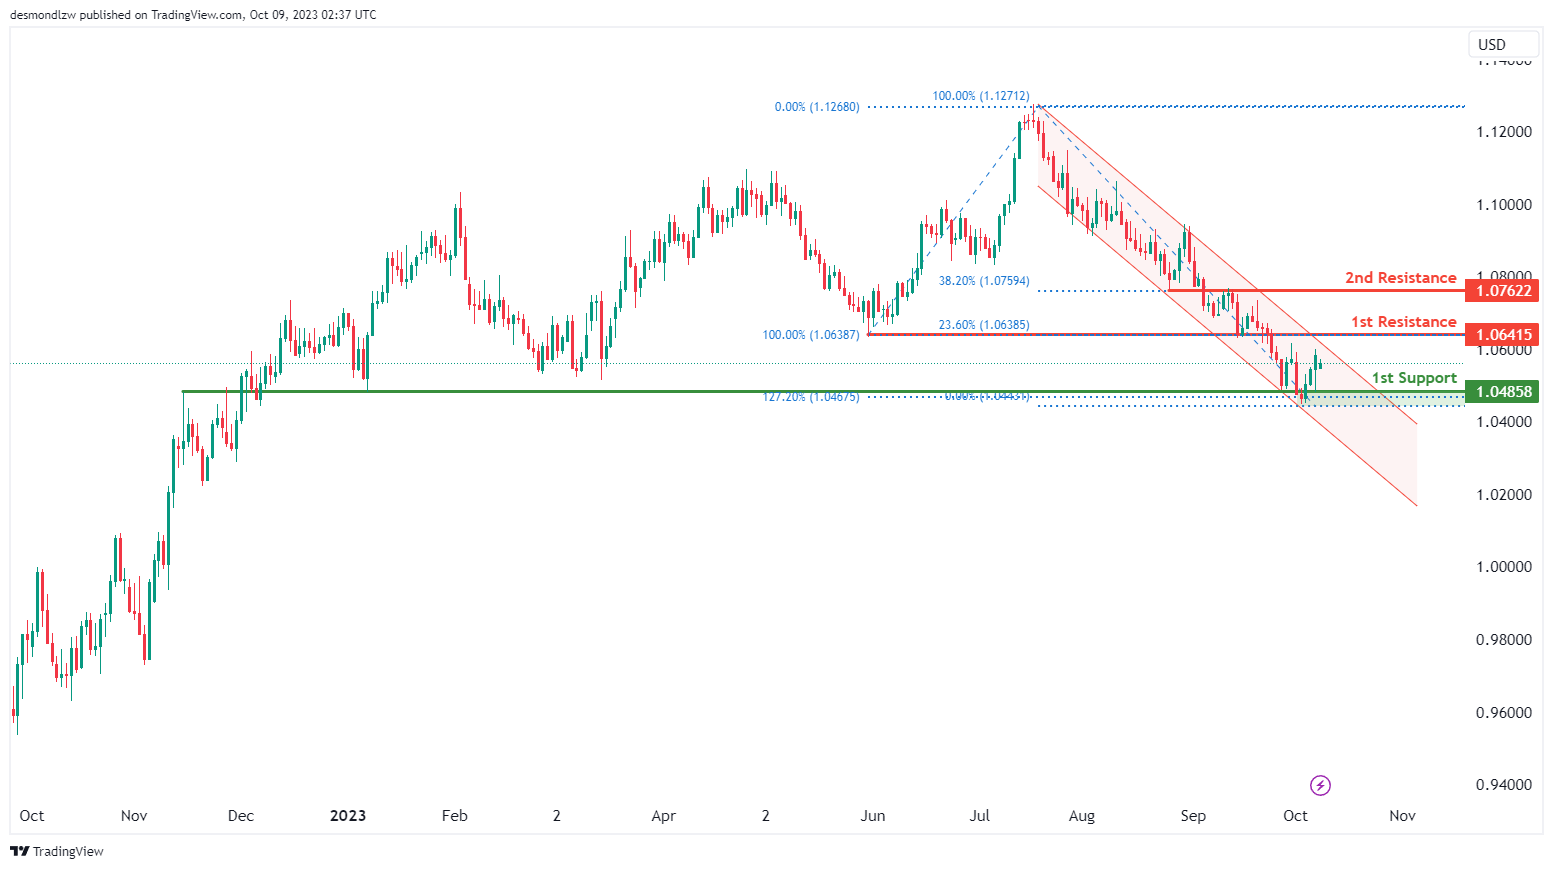
EUR/USD:
The EUR/USD chart currently maintains an overall bearish momentum with a potential for price to make a bearish continuation towards the 1st support level.
The 1st support level at 1.0486 is identified as an overlap support that aligns with the 127.20% Fibonacci extension level, making it an important level for potential price support.
To the upside, the 1st resistance level at 1.0642 is identified as a pullback resistance that aligns with the 23.60% Fibonacci retracement level. Additionally, the 2nd resistance level at 1.0762 is noted as an overlap resistance that aligns with the 38.20% Fibonacci retracement level, suggesting it may act as a barrier to upward movements.
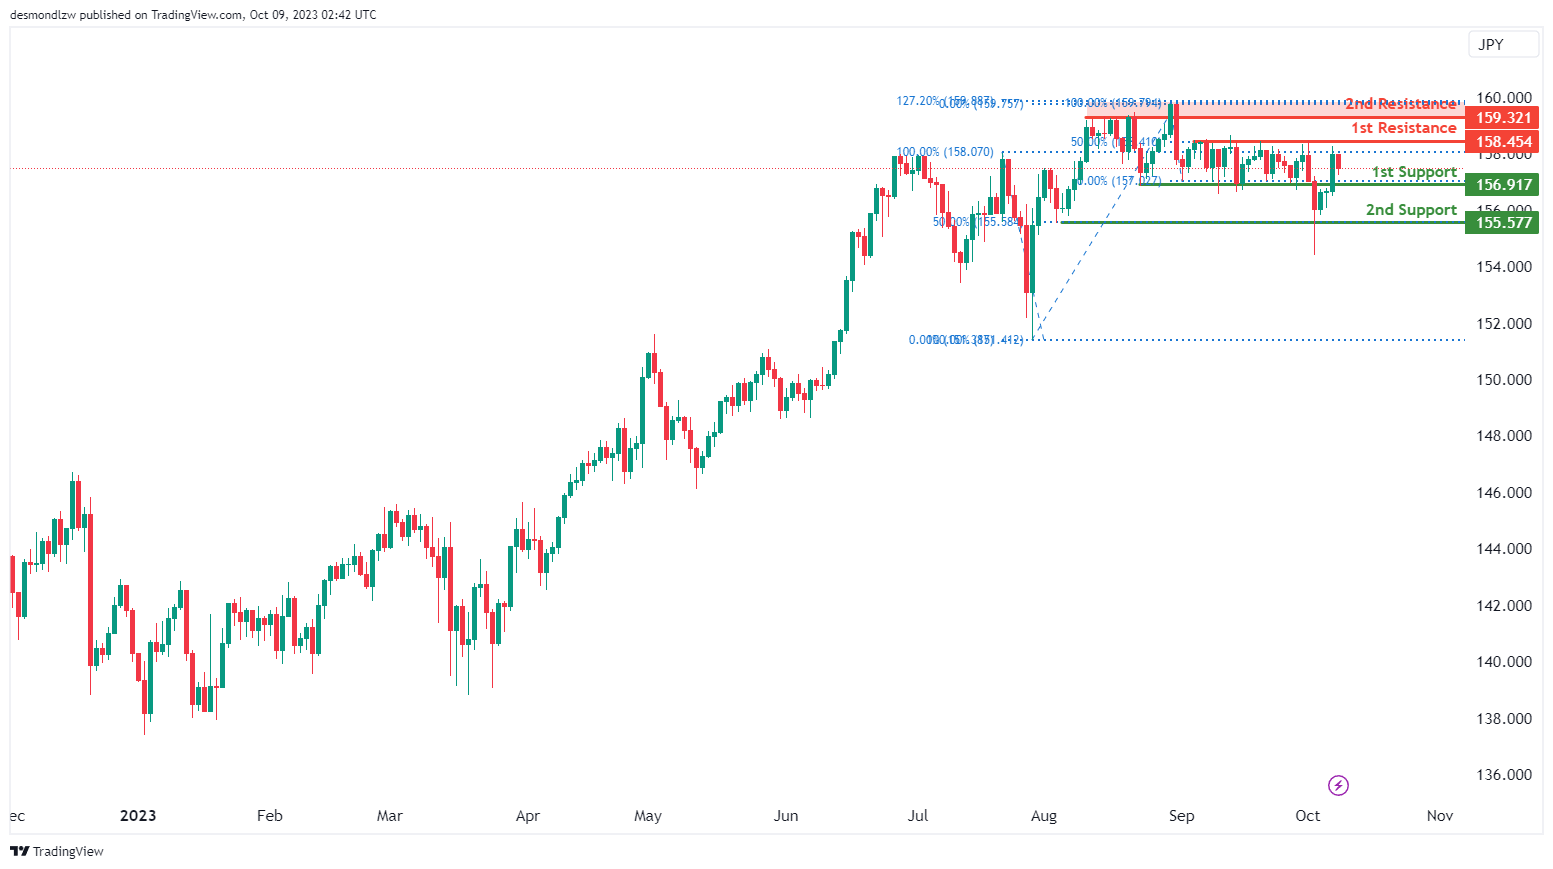
EUR/JPY:
The EUR/JPY chart currently exhibits a neutral momentum, suggesting the potential scenario for price to fluctuate between the 1st resistance level and the 1st support level.
The 1st support level at 156.92 is identified as a pullback support. Additionally, the 2nd support level at 155.58 is also noted as a pullback support that aligns with the 50.00% Fibonacci retracement level, further reinforcing its importance as a potential level for price rebounds.
To the upside, the 1st resistance level at 158.45 is identified as a pullback resistance that aligns with the 50.00% Fibonacci retracement level. Beyond this, the 2nd resistance level at 159.32 is noted as a pullback resistance that aligns close to the 127.20% Fibonacci extension level, adding to its significance as a potential area where selling pressure may emerge.
EUR/GBP:
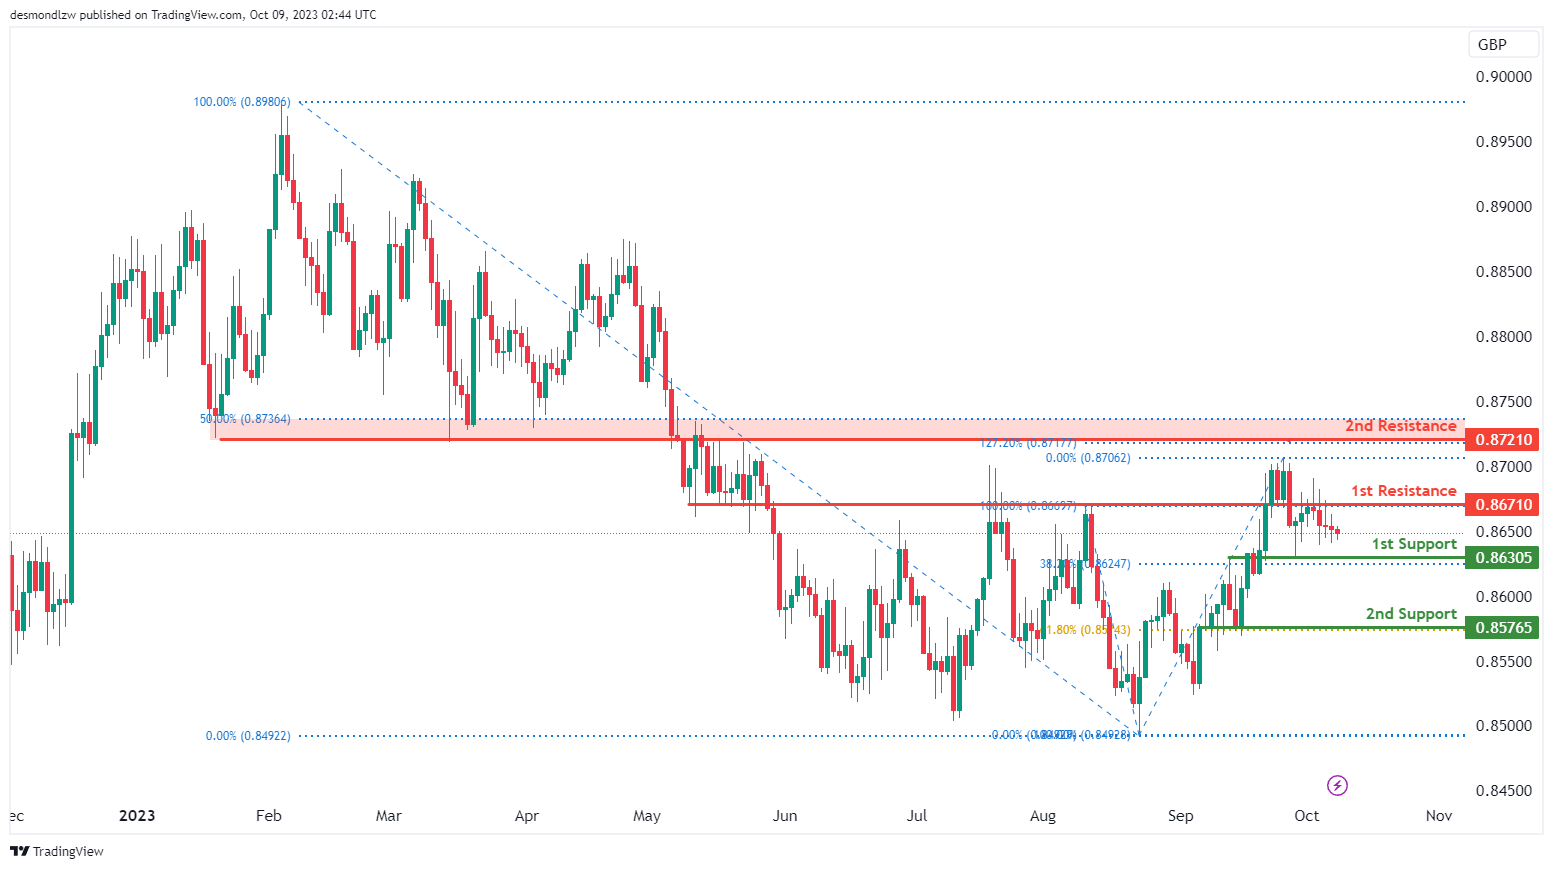
The EUR/GBP chart currently displays a neutral momentum, suggesting the potential scenario for price to fluctuate between the 1st resistance level and the 1st support level.
The 1st support level at 0.8631 is identified as an overlap support that aligns with the 38.20% Fibonacci retracement level. Additionally, the 2nd support level at 0.8577 is noted as a pullback support that aligns with the 61.80% Fibonacci retracement level.
To the upside, the 1st resistance level at 0.8671 is identified as an overlap resistance. Beyond this, the 2nd resistance level at 0.8721 is also noted as an overlap resistance that aligns with the 127.20% Fibonacci extension level, suggesting it may act as a barrier to upward movements.
GBP/USD:
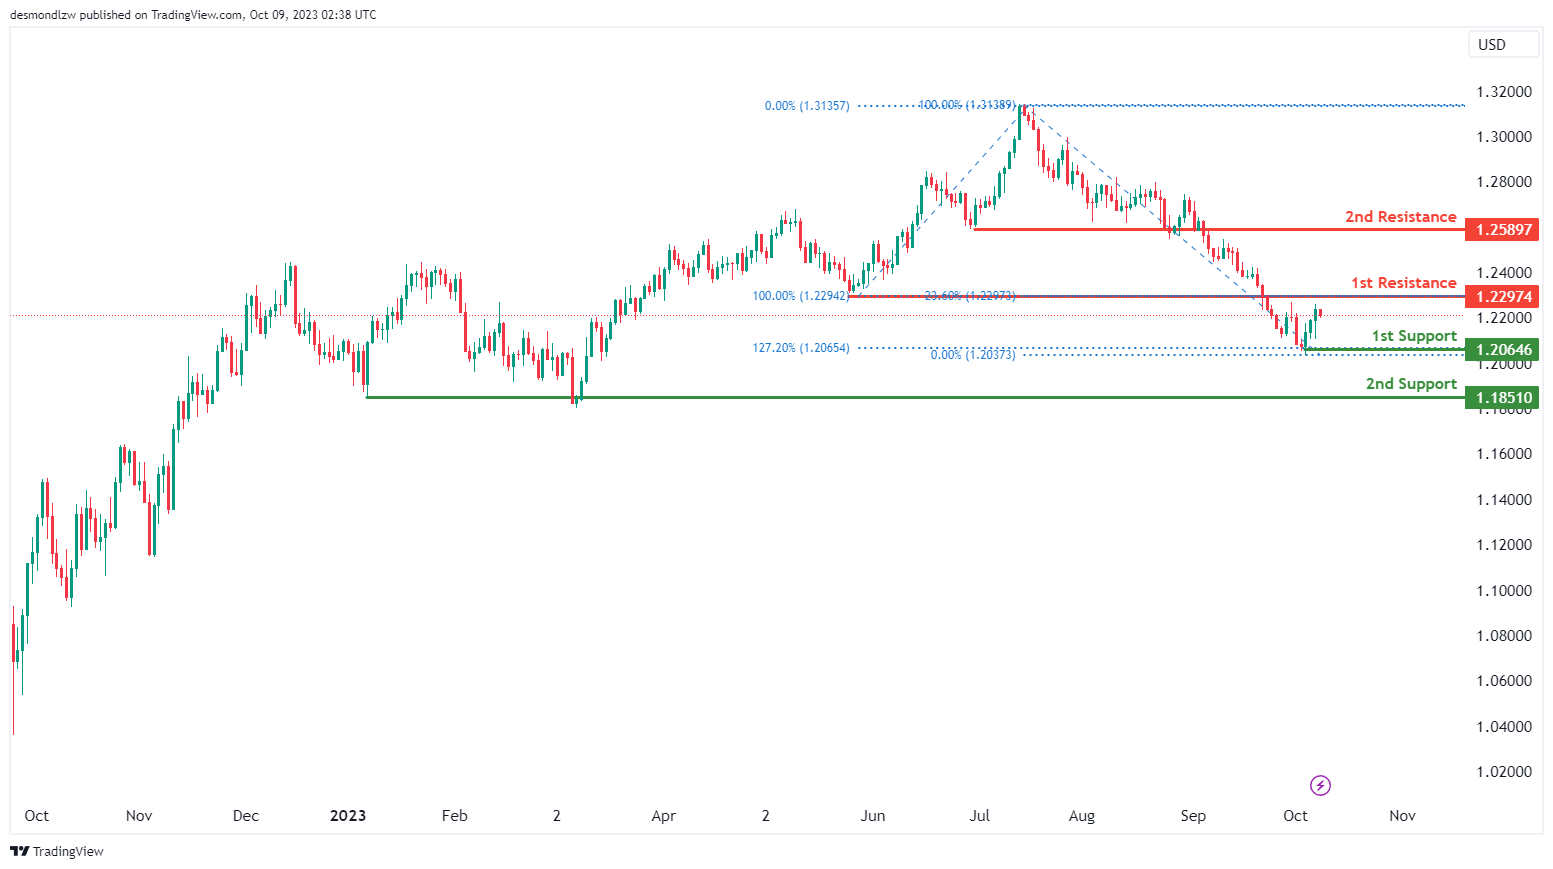
The GBP/USD chart currently exhibits an overall bearish momentum with a potential for price to make a bearish continuation towards the 1st support level.
The 1st support level at 1.2065 is identified as a swing-low support that aligns with the 127.20% Fibonacci extension level. Additionally, the 2nd support level at 1.1851 is noted as a pullback support, further reinforcing its significance as a potential area where price could find support.
To the upside, the 1st resistance level at 1.2297 is identified as a pullback resistance that aligns with the 23.60% Fibonacci retracement level. Beyond this, the 2nd resistance level at 1.2589 is also noted as a pullback resistance, suggesting it may act as a barrier to upward movements.
GBP/JPY:
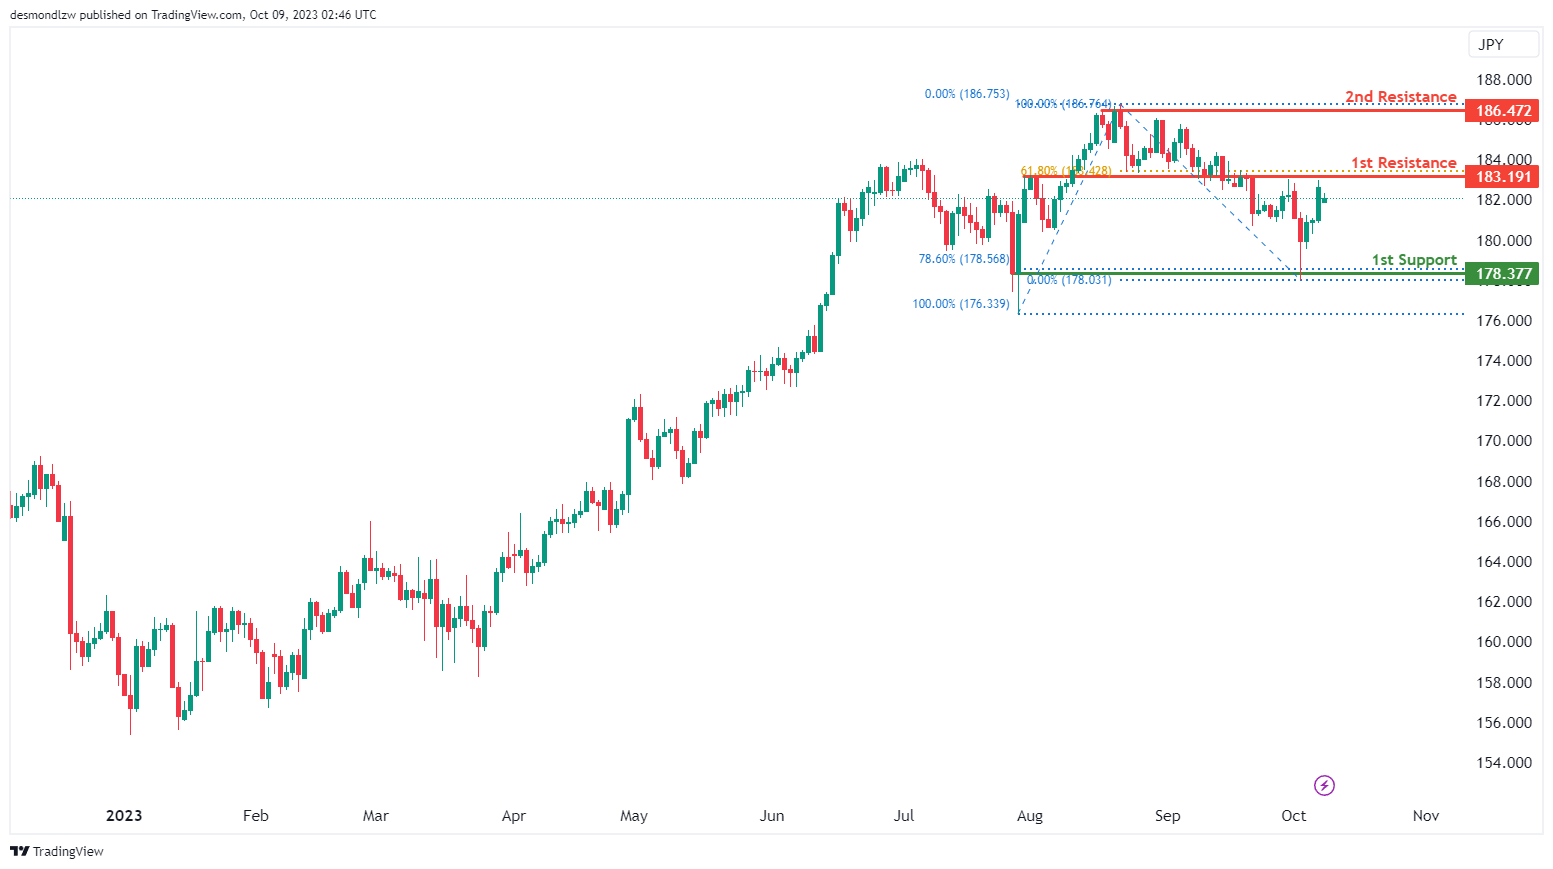
The GBP/JPY chart currently exhibits a bearish overall momentum, suggesting the potential scenario of a bearish reaction off the 1st resistance level with a subsequent drop towards the 1st support.
The 1st support level at 178.38 is identified as a pullback support that aligns with the 78.60% Fibonacci retracement level.
To the upside, the 1st resistance level at 183.19 is identified as an overlap resistance that aligns with the 61.80% Fibonacci retracement level. Beyond this, the 2nd resistance level at 186.47 is noted as a pullback resistance, indicating a potential area where price might encounter selling pressure.
USD/CHF:
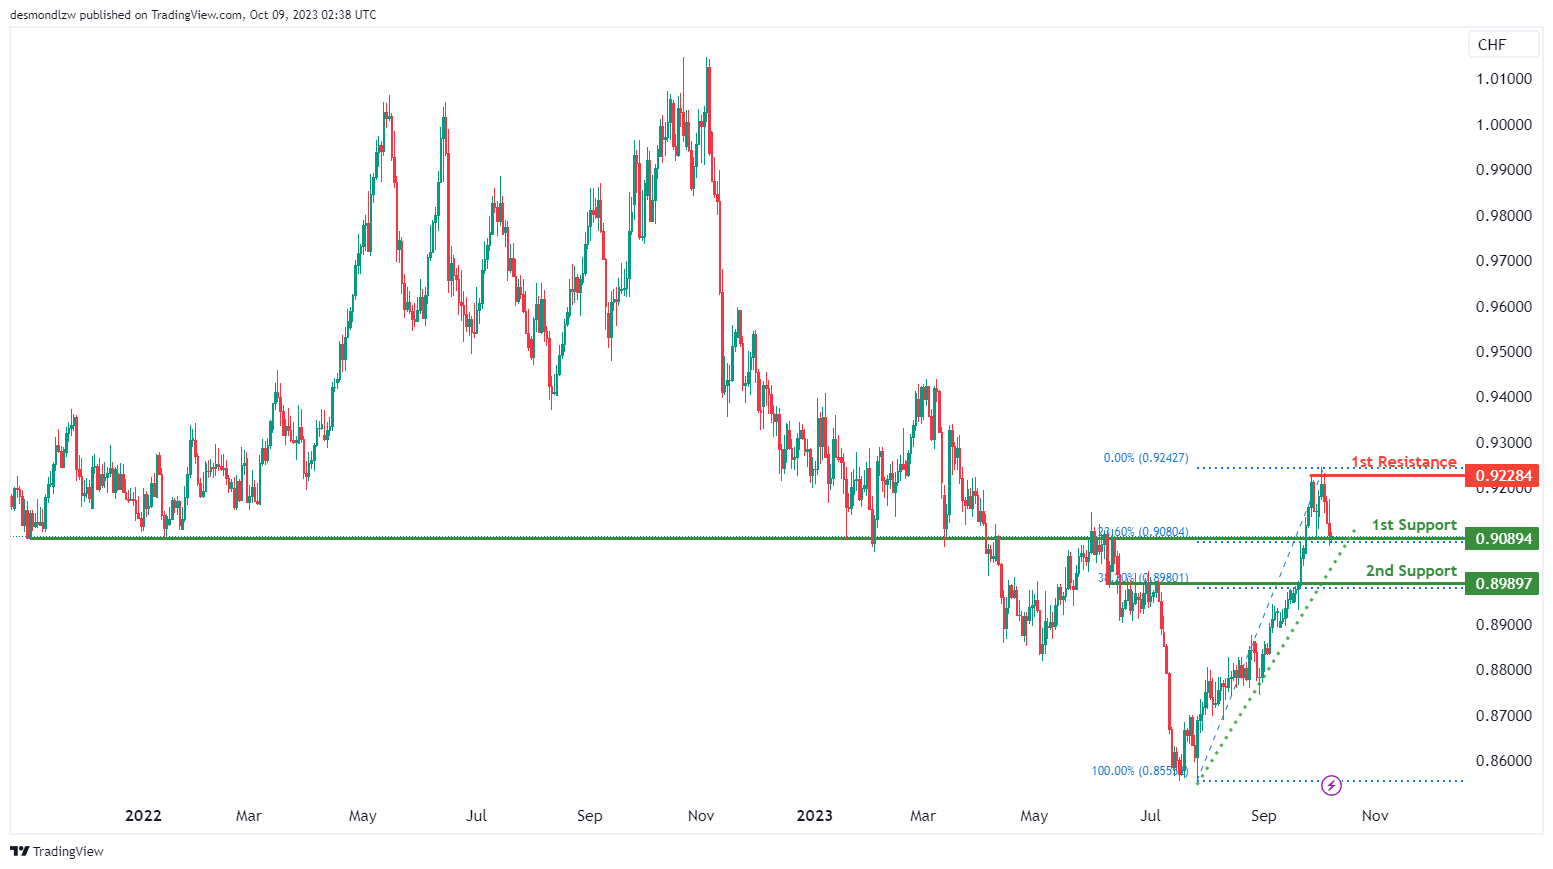
The USD/CHF chart currently maintains an overall bullish momentum with a potential for price to bounce off the 1st support level to make a bullish continuation towards the 1st resistance level.
The 1st resistance level at 0.9228 is identified as a multi-swing-high resistance, acting as a potential barrier to further price increases.
The 1st support level at 0.9089 is identified as an overlap support that aligns with the 23.60% Fibonacci retracement level. Additionally, the 2nd support level at 0.8989 is also noted as an overlap support that aligns with the 38.20% Fibonacci retracement level, further reinforcing its significance as an area where the price may find support.
USD/JPY:
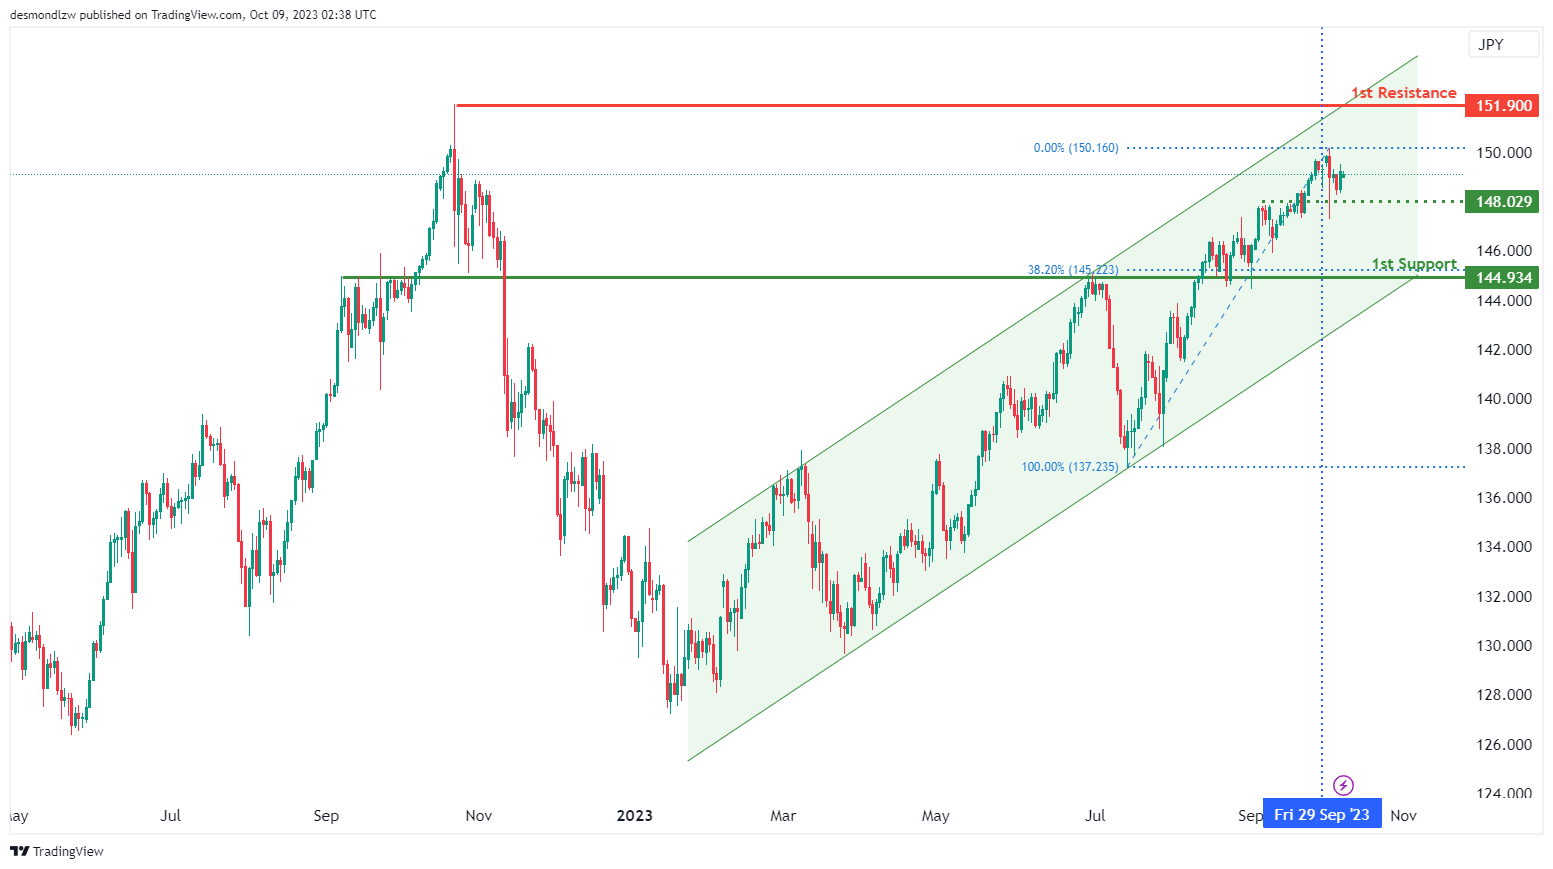
The USD/JPY chart currently exhibits an overall bullish momentum with a potential for price to make a bullish continuation towards the 1st resistance level.
The 1st resistance level at 151.90 is identified as a swing-high resistance, acting as a potential barrier to further price increases.
To the downside, the intermediate support level at 148.03 is identified as an overlap support while the 1st support level at 144.93 is also noted as an overlap support that aligns with the 38.20% Fibonacci retracement level, further reinforcing its significance as an area where the price may find support.
USD/CAD:
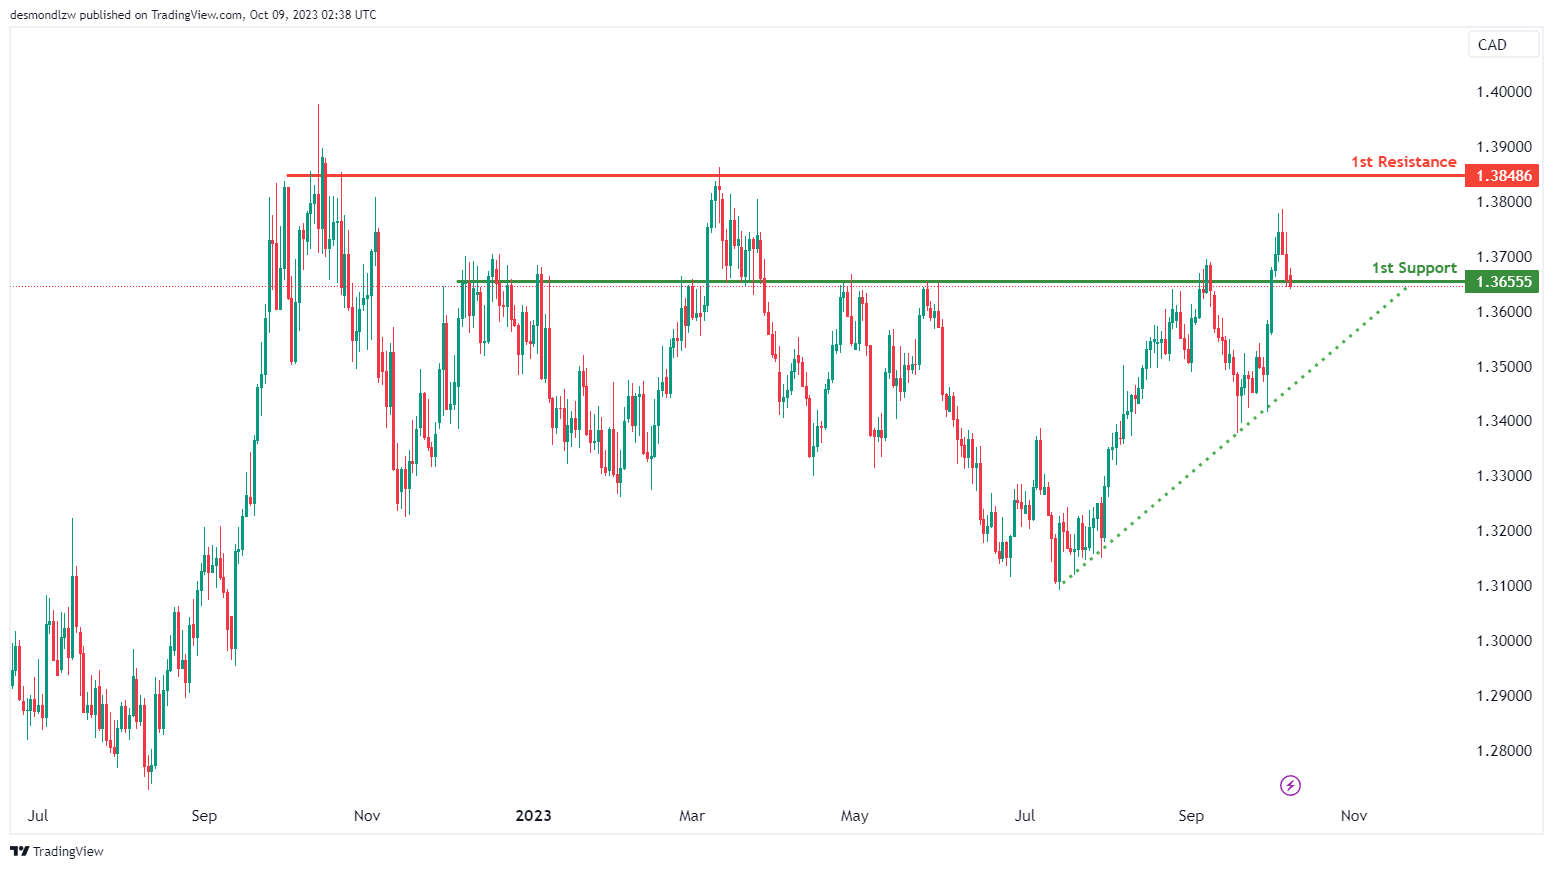
The USD/CAD chart is currently showing an overall bearish momentum suggesting the possibility of a bearish continuation towards the 1st support level.
The 1st support level at 1.3656 is identified as an overlap support. Should price break below the 1st support, it could potentially trigger a move towards the ascending trendline.
To the upside, the 1st resistance level at 1.3849 is identified as a pullback resistance, further emphasizing its significance as a barrier for future price increases.
AUD/USD:
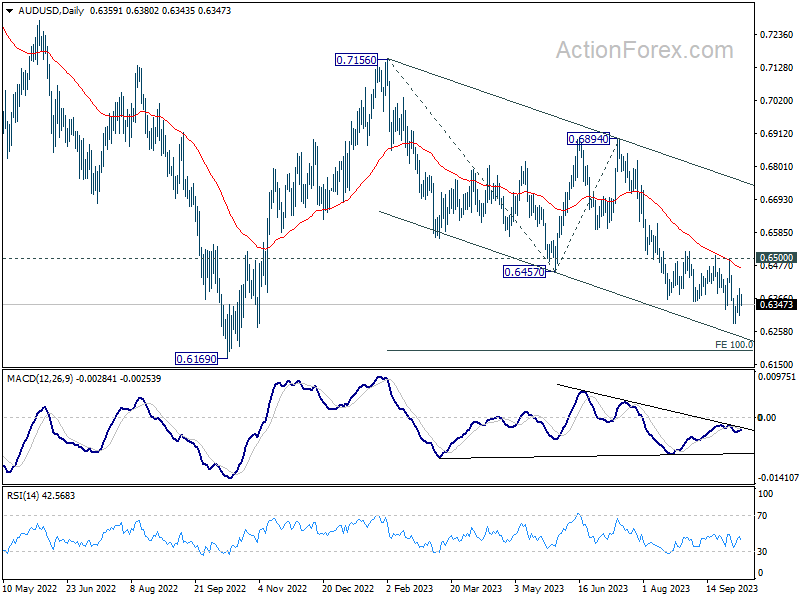
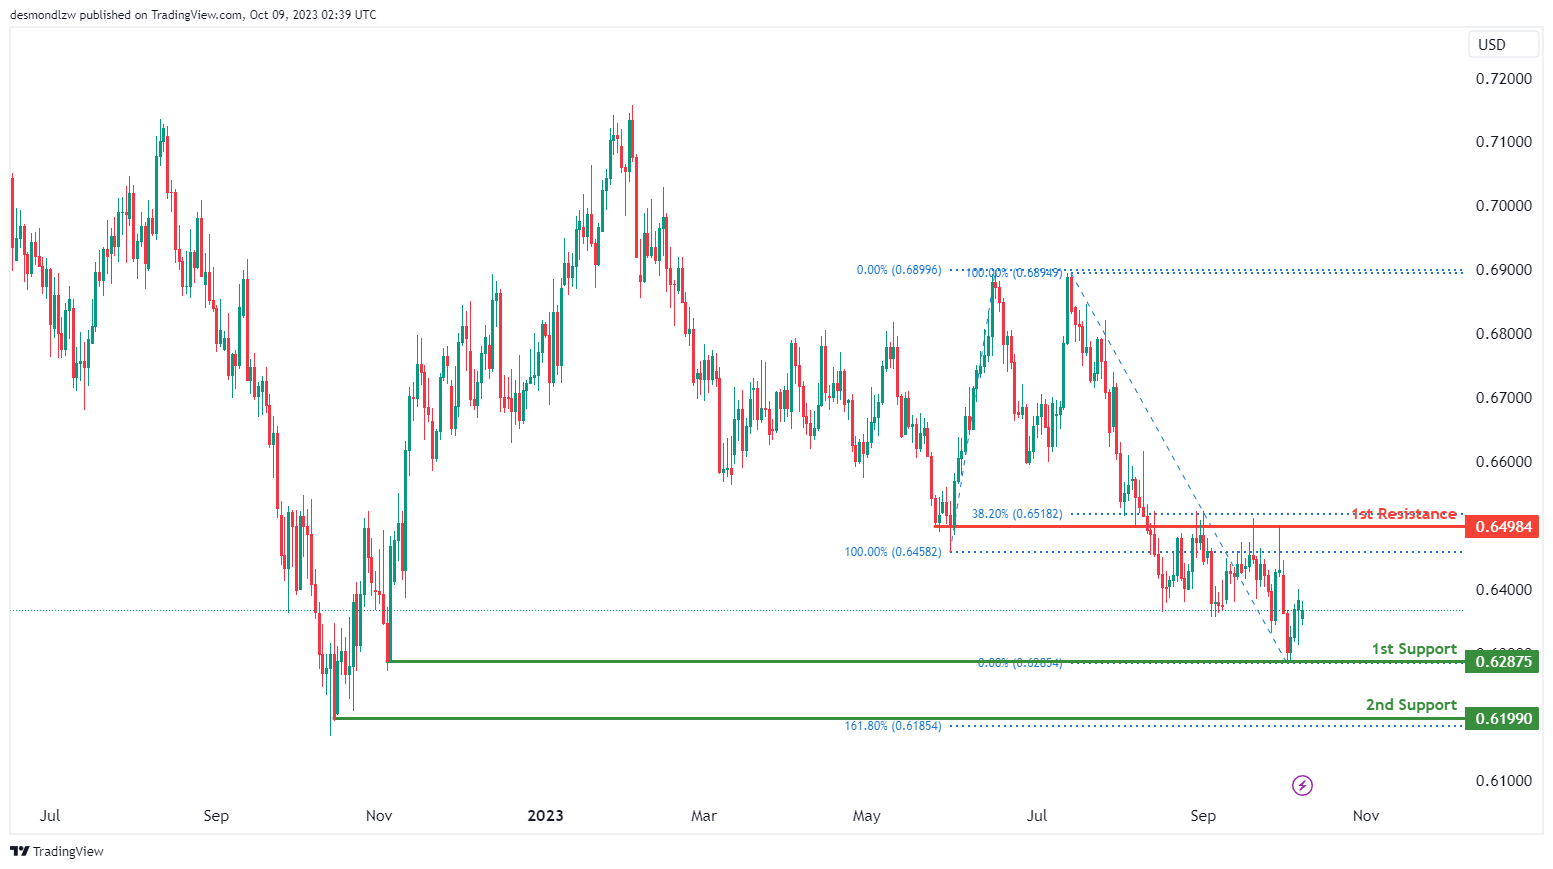
The AUD/USD chart currently exhibits an overall bearish momentum with a potential scenario for price to make a bearish continuation towards the 1st support level.
The 1st support level at 0.6288 is identified as a pullback support while the 2nd support level at 0.6199 is marked as a swing-low support that aligns with the 161.80% Fibonacci extension level, reinforcing its importance as a potential support level.
To the upside, the 1st resistance level at 0.6498 is identified as an overlap resistance that aligns close to the 38.20% Fibonacci retracement level, further emphasizing its significance as a barrier for future price increases.
NZD/USD
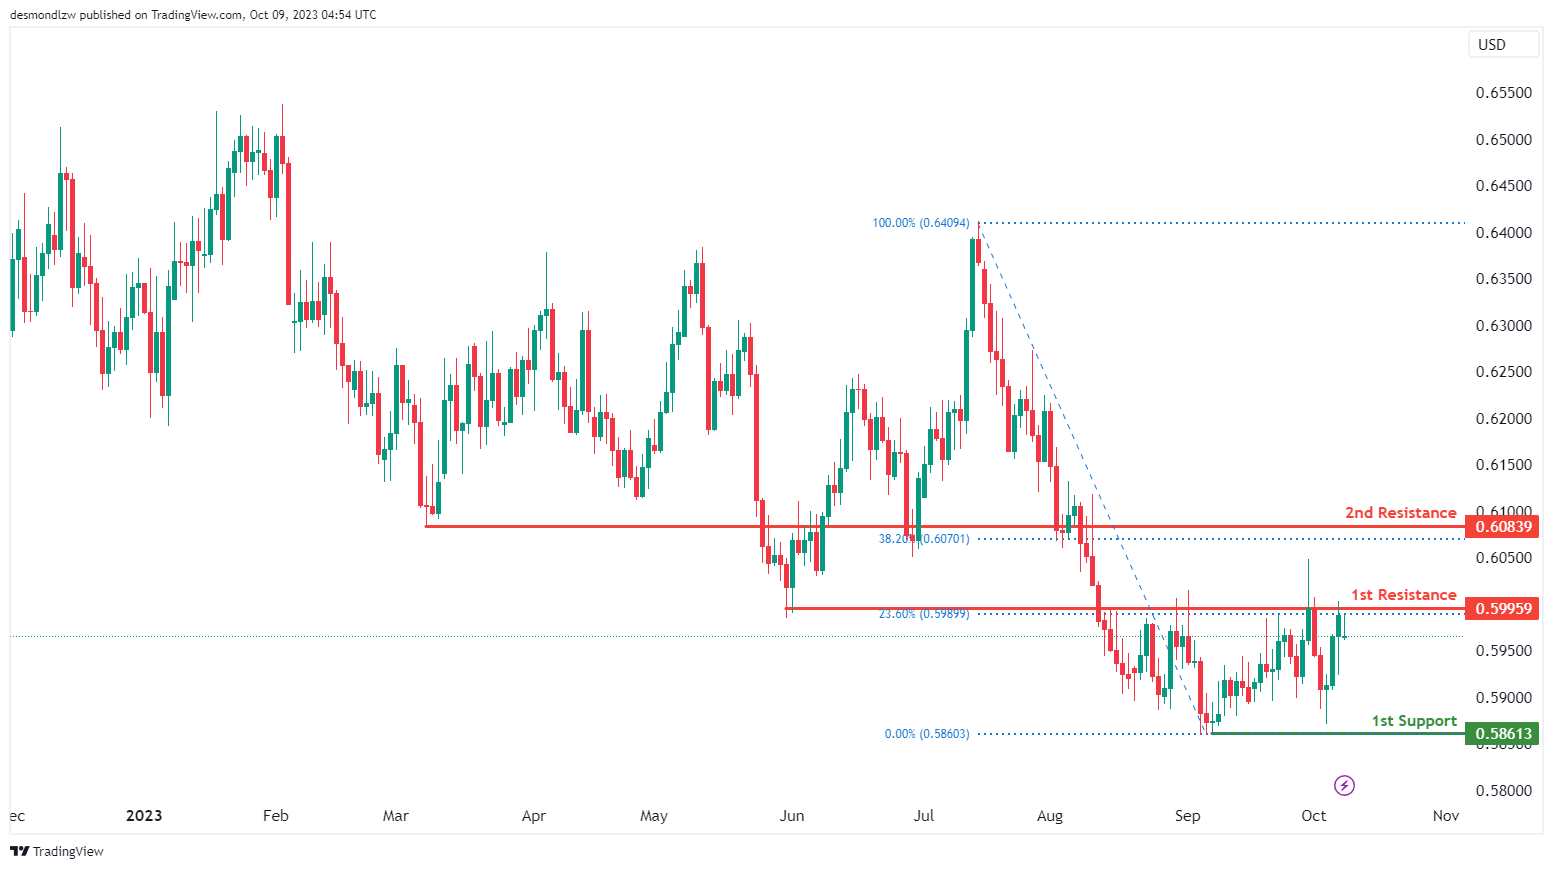
The NZD/USD chart currently exhibits an overall bearish momentum with a potential scenario for price to make a bearish reaction off the 1st resistance and drop towards the 1st support level.
The 1st resistance level at 0.5996 is identified as an overlap resistance that aligns with the 23.60% Fibonacci retracement level. Additionally, the 2nd resistance level at 0.6084 is also marked as an overlap resistance that aligns with the 38.20% Fibonacci retracement level, further emphasizing its significance as a barrier for future price increases.
To the downside, the 1st support level at 0.5861 is identified as a pullback support, further reinforcing its significance as an area where price may find support.
DJ30:
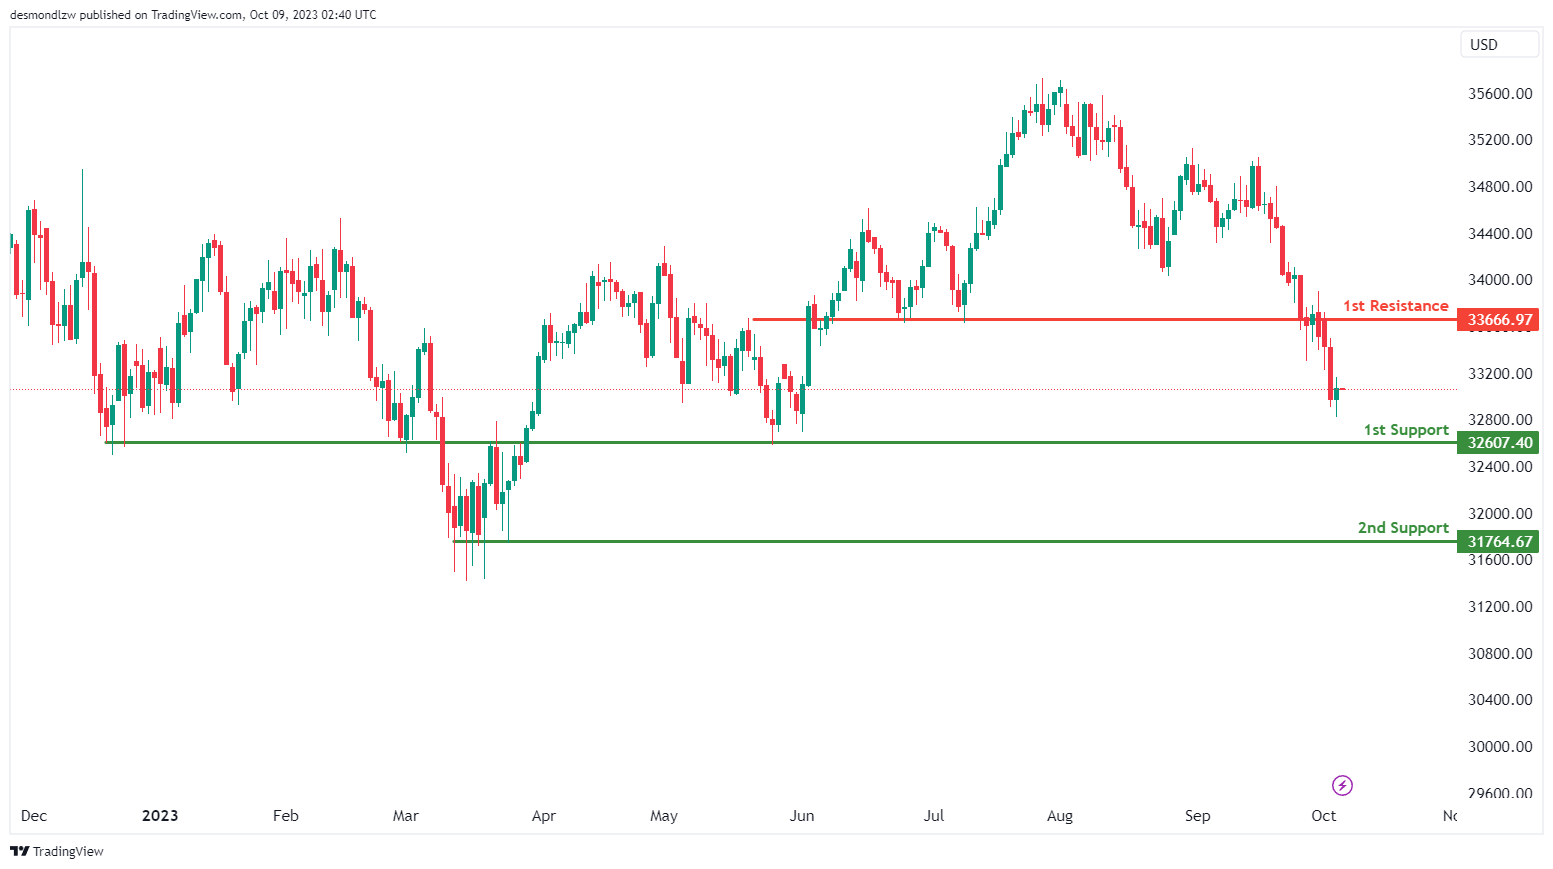
The DJ30 (Dow Jones 30) chart is currently displaying a neutral overall momentum, indicating the potential scenario of price fluctuating between the 1st resistance and the 1st support levels.
The 1st support level at 32,607.40 is identified as an overlap support. Additionally, the 2nd support level at 31,764.67 is marked as a pullback support, providing another important level to watch.
To the upside, the 1st resistance level at 33,666.97 is identified as an overlap resistance, potentially acting as a barrier to further upward movement.
GER40:
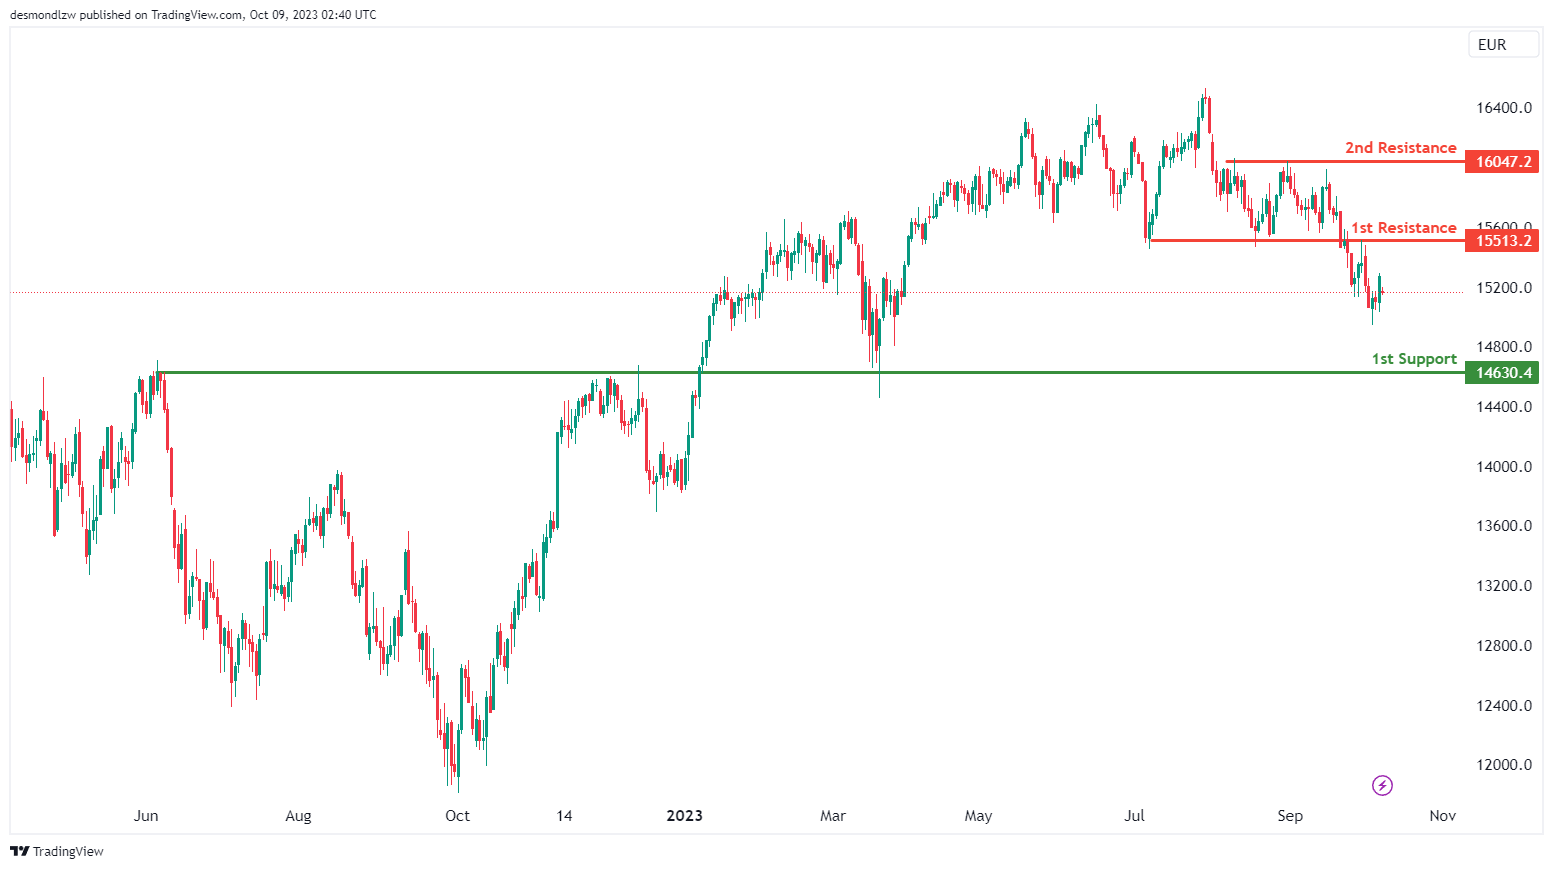
The GER40 chart currently exhibits a neutral momentum, suggesting a potential scenario of price fluctuation between the 1st resistance and the 1st support levels.
The 1st support level at 14,630.40 is identified as an overlap support, a potential level where price might find buying interest.
To the upside, the 1st resistance level at 15,513.20 is noted as an overlap resistance. Beyond this, the 2nd resistance level at 16,047.20 represents a pullback resistance, potentially acting as a barrier to further upward movement.
US500
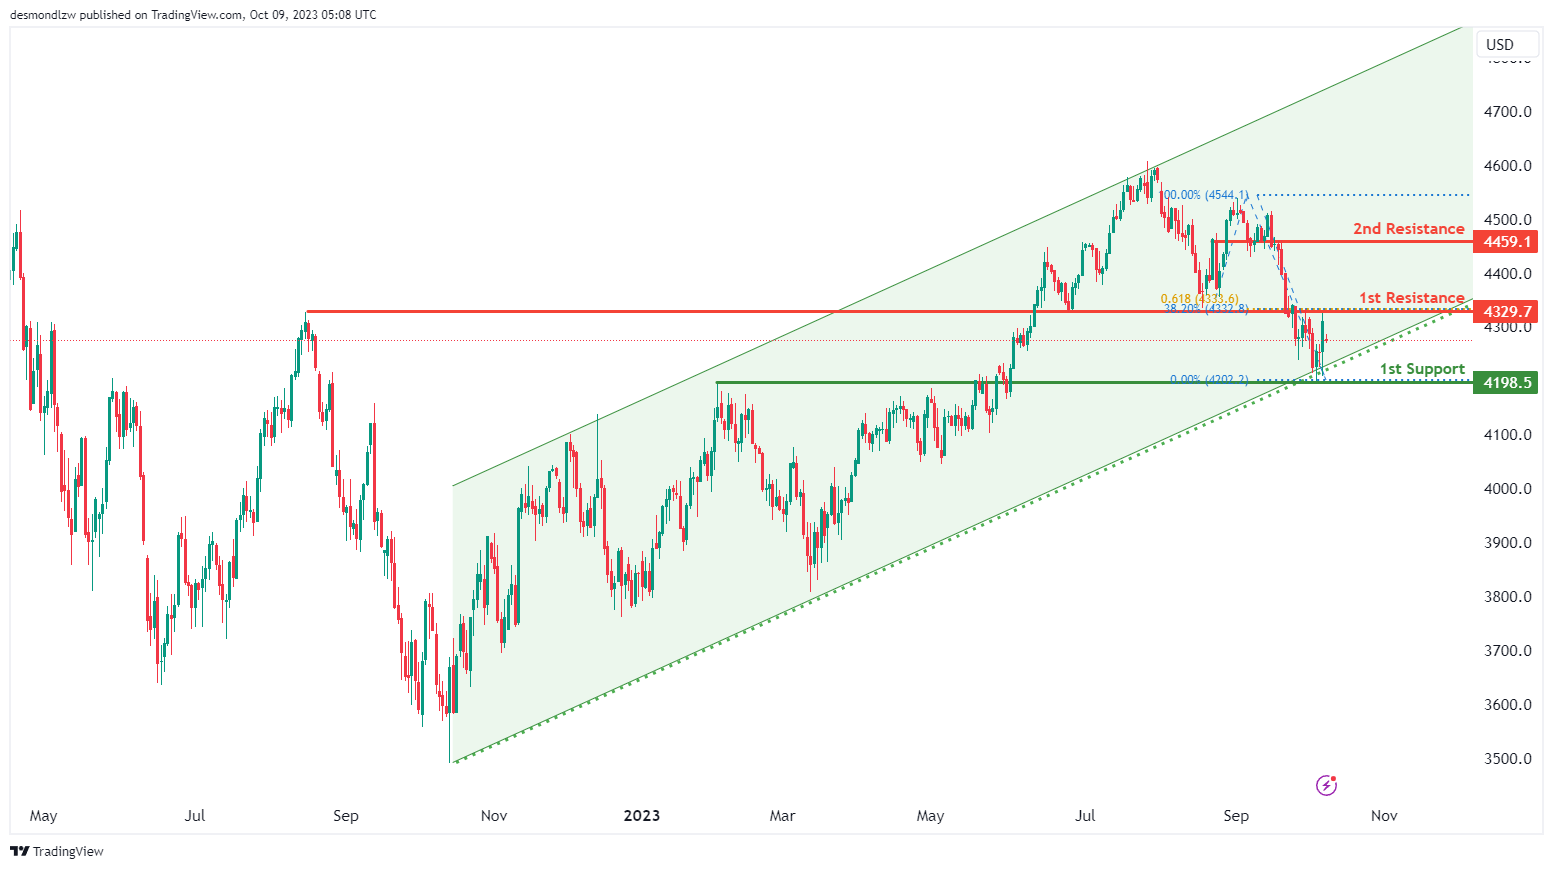
The US500 chart currently exhibits a neutral momentum, suggesting a potential scenario of price fluctuation between the 1st resistance and the 1st support levels.
The 1st support level at 4,198.50 is identified as an overlap support, reinforced by the presence of the ascending trendline.
To the upside, the 1st resistance level at 4,329.70 is noted as an overlap resistance that coincides with a confluence of Fibonacci levels i.e. the 38.20% retracement and the 61.80% projection levels. Beyond this, the 2nd resistance level at 4,459.10 also represents an overlap resistance, potentially acting as a barrier to further upward movement.
BTC/USD:
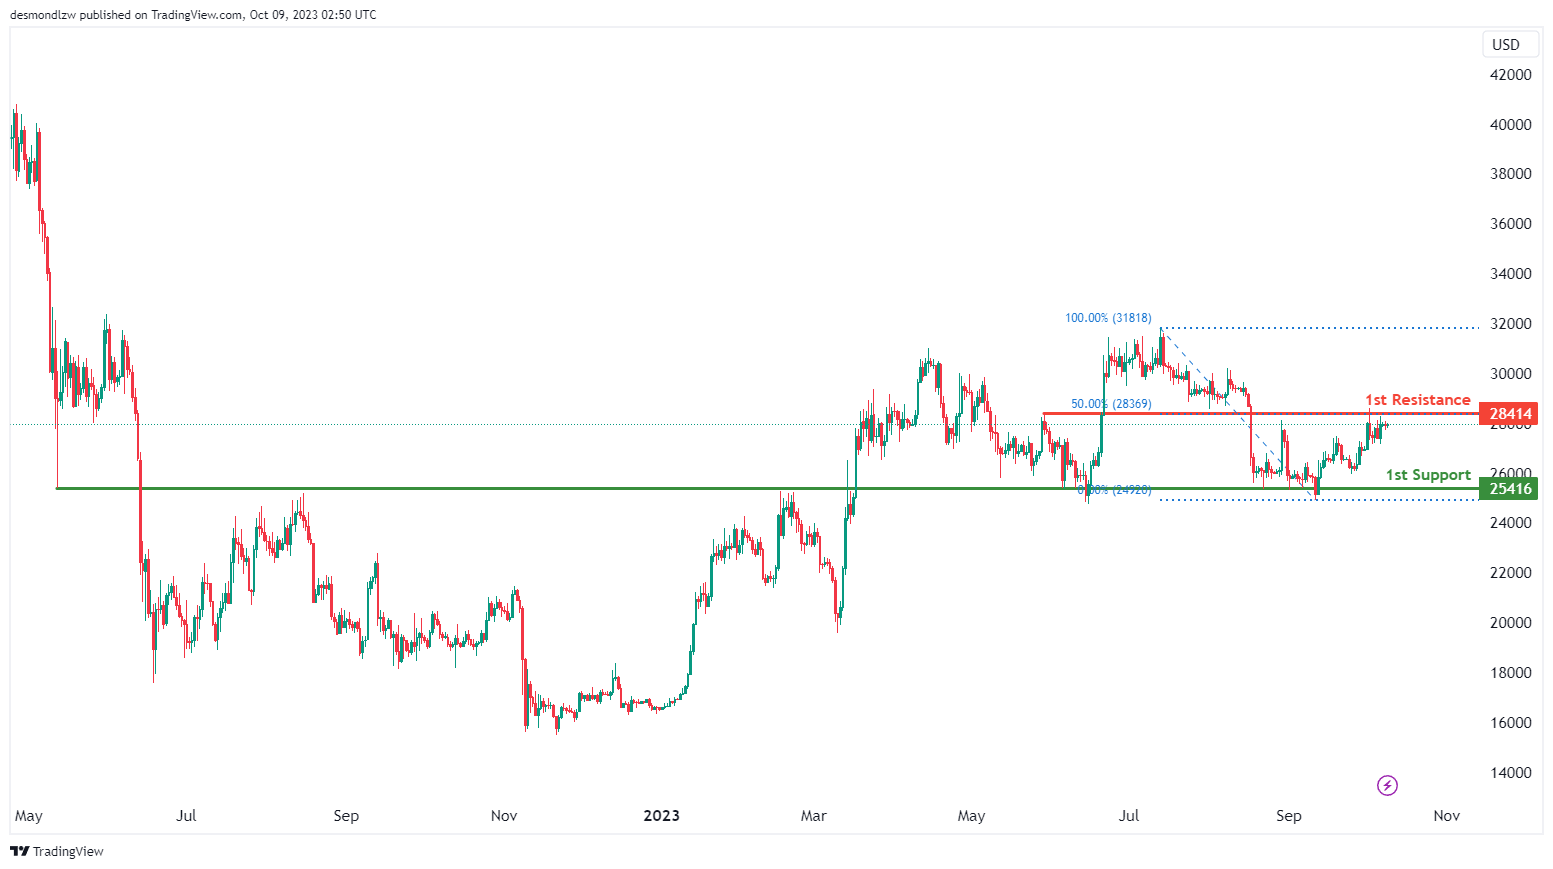
The BTC/USD chart currently has a neutral momentum, suggesting a potential scenario of price fluctuation between the 1st resistance and the 1st support levels.
The 1st support at 25,416 is identified as an overlap support, a potential level where price might find buying interest.
To the upside, the 1st resistance level at 28,414 is noted as an overlap resistance that aligns with the 50.00% Fibonacci retracement level, potentially acting as a barrier to further upward movement.
ETH/USD:
The ETH/USD chart currently exhibits a neutral momentum, suggesting a potential scenario of price fluctuation between the 1st resistance and the 1st support levels.
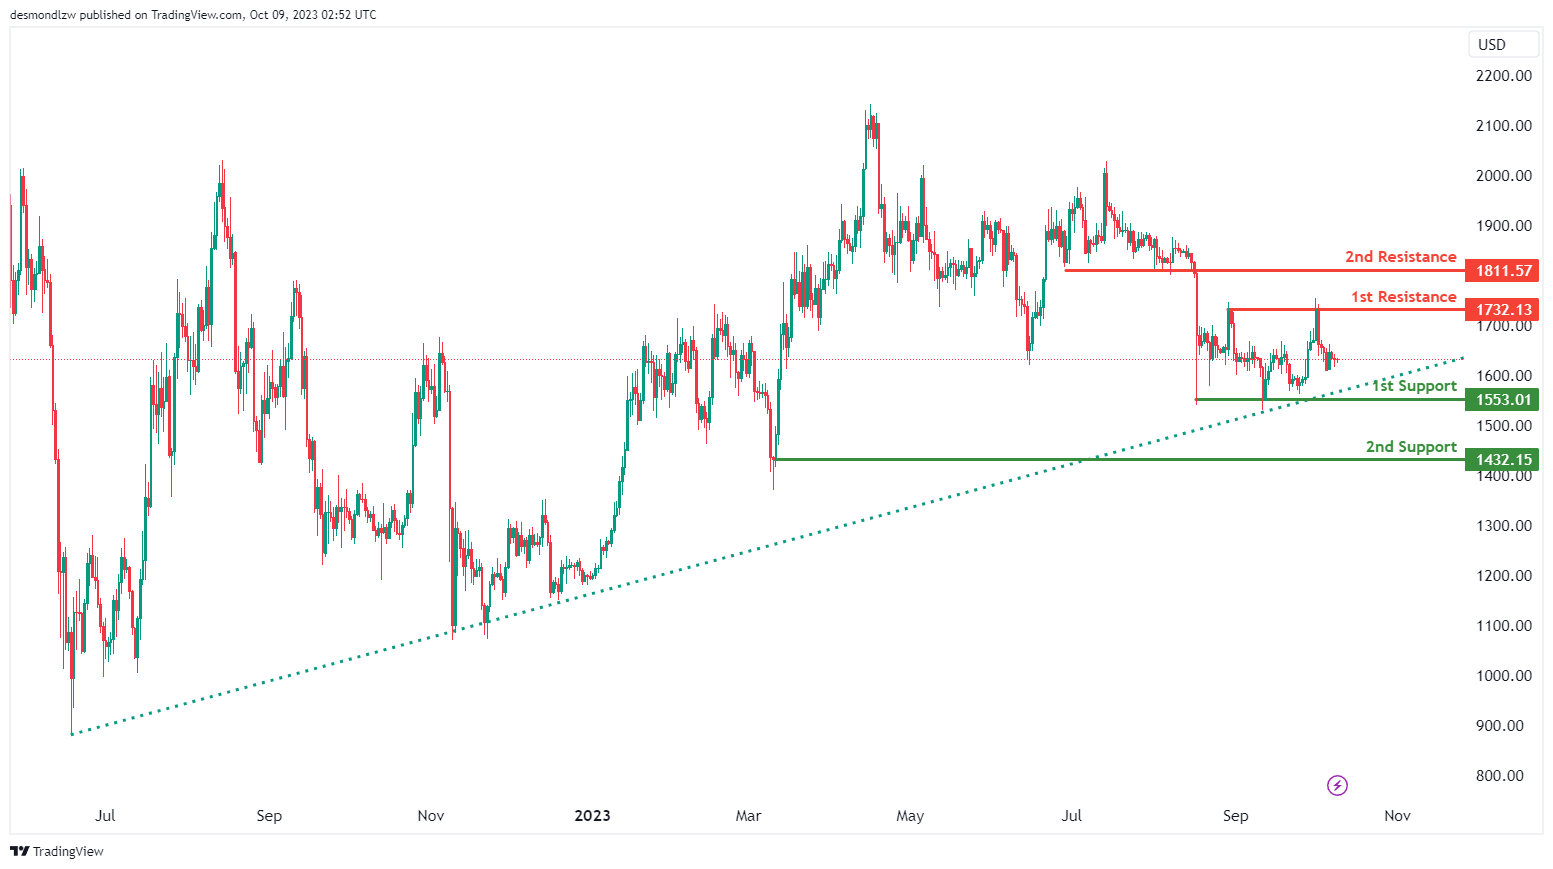
The 1st support level at 1,553.01 is identified as a pullback support. Additionally, the 2nd support at 1,432.15 is noted as a swing-low support, suggesting it could provide additional support to price if it declines.
To the upside, the 1st resistance level at 1,732.13 is identified as a pullback resistance. Beyond the 1st resistance level, the 2nd resistance level at 1,811.57 is recognized as a pullback resistance, implying that it has previously held as a price barrier.
WTI/USD:
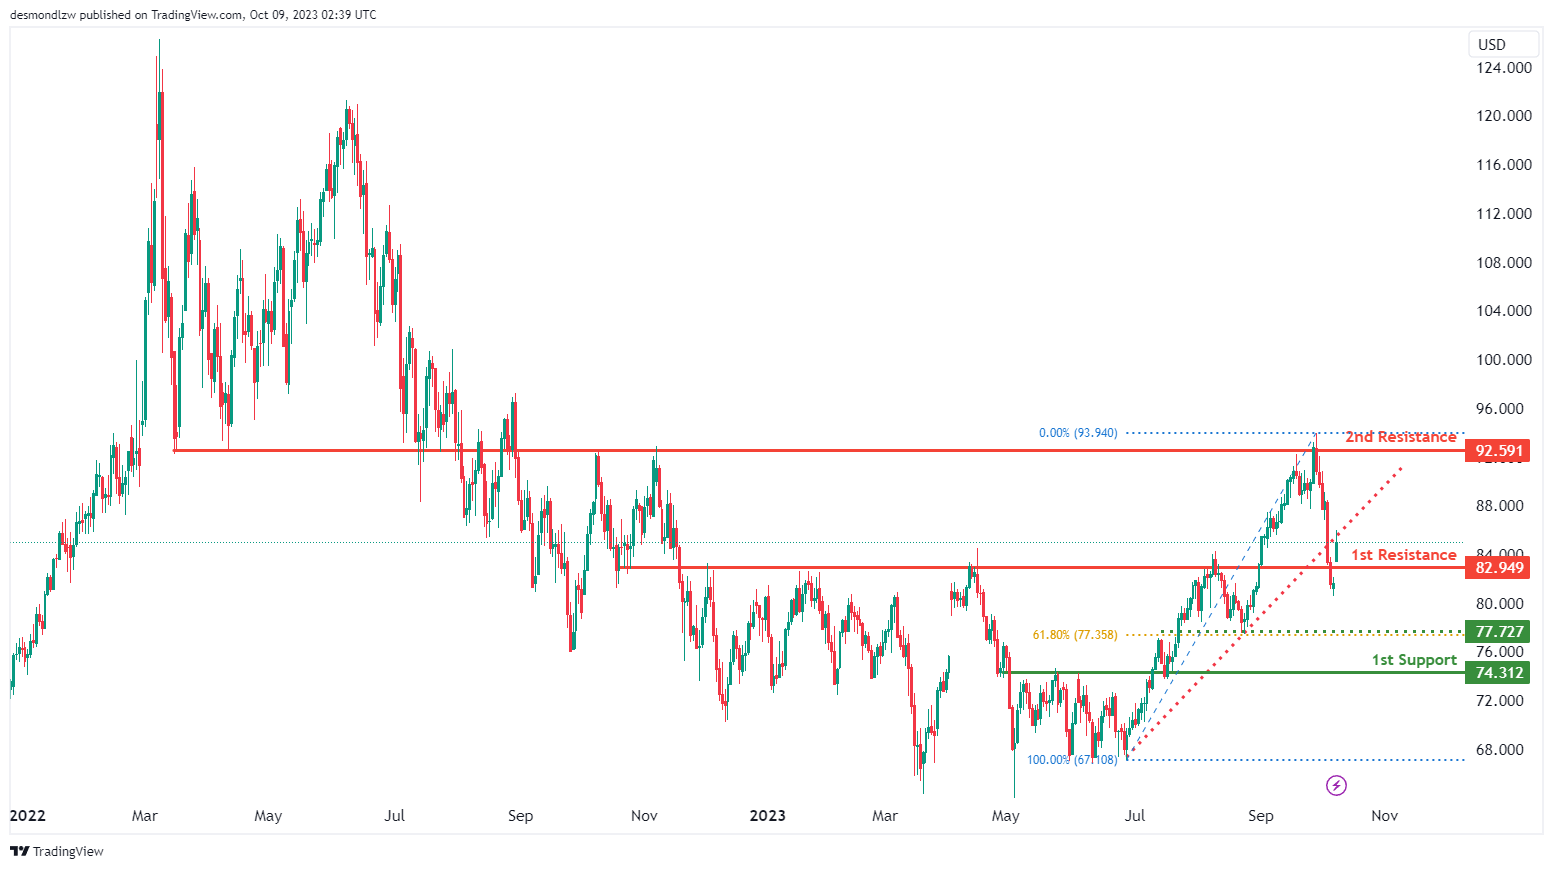
The WTI chart currently shows a bullish momentum with price breaking above the 1st resistance level this morning and is likely to remain above this level today.
The 1st resistance level at 82.95 is identified as an overlap resistance while the 2nd resistance level at 92.59 is also noted as an overlap resistance, potentially acting as a barrier to further upward movement.
To the downside, the intermediate support level at 77.73 is identified as an overlap support that aligns with the 61.80% Fibonacci retracement level while the 1st support level at 74.31 is also noted as an overlap support, further reinforcing its significance as an area where price may find support.
XAU/USD (GOLD):
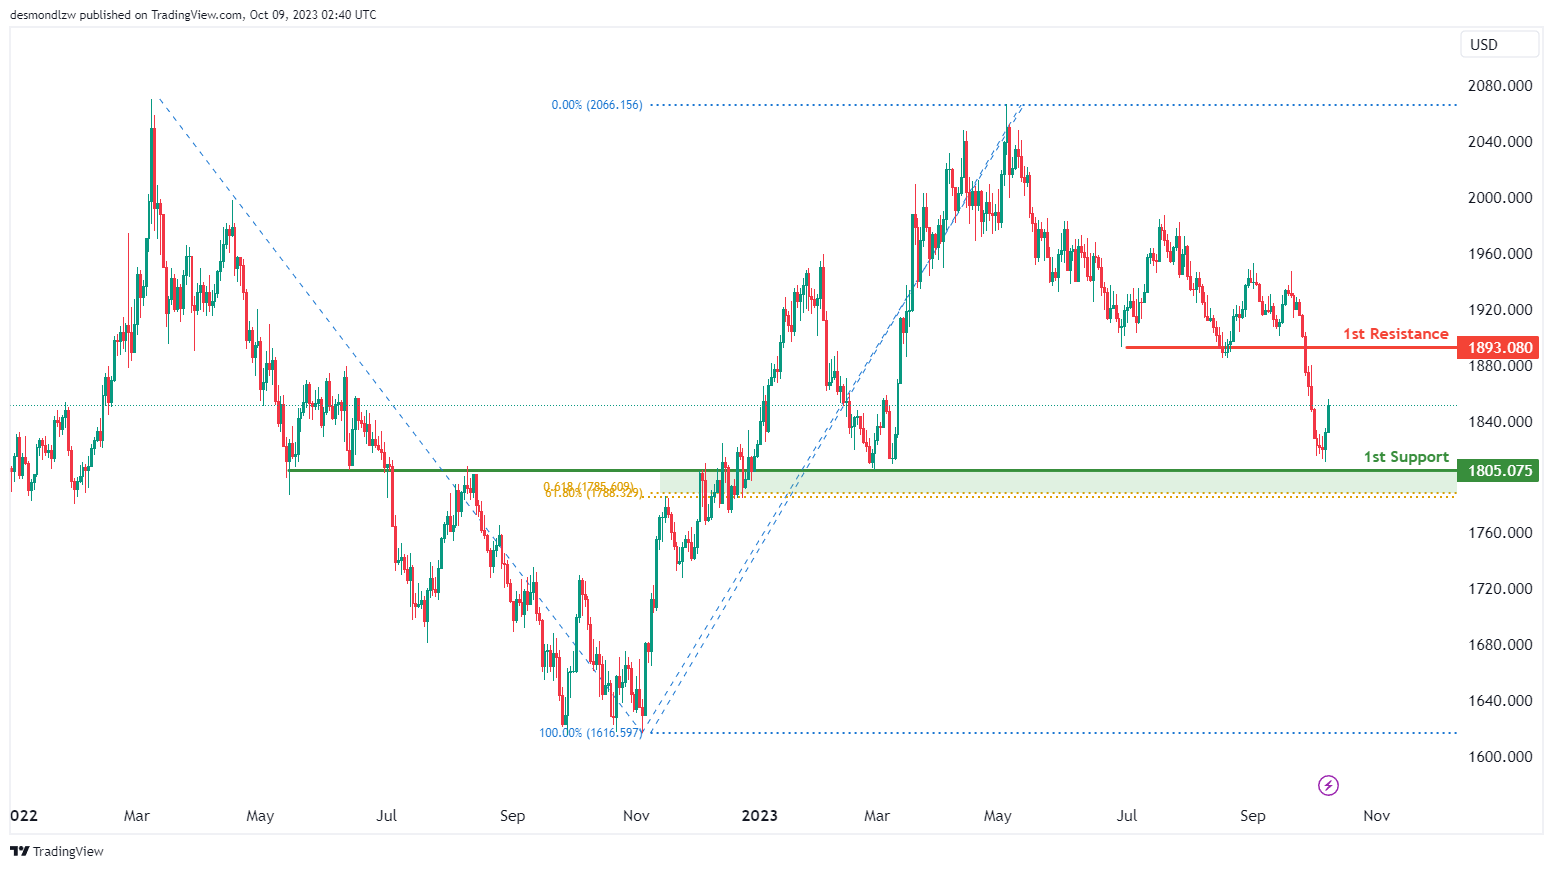
The XAU/USD chart currently exhibits bullish momentum, with a potential scenario of a bullish continuation towards the 1st resistance level.
The 1st resistance level at 1893.08 is identified as a pullback resistance, potentially acting as a barrier to further upward movement.
To the downside, the 1st support level at 1805.08 is noted as an overlap support that coincides with a confluence of Fibonacci levels i.e. the 61.80% retracement and the 61.80% projection levels, further reinforcing its significance as an area where price may find support.
Oil Up, Capital Flows into Safe Haven on Mid-East Tensions
Capital flows into the safety of US dollar and gold this morning, while oil is up almost 4% after Hamas’ unexpected attack on Israel wreaked havoc in the region last Friday, and tensions have been mounting since then. There are rumours that Iran helped Hamas organize its attack, and the US said it’s sending warships to the region. The escalation of the tensions sent a panic wave into the financial markets on Monday open. The barrel of American crude traded past $87pb, as fears of a potential retaliation against Iran threaten the passage of vessels carrying oil through the Strait of Hormuz and flip the market rhetoric from a potentially slowing global oil demand to tight global supply.
It is difficult to predict the extent of the price action on geopolitical shocks. The fact that the US and Iran are pulled into the turmoil hints that tensions may further escalate. From a price perspective, the $90pb level is expected to shelter decent offers in US crude, as escalation and prolongation of Mid-East tensions could be the final straw that could bring the world very close to the brink of recession, and temper appetite for oil. It's too early to call.
From a geopolitical perspective, this war is different from the one in 1973 because the political and the geopolitical landscape is unalike. First Arabic countries are not attacking Israel together. Second, OPEC countries do have spare capacity that they restrict willingly to maintain oil price at above the $80pb, but they don’t necessarily think of tripling oil prices – which would only accelerate the energy transition. Third, yes, the US could continue to tap into its strategic oil reserves to level out a potential price shock even though SPR is down to a 40-year low following the Ukrainian war and finally, the Ukrainian war and embargo on Russian oil are already in play and the West has little margin to impose another embargo on Arab oil. This being said, potential retaliation against Tehran is a serious upside risk for oil prices. We will keep an eye on developments, but don’t speculate on a full-blast rise in oil prices for now.
Trading in Asia was mixed, stocks in Tel Aviv lost 6.5%, sentiment in Europe is sour and the US equity futures are down. Gold acts as a strong safe haven. The price of an ounce jumped past the $1850 level this morning, and further escalation of tensions should drive capital into the safety of gold. The upside potential extends to a distant $2000 per ounce, but gains due to geopolitical tensions are not expected to last long. What will remain decisive for gold’s medium, long-term performance will be the US yields. For now, they are on a rising path.
Even though last Friday seems like it was ages ago, the NFP printed a shocker 336K new nonfarm job additions. But the wages growth was softer than expected and the unemployment rate held steady at 3.8%, instead of cooling down to 3.7% as expected by analysts. Expectations of November rate hike are steady, there is near 80% chance of no rate hike.
This week, the market attention will shift to the big bank earnings, and to the latest US inflation update. The US consumer price inflation is seen easing from 0.7% to 0.3% on a monthly basis thanks to the cooling energy prices over the past month, and the yearly CPI figure could soften from 3.7% to 3.6%. The core CPI, which is more important for the Fed expectations, is expected to have eased to 4.1%. The US 10-year yield is at the highest level since 2007; no surprise or a good surprise could spark interest from bond traders at the current levels.
Strong US Labour Market
Market movers today
Main focus this week will be the US CPI report on Thursday where we look for a below consensus reading on core CPI of 0.2% m/m (consensus 0.3% m/m). In the Nordics we also have CPI from Denmark, Sweden and Norway during the week.
Today we only get tier-2 data with the Euro sentix survey for October and Norwegian monthly GDP for August.
The 60 second overview
The US jobs report showed a strong increase of 336,000 new jobs in September and an unchanged unemployment rate at 3.8%. This situation poses challenges for the Fed, which may need to maintain higher interest rates for an extended period to control inflation. As a result, the 10-year Treasury yield reached 4.89%, highest level since 2007, while the 2-year yield hit 5.15%, remaining close to its recent multi-year high of 5.20% from mid-September. The US services sector (Leisure & Hospitality, Government, Education & Health) remains the main drivers of employment growth, but it overall looks fairly broad across sectors (so no clear one-offs explaining the uptick). The labour force rises by a more modest 90k, so even though unemployment rate remains unchanged at 3.8% it seems like labour markets have actually tightened in September. This is worrying for the Fed, as overall labour market conditions remain too tight for comfort. During the weekend Fed's Bowman repeated her call for the Fed to probably need to hike policy rates further.
In early trading session we have seen oil jumping almost 4% to USD 87 per barrel (Brent), while US treasury futures rose, implying lower yields, due to the rising tensions in the Middle East this weekend.
Equities: Global equities were higher on Friday and higher for the week. Hence, the streak of weeks with lower equities was broken despite a lot of focus on higher yields challenging the outlook for equities. Interestingly on Friday, equities were higher although yields were higher. The reason was a very solid non-inflationary non-farm payroll report. Cyclical sectors outperformed both Friday and last week while consumer staples and energy were the laggards. Major indices on Friday: Dow +0.9%, S&P 500 +1.2%, Nasdaq +1.6% and Russell 2000 +0.8%. Asian markets this morning is a mixed bag. A couple of countries closed for holidays while typhoons are keeping Hong Kong closed. Elsewhere markets are affected the by the attack in Israel sending oil prices higher and energy stocks outperforming. Futures in Europe and US are lower this morning in a risk-off move related to the increased tensions in the Middle East.
FI: Friday's surprisingly strong US non-farm payrolls number sent yields higher initially, but yields ended lower on the day heading into the weekend. 10y German bunds ended the week virtually unchanged from there, around 2.88%, although it was a volatile week, with notably 10y Bunds trading above 3% at one point.
FX: EUR/USD saw an uptick after 11 consecutive weeks of decline, gaining ground following the US jobs report release on Friday. EUR/SEK ended Friday's session just below the 11.60 mark gearing up for a string of important releases out this week among others September CPI and the Riksbank's activity report for the hedging of the FX reserves. EUR/NOK has regained some renewed tailwind the past week. We stay short NOK/JPY.
Credit: Overall credit markets digested the macroeconomic numbers out of the US Friday. This left both primary and secondary activity low. Both iTraxx Main and iTraxx X-Over saw only marginal changes.
GBP/JPY Daily Outlook
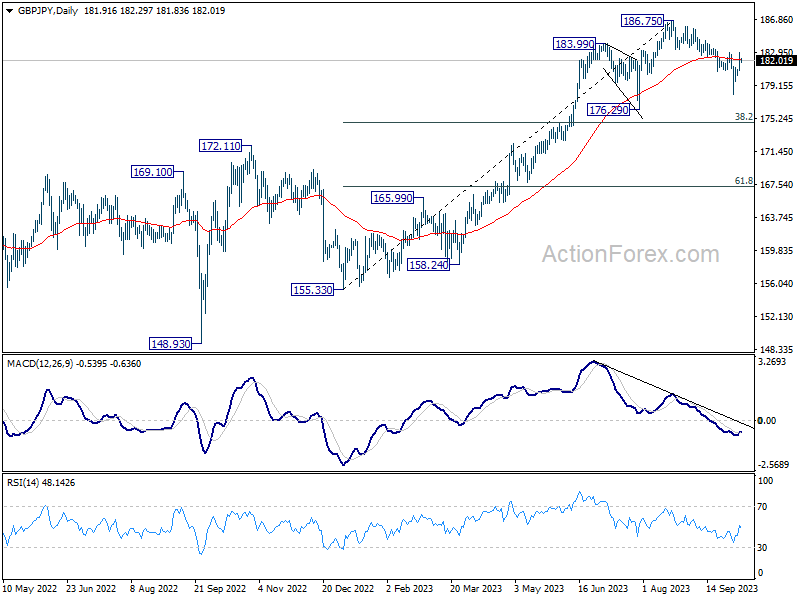
Daily Pivots: (S1) 181.36; (P) 182.17; (R1) 183.49; More...
Intraday bias in GBP/JPY stays neutral at this point. On the upside, firm break of 183.00 will argue that the pull back from 187.65 has completed, and turn bias back to the upside for retesting this high. On the downside, below 180.26 minor support will turn bias back to the downside for 178.02 again.
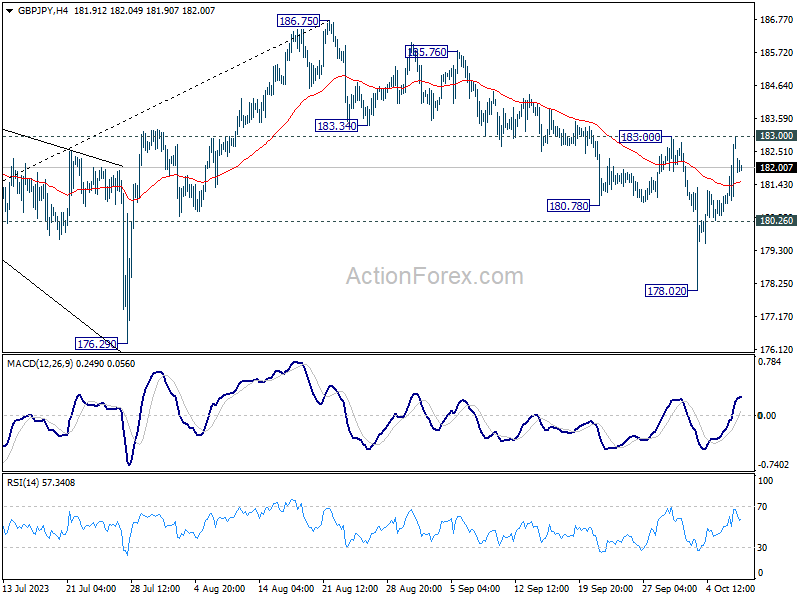
In the bigger picture, fall from 186.75 is currently seen as a corrective move only. As long as 176.29 support holds, larger up trend from 123.94 (202 low) should still be in progress. Break of 186.75 will target 195.86 (2015 high). Nevertheless, firm break of 176.29 will confirm medium term topping, and bring lengthier and deeper consolidations.
EUR/JPY Daily Outlook
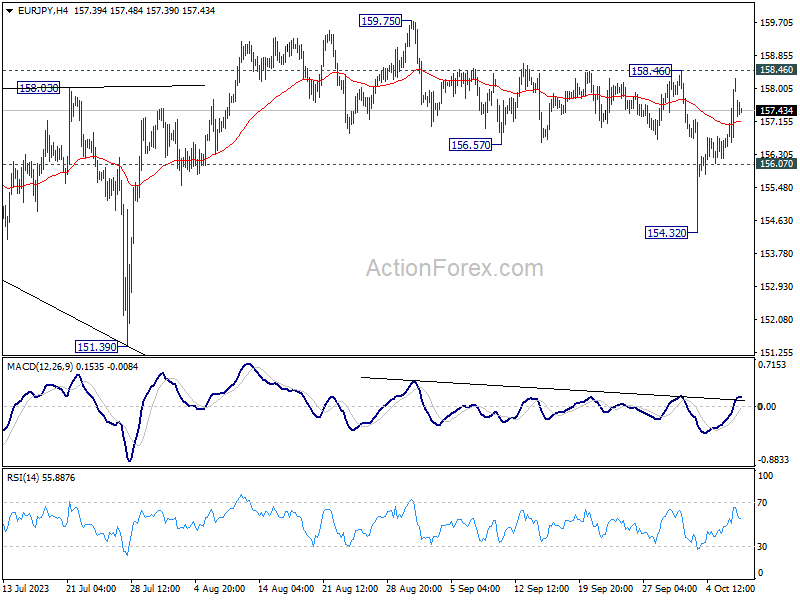
Daily Pivots: (S1) 156.94; (P) 157.61; (R1) 158.71; More....
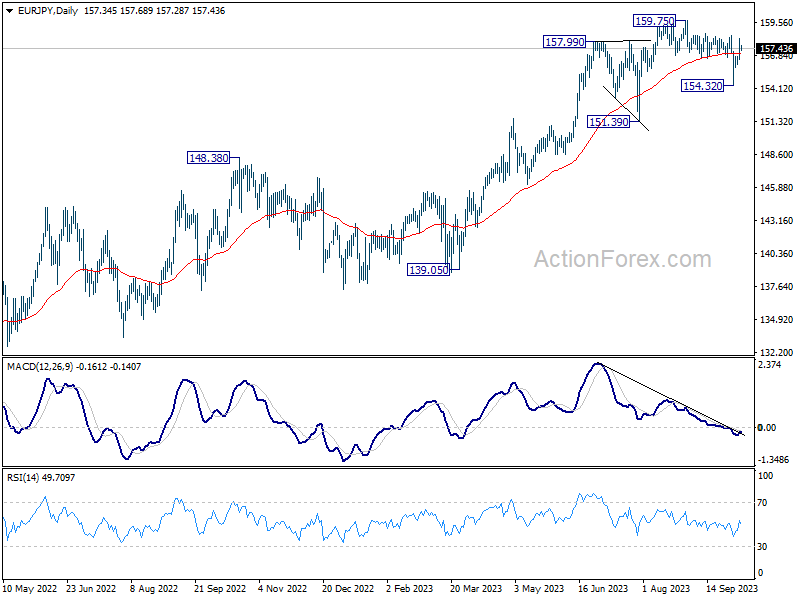
Intraday bias in EUR/JPY remains neutral for the moment. On the upside, firm break of 158.464 will argue that the pull back has from 159.75 is completed. Bias will be turned back to the upside for resuming larger up trend through 159.75 high. On the downside, below 156.07 minor support will resume the fall from 159.75 through 154.32 support.
In the bigger picture, price actions from 159.75 are views as a corrective pattern for now. As long as 151.39 support holds, rise from 114.42 (2020 low) is still expected to continue through 159.75 at a later stage. Nevertheless, firm break of 151.39 will confirm medium term topping, and bring lengthier and deeper correction.
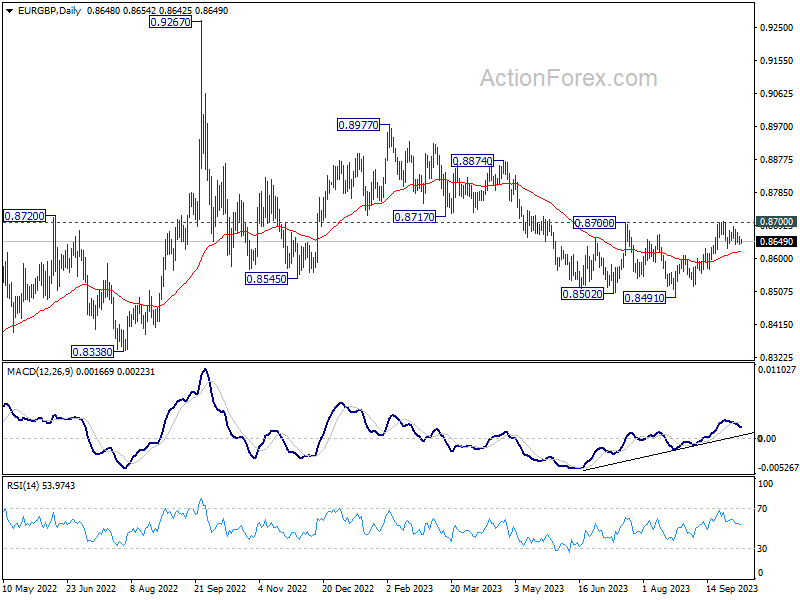
EUR/GBP Daily Outlook
Daily Pivots: (S1) 0.8640; (P) 0.8651; (R1) 0.8662; More....
Intraday bias in EUR/GBP remains neutral as range trading continues. On the upside, decisive break of 0.8700 resistance will carry larger bullish implication and bring stronger rally to 0.8874 resistance next. Nevertheless, rejection by this resistance will maintain bearish outlook that larger down trend is not over. Firm break of 0.8629 resistance turned support will turn bias back to the downside for 0.8568 support first.
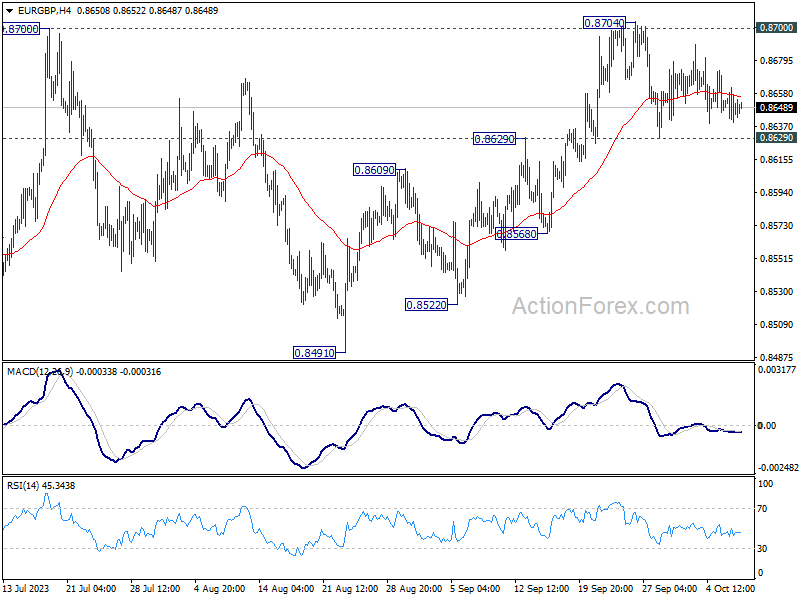
In the bigger picture, the down trend from 0.9267 (2022 high) is seen as part of the long term range pattern from 0.9499 (2020 high). Decisive break of 0.8700 resistance will argue that this decline has completed with three waves down to 0.8491. Rise from 0.8491 could then be another leg inside the pattern and targets 0.8977 and above. However, rejection by 0.8700 will keep the down trend alive for another fall through 0.8491 at a later stage.
EUR/AUD Daily Outlook
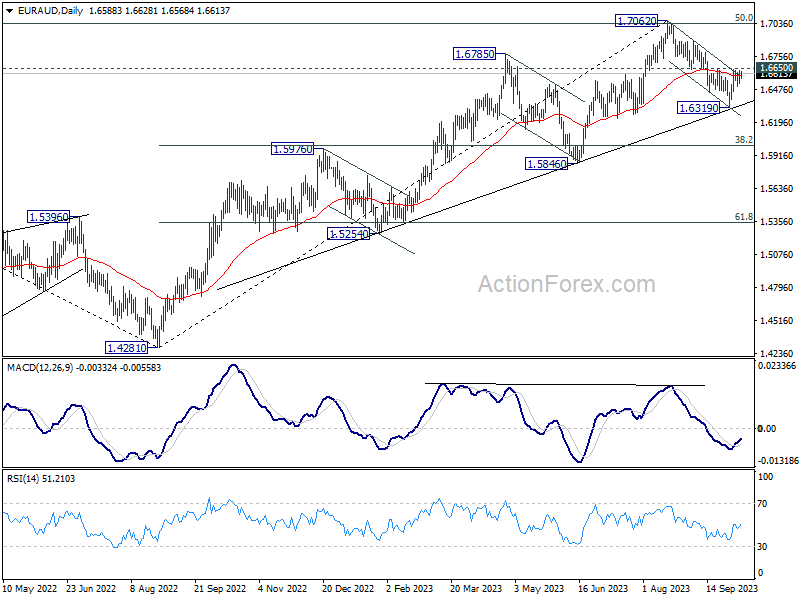
Daily Pivots: (S1) 1.6525; (P) 1.6581; (R1) 1.6636; More...
Intraday bias in EUR/AUD Remains neutral at this point. On the downside, below 1.6446 minor support will bring retest of 1.6319. Break there will resume the decline from 1.7062 to 1.6000 fibonacci level. On the upside, firm break of 1.6650 resistance will argue that pull back from 1.7062 has completed, after drawing support from medium term rising trend line. Further rally would be seen back to retest 1.7062.
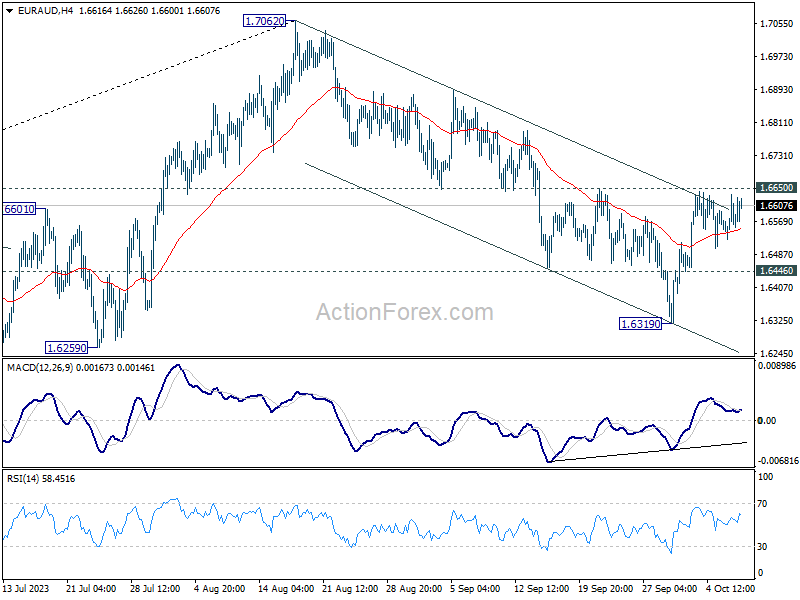
In the bigger picture, fall from 1.7062 is probably correcting whole up trend from 1.4281 (2022 low). Deeper decline would be seen to 38.2% retracement of 1.4281 to 1.7062 at 1.6000. Strong support could be seen there to bring rebound, at least on first attempt. This will remain the favored case as long as 1.6650 resistance holds.
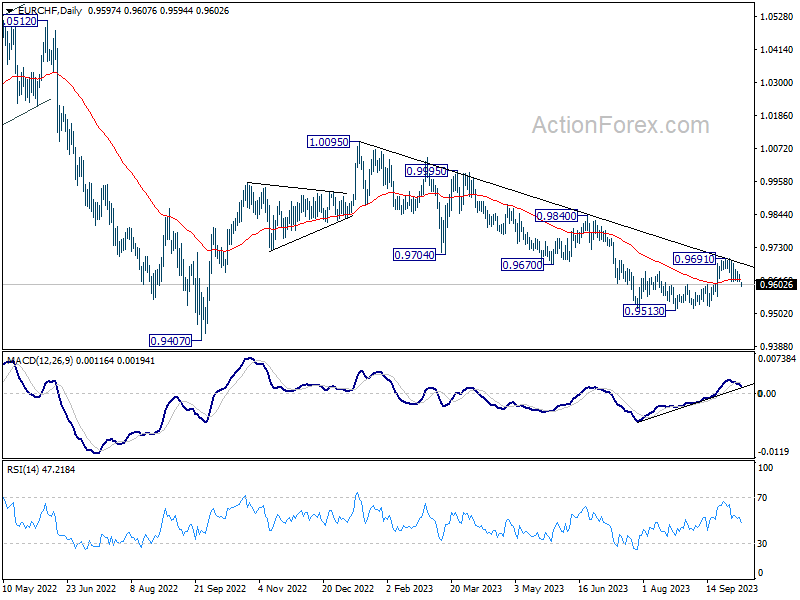
EUR/CHF Daily Outlook
Daily Pivots: (S1) 0.9619; (P) 0.9628; (R1) 0.9643; More...
EUR/CHF's fall resumes today and the development argues that rebound from 0.9513 has completed at 0.9691. Intraday bias is back on the downside for retesting 0.9513 low. On the upside, above 0.9636 minor resistance will turn intraday bias neutral first. Break of 0.9691 will resume the rebound instead.
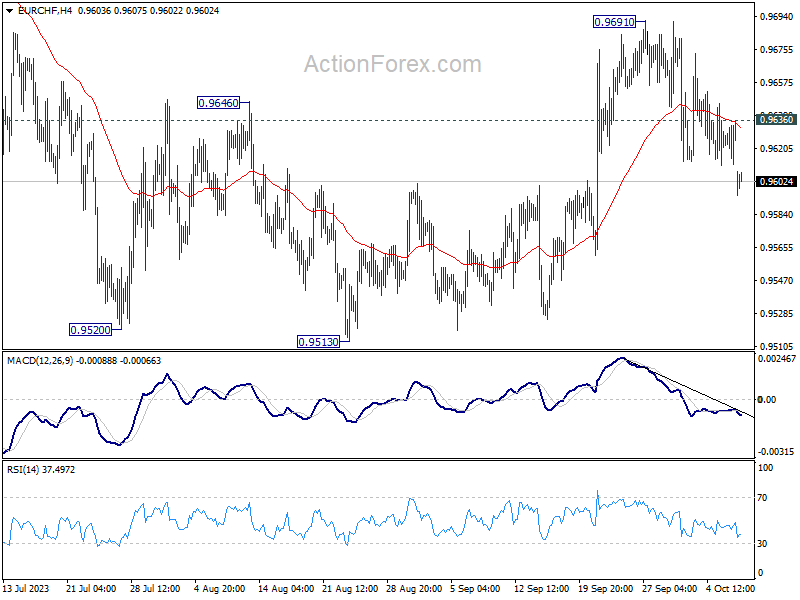
In the bigger picture, medium term outlook will stay bearish as long as the cross is capped well below falling 55 W EMA (now at 0.9793). That is, down trend from 1.2004 (2018 high) could still resume through 0.9407 (2022 low). However, sustained trading above the 55 W EMA will raise the chance that 0.9470 is already a long term bottom. Further rise would then be seen to 1.0095 resistance to indicate bullish trend reversal.
USD/CAD Daily Outlook
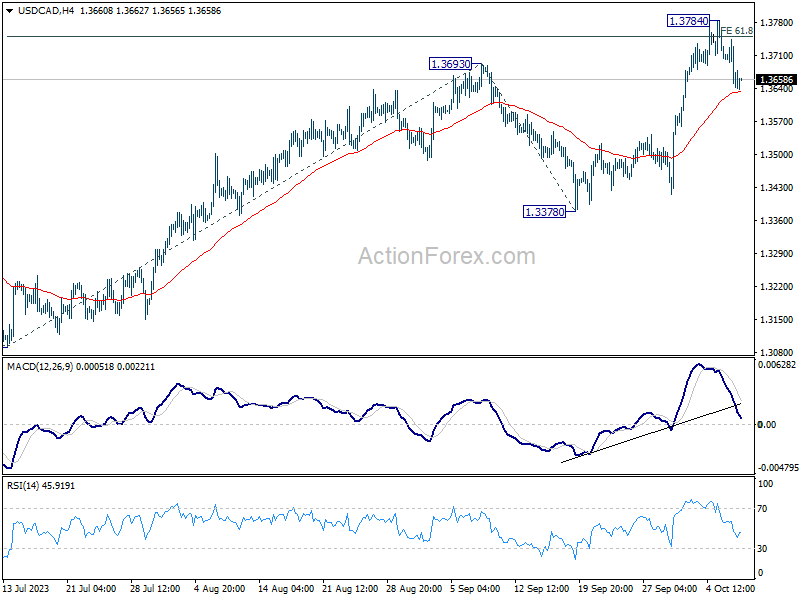
Daily Pivots: (S1) 1.3623; (P) 1.3684; (R1) 1.3725; More....
Intraday bias in USD/CAD remains neutral as consolidation from 1.3784 is extending. While deeper pull back cannot be ruled out, outlook will stay bullish as long as 1.3378 support holds. Above 1.3784 will resume the rally from 1.3091 and target 100% projection of 1.3091 to 1.3693 from 1.3378 at 1.3980.
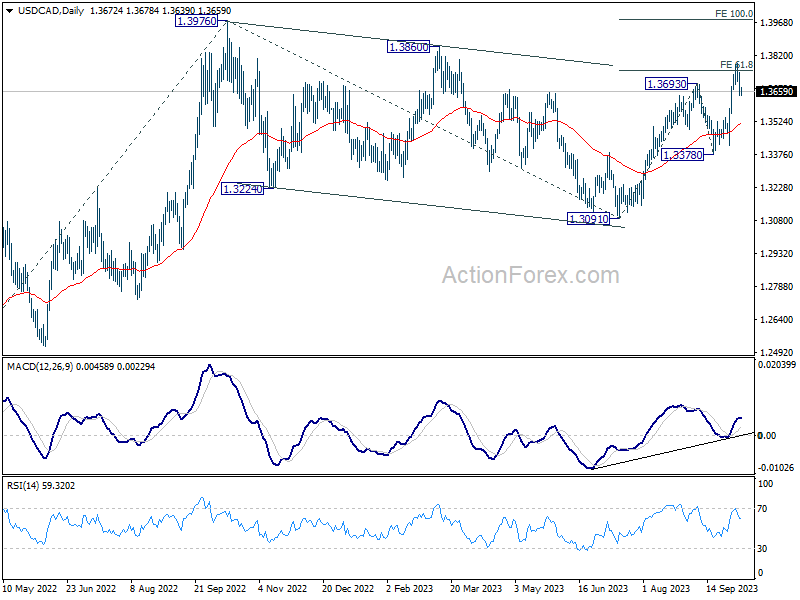
In the bigger picture, current development revives the case that corrective pattern from 1.3976 (2022 high) has completed with three waves down to 1.3091. Decisive break of 1.3976 high will confirm resumption of up trend from 1.2005 (2021 low). Next target will be 61.8% projection of 1.2401 to 1.3976 from 1.3091 at 1.4064. This will now remain the favored case as long as 1.3378 support holds.
AUD/USD Daily Report
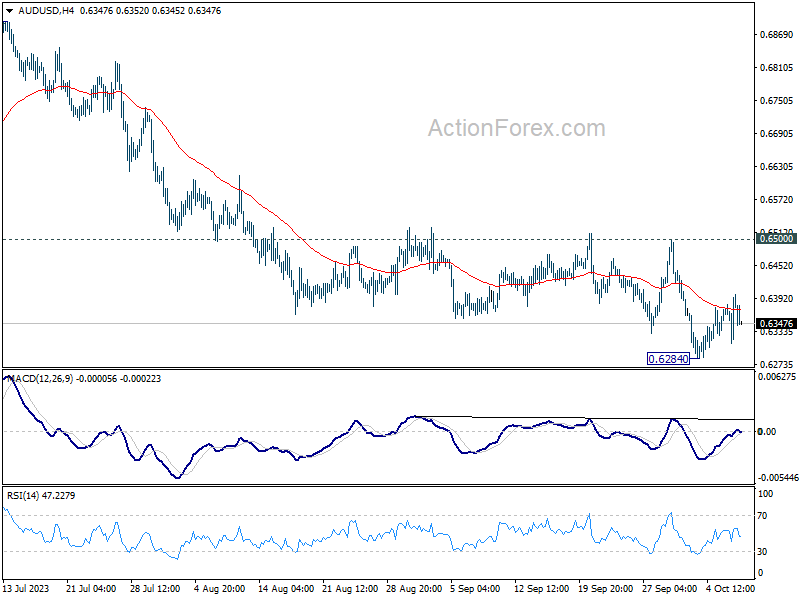
Daily Pivots: (S1) 0.6332; (P) 0.6366; (R1) 0.6419; More...
Intraday bias in AUD/USD stays neutral as consolidation from 0.6284 is extending. Outlook will stay bearish as long as 0.6500 resistance holds. Below 0.6284 will resume the fall from 0.7156. Next target is 100% projection of 0.7156 to 0.6457 from 0.6894 at 0.6195.
In the bigger picture, down trend from 0.8006 (2021 high) is possibly still in progress. Decisive break of 0.6169 will target 61.8% projection of 0.8006 to 0.6169 to 0.7156 at 0.6021. This will now remain the favored case as long as 0.6894, in case of strong rebound.