

Sample Category Title
Dow Jones Wave Analysis
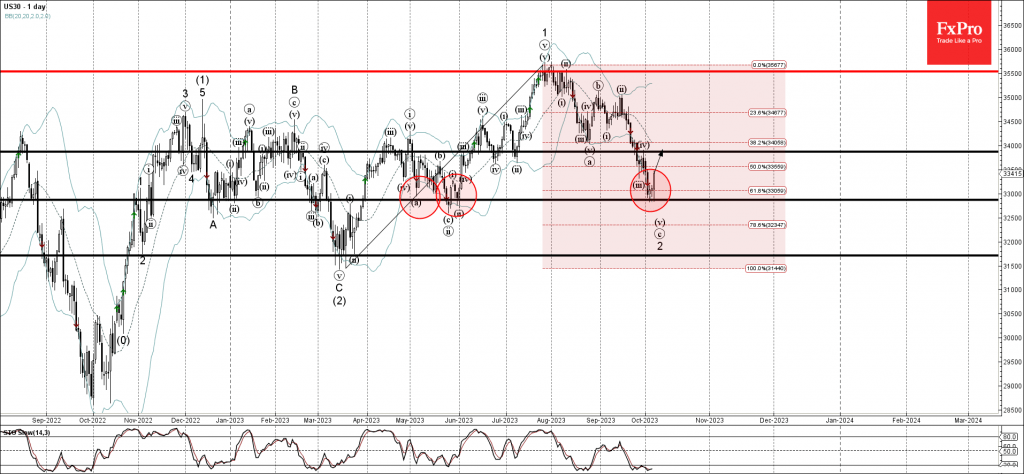
- Dow Jones reversed from support level 32875.00
- Likely to rise to resistance level 33875.00
Dow Jones index recently reversed up from the pivotal support level 32875.00 (which has been reversing the price from May), coinciding with the lower daily Bollinger Band and the 61.8% Fibonacci correction of the upward impulse from March.
The upward reversal from the support level 32875.00 stopped the c-wave of the active ABC correction 2 from the end of July.
Given the still oversold daily Stochastic, Dow Jones index can be expected to rise further toward the next resistance level 33875.00 (top of the earlier wave iv).
AUDJPY Wave Analysis
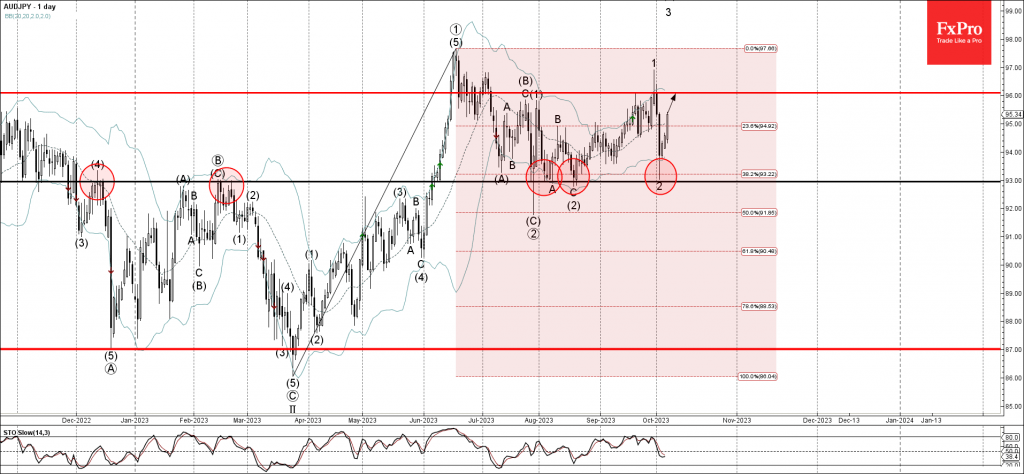
- AUDJPY reversed from support level 93.00
- Likely to rise to resistance level 96.00
AUDJPY currency pair recently reversed up from the key support level 93.00 (former monthly high from February) coinciding with the 38.2% Fibonacci correction of the upward impulse from March.
The upward reversal from the support level 93.00 started the active short-term impulse wave 3.
Given the strengthening yen sales, AUDJPY currency pair can be expected to rise further toward the next resistance level 96.00 (which reversed the pair last month).
Forex and Cryptocurrencies Forecast
EUR/USD: Will the Pair Reach 1:1 Parity?
Throughout 2023, the U.S. economy has effectively withstood aggressive interest rate hikes. The market-anticipated recession has yet to materialize, allowing the Federal Reserve to maintain its hawkish monetary stance. This has led to a sharp increase in Treasury yields and significant strengthening of the U.S. dollar. The yield on 10-year Treasuries plummeted 46% since March 2020, doubling the previous decline witnessed in 1981 amid aggressive monetary tightening by the U.S. central bank. As for the Dollar Index (DXY), it has remained above the critical level of 100.00 throughout the year, while EUR/USD has dropped 6.5% from its July highs.
On Tuesday, March 3, the yield on 10-year U.S. Treasury bonds reached 4.88%. Many market participants believe that a 5.0% yield could be a tipping point for the U.S. economy, forcing the Federal Reserve into a dovish pivot. However, these are merely expectations that may be far from reality. On the same Tuesday, Loretta J. Mester, President of the Federal Reserve Bank of Cleveland, stated that inflation is only expected to reach the target level of 2.0% by the end of 2025. She indicated that there are no immediate plans to lower interest rates and, furthermore, she is likely to support an interest rate increase at the next Federal Open Market Committee (FOMC) meeting if the current economic situation remains stable.
The U.S. macroeconomic data released in the first half of the past week appeared somewhat lacklustre. The ADP report revealed the weakest employment growth in the private sector since January 2021, coming in at a mere 89K, against a forecast of 153K (and down from 180K the previous month). While business activity in the services sector did continue to grow for the ninth consecutive month, it decelerated in September, with the PMI index falling from 54.5 to 53.6. As for the manufacturing sector, business activity remained in contraction territory, with a PMI of 49.0. Although this was an improvement over the previous 47.6, it still fell below the 50.0 threshold, indicating economic contraction. As a result, Treasury yields declined, and stock indices (S&P 500, Dow Jones, and Nasdaq) along with EUR/USD turned upwards. Traders opted to liquidate their short positions on the pair in anticipation of the U.S. September labour market report, traditionally scheduled to be published on the first Friday of the following month, which in this case was October 6. More on this below.
If the latest U.S. statistics appeared unimpressive, the Eurozone's figures were even worse. According to official data from Eurostat published on Wednesday, October 4, retail sales in August contracted by 1.2% month-on-month, compared to a 0.1% decline in July. The market consensus had projected a decrease of only 0.3%. On an annual basis, the volume of retail sales fell by 2.1%, exceeding both July's 1.0% decline and the market forecast of 1.2%. Monthly Producer Price Inflation (PPI) in the Eurozone rose from 0.5% in July to 0.6% in August.
Assessing the inflation outlook in the Eurozone, the European Central Bank (ECB)'s Chief Economist, Philip Lane, cautiously stated that "we will not reach our 2% inflation target as quickly as we would the 4% mark." ECB Governing Council member Peter Kazimir was slightly more optimistic. "Core Eurozone inflation confirms our expectations," the official noted. "We are on a downward trajectory. [However], deflating inflation is taking a bit more time." Kazimir believes that September's 25 basis point rate hike in the Euro was the last one.
We have previously noted that there is no consensus within the ECB's leadership regarding future monetary policy. This was further confirmed by ECB Governing Council member Isabel Schnabel, who countered Peter Kazimir by stating that further rate hikes may eventually be necessary. She added that although the ECB currently does not foresee a deep downturn, "we cannot rule out a recession" going forward.
If the prospect of higher Euro borrowing costs remains uncertain, a rate reduction at this stage is definitely not on the table. This was confirmed on Thursday, October 5th, by ECB Vice-President Luis de Guindos, who stated that discussions about rate cuts are premature. Since the Federal Reserve also has no plans to turn dovish from its hawkish stance, the current interest rate differential of 5.50% for the dollar and 4.50% for the Euro gives a certain advantage to the American currency. The Reuters expert consensus forecast expects EUR/USD to further decline to $1.0400 within October, with 1 out of 20 surveyed specialists anticipating a 1:1 parity. Nonetheless, analysts predict that EUR/USD will rise by approximately 6% over the next year.
The highlight of the past week was the U.S. employment report. Bloomberg experts had anticipated that the number of new non-farm payroll jobs (NFP) created in September would be lower than in August: 70K compared to 187K the previous month. In reality, the figure came in at 336K, almost twice as high as the forecast. Meanwhile, the unemployment rate remained unchanged at 3.8%.
Following the release of this data, which attests to the health of the American job market, EUR/USD initially declined but then quickly regained its footing and even advanced. As a result, the pair closed the trading week at the 1.0585 level. As of the evening of October 6th, when this overview was written, experts are equally divided on its near-term future, just like a week ago: a third are predicting further strengthening of the dollar and a decline in EUR/USD, another third anticipate an upward correction, and the final third are neutral.
As for technical analysis, among the trend indicators on the D1 chart, 65% favour the downside (red), and 35% are bullish (green). Most oscillators (60%) continue to side with the U.S. currency and are coloured red. Just 10% favour the euro, and half of those indicate overbought conditions. The remaining 30% hold a neutral stance.
Immediate support for the pair is found in the 1.0550-1.0560 area, followed by 1.0490, 1.0450, 1.0375, 1.0255, 1.0130, and 1.0000. Resistance for the bulls is situated around 1.0600-1.0615, followed by 1.0670-1.0700, 1.0745-1.0770, 1.0800, 1.0865, and 1.0895-1.0930.
In the upcoming week, on Wednesday, October 11, inflation data for Germany (CPI) and the U.S. (PPI) will be released. On the same day, the minutes from the last FOMC meeting will be published, offering investors insights into the committee members' views on future monetary policy. Thursday, October 12th, is likely to experience increased volatility, as consumer inflation data (CPI) for the United States will be announced. Additionally, the traditional weekly report on initial jobless claims in the U.S. will be released on Thursday. The week will wrap up with the publication of the University of Michigan's Consumer Confidence Index on October 13 Traders should also be aware that Monday, October 9th, is a public holiday in the U.S., in observance of Columbus Day.
GBP/USD: Worst Currency of September
The British pound emerged as the worst performing G10 currency in September. Fuelling speculation about its future, the Bank of England (BoE) released a report on Thursday, October 5, indicating a significant rise in wages in the country. Expectations for wage growth over the next year also increased compared to August.
Certainly, the recent moderation in inflation is a positive development. However, economists at Germany's Commerzbank suggest that the wage growth dynamics indicate that inflation may be more stubborn than the Bank of England anticipates.
Survey results, also released on October 5, suggest that many market participants believe the BoE is not taking sufficient measures to combat rising prices. On the other hand, strategists at Japan's MUFG Bank argue that the "Bank of England has already gone too far in tightening policy." They write, "We see the potential for lower rates compared to other leading developed economies." There are clearly differing opinions, but one thing both camps agree on is that the British currency will continue to remain under pressure. At least until there is compelling evidence of sustainable declines in the inflation rate.
GBP/USD began the past week at a level of 1.2202 and returned almost to the same point ahead of the release of the U.S. employment report on Friday, October 6. The robust Non-Farm Payroll (NFP) data temporarily strengthened the dollar. The week concluded with the European currency gaining the upper hand, closing the pair at 1.2237. However, the chart of the past two weeks still suggests a sideways trend. Analyst opinions on the pair's immediate future are as follows: 40% are bullish, another 40% are bearish, and the remaining 20% hold a neutral stance. Among trend indicators on the D1 chart, 65% are red, while 35% are green. As for the oscillators, 40% point to a decline in the pair, 10% point to an increase (all in the overbought zone), and the remaining 50% are neutral.
In a downward movement, the pair will find support levels and zones at 1.2195-1.2205, 1.2100-1.2115, 1.2140-1.2150, 1.2085, 1.2040, 1.1960, and 1.1800. If the pair rises, it will encounter resistance at levels of 1.2270, 1.2330, 1.2440-1.2450, 1.2510, 1.2550-1.2575, 1.2600-1.2615, 1.2690-1.2710, 1.2760, and 1.2800-1.2815.
Fresh GDP data for the United Kingdom is expected to be released on Thursday, October 12. After experiencing a decline of -0.5% in July, the indicator is anticipated to show a 0.2% growth on a monthly basis for August. No other significant economic events related to the country are expected for the upcoming week.
USD/JPY: Was There Really an Intervention?
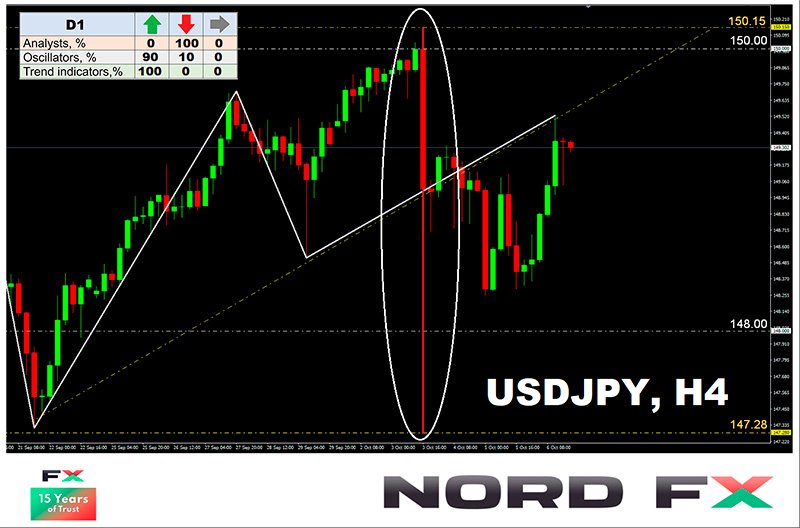
We suggested in our previous review that the "magic" number of 150.00 would serve as a signal to Japanese financial authorities to initiate currency interventions. Indeed, after USD/JPY slightly crossed this threshold on Tuesday, October 3, reaching a high of 150.15, the long-anticipated event occurred, within a matter of minutes, the pair plummeted nearly 300 points, halting its freefall at 147.28.
The prevailing market sentiment is that the Bank of Japan (BoJ) has finally moved from verbal interventions to actual ones. Interestingly, the country's Finance Minister, Shunichi Suzuki, declined to comment on whether there was indeed a currency intervention. He merely obfuscated the issue by stating that "many factors determine whether movements in the currency market are excessive," and that "no changes have been made in how the government will address these issues." In short, interpret it as you will.
Of course, one cannot rule out the mass triggering of stop-orders upon breaching the key level of 150.00 (such "black swans" have been observed before). However, we believe that the episode was unlikely to have occurred without intervention from Japan's financial authorities.
After the sharp decline, the price has rebounded and is now approaching the ascending trend line from below. Whether the Bank of Japan's intervention (if it indeed occurred) has achieved its goal is difficult to say. Recalling similar scenarios from last autumn, the impact of such actions seemed to be only temporary, with market conditions reverting back to their previous state within a couple of months. However, could this latest move serve as a significant deterrent for USD/JPY bulls and allow the Japanese currency to regroup? The chances are there, particularly if the regulator actively intervenes to prevent the pair from rising back to the 150.00 level or higher.
The pair concluded the trading week at the 149.27 level. All 100% of the surveyed experts, invigorated by the events of October 10, voted for further yen strengthening and a downward movement for the pair. (It is worth noting here that even such unanimity offers no guarantees concerning the accuracy of the forecast.) Trend indicators on the D1 chart hold the opposite view—all 100% are still coloured in green. Among the oscillators, slightly fewer, 90%, remain in the green zone, with 10% having turned red. The nearest support level lies in the 149.15 area, followed by 148.80, 148.30-148.45, 147.95-148.05, 146.85-147.25, 145.90-146.10, 145.30, 144.45, 143.75-144.05, 142.20, 140.60-140.75, 138.95-139.05, and 137.25-137.50. Immediate resistance is at 149.70-150.15, followed by 150.40, 151.90 (the October 2022 high), and 153.15.
No significant economic data related to the state of the Japanese economy is scheduled for release in the upcoming week. Additionally, the country will be observing a public holiday on Monday, October 9, in celebration of National Sports Day.
CRYPTOCURRENCIES: Uptober's Target is $30,000
As Q3 closed on September 30, the BTC/USD trading pair saw a 12% drop. Despite setbacks in July and August, bitcoin experienced its first profitable September since 2016, increasing from $26,012 to $26,992 within the month. TradingView data also highlighted a 6.1% rise in the market capitalization of the cryptocurrency sector, moving from approximately $1.029 trillion at the beginning of September to $1.092 trillion by month's end.
Ran Neuner, the founder of Crypto Banter and a seasoned trader, underscored the importance of bitcoin's positive performance in September. He noted that in a year prior to a halving event, such as in 2015, a profitable September has historically been followed by a 70% surge in Q4. Analysts at Bitfinex echoed this sentiment, suggesting that a green September often presages a bullish trend in October.
The Bitfinex Alpha report further substantiated an optimistic forecast for October, citing futures market indicators. The data revealed that the current price is being maintained by a balance between short-term and long-term holders, implying that experienced long-term investors are steadfast in holding their coins. Furthermore, bitcoins that have been held for 6 to 12 months are predominantly dormant, and the supply of BTC that is over three years old has remained inactive since February 2023.
Santiment, a network analytics firm, reported that larger wallets, known as whales and sharks, holding between 10 and 10,000 BTC, have been quietly stockpiling both bitcoin and Tether (USDT) for the last six weeks. Their collective holdings have now reached a 2023 high of 13.03 million BTC, pointing to a promising long-term outlook for bitcoin.
It's well known that October follows September, and many investors have high hopes for this month. According to statistics, in the last eight years, bitcoin has only ended the month of October in the red once, in 2018. In other years, the monthly gains ranged from 5.5% to 48.5%. If we consider the entire history of the leading cryptocurrency, October has been a profitable month in eight out of ten instances, with an average gain of 22%. This seasonal phenomenon has been dubbed "Uptober."
The early days of October provided hope that the tradition of "Uptober" would continue in 2023. On Monday, October 2, bitcoin reached a local peak of around $28,562. However, disappointment set in later that same day as traders began to lock in profits, causing the coin to drop to the $27,500 zone. Bloomberg strategist Mike McGlone believes that this pullback was inevitable. Pressure tends to build when the digital currency gains value aggressively. Increased volatility is accompanied by heightened seller activity, as they aim to capitalize on the asset's surge.
McGlone is sceptical that bitcoin will reach $30,000 in the near future. The main factor hindering further growth of bitcoin is the strict policies of U.S. authorities. The repressive actions of the Securities and Exchange Commission (SEC) are deterring institutional investors from entering the crypto space. Global recession risks are also dampening risk appetite. In such a scenario, stock markets will not be able to grow, emphasizes the Bloomberg strategist, adding that digital currencies will also suffer as a result.
Analysts at QCP Capital also believe that the resistance level for BTC/USD will be between $29,000 and $30,000. They warn that, despite the positive seasonality, the possibility of retesting the $25,000 level should not be ruled out.
However, not everyone agrees with this view. For example, a trader going by the handle "Bluntz" is confident that bitcoin has "officially" entered bullish territory and that all predictions of a drop to the $24,000 level are unfounded. In his opinion, the coin's rise above $27,000 confirms that bitcoin is currently in a bull market. "I think it's time to shed any bearish biases," wrote Bluntz.
Another well-known trader, analyst, and founder of the venture firm Eight, Michael Van De Poppe, is optimistic not only about October but also about Q4 2023 as a whole. The expert anticipates that growth in the final quarter could push the flagship cryptocurrency up to the $40,000 mark. However, it's worth noting that while historical data overwhelmingly favors October, the quarterly dynamics of bitcoin are not so clear-cut. For instance, the digital asset appreciated by 142.2% in 2017, but the following year it lost almost half its value over three months.
In our previous review, we reported that the Artificial Intelligence from CoinCodex had forecasted the flagship cryptocurrency to reach a value of $29,703 by Halloween (October 31). This time, another AI, the machine learning algorithm from the forecasting platform PricePredictions, has given a similar result. According to its analysis, the price of bitcoin will hover around the psychologically significant mark of $30,403 on October 31. This forecast was made using several key technical indicators, including the Moving Average Convergence Divergence (MACD), the Relative Strength Index (RSI), Bollinger Bands (BB), among others.
Concerning Ethereum, the primary competitor to bitcoin, an analyst known as Dave the Wave anticipates that Ethereum will sustain its depreciation against bitcoin at least through the end of 2023. Dave the Wave has published a trend chart for ETH/BTC, highlighting a descending triangle indicative of a price drop for the altcoin.
Drawing a comparison with trends from 2017 to 2018, Dave the Wave posits that Ethereum is poised for a significant devaluation relative to bitcoin, particularly due to a robust bitcoin rally. The potential for Ethereum to gain value appears limited to the so-called "altcoin season," which is projected to begin after bitcoin achieves its peak price.
As of the time of writing this review, on the evening of Friday, October 6, BTC/USD is trading in the area of $27,960, ETH/USD at $1,640, and ETH/BTC at 0.0588. The total market capitalization of the cryptocurrency market stands at $1.096 trillion, up from $1.075 trillion a week ago. The Crypto Fear & Greed Index for bitcoin has risen by 2 points over the week and currently sits squarely in the Neutral zone, at a score of 50.
Genuine Confidence on the Economy or Simply a Mirage; Dollar in Search of Answers
In a week brimming with financial intricacies, the most surprising element was the remarkable bounce-back in US stocks post the release of the compelling non-farm payroll report. Conventional wisdom would suggest that such a robust report would serve to reinforce Fed's inclination towards prolonging its restrictive monetary policy, even if it doesn't proceed with another rate hike.
Amidst this, a significant backdrop event was the soaring treasury yields, particularly in the long end, which tightens up financial conditions significantly. The yield curve's brisk return to normalcy, additionally, would typically sound alarms of an impending recession.
Yet, curiously, the anticipated bearish impact on stocks and bullish momentum for Dollar remained elusive. This puzzling disconnect raises critical questions: Is the market's reaction an endorsement of their unwavering faith in the resilience of the US economy and the prospects of soft landing? Or is it a misjudgment that will soon be corrected? While the answer remains to be seen, what's undeniable is that the market's reaction has introduced a layer of complexity.
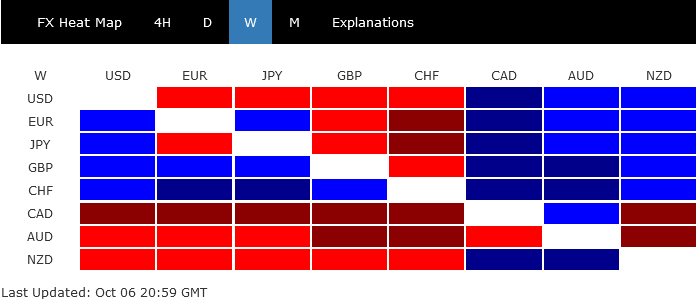
By the week's end, Dollar exhibited a mixed performance – gaining against commodity currencies but ceding ground to Yen and European majors. Yen's performance, despite unverified intervention by Japanese authorities, only marginally outpaced Dollar, leading to an essentially mixed finish. Swiss Franc and Sterling emerged as the week's star performers, with Euro not far behind. Conversely, Australian Dollar languished at the bottom, with Canadian and New Zealand Dollars keeping it company.
Post-NFP U-turn: Real sentiment shift or temporary reprieve?
The financial market threw a curveball that left many analysts and investors scratching their heads. In the wake of the release of an unexpectedly robust non-farm payroll report, US stocks, initially plunging, made an astonishing recovery. The S&P 500 and NASDAQ rallied to close the week with gains of 0.48% and 1.60% respectively, a remarkable turnaround underpinned by complex dynamics, while DOW registered just a marginal decline of -0.30%.
The sustainability of this unexpected rally is yet to be determined. As the market oscillates between caution and optimism, all eyes are on the upcoming CPI data, poised to either validate or challenge the prevailing market storylines.
A combination of factors seems to be at play. Some analysts speculate that traders, in anticipation of the forthcoming CPI data and recognizing a long US weekend on the horizon, opted to secure profits. Meanwhile, others recognized that robust September job growth, stable unemployment figures, and moderating wage inflation may be reinforcing the prospects of a more gradual economic deceleration or a "soft landing."
In the aftermath of the NFP, the prospects of an additional Federal Reserve rate hike have risen, albeit marginally, and remain below the pivotal 50% threshold. A growing narrative suggests Fed's focus is less on payroll growth and more intently centered on inflation. The fact that over the past quarter, average hourly earnings have climbed at an annual rate of 3.4% lends weight to this viewpoint. Such a trend, if persistent, aligns well with inflationary figures residing in the mid-to-lower 2% range.
Furthermore, some market watchers suggest that the recent sharp rise in treasury yields, inducing notable financial tightening, may alleviate some pressure on the Fed to introduce further policy adjustments. As articulated by San Francisco Fed President Mary Daly, such market adjustments have effectively "done the work" for Fed.
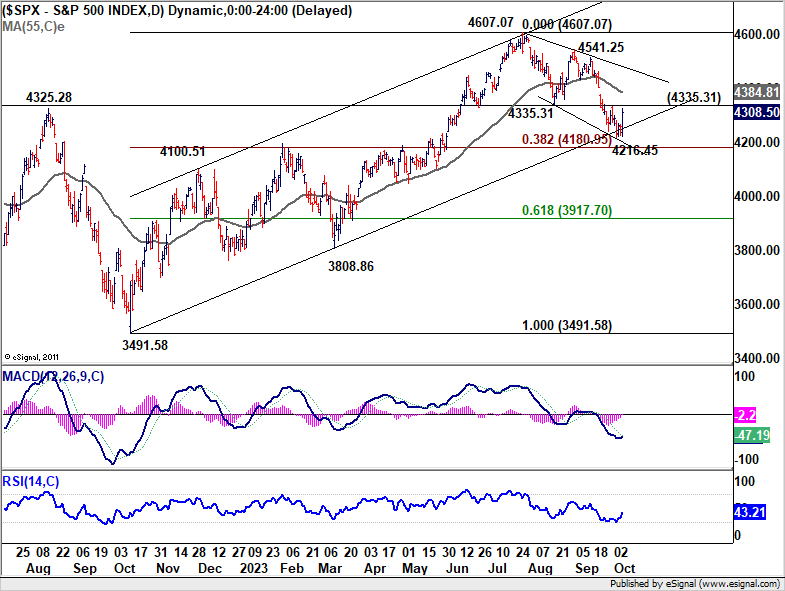
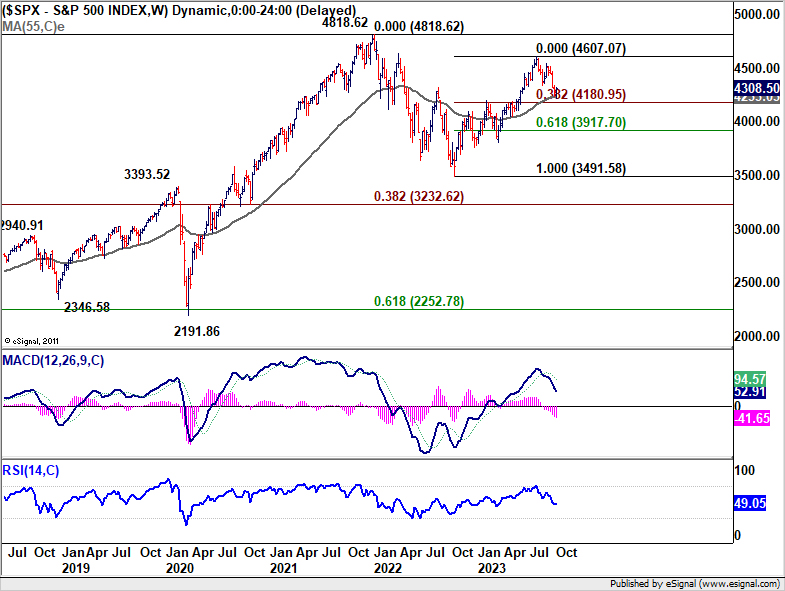
Now, an immediate question is whether S&P 500 has completed the correction from 4067.07 high. That came after drawing support from medium term rising channel, and above 38.2% retracement of 3491.58 to 4607.07 at 4180.95. To confirm this bullish case, there are two hurdles to overcome, 4335.31 support turned resistance, and 55 D EMA (now at 4384.81). In particular, sustained trading above 55 D EMA will strengthen the bullish case, and set the stage for resuming whole up trend from 3491.58.
US treasury yields skyrocket: Impending recession or robust economic signal?
US treasury market experienced significant tumult, particularly in long-term bonds. Both 10- and 30-year yields soared to peaks not seen since 2007. Despite a modest retraction as the week concluded, the surge in these yields was nothing short of striking.
Various economists offered insights into the possible catalysts behind the treasury sell-off. A faction among them emphasized bond investors' growing apprehensions about US government's escalating expenditures and the swelling budget deficit, with particular emphasis on rising costs of servicing the debt.
On a more sanguine note, Richmond Fed President Thomas Barkin alluded to the recent influx of positive economic data as a pivotal driver for these higher yields. By this logic, a thriving economy would cement the position of Federal Reserve interest rates, keeping them elevated for an extended period.
Yet, another prevailing argument revolves around the surge in bond supplies, fueled by copious fiscal issuance.
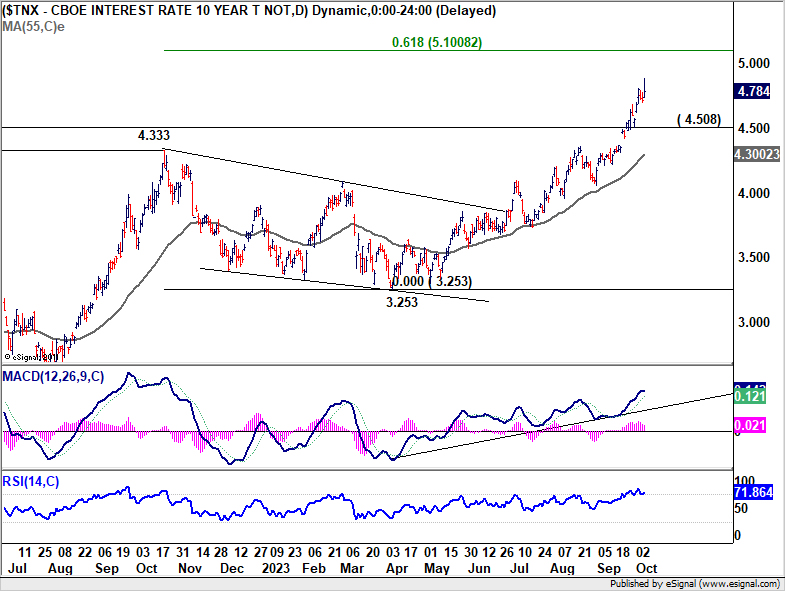
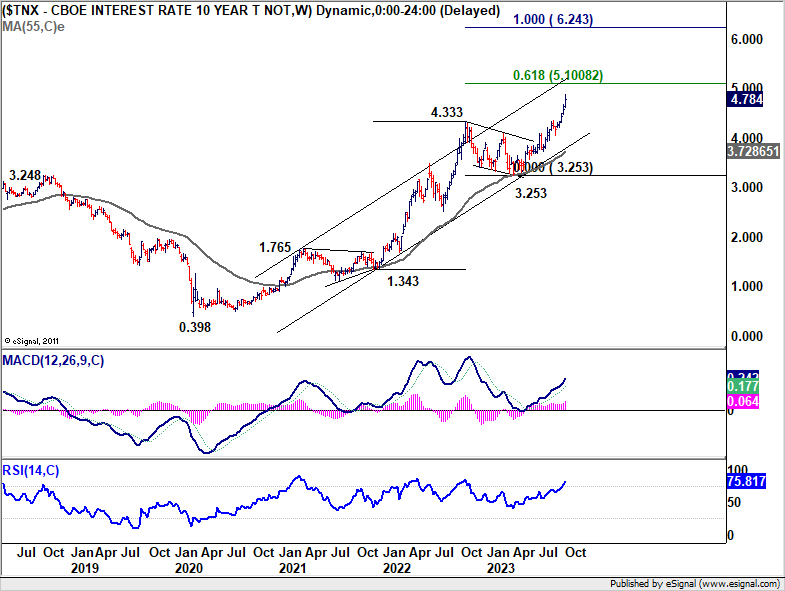
Reflecting on these dynamics, achieving a 10-year yield of 5% seems much less of a stretch today, compared to a mere two months back when it lingered below 4.3%.
From a technical standpoint, Technically, near term outlook in TNX will remain bullish as long as 4.508 support holds, in case of retreat. Current rally should target 61.8% projection of 1.343 to 4.333 from 3.253 at 5.100. Reaching this juncture would perfectly round off the five-wave uptrend originating from the 2020 low of 0.398.
Another intriguing trend to note in the treasury space is the swift normalization of yield curve – a phenomenon some are terming "de-inverting." The spread between the 2- and 10-year yields has slimmed dramatically, standing at a scant 30bps, in stark contrast to 108 bps just three months ago. With the 2-year yield presently pegged at 5.08%, we could witness a total disinversion any time.
Historically, a fully normalized yield curve has been regarded by many analysts, ourselves included, as a precursor to an impending recession.
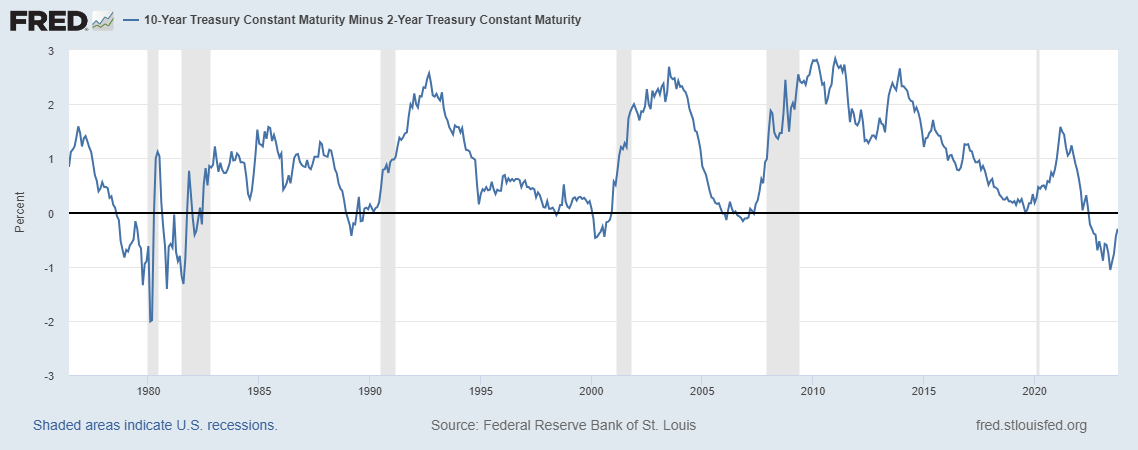
Many market observers, ourselves included, perceive a fully normalized yield curve as a harbinger of an oncoming recession. This notion is bolstered by historical trends that typically presage economic downturns. However, current job market statistics don't yet hint at such concerns. ISM manufacturing index is improving, while ISM services demonstrate consistent resilience.
It suggests that while potential economic headwinds might be on the horizon, they may need more time to manifest. Perhaps, it would take 10-year yield surpassing the aforementioned 5.1% projection or a definitive bearish pivot in stock trends to bring these concerns to the forefront.
Dollar Index pulls back, topped in short term already?
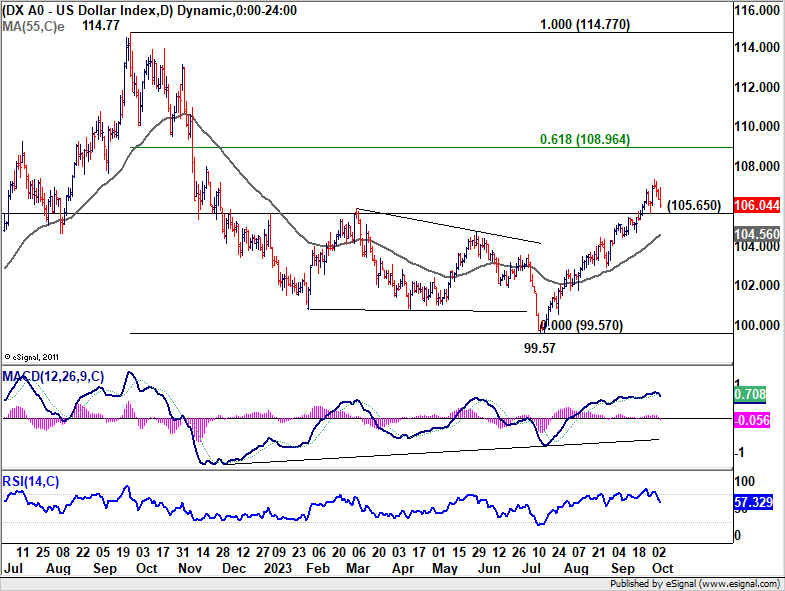
In a counterintuitive move against the backdrop of soaring benchmark yields, Dollar Index reversed course. After an initial surge to 107.34, it settled down, closing the week at 106.04. Immediate focus is now on 106.65 support in the next few days. Firm break there will confirm short term topping, and bring deeper pull back to 55 D EMA (now at 104.56). Strong support is expected from there contain downside and bring rebound.
Rise from 99.57 is seen as reversing the whole down trend from 114.77. Further rally is expected, even with interim consolidations, to 61.8% retracement of 114.77 to 99.57 at 108.96 next. This will remain the favored case as long as 55 D EMA is not sustainably violated.
Japan silent on intervention, but expands view on excessive volatility
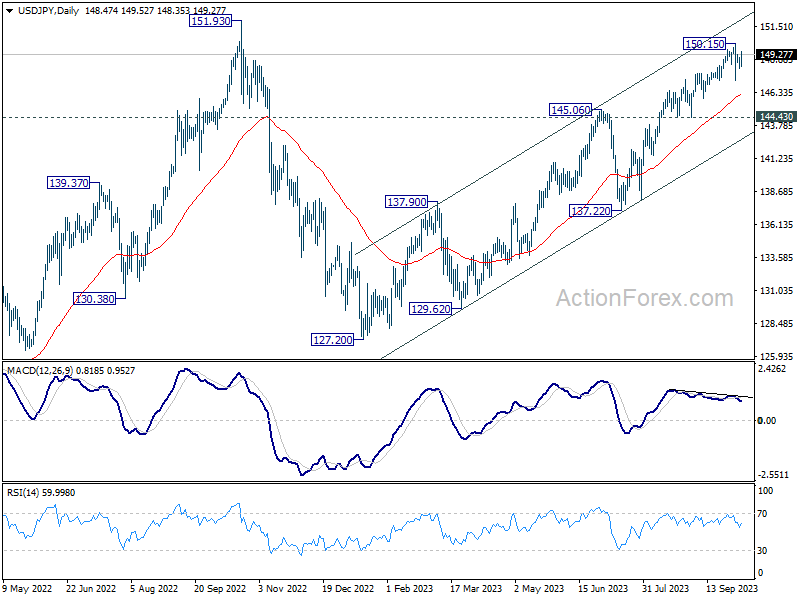
Another important development was Japan's possible intervention when USD/JPY momentarily surpassed 150 mark. This swift intervention, though not explicitly confirmed, resulted in USD/JPY plunging to 147.28 within just five minutes. However, the pair showed resilience, steadily regaining its footing as the week progressed.
Japan's reticence on its active role in the currency markets became evident when top officials refrained from acknowledging their intervention. This raises a pertinent question: What drives Japan's decision to step in? Finance Minister Shunichi Suzuki, when probed if the 150 level serves as an intervention trigger, clarified, "Currency levels are not our criteria. It is volatility that matters."
However, this statement leads to further curiosity regarding Japan's interpretation of "volatility". The recent depreciation of Yen over the last three months doesn't appear sharp, especially when juxtaposed against the entire trajectory of 2022. This has left market observers speculating on Japan's rationale.
In what could be an enlightening insight into Japan's stance, the nation's chief currency diplomat, Masato Kanda, elucidated, "If currencies move too much on a single day or, say, a week, that's judged as excess volatility." Kanda added another dimension, noting, "Even if that's not the case, if we see one-sided moves accumulate into very big moves in a certain period of time, that's also excess volatility."
Through Kanda's elucidation, it becomes apparent that Japan's intolerance isn't confined to rapid depreciations but extends to gradual, yet "accumulated" devaluations of the Yen, unfolding over extended durations.
Technically speaking, while some fluctuations are likely in the near term, there is no indication of bearish reversal in USD/JPY as long as 144.45 support holds. A test on 151.93 high is still the favored case, even the road could be bumpy.
AUD/USD Weekly Report
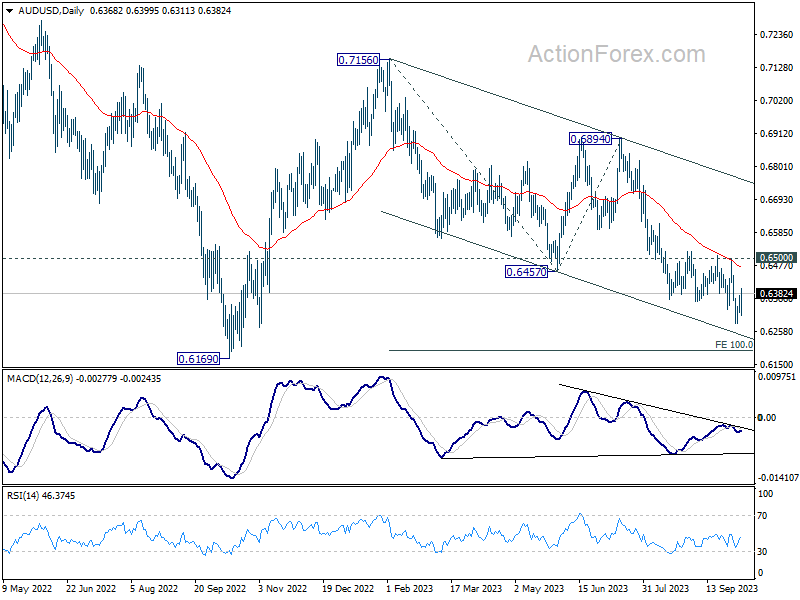
AUD/USD's decline from 0.7156 resumed last week and fell to 0.6284. But a temporary low was then formed with subsequent recovery. Initial bias remains neutral this week for consolidations. Outlook will stay bearish as long as 0.6500 resistance holds. Below 0.6284 will resume the fall from 0.7156. Next target is 100% projection of 0.7156 to 0.6457 from 0.6894 at 0.6195.
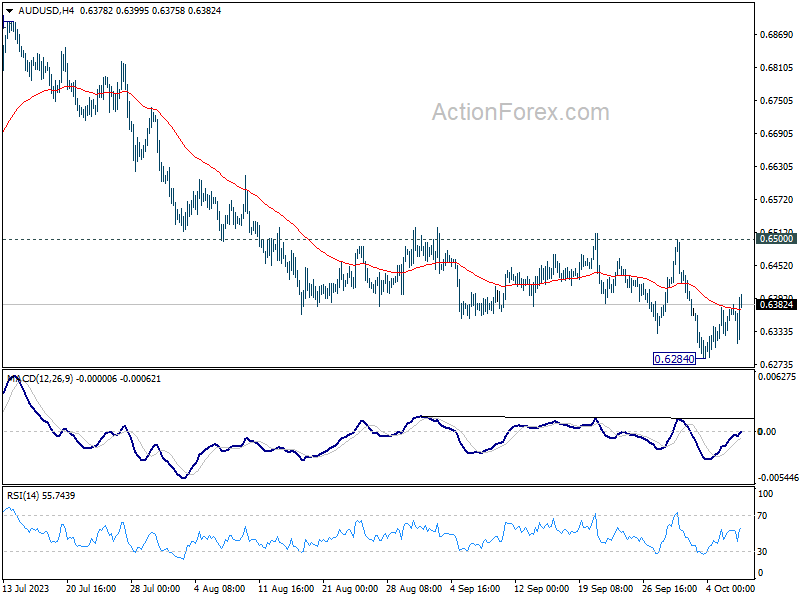
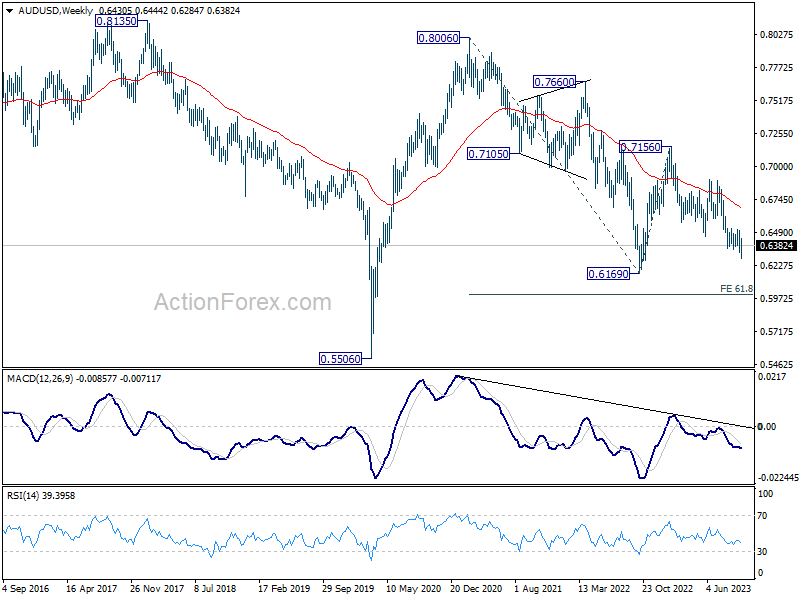
In the bigger picture, down trend from 0.8006 (2021 high) is possibly still in progress. Decisive break of 0.6169 will target 61.8% projection of 0.8006 to 0.6169 to 0.7156 at 0.6021. This will now remain the favored case as long as 0.6894, in case of strong rebound.
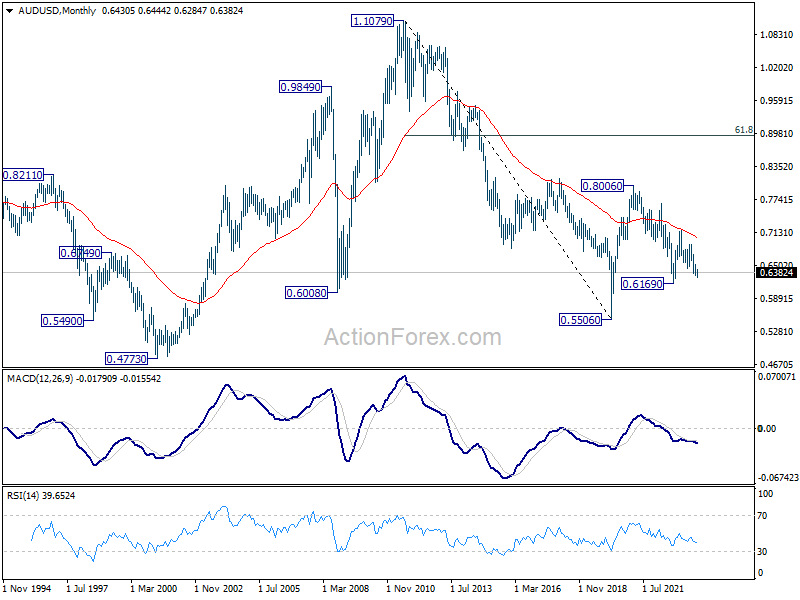
In the long term picture, while fall from 0.8006 might extend lower, the structure argues that it's merely a correction to rise from 0.5506 (2020 low). In case of downside extension, strong support should emerge above 0.5506 to bring reversal. But still, momentum of the next move will be monitored to adjust the assessment.
EUR/USD Weekly Outlook
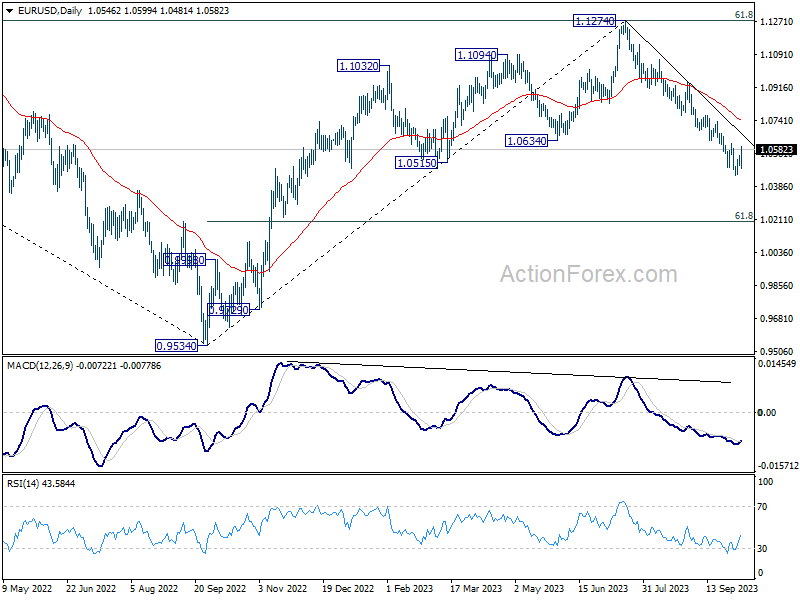
EUR/USD's recovered after dipping to 1.0447 last week. Initial bias remains neutral this week first. On the upside, firm break of 1.0616 resistance will confirm short term bottoming, and turn bias back to the upside for stronger rebound. Nevertheless, rejection by 1.0616 will retain near term bearishness. Break of 1.0447 will resume the fall from 1.1274 to 1.0199 fibonacci level next.
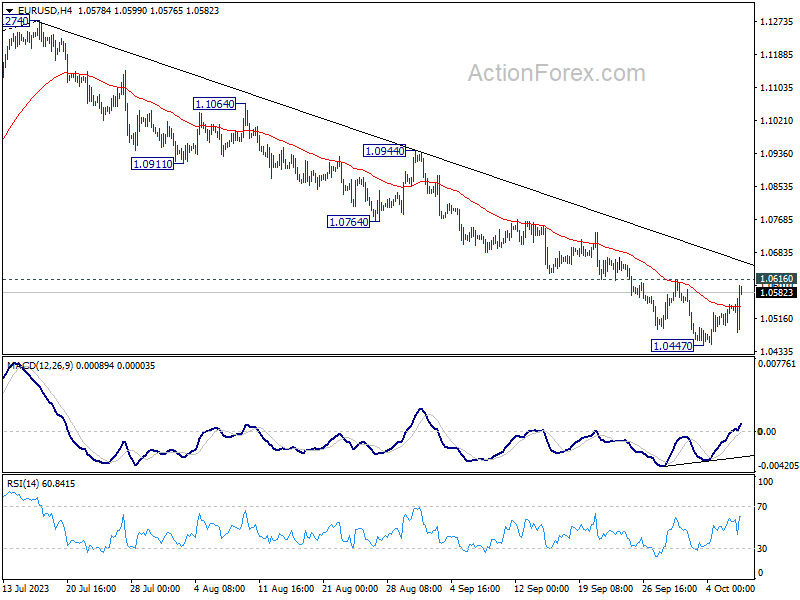
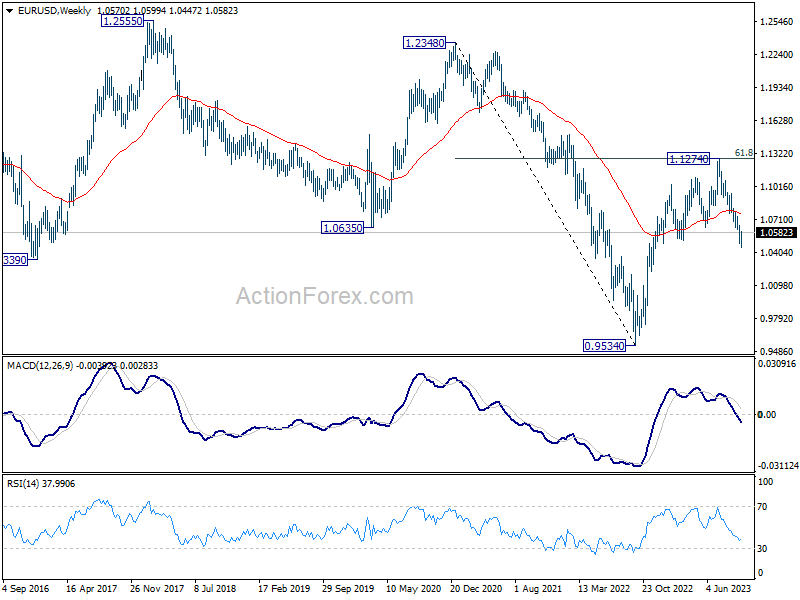
In the bigger picture, fall from 1.1274 medium term top could still be a correction to rise from 0.9534 (2022 low). But chance of a complete trend reversal is rising. In either case, current fall should target 61.8% retracement of 0.9534 to 1.1274 at 1.0199 next. For now, risk will stay on the downside as long as 55 D EMA (now at 1.0737) holds, in case of rebound.
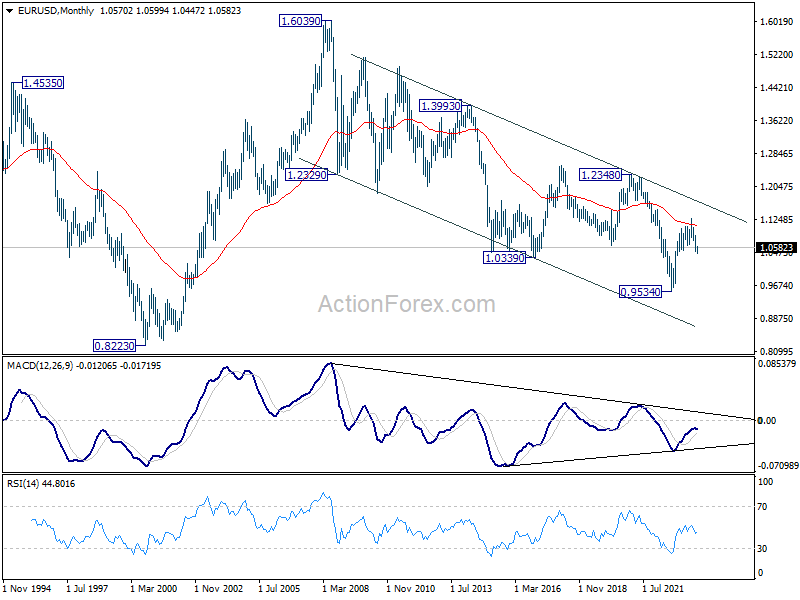
In the long term picture, there is no clear sign of trend reversal yet. That is, down trend from 1.6039 (2008 high) might still be in progress. Rejection by 55 M EMA (now at 1.1087) will retain long term bearishness, for another fall through 0.9534 at a later stage.
USD/JPY Weekly Outlook
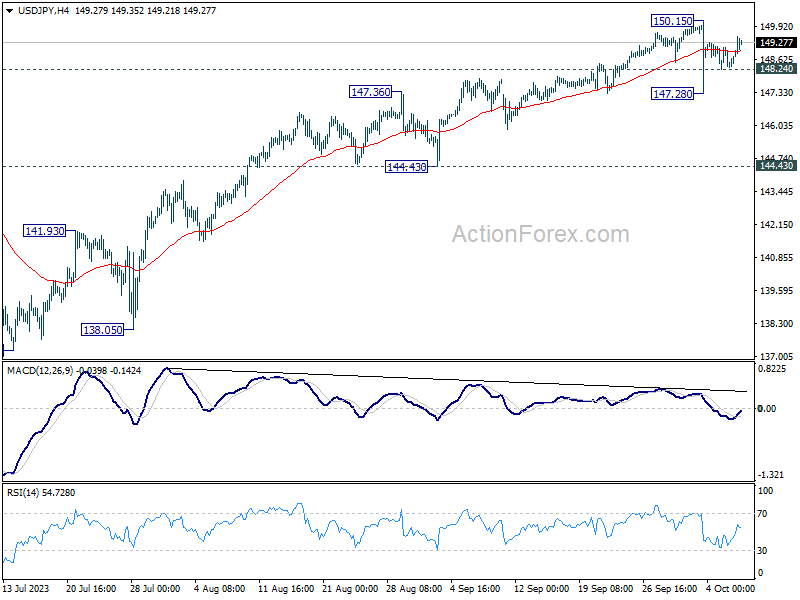
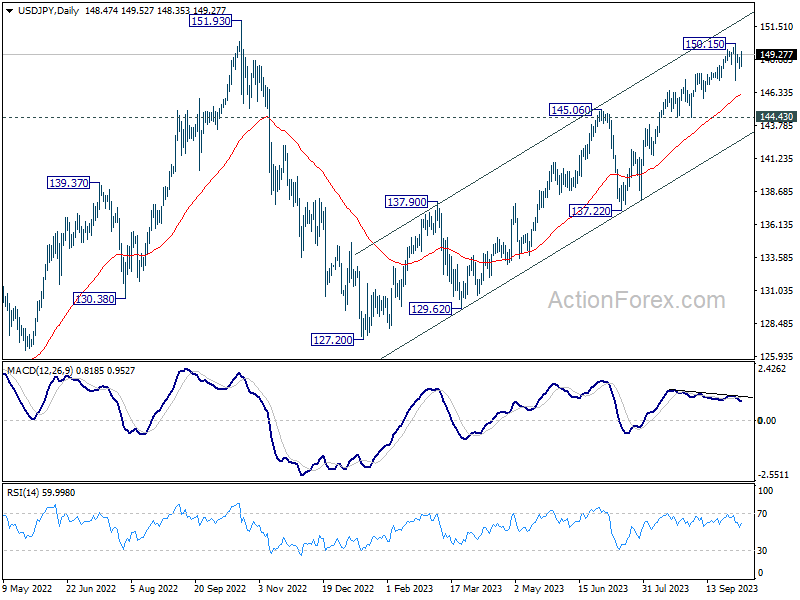
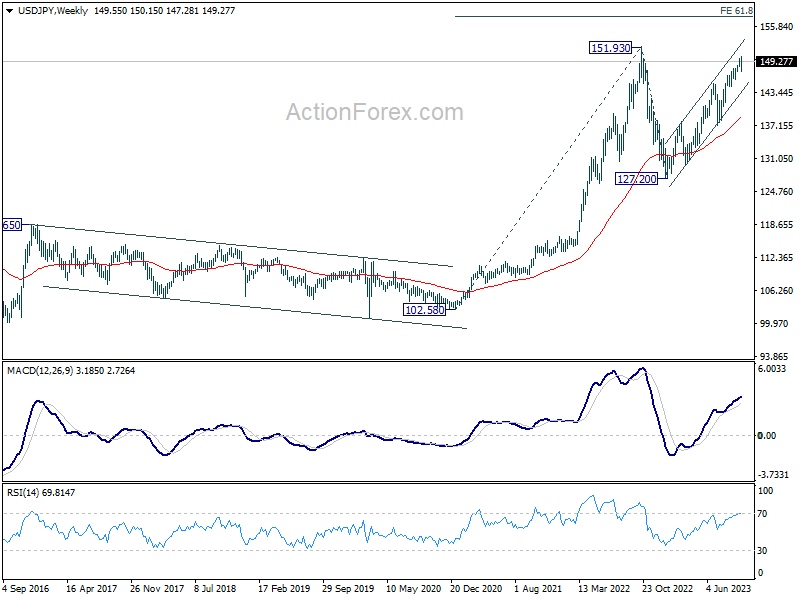
USD/JPY's steep pull back from 150.15 last week indicates short term topping. More consolidations would be seen in the near term. On the downside, below 148.24 minor support will turn bias to the downside for another down leg through 147.28. But there is no confirmation of bearish trend reversal before firm break of 144.43 support. Another rally remains mildly in favor through 150.15 to retest 151.93 high.
In the bigger picture, while rise from 127.20 is strong, it could still be seen as the second leg of the corrective pattern from 151.93 (2022 high). Rejection by 151.93, followed by sustained break of 145.06 resistance turned support will be the first sign that the third leg of the pattern has started. However, sustained break of 151.93 will confirm resumption of long term up trend.
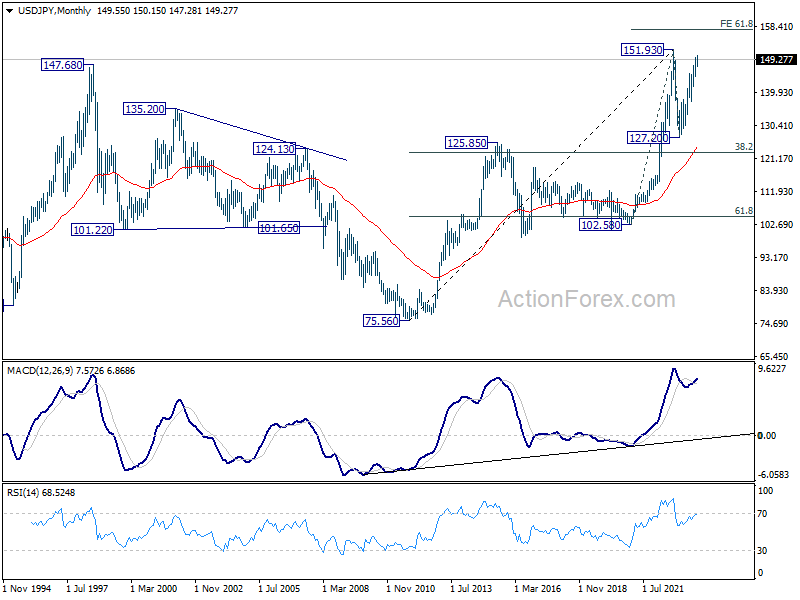
In the long term picture, price action from 151.93 is seen as developing into a corrective pattern to up trend from 75.56 (2011 low). Another falling leg could be seen, but in that case, downside should be contained by 38.2% retracement of 75.56 to 151.93 at 122.75. On resumption, next target would be 61.8% projection of 102.58 to 151.93 from 127.20 at 157.69.
GBP/USD Weekly Outlook
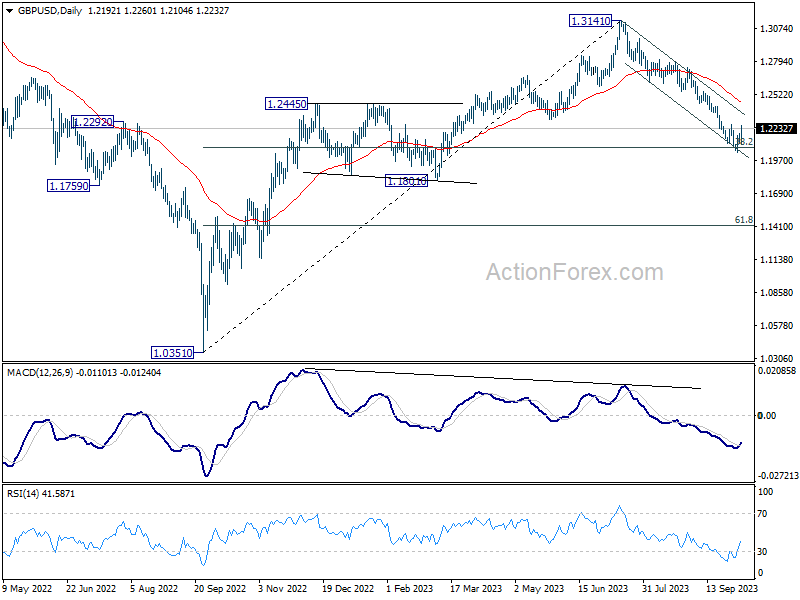
GBP/USD recovered after edging lower to 1.2036 last week. Initial bias remains neutral this week first. On the upside, firm break of 1.2270 resistance will confirm short term bottoming. Intraday bias will be back to the upside for stronger rebound. Nevertheless, rejection by 1.2270 will retain near term bearishness. Decisive break of 1.2075 fibonacci level would carry larger bearish implication and target 1.1801 support next.
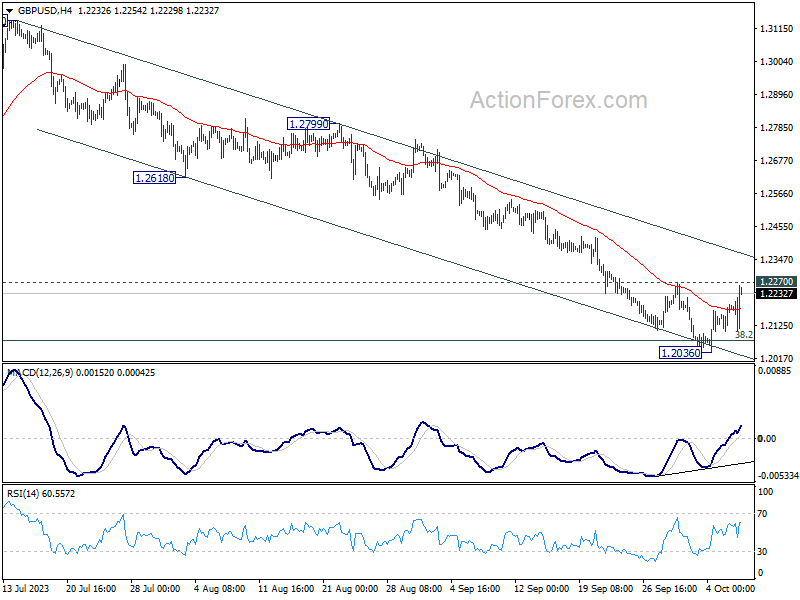
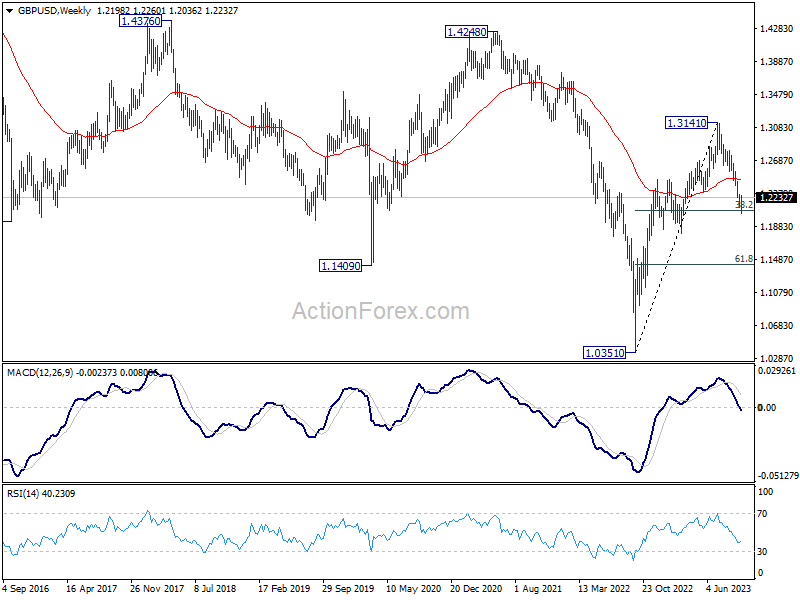
In the bigger picture, fall from 1.3141 medium term top could still be a correction to up trend from 1.0351 (2022 low) only. But risk of complete trend reversal is rising. Sustained break of 38.2% retracement of 1.0351 to 1.3141 at 1.2075 will pave the way to 61.8% retracement at 1.1417. For now, risk will stay on the downside as long as 55 D EMA (now at 1.2456) holds, in case of rebound.
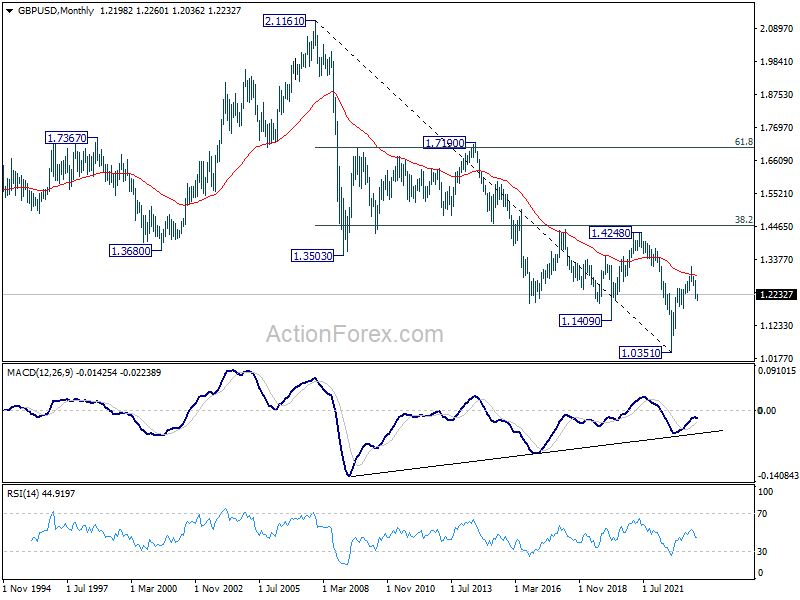
In the long term picture, there is no clear sign of trend reversal yet. Rise from 1.0351 could be part of a consolidation pattern to down trend from 2.1161 (2007 high). Rejection by 55 M EMA (now at 1.2900) will retain long term bearishness for extending the down trend at a later stage.
USD/CHF Weekly Outlook
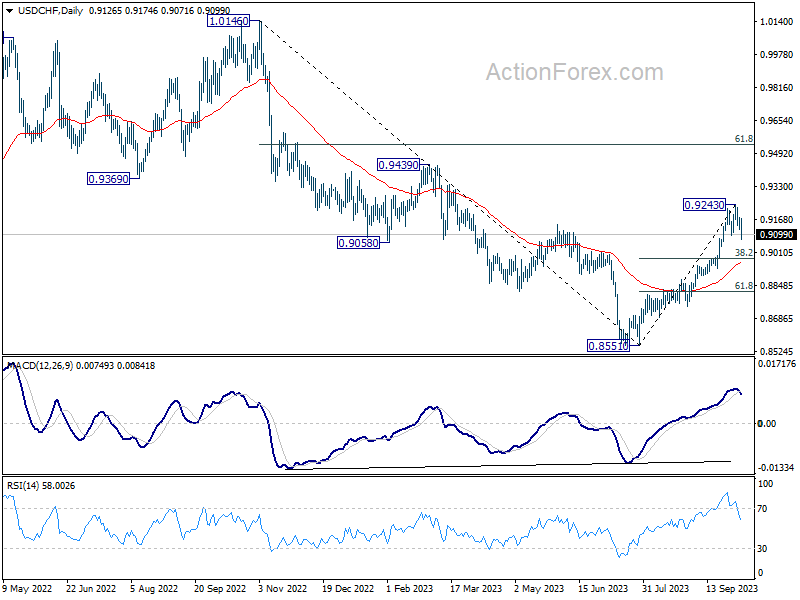
USD/CHF edged higher to 0.9243 last week, but subsequent pull back and breach of 0.9089 support indicates short term topping. Initial bias is mildly on the downside this week. Deeper fall would be seen to 38.2% retracement of 0.8551 to 0.9243 at 0.8979. On the upside, though, above 0.9176 minor resistance will turn bias back to the upside for retesting 0.9243.
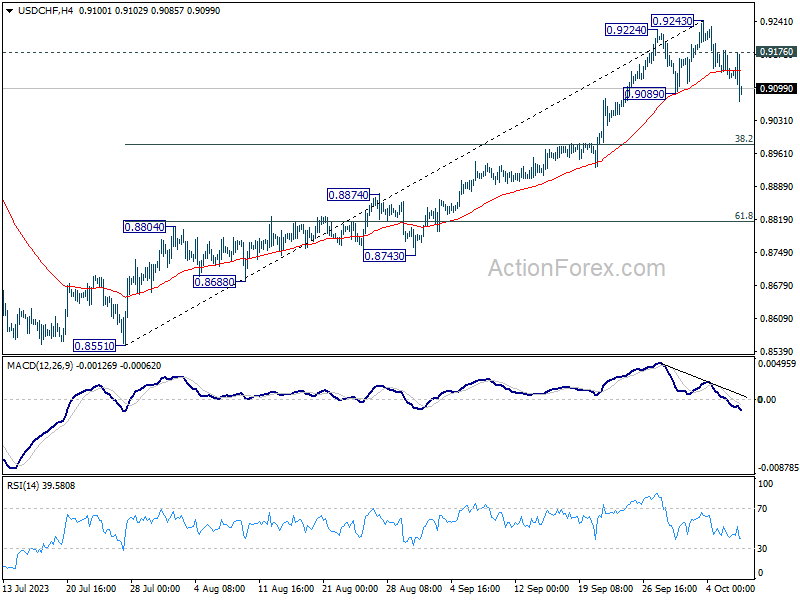
In the bigger picture, current development indicates that rise from 0.8551 is reversing whole down trend from 1.0146. Further rally would then be seen to 61.8% retracement at 0.9537 and above. For now, this will be the favored case as long as 55 D EMA (now at 0.8962) holds, even in case of deep pullback.
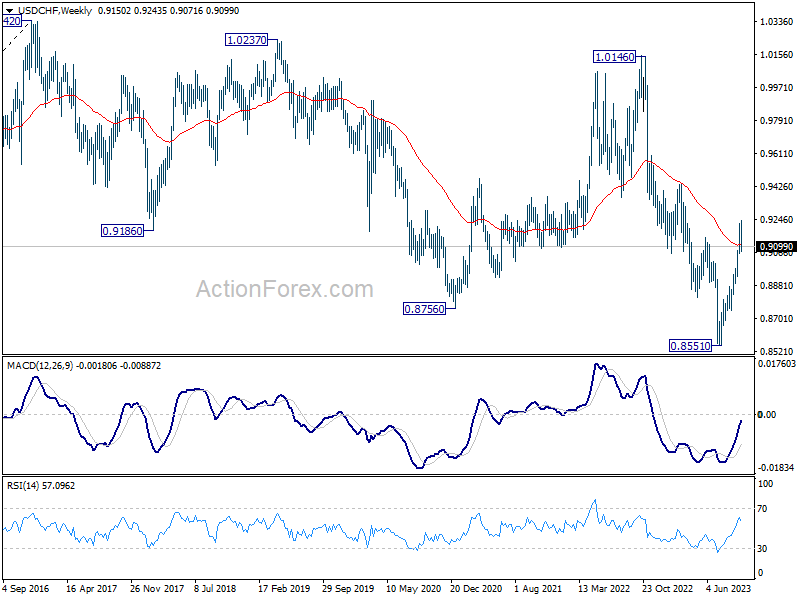
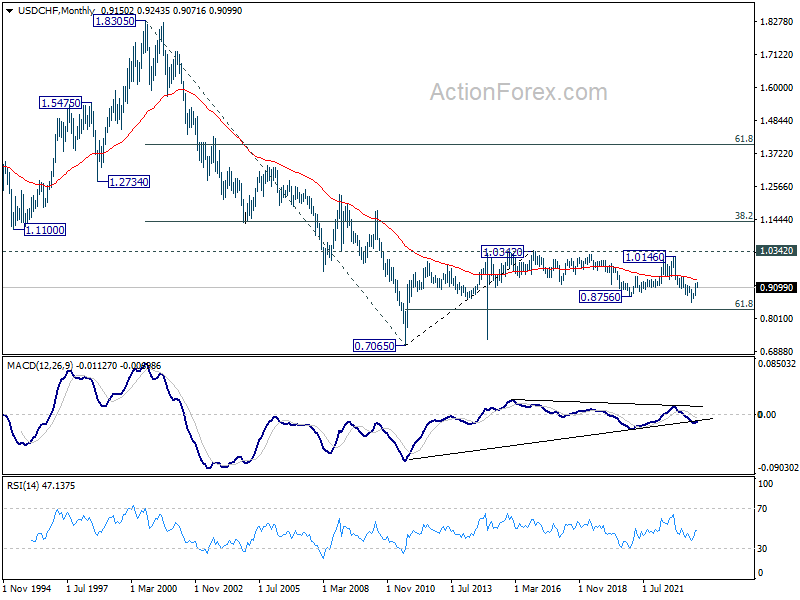
In the long term picture, there is no clear sign that down trend from 1.8305 (2000 high) has completed. With 38.2% retracement of 1.8305 to 0.7065 at 1.1359 intact, outlook is neutral at best.
AUD/USD Weekly Report
AUD/USD's decline from 0.7156 resumed last week and fell to 0.6284. But a temporary low was then formed with subsequent recovery. Initial bias remains neutral this week for consolidations. Outlook will stay bearish as long as 0.6500 resistance holds. Below 0.6284 will resume the fall from 0.7156. Next target is 100% projection of 0.7156 to 0.6457 from 0.6894 at 0.6195.
In the bigger picture, down trend from 0.8006 (2021 high) is possibly still in progress. Decisive break of 0.6169 will target 61.8% projection of 0.8006 to 0.6169 to 0.7156 at 0.6021. This will now remain the favored case as long as 0.6894, in case of strong rebound.
In the long term picture, while fall from 0.8006 might extend lower, the structure argues that it's merely a correction to rise from 0.5506 (2020 low). In case of downside extension, strong support should emerge above 0.5506 to bring reversal. But still, momentum of the next move will be monitored to adjust the assessment.