

Sample Category Title
USD/CAD Weekly Outlook
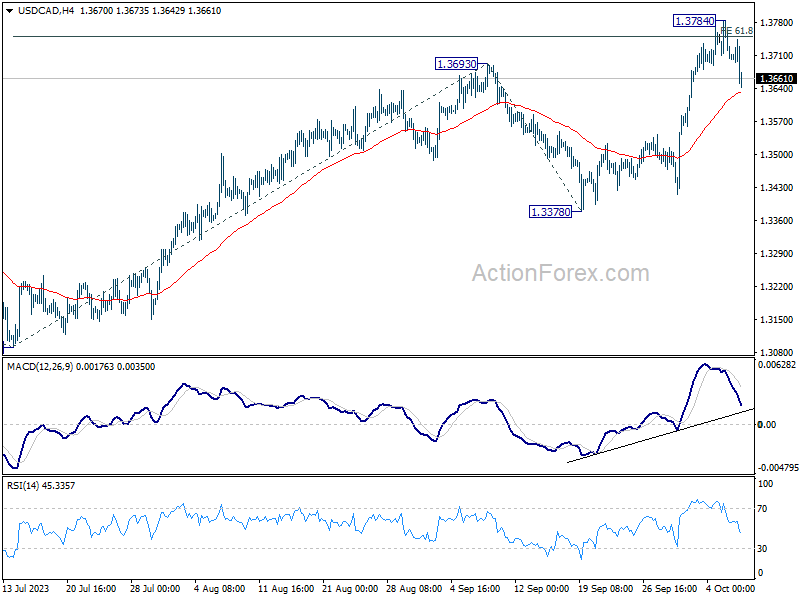
USD/CAD's rise from 1.3091 resumed last week and surged to 1.3784, before retreating. Initial bias stays neutral this week first, and more consolidations could be seen below 1.3784. While deeper pull back cannot be ruled out, outlook will stay bullish as long as 1.3378 support holds. Above 1.3778 will resume the rally from 1.3091 and target 100% projection of 1.3091 to 1.3693 from 1.3378 at 1.3980.
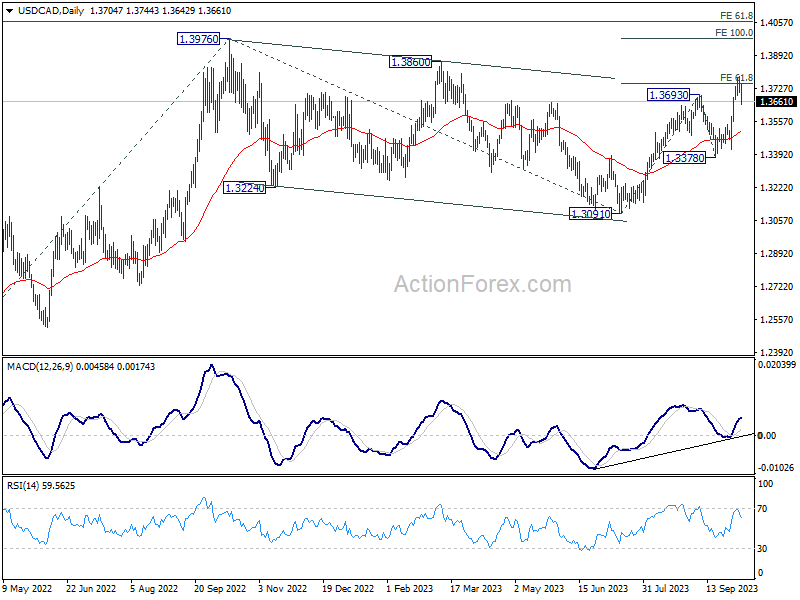
In the bigger picture, current development revives the case that corrective pattern from 1.3976 (2022 high) has completed with three waves down to 1.3091. Decisive break of 1.3976 high will confirm resumption of up trend from 1.2005 (2021 low). Next target will be 61.8% projection of 1.2401 to 1.3976 from 1.3091 at 1.4064. This will now remain the favored case as long as 1.3378 support holds.
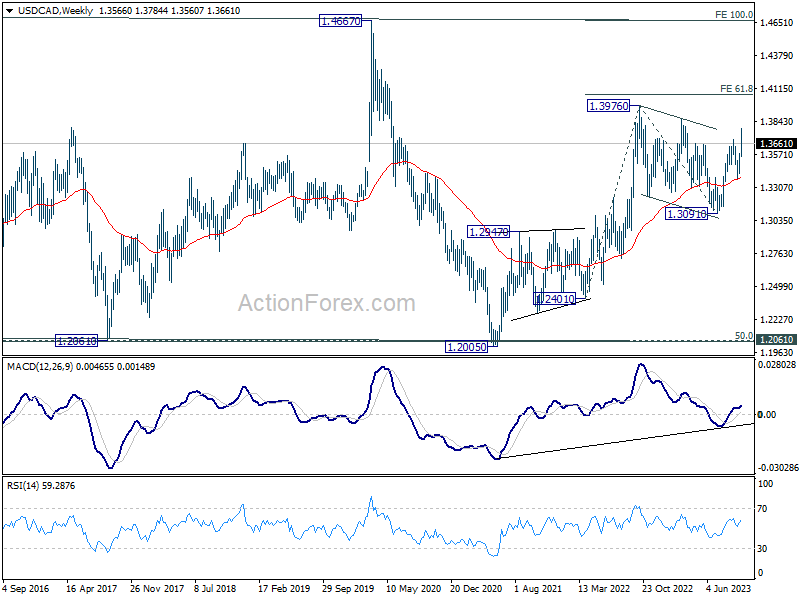
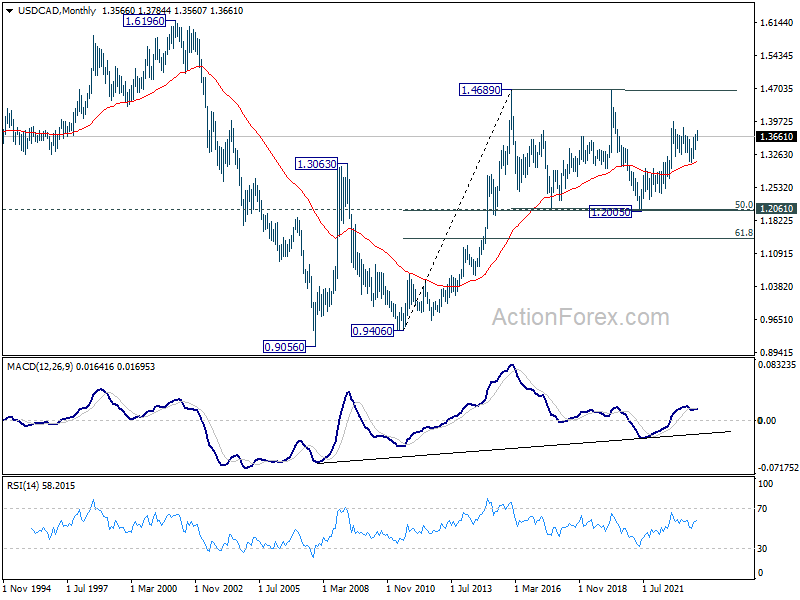
In the longer term picture, price actions from 1.4689 (2016 high) are seen as a consolidation pattern only, which might have completed at 1.2005. That is, up trend from 0.9506 (2007 low) is expected to resume at a later stage. This will remain the favored case as 55 M EMA (now at 1.3100) holds.
GBP/JPY Weekly Outlook
GBP/JPY rebounded strongly after initial fall to 178.02, but upside is limited by 183.00 resistance. Initial bias stays neutral this week first. On the upside, firm break of 183.00 will argue that the pull back from 187.65 has completed, and turn bias back to the upside for retesting this high. On the downside, below 180.26 minor support will turn bias back to the downside for 178.02 again.
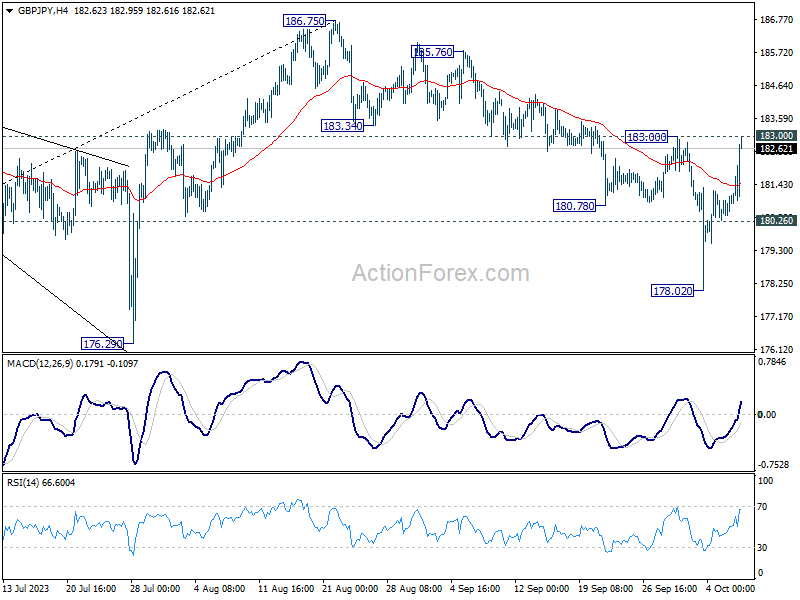
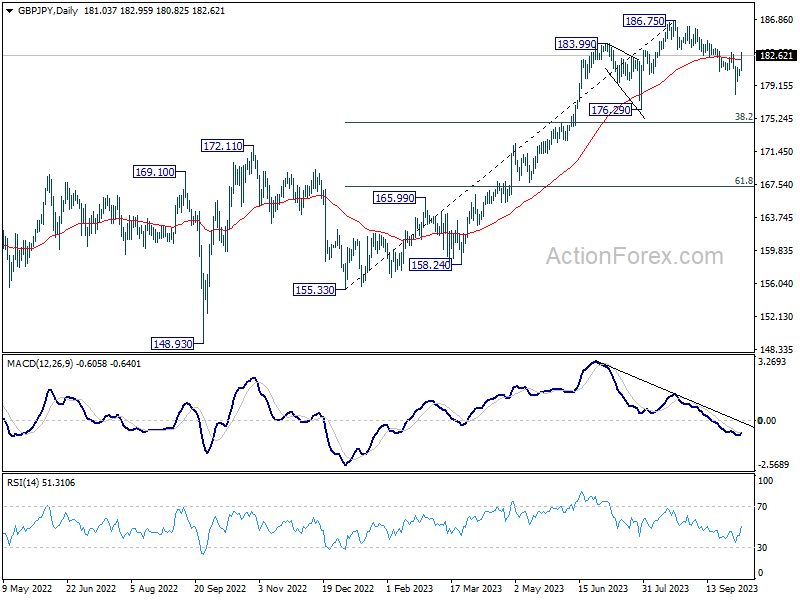
In the bigger picture, fall from 186.75 is currently seen as a corrective move only. As long as 176.29 support holds, larger up trend from 123.94 (202 low) should still be in progress. Break of 186.75 will target 195.86 (2015 high). Nevertheless, firm break of 176.29 will confirm medium term topping, and bring lengthier and deeper consolidations.
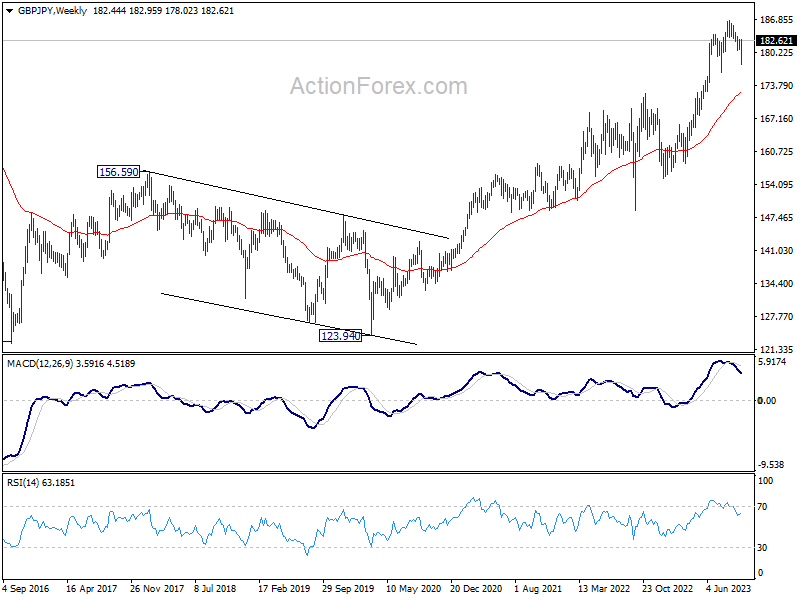
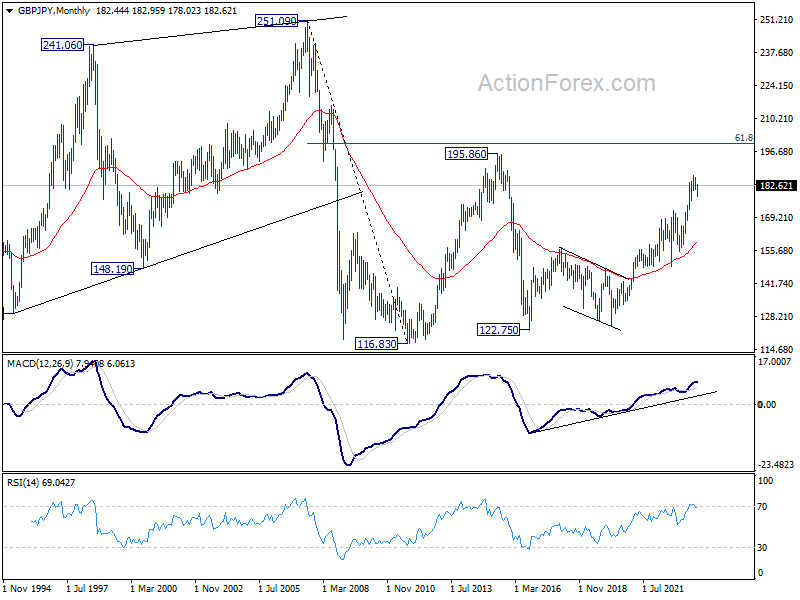
In the longer term picture, rise from 122.75 (2016 low) in still in progress but started losing upside momentum as seen in W MACD. Further rise will remain in favor, though, as long as 176.29 support holds, to retest 195.86 (2015 high).
EUR/JPY Weekly Outlook
EUR/JPY rebounded strongly after diving to 154.32 last week. But upside is limited below 158.46. Initial bias stays neutral this week first. On the upside, firm break of 158.464 will argue that the pull back has from 159.75 is completed. Bias will be turned back to the upside for resuming larger up trend through 159.75 high. On the downside, below 156.07 minor support will resume the fall from 159.75 through 154.32 support.
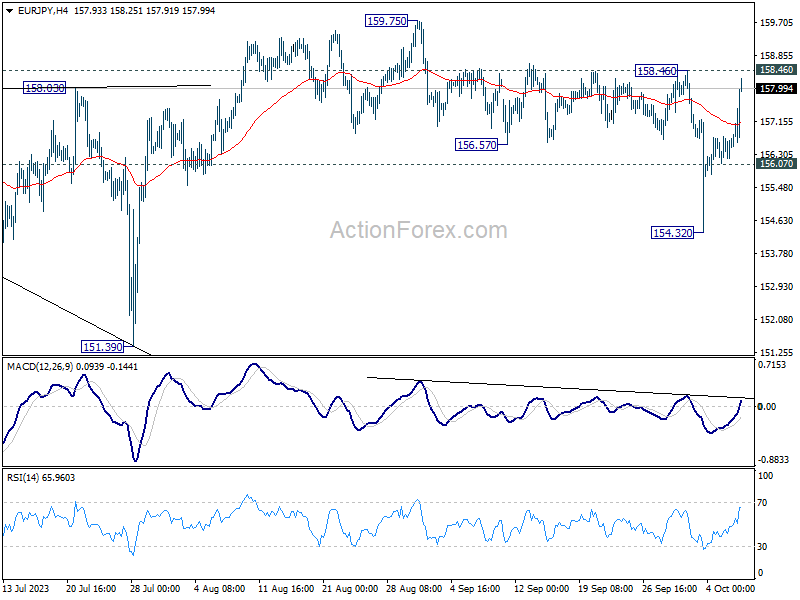
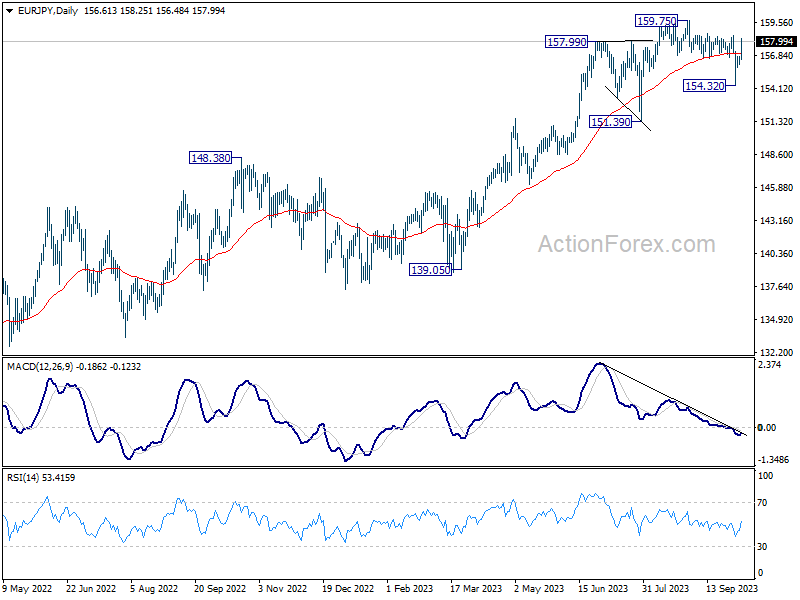
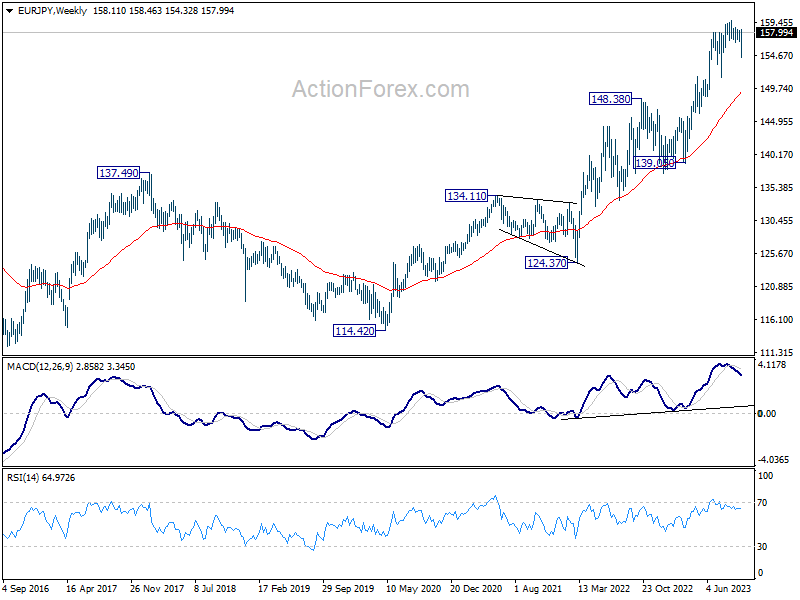
In the bigger picture, price actions from 159.75 are views as a corrective pattern for now. As long as 151.39 support holds, rise from 114.42 (2020 low) is still expected to continue through 159.75 at a later stage. Nevertheless, firm break of 151.39 will confirm medium term topping, and bring lengthier and deeper correction.
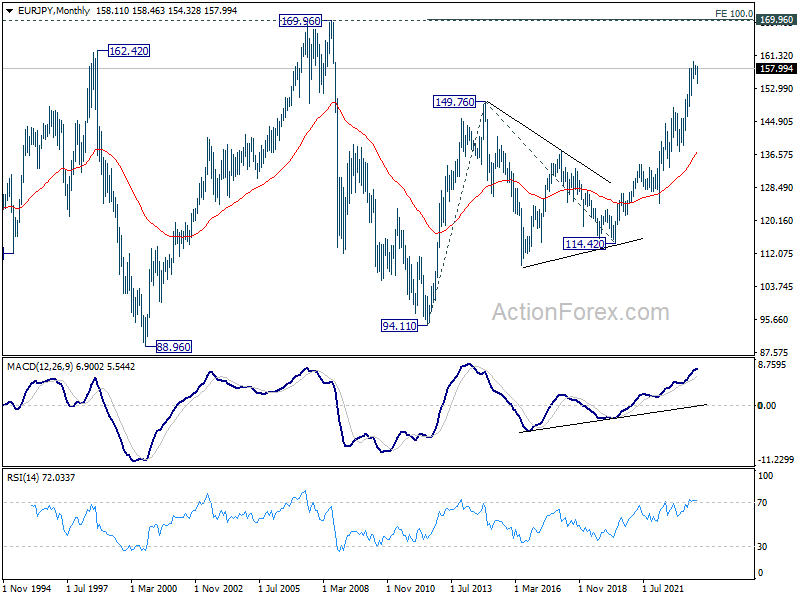
In the long term picture, rise from 109.03 (2016 low) is seen as the third leg of the whole up trend from 94.11 (2012 low). Next target is 100% projection of 94.11 to 149.76 from 114.42 at 170.07 which is close to 169.96 (2008 high).
EUR/GBP Weekly Outlook
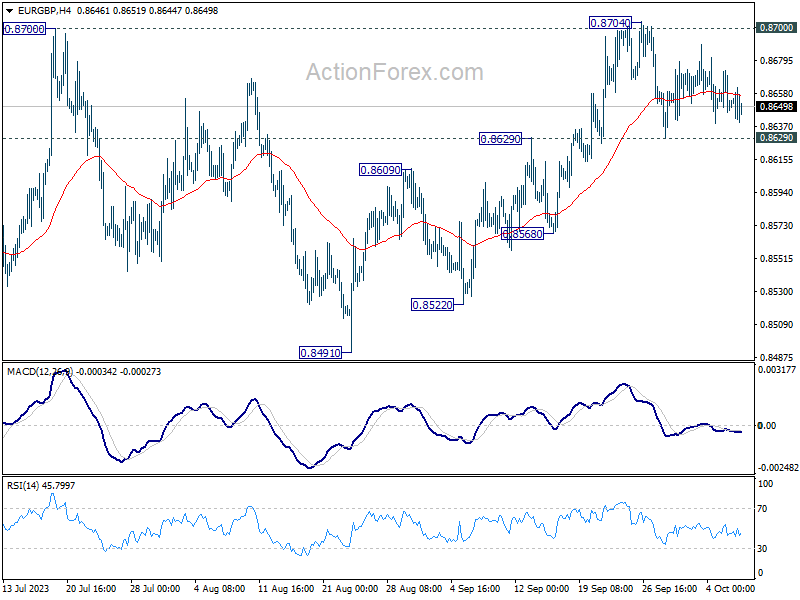
EUR/GBP stayed in consolidation below 0.8704 last week and outlook is unchanged. Initial bias remains neutral this week and some more sideway trading could be seen. On the upside, decisive break of 0.8700 resistance will carry larger bullish implication and bring stronger rally to 0.8874 resistance next. Nevertheless, rejection by this resistance will maintain bearish outlook that larger down trend is not over. Firm break of 0.8629 resistance turned support will turn bias back to the downside for 0.8568 support first.
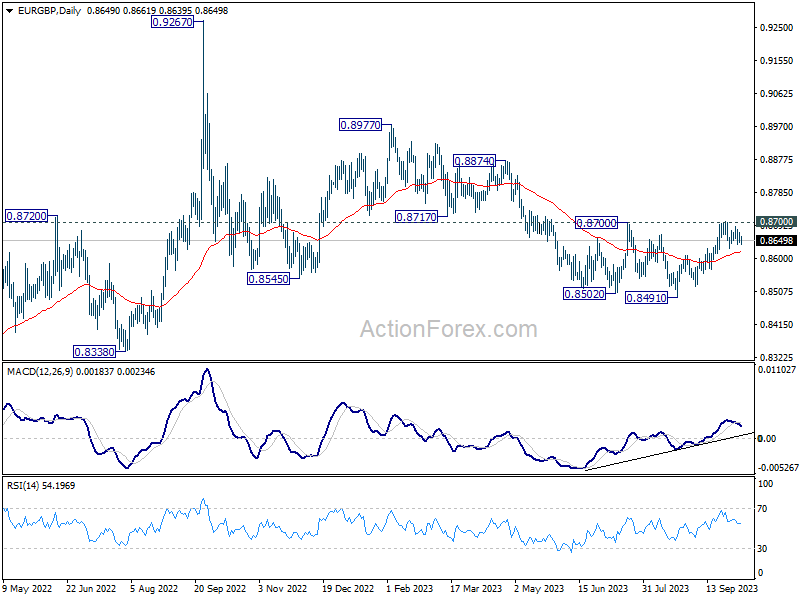
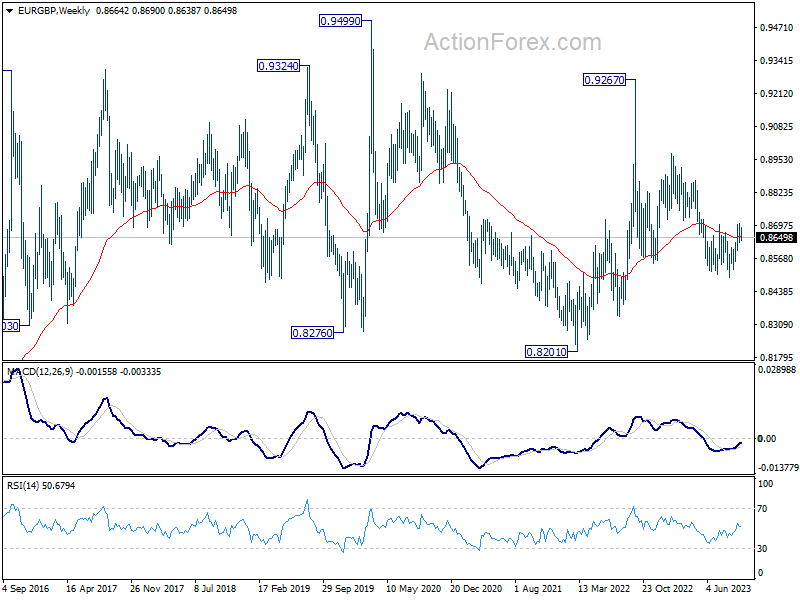
In the bigger picture, the down trend from 0.9267 (2022 high) is seen as part of the long term range pattern from 0.9499 (2020 high). Decisive break of 0.8700 resistance will argue that this decline has completed with three waves down to 0.8491. Rise from 0.8491 could then be another leg inside the pattern and targets 0.8977 and above. However, rejection by 0.8700 will keep the down trend alive for another fall through 0.8491 at a later stage.
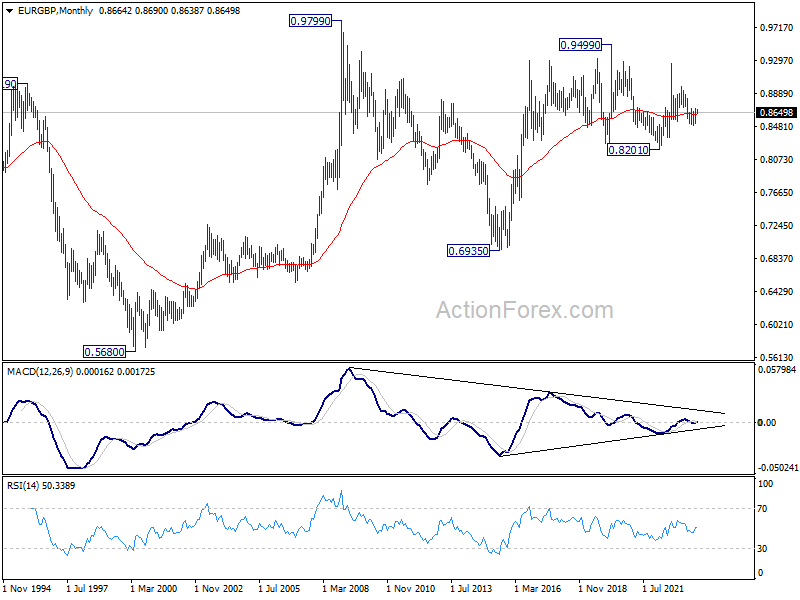
In the long term picture, long term range pattern is extending. But rise from 0.6935 (2015 low) is expected to resume at a later stage, to 0.9799 (2009 high).
EUR/AUD Weekly Outlook
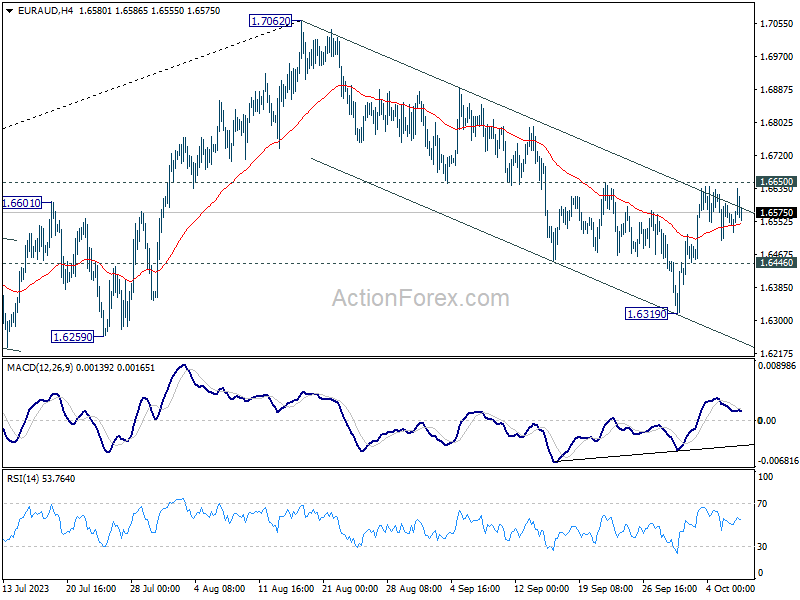
EUR/AUD rebounded strongly last week but failed to break through 1.6650 resistance. Initial bias remains neutral this week first, and another decline is in favor. on the downside, below 1.6446 minor support will bring retest of 1.6319. Break there will resume the decline from 1.7062 to 1.6000 fibonacci level. On the upside, firm break of 1.6650 resistance will argue that pull back from 1.7062 has completed, after drawing support from medium term rising trend line. Further rally would be seen back to retest 1.7062.
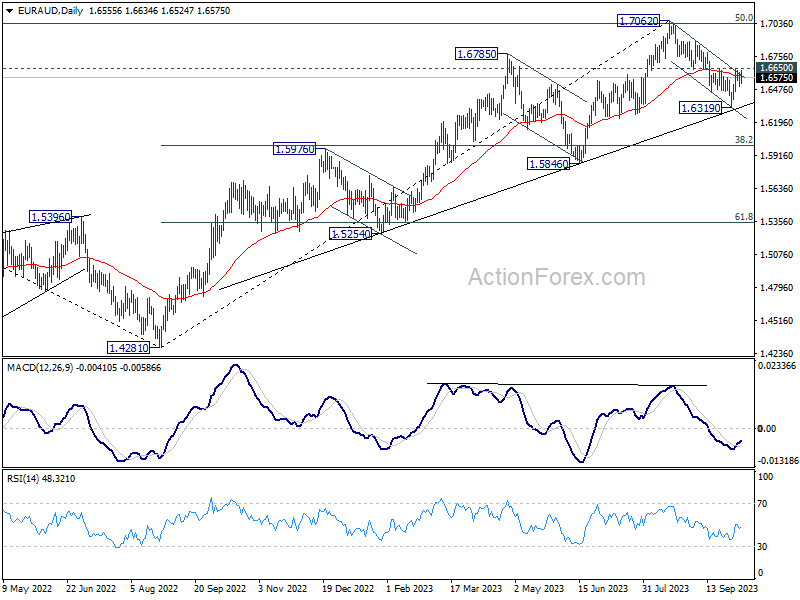
In the bigger picture, fall from 1.7062 is probably correcting whole up trend from 1.4281 (2022 low). Deeper decline would be seen to 38.2% retracement of 1.4281 to 1.7062 at 1.6000. Strong support could be seen there to bring rebound, at least on first attempt. This will remain the favored case as long as 1.6650 resistance holds.
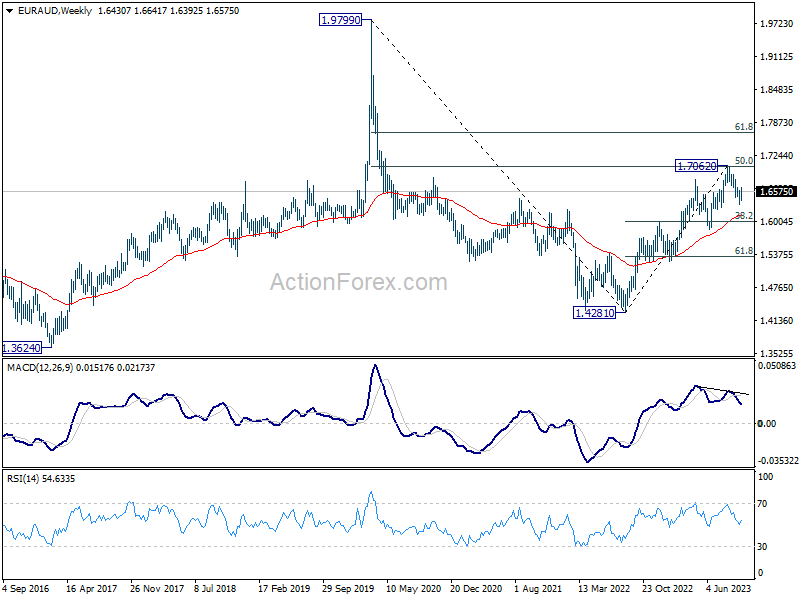
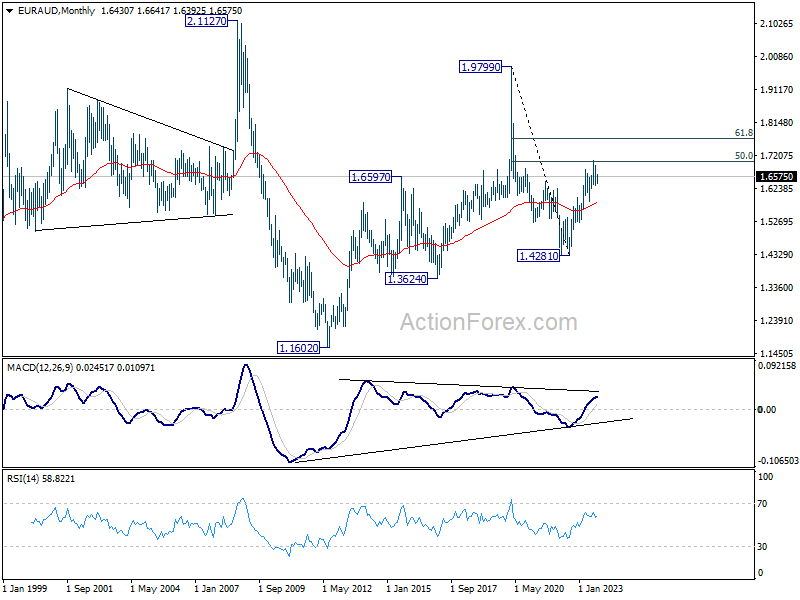
In the longer term picture, loss of upside momentum as seen in 55 W MACD at this stage argues that rise from 1.4281 (2022 low) is more likely a corrective move. Further rise could still be seen as long as 1.5846 support holds. But upside will likely be limited by 61.8% retracement of 1.9799 to 1.4281 at 1.7691. Firm break of 1.5846 support will argue that the rise has completed, and another medium term down leg has started.
EUR/CHF Weekly Outlook
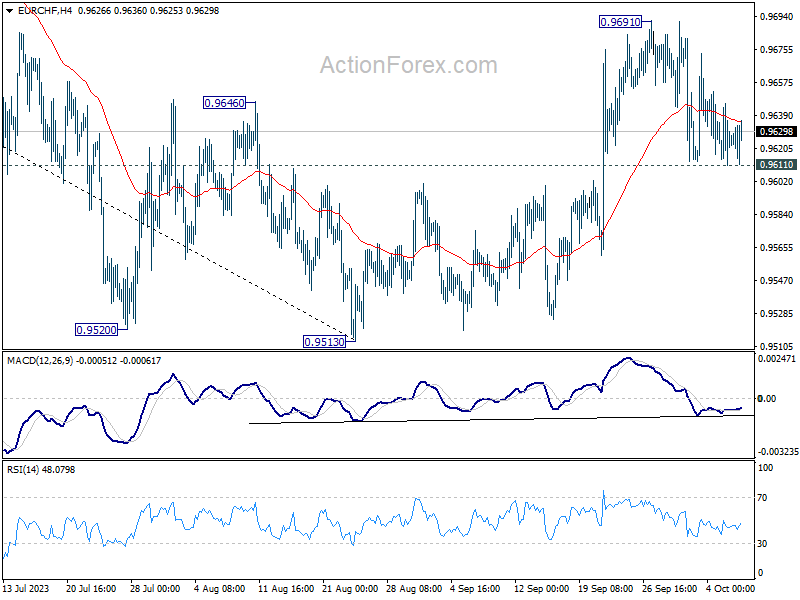
EUR/CHF extended the consolidation from 0.9691 last week and outlook is basically unchanged. Initial bias remains neutral this week first, and further rise is mildly in favor. On the upside, break of 0.9691 will resume whole rise from 0.9513 to 38.2% retracement of 1.0095 to 0.9513 at 0.9735. However, firm break of 0.9611 will turn bias back to the downside for retesting 0.9513 low.
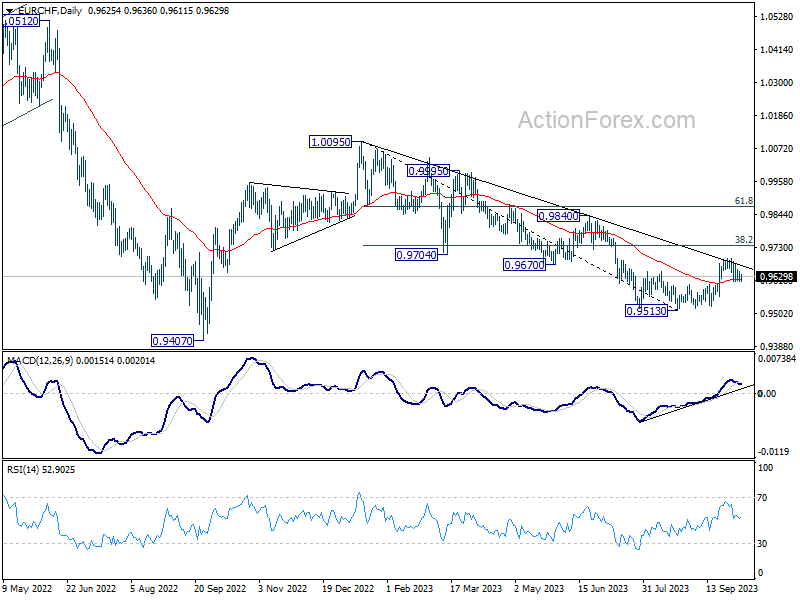
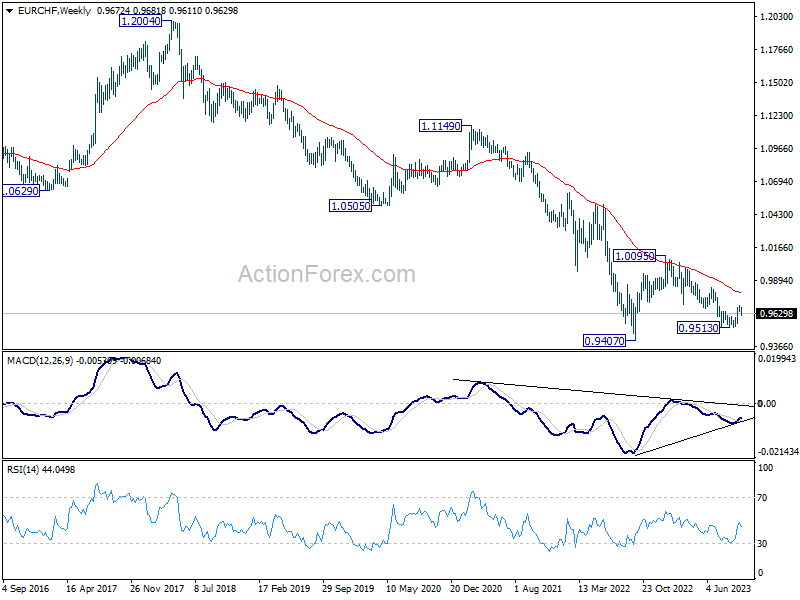
In the bigger picture, medium term outlook will stay bearish as long as the cross is capped well below falling 55 W EMA (now at 0.9793). That is, down trend from 1.2004 (2018 high) could still resume through 0.9407 (2022 low). However, sustained trading above the 55 W EMA will raise the chance that 0.9470 is already a long term bottom. Further rise would then be seen to 1.0095 resistance to indicate bullish trend reversal.
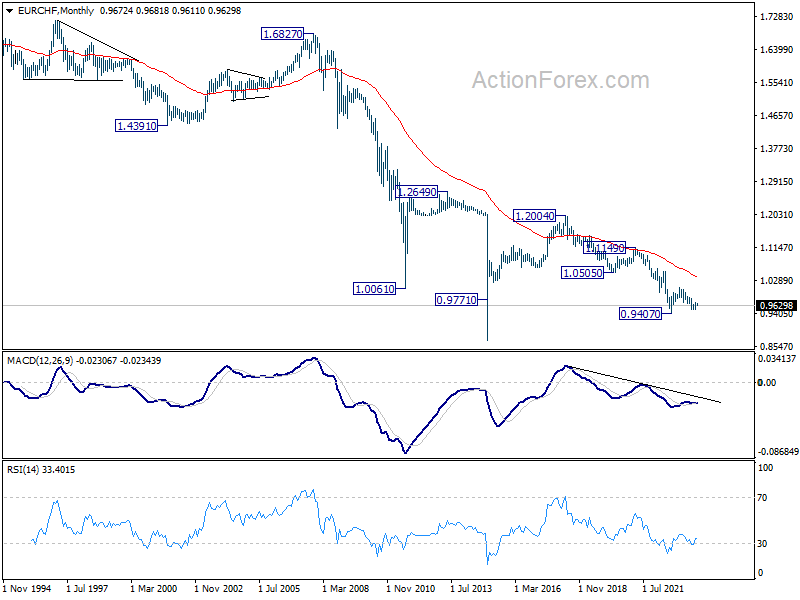
In the long term picture, outlook remains bearish as it's staying well below 55 M EMA (now at 1.0368). Break of 1.0095 resistance is needed to be the first sign of bottoming, or the multi-decade down trend is expected to continue.
The Weekly Bottom Line: The Jobs Machine Keeps Whirring
U.S. Highlights
- And just like that, the Fed’s short-lived pause is likely done after a bevy of positive economic data show an incredibly resilient economy.
- This morning’s payrolls report showed a stellar 336k jobs added in September, along with an upward revision of another 119k jobs to the past two months.
- Financial conditions have tightened this week, but with such healthy economic momentum the Fed still has more work to do to cool demand and bring inflation back in line with its two percent target.
Canadian Highlights
- The relentless upward march in bond yields continued this week, pushing riskier assets lower. Oil plunged, dragging down the TSX and Canadian dollar.
- Multi-year highs for rates flag further softness in Canadian housing markets. Data from local real estate boards showed falling sales and prices last month, alongside a concerning rise in supply.
- Canada added 63k positions in September – shattering expectations – and wage growth accelerated. While other details were softer, the odds of another rate hike have gone up.
U.S. – The Jobs Machine Keeps Whirring
And just like that, the Fed’s short-lived pause is likely done. Markets have responded aggressively to a bevy of positive economic data and sent ten-year government bond yields up 20 basis points since the start of the week. The bond rout had abated mid-week, only to be abruptly undone by Friday’s gangbusters payrolls report that sent yields surging. This week’s data stream shows an economy that continues to shrug off a higher policy rate, likely forcing the Fed to action before the end of the year.
With all eyes focused on this morning’s payrolls report, it didn’t disappoint with a stellar 336k jobs added in September, along with an upward revision of another 119k jobs to the past two months. The print for September effectively doubled up on the market’s expectations. Industry figures lined up with this week’s ISM services index, as gains were concentrated in the services sector – with leisure and hospitality leading the way.
There isn’t much need to address the details. The strong addition to payrolls squares with the Job Opening and Labor Turnover Survey (JOLTS) that came earlier this week and showed job openings jumped in August, reversing the two prior months’ declines, as firms continue to search for talent. While the number of open positions continues to trend lower from its pandemic-era surge, there remain a whopping 44% more job openings as of August than there were in December of 2019.
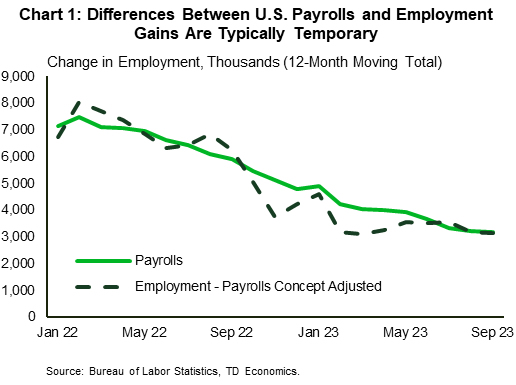
The labor market is tight with jobs aplenty. That said, one apparent contradiction in the report is the wedge between the household employment and payrolls reports. Despite the stellar jobs gains, the unemployment rate was unchanged (3.8%), the labor force participation rate didn’t budge and the number of employed people only rose by 86k. However, deviations of this size are typical and tend to even out in the long run (Chart 1), keeping the focus firmly on the headline job creation figure.
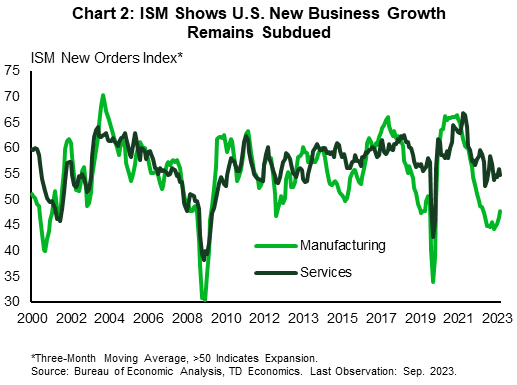
Private sector data that came earlier this week also supported the notion that the economy remains is fairly good shape despite the rate hikes. The ISM Manufacturing Purchasing Managers’ Index (PMI) firmed in the month, showing the contraction in the sector slowed. Meanwhile, its services sector counterpart held in expansionary territory despite slowing for the month. Rate hikes are clearly working as new business growth for both the manufacturing and services sectors (Chart 2) is moderating, but for all the work the Fed has done, it just isn’t proving to be enough.
Bottom line, a week of stronger-than-expected economic data have now all but put an end to the Fed’s pause. Financial conditions have tightened this week and will work to slow activity, but with such healthy economic momentum the Fed still has more work to do to cool demand and bring inflation back in line with its two percent target. This means a hike by year end is now on the table as the Fed continues its work to restore balance and slow price growth.
Canada – Higher and Hire
This week was not exactly one of triumph for riskier assets. Oil prices tumbled, dragging the TSX down with them. For its part, the Canadian dollar also lost some ground, dropping half-a-cent to 73 cents US. The source of this angst? The relentless upward march in bond yields, as investors continue to recalibrate to a "higher-for-longer" backdrop. Notably, the Canadian 10-year yield hit a fresh, 16-year high this week. Ditto for the 5-year yield, and blowout jobs reports on Friday on both sides of the border simply added to this narrative.
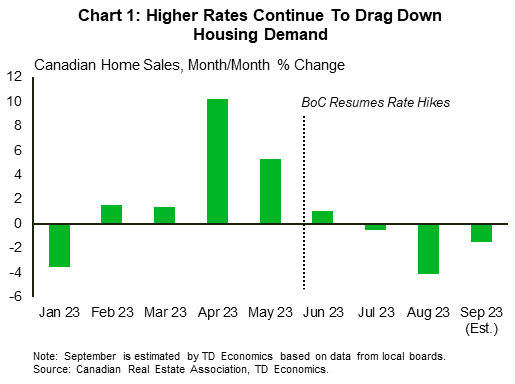
This elevated rate backdrop will make for a ghoulish October for housing. This week featured the release of local real estate board data capturing developments in September (Chart 1). Unsurprisingly, home sales declined in markets such as Toronto and Vancouver. Even the near-unflappable Calgary market finally stumbled, with sales down around 1% month-on-month. Valuations, meanwhile, appeared relatively resilient, with average prices flat in Toronto and benchmark prices down only slightly in Vancouver. These outcomes were consistent with what we had imbedded in our latest housing forecast. More surprising (and concerning) was the surge in new listings, particularly in Toronto. In the GTA, listings increased to levels typically only seen in periods of frenzied activity or extreme housing market weakness. Accordingly, the sales-to-new listings ratio (a measure of the supply-demand balance in housing) eased to its lowest level since the Financial Crisis – a surefire signal that prices are set to sag further in coming months.
Developments in housing always draw interest from Canadians, but undoubtedly the marquee report this week was the jobs data for September. The overall jobs gain shattered expectations, with 63k positions added last month. Still, not all aspects pointed in the same direction. For one, a large share of hiring came through the notoriously volatile self-employment sector, while private sector hiring was effectively flat. Accordingly, part-time employment surged, accompanied by a more pedestrian gain in full-time hiring. Hours worked also fell in September, which is typically a negative signal for monthly GDP. And, even with the powerful headline jobs tally, the unemployment rate was unchanged, thanks again to a surging population and robust labour force growth.
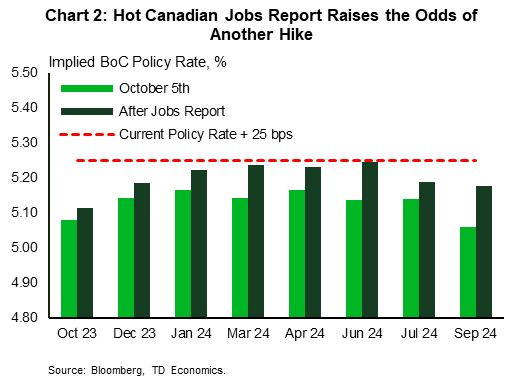
These wrinkles aside, the jobs report is certainly going to ruffle some feathers for central bank policymakers. Perhaps most notably, wage growth accelerated, and at 5% year-on-year, continues to run at a pace well above what's needed bringing inflation back to the 2% target. This is especially true given the lackluster productivity that continues to plague the Canadian economy. In our view, the odds of another increase in the Bank's policy rate just went up this morning. Markets had looked like they were on the fence as to whether the BoC would hike again, and this morning's data was enough to shove them fully in that direction (Chart 2).
Weekly Economic & Financial Commentary: Volatility Hits Global Financial Markets
Summary
United States: The Vibe Is Alive
- The U.S. economy continues to demonstrate exceptional strength. Nonfarm payrolls blew past expectations, rising 336K in September. The outturn was made all the more impressive by a net 119K upward revision to the past two months of data.
- Next week: NFIB Small Business Optimism (Tue.), CPI (Thu.), Consumer Sentiment (Fri.)
International: Volatility Hits Global Financial Markets
- Global financial markets remained under pressure for most of this week. The selloff in risk assets primarily stems from a still resilient U.S. economy and hawkish leaning Federal Reserve.
- Next week: Brazil Inflation (Wed.), Russia Inflation (Wed.), Argentina Inflation (Thu.)
Interest Rate Watch: Long-Term Yields Skyrocket
- Expectations of heavy Treasury issuance in coming months appear to have contributed to the marked rise in yields on U.S. Treasury securities recently. Private sector borrowers will also feel the sting of higher borrowing costs.
Topic of the Week: Speaker Race Commences as Shutdown Date Looms
- Last week, Congress and the president reached a last second agreement to avert a government shutdown that would have begun on October 1. The political landscape in Washington D.C. took another turn this week when former Speaker of the House, Kevin McCarthy, was ousted from his position by House Democrats and a small group of House Republicans.
Forward Guidance: U.S. Inflation Growth to Edge Lower in September
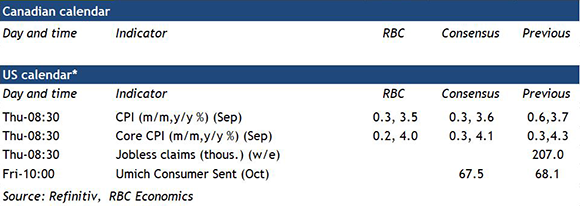
All eyes will be on U.S. inflation data in an otherwise quiet week of economic data releases. CPI growth likely looked a little better in September – we look for a slowing to a 3.5% year-over-year rate from 3.7% in August. Oil prices are still high, but gasoline prices were little changed in September (on a seasonally adjusted basis) after jumping 10.5% on a month-over-month basis in August. Grocery price growth has slowed substantially after surging higher last year, and we look for another tick down in the year-over-year rate of food price growth (to 3.6%) in September.
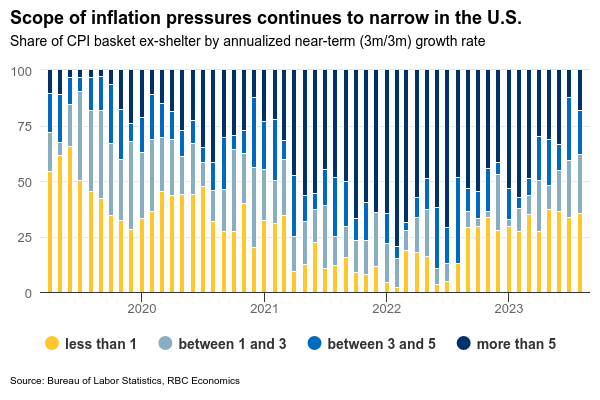
Fed policymakers will be more focused on ‘core’ measures that are more likely to be impacted by domestic economic conditions than global factors like energy price movements. Those measures have also slowed substantially. We look for price growth excluding food & energy products to edge down to a 4.0% year-over-year rate in September from 4.3% in August. The scope of price gains has continued to narrow – the share of the ex-shelter CPI basket growing at a 3% or greater rate over the last three months shrunk to 38% from 87% a year ago and the Fed’s ‘super-core’ (services prices excluding rent) averaged 2.2% growth at an annualized rate over the last three months.
The Fed has signaled that future interest rate decisions are firmly ‘data dependent’ – and, to-date, easing inflation pressures have come alongside an exceptionally resilient economic growth and labour market backdrop. The September jobs report showed strong employment growth, but wage growth continued to slow, reaching the lowest yearly pace in two years. The unemployment rate held at 3.8% and lower job openings and quit rates continue to point to softening in hiring demand that will eventually feed through to higher unemployment. The Fed won’t hesitate to respond with higher interest rates to cool the economy and keep inflation in check. Although our own base-case assumes that won’t be necessary with the recent run of economic resilience not expected to last.
Summary 10/9 – 10/13
Monday, Oct 9, 2023
| GMT | Ccy | Events | Consensus | Previous |
|---|---|---|---|---|
| 06:00 | EUR | Germany Industrial Production M/M Aug | -0.10% | -0.80% |
| 08:30 | EUR | Eurozone Sentix Investor Confidence Oct | -24 | -21.5 |
| 23:30 | AUD | Westpac Consumer Confidence Oct | -1.50% | |
| 23:50 | JPY | Current Account (JPY) Aug | 2.41T | 2.77T |
| GMT | Ccy | Events | |
|---|---|---|---|
| 06:00 | EUR | Germany Industrial Production M/M Aug | |
| Forecast: -0.10% | Previous: -0.80% | ||
| 08:30 | EUR | Eurozone Sentix Investor Confidence Oct | |
| Forecast: -24 | Previous: -21.5 | ||
| 23:30 | AUD | Westpac Consumer Confidence Oct | |
| Forecast: | Previous: -1.50% | ||
| 23:50 | JPY | Current Account (JPY) Aug | |
| Forecast: 2.41T | Previous: 2.77T | ||
Tuesday, Oct 10, 2023
| GMT | Ccy | Events | Consensus | Previous |
|---|---|---|---|---|
| 00:30 | AUD | NAB Business Conditions Sep | 13 | |
| 00:30 | AUD | NAB Business Confidence Sep | 2 | |
| 05:00 | JPY | Eco Watchers Survey: Current Sep | 53.2 | 53.6 |
| 08:00 | EUR | Italy Industrial Output M/M Aug | -0.60% | -0.70% |
| 10:00 | USD | NFIB Business Optimism Index Sep | 91.5 | 91.3 |
| 14:00 | USD | Wholesale Inventories Aug F | -0.10% | -0.10% |
| GMT | Ccy | Events | |
|---|---|---|---|
| 00:30 | AUD | NAB Business Conditions Sep | |
| Forecast: | Previous: 13 | ||
| 00:30 | AUD | NAB Business Confidence Sep | |
| Forecast: | Previous: 2 | ||
| 05:00 | JPY | Eco Watchers Survey: Current Sep | |
| Forecast: 53.2 | Previous: 53.6 | ||
| 08:00 | EUR | Italy Industrial Output M/M Aug | |
| Forecast: -0.60% | Previous: -0.70% | ||
| 10:00 | USD | NFIB Business Optimism Index Sep | |
| Forecast: 91.5 | Previous: 91.3 | ||
| 14:00 | USD | Wholesale Inventories Aug F | |
| Forecast: -0.10% | Previous: -0.10% | ||
Wednesday, Oct 11, 2023
| GMT | Ccy | Events | Consensus | Previous |
|---|---|---|---|---|
| 06:00 | EUR | Germany CPI M/M Sep F | 0.30% | 0.30% |
| 06:00 | EUR | Germany CPI Y/Y Sep F | 4.50% | 4.50% |
| 06:00 | JPY | Machine Tool Orders Y/Y Sep F | -17.60% | |
| 12:30 | CAD | Building Permits M/M Aug | -1.50% | |
| 12:30 | USD | PPI M/M Sep | 0.40% | 0.70% |
| 12:30 | USD | PPI Y/Y Sep | 1.60% | |
| 12:30 | USD | PPI Core M/M Sep | 0.20% | 0.20% |
| 12:30 | USD | PPI Core Y/Y Sep | 2.20% | |
| 18:00 | USD | FOMC Minutes | ||
| 23:01 | GBP | RICS Housing Price Balance Sep | -68% | |
| 23:50 | JPY | Bank Lending Y/Y Sep | 3.10% | 3.10% |
| 23:50 | JPY | PPI Y/Y Sep | 2.30% | 3.20% |
| 23:50 | JPY | Machinery Orders M/M Aug | 0.70% | -1.10% |
| GMT | Ccy | Events | |
|---|---|---|---|
| 06:00 | EUR | Germany CPI M/M Sep F | |
| Forecast: 0.30% | Previous: 0.30% | ||
| 06:00 | EUR | Germany CPI Y/Y Sep F | |
| Forecast: 4.50% | Previous: 4.50% | ||
| 06:00 | JPY | Machine Tool Orders Y/Y Sep F | |
| Forecast: | Previous: -17.60% | ||
| 12:30 | CAD | Building Permits M/M Aug | |
| Forecast: | Previous: -1.50% | ||
| 12:30 | USD | PPI M/M Sep | |
| Forecast: 0.40% | Previous: 0.70% | ||
| 12:30 | USD | PPI Y/Y Sep | |
| Forecast: | Previous: 1.60% | ||
| 12:30 | USD | PPI Core M/M Sep | |
| Forecast: 0.20% | Previous: 0.20% | ||
| 12:30 | USD | PPI Core Y/Y Sep | |
| Forecast: | Previous: 2.20% | ||
| 18:00 | USD | FOMC Minutes | |
| Forecast: | Previous: | ||
| 23:01 | GBP | RICS Housing Price Balance Sep | |
| Forecast: | Previous: -68% | ||
| 23:50 | JPY | Bank Lending Y/Y Sep | |
| Forecast: 3.10% | Previous: 3.10% | ||
| 23:50 | JPY | PPI Y/Y Sep | |
| Forecast: 2.30% | Previous: 3.20% | ||
| 23:50 | JPY | Machinery Orders M/M Aug | |
| Forecast: 0.70% | Previous: -1.10% | ||
Thursday, Oct 12, 2023
| GMT | Ccy | Events | Consensus | Previous |
|---|---|---|---|---|
| 00:00 | AUD | Consumer Inflation Expectations Oct | 4.60% | |
| 06:00 | GBP | GDP M/M Aug | 0.20% | -0.50% |
| 06:00 | GBP | Industrial Production M/M Aug | -0.20% | -0.70% |
| 06:00 | GBP | Industrial Production Y/Y Aug | 1.70% | 0.40% |
| 06:00 | GBP | Manufacturing Production M/M Aug | -0.40% | -0.80% |
| 06:00 | GBP | Manufacturing Production Y/Y Aug | 3.40% | 3.00% |
| 06:00 | GBP | Goods Trade Balance Aug | -15.2B | -14.1B |
| 11:00 | GBP | NIESR GDP Estimate (3M) Sep | 0.20% | |
| 11:30 | EUR | ECB Meeting Accounts | ||
| 12:30 | USD | Initial Jobless Claims (Oct 6) | 215K | 207K |
| 12:30 | USD | CPI M/M Sep | 0.30% | 0.60% |
| 12:30 | USD | CPI Y/Y Sep | 3.70% | |
| 12:30 | USD | CPI Core M/M Sep | 0.30% | 0.30% |
| 12:30 | USD | CPI Core Y/Y Sep | 4.30% | |
| 14:30 | USD | Natural Gas Storage | 86B | |
| 15:00 | USD | Crude Oil Inventories | -2.2M | |
| 21:30 | NZD | Business NZ PMI Sep | 46.1 | |
| 23:50 | JPY | Money Supply M2+CD Y/Y Sep | 2.40% | 2.50% |
| GMT | Ccy | Events | |
|---|---|---|---|
| 00:00 | AUD | Consumer Inflation Expectations Oct | |
| Forecast: | Previous: 4.60% | ||
| 06:00 | GBP | GDP M/M Aug | |
| Forecast: 0.20% | Previous: -0.50% | ||
| 06:00 | GBP | Industrial Production M/M Aug | |
| Forecast: -0.20% | Previous: -0.70% | ||
| 06:00 | GBP | Industrial Production Y/Y Aug | |
| Forecast: 1.70% | Previous: 0.40% | ||
| 06:00 | GBP | Manufacturing Production M/M Aug | |
| Forecast: -0.40% | Previous: -0.80% | ||
| 06:00 | GBP | Manufacturing Production Y/Y Aug | |
| Forecast: 3.40% | Previous: 3.00% | ||
| 06:00 | GBP | Goods Trade Balance Aug | |
| Forecast: -15.2B | Previous: -14.1B | ||
| 11:00 | GBP | NIESR GDP Estimate (3M) Sep | |
| Forecast: | Previous: 0.20% | ||
| 11:30 | EUR | ECB Meeting Accounts | |
| Forecast: | Previous: | ||
| 12:30 | USD | Initial Jobless Claims (Oct 6) | |
| Forecast: 215K | Previous: 207K | ||
| 12:30 | USD | CPI M/M Sep | |
| Forecast: 0.30% | Previous: 0.60% | ||
| 12:30 | USD | CPI Y/Y Sep | |
| Forecast: | Previous: 3.70% | ||
| 12:30 | USD | CPI Core M/M Sep | |
| Forecast: 0.30% | Previous: 0.30% | ||
| 12:30 | USD | CPI Core Y/Y Sep | |
| Forecast: | Previous: 4.30% | ||
| 14:30 | USD | Natural Gas Storage | |
| Forecast: | Previous: 86B | ||
| 15:00 | USD | Crude Oil Inventories | |
| Forecast: | Previous: -2.2M | ||
| 21:30 | NZD | Business NZ PMI Sep | |
| Forecast: | Previous: 46.1 | ||
| 23:50 | JPY | Money Supply M2+CD Y/Y Sep | |
| Forecast: 2.40% | Previous: 2.50% | ||
Friday, Oct 13, 2023
| GMT | Ccy | Events | Consensus | Previous |
|---|---|---|---|---|
| 01:30 | CNY | CPI Y/Y Sep | 0.20% | 0.10% |
| 01:30 | CNY | PPI Y/Y Sep | -2.40% | -3.00% |
| 03:00 | CNY | Trade Balance (USD) Sep | 73.7B | 68.4B |
| 06:30 | CHF | Producer and Import Prices M/M Sep | 0.20% | -0.20% |
| 06:30 | CHF | Producer and Import Prices Y/Y Sep | -0.80% | |
| 09:00 | EUR | Eurozone Industrial Production M/M Aug | 0.10% | -1.10% |
| 12:30 | CAD | Manufacturing Sales M/M Aug | 1.60% | |
| 12:30 | USD | Import Price Index M/M Sep | 0.60% | 0.50% |
| 14:00 | USD | Michigan Consumer Sentiment Index Oct P | 68 | 68.1 |
| GMT | Ccy | Events | |
|---|---|---|---|
| 01:30 | CNY | CPI Y/Y Sep | |
| Forecast: 0.20% | Previous: 0.10% | ||
| 01:30 | CNY | PPI Y/Y Sep | |
| Forecast: -2.40% | Previous: -3.00% | ||
| 03:00 | CNY | Trade Balance (USD) Sep | |
| Forecast: 73.7B | Previous: 68.4B | ||
| 06:30 | CHF | Producer and Import Prices M/M Sep | |
| Forecast: 0.20% | Previous: -0.20% | ||
| 06:30 | CHF | Producer and Import Prices Y/Y Sep | |
| Forecast: | Previous: -0.80% | ||
| 09:00 | EUR | Eurozone Industrial Production M/M Aug | |
| Forecast: 0.10% | Previous: -1.10% | ||
| 12:30 | CAD | Manufacturing Sales M/M Aug | |
| Forecast: | Previous: 1.60% | ||
| 12:30 | USD | Import Price Index M/M Sep | |
| Forecast: 0.60% | Previous: 0.50% | ||
| 14:00 | USD | Michigan Consumer Sentiment Index Oct P | |
| Forecast: 68 | Previous: 68.1 | ||