

Sample Category Title
How Will NFP Affect the Markets?
Goldman Sachs expects a strong jobs report for the US labor market in September, with an estimated 200,000 increase in non-farm payrolls. They expect the unemployment rate to fall from 3.8% to 3.7%, showing continued improvement. Average hourly earnings are expected to increase by 0.3%, with a modest impact on the year-over-year rate, which is projected to decline slightly to 4.28%. These insights reflect a positive trajectory in the post-pandemic economic recovery and highlight the continued resilience of the labor market.
US DOLLAR - D1 Timeframe
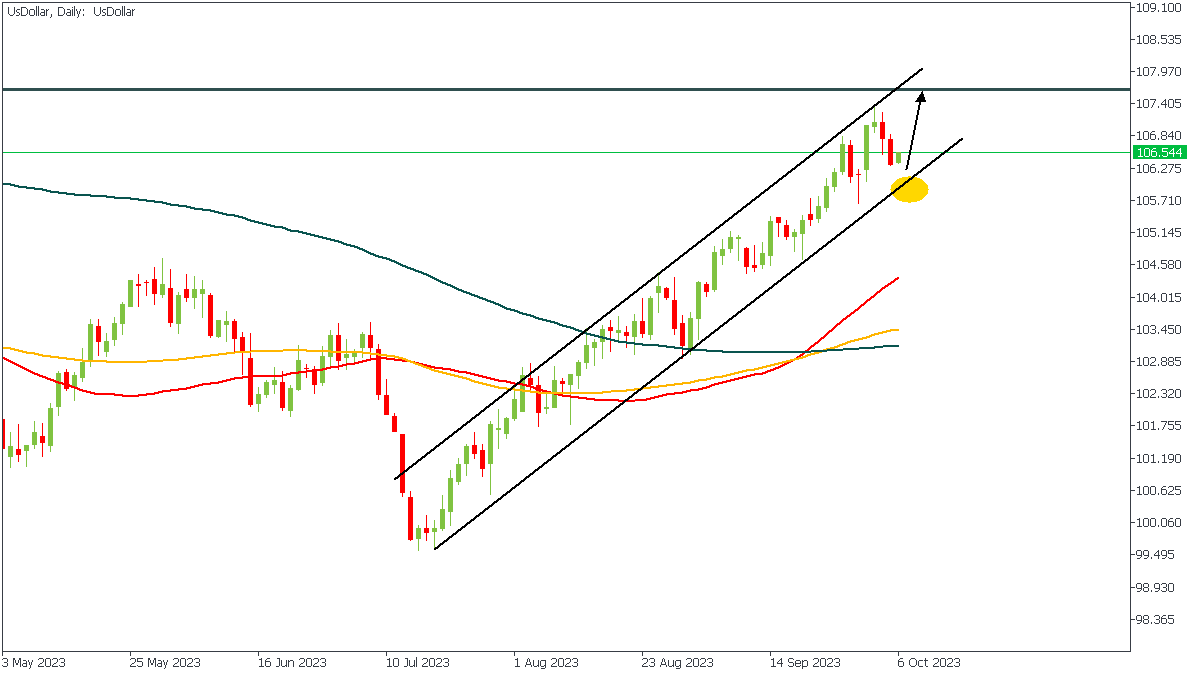
The US Dollar on the Daily timeframe seems to have maintained a steady upward climb, albeit within a channel. Considering that the forecasts seem to be in favour of the US Dollar, I expect to see price bounce off the support trendline and reach towards the supply zone as marked.
Analyst’s Expectations:
- Direction: Bullish
- Target: 106.969
- Invalidation: 105.595
EURUSD - D1 Timeframe
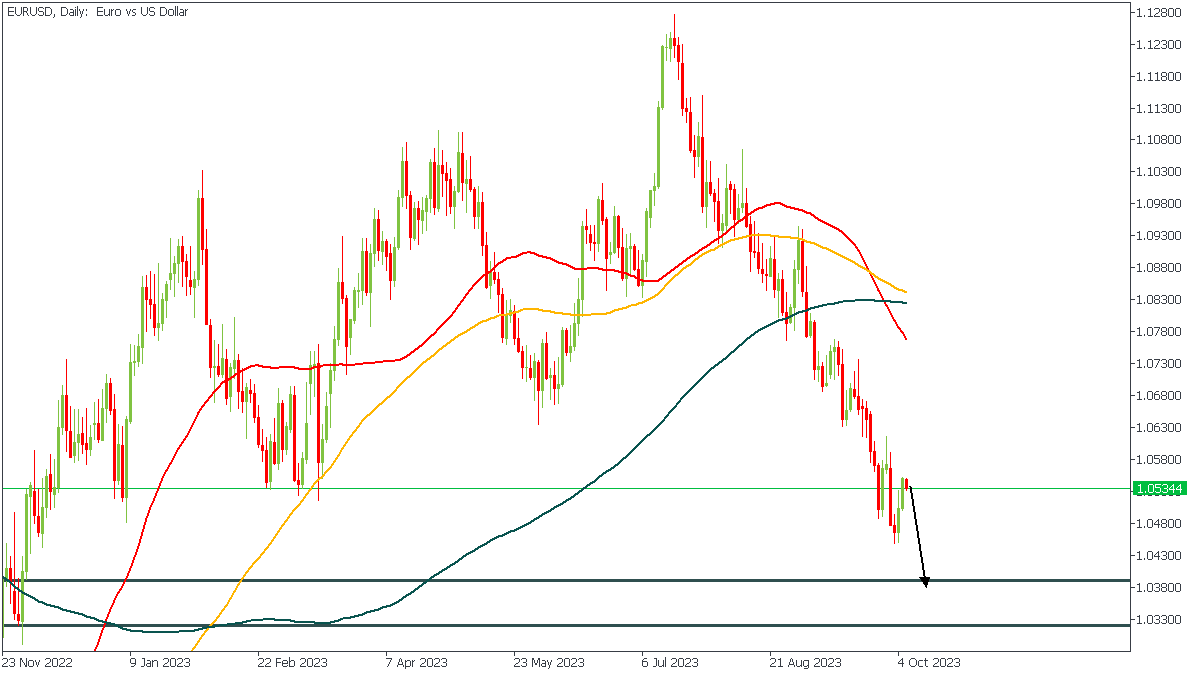
Since we expect the Dollar to get stronger, it is only logical that we anticipate a bearish move on EURUSD which will likely bring price back into the demand zone. If the NFP goes otherwise, then we will expect to see immediate bullish pressure from the current price region.
Analyst’s Expectations:
- Direction: Bearish
- Target: 1.04136
- Invalidation: 1.06265
GBPUSD - D1 Timeframe
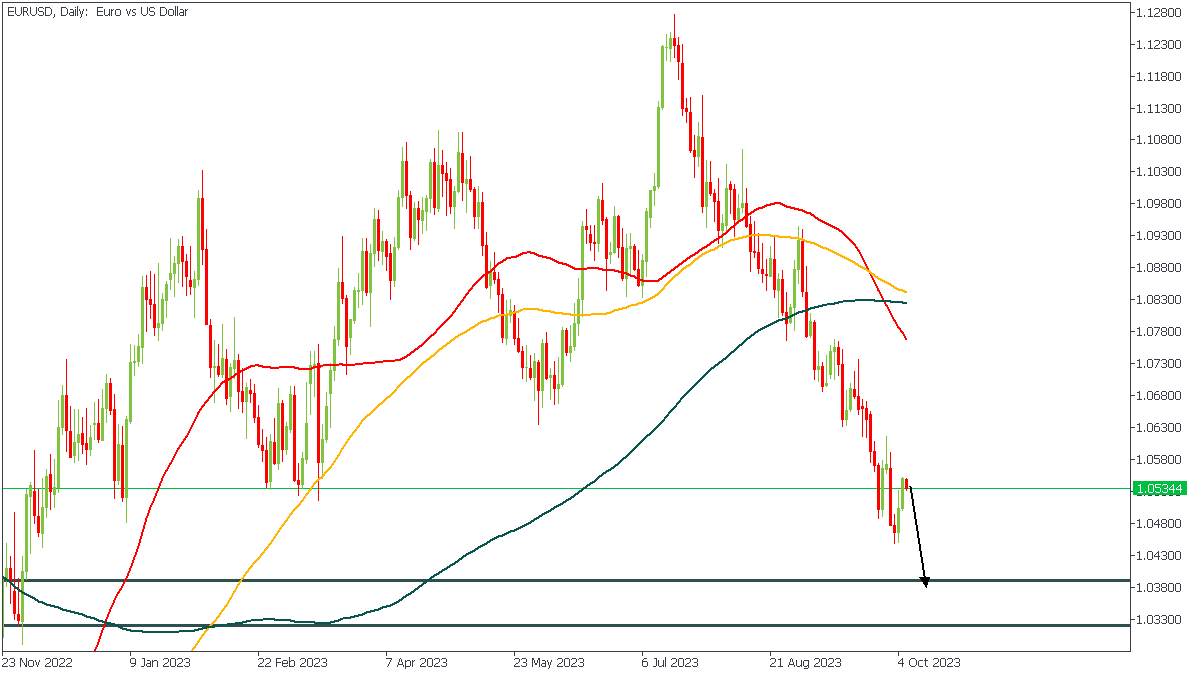
The downward trend on GBPUSD seems poised to continue even further after the NFP release because a stronger Dollar would naturally yield a bearish turn on GBPUSD and vice versa. In the event that the release follows the forecast, I wouldn’t hesitate to go bearish on GBPUSD.
Analyst’s Expectations:
- Direction: Bearish
- Target: 1.19276
- Invalidation: 1.22996
CONCLUSION
The trading of CFDs comes at a risk. To succeed, you have to manage risks properly. To avoid costly mistakes while you look to trade these opportunities, be sure to do your due diligence and manage your risk appropriately.
US Jobs Report Eyed as Fed Seeks Evidence of Cooling Labour Market
Equity markets are edging higher ahead of the US jobs report on Friday, a release that could set the tone in the markets ahead of next month's Fed meeting.
While price pressures are ultimately what the Fed is primarily interested in, there is clearly a view on the FOMC that sustainable 2% inflation is not possible without cooling the labour market. Time will tell how accurate an assumption that is but in the interim, there will be enormous focus on jobs data for signs of cracks appearing that can offer the central bank the comfort it craves.
The ADP report on Wednesday indicated we could be looking at a weaker NFP today but let's face it, it's been a long time since anyone looked to ADP for a reliable insight into the jobs report. If we do see a repeat, it may help to ease some of the anxiety we've seen in the markets in recent weeks.
We've been flooded with higher for longer central bankers, determined to get every last drop out of their rate hikes. While I'm still of the view that the plan at the Fed has always been and remains to pivot very late and maintain this hawkish rhetoric until then, investors are seemingly now less sure and are relying on the data to pull them back in.
Oil steadies after plunging as OPEC+ maintained output targets
Oil prices appear to be steadying a little after plunging in the middle of this week. The market was already looking a little overbought and the most recent peak lacked momentum which suggested the cracks were appearing. The sell-off though coincided with the OPEC+ meeting despite no changes being announced.
But it seems it was the lack of an update that may have contributed to the move, with Saudi Arabia and Russia in particular opting not to commit to extending their voluntary cuts beyond the end of the year. They may still do so but clearly with oil at these levels and demand at risk of softening, markets are now positioning for those restrictions in particular expiring in a couple of months.
Gold steady ahead of US jobs report
Gold appears to have stabilised in the run-up to the US jobs report after plunging on the back of rising bond yields. The question now is whether today's report will put investors' fears at ease, enabling a strong rebound in the yellow metal, or compound the slew of hawkish central bank commentary and hit it harder.
If we do see the latter, then $1,780-$1,800 stands out as a major test of potential support having been a major region in the past, most recently in February and March. The levels that stand out above, if we do see a rebound, are $1,860, $1,880, and $1,900.
Is bitcoin moving higher in anticipation of some good news?
Bitcoin has been quietly drifting higher in recent weeks despite broader market sentiment weakening and there being little progress on the spot bitcoin ETF. Perhaps there's some optimism building ahead of its expected acceptance which could be a significant milestone in its journey. It continues to see resistance around $28,000 though, a break of which could be a very bullish signal after almost two months of trading below here and multiple failures to break higher.
WTI Oil: On Track for Biggest Weekly Loss in Months But Oversold Studies May Slow Bears
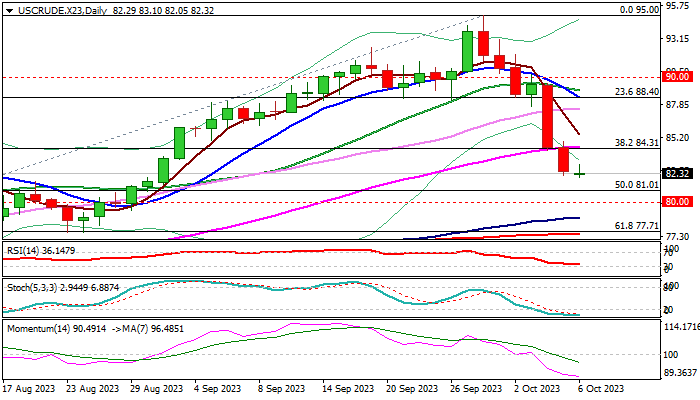
WTI oil remains at the back foot and holding at the lowest in five weeks on Friday, following a strong fall in past two days (down 7.6%).
Renewed concerns about further slowdown in global economic growth on keeping high interest rates for longer period, which would result in a more negative impact on oil demand, increased pressure on oil prices.
In addition, Russia had lifted its ban on diesel exports, imposed on Sep 21, which contributes to negative near-term outlook.
The WTI is on track for the biggest weekly loss since mid-March (over 9%), with massive bearish candle on weekly chart, signaling formation of reversal pattern.
Bears closed below pivotal Fibo support at $84.31 (38.2% of $67.02/$95.00) with weekly close below here to confirm bearish signal.
Daily studies weakened significantly, however, overstretched 14-d momentum and deeply oversold stochastic, might be an obstacle for bears, in addition to the headwinds provided by rising daily Ichimoku cloud, as the recent weakness approached cloud top ($81.79).
Limited consolidation should be ideally capped under $84.31/50 (broken Fibo 38.2% / 55DMA) to keep bears intact and offer better selling opportunities, for acceleration towards psychological $80 support.
Res: 83.10; 84.50; 84.87; 85.00.
Sup: 82.05; 81.01; 80.00; 78.81.
ECB’s Schnabel warns against complacency, “last kilometre” the most difficult
In an interview with Jutarnji List, ECB Executive Board Isabel Schnabel underlined the unpredictability surrounding the current inflation trajectory, cautioning against premature optimism despite recent encouraging data.
Schnabel stated, "We cannot say that we are at the peak (interest rates) or for how long rates will need to be kept at restrictive levels."
She emphasized the importance of closely monitoring three key metrics to make future monetary policy decisions: inflation outlook, dynamics of underlying inflation, the efficacy of monetary policy transmission. Encouragingly, she noted that "all of them are moving in the right direction."
However, the Board member didn't shy away from highlighting possible headwinds. She pointed out, "I still see upside risks to inflation," flagging potential supply-side shocks and stronger-than-anticipated wage growth, which could be offset by lower productivity growth. Firms might also face difficulty in absorbing these increased costs, which, if realized, could necessitate further hikes in interest rates.
While Schnabel acknowledged the downward trend in inflation as "encouraging," she emphasized that it still remains considerably above the ECB's 2% target. The aim, she said, should be to hit this target by 2025 to ensure inflation expectations "firmly anchored". However, she cautioned about the challenges in reaching this goal, noting that the "last kilometre" may be the most challenging.
The recent surge in oil prices was another point of concern for Schnabel, suggesting that inflation could face upward pressures from unforeseen supply shocks, especially in sectors like energy and food. She added a call for vigilance, urging that "we must not be complacent, and we should not declare victory over inflation prematurely."
Gold Technical: Consolidation in US 10-year Treasury Yield May Offer a Relief Bounce
- Spot Gold (XAU/USD) has a significant indirect correlation with the 10-year US Treasury yield since May 2023.
- A potential short-term pull-back in US 10-year Treasury yield below a 4.90% key medium-term resistance may offer a “relief mean reversion rebound” on spot Gold.
- Watch the key support of US$1,810 on spot Gold.
In the past two weeks, the price of spot Gold (XAU/USD) has tumbled swiftly by -6.90% from its 21 September 2023 high of US$1,947 to a seven-month low of US$1,813 printed on Thursday, 5 October.
The primary driver has been the rapidly rising longer-term US Treasury yields that increase the opportunity cost of holding gold due to its “zero-yielding asset” nature. The 10-year US Treasury yield, a benchmark for long-term interest rates has increased by 158 basis points from its May 2023 low to a recent high of 4.88% on Wednesday, 4 October.
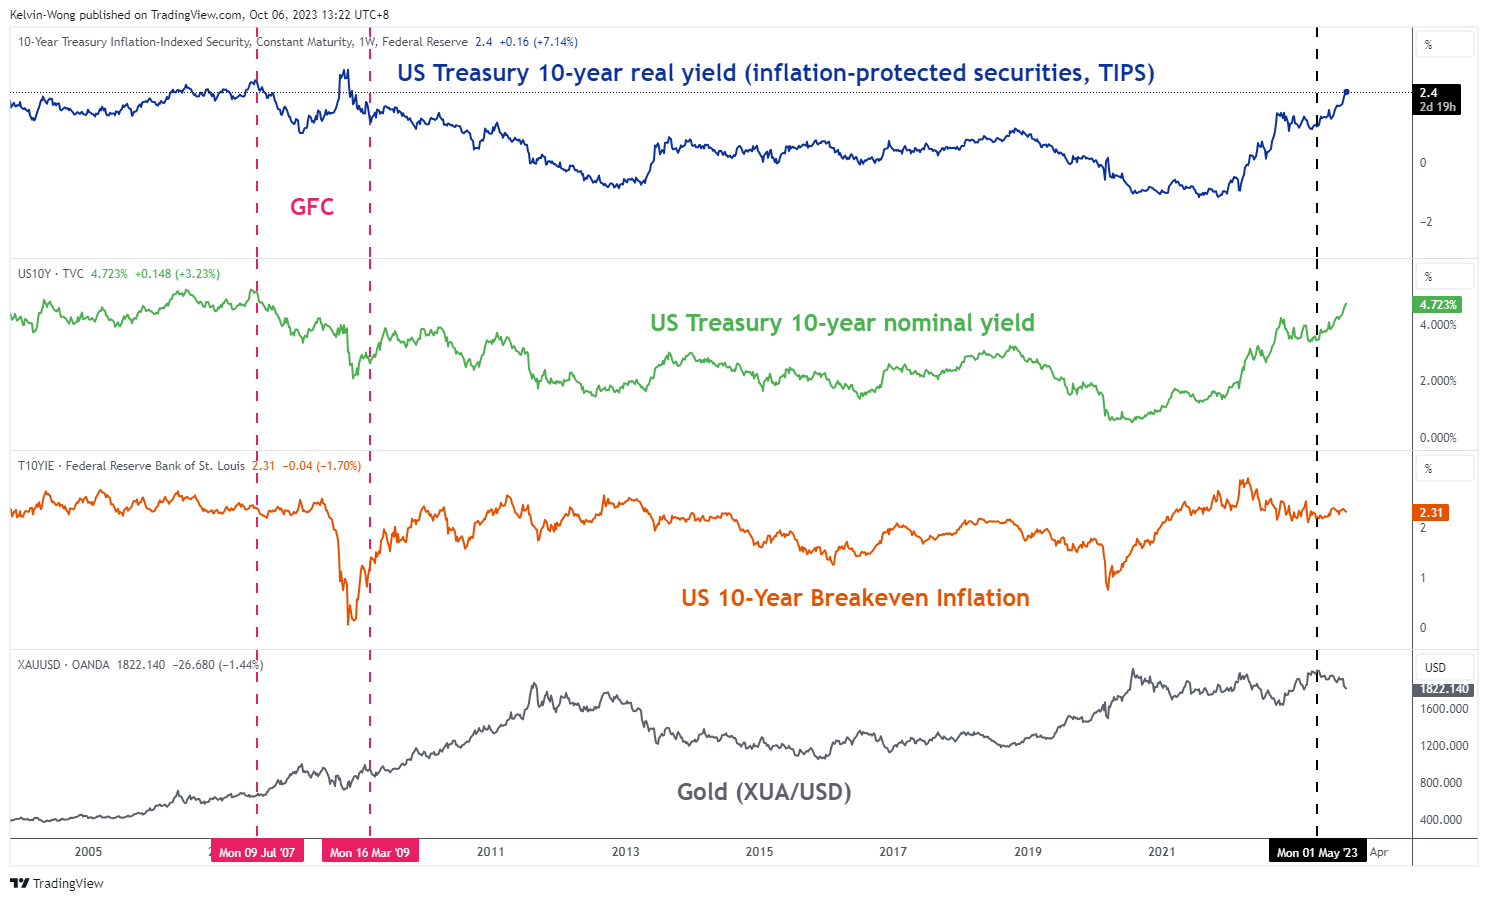
Fig 1: Spot Gold (XAU/USD) correlation with 10-year US Treasury yield as of 6 Oct 2023 (Source: TradingView, click to enlarge chart)
Potential pull-back for US 10-year Treasury yield
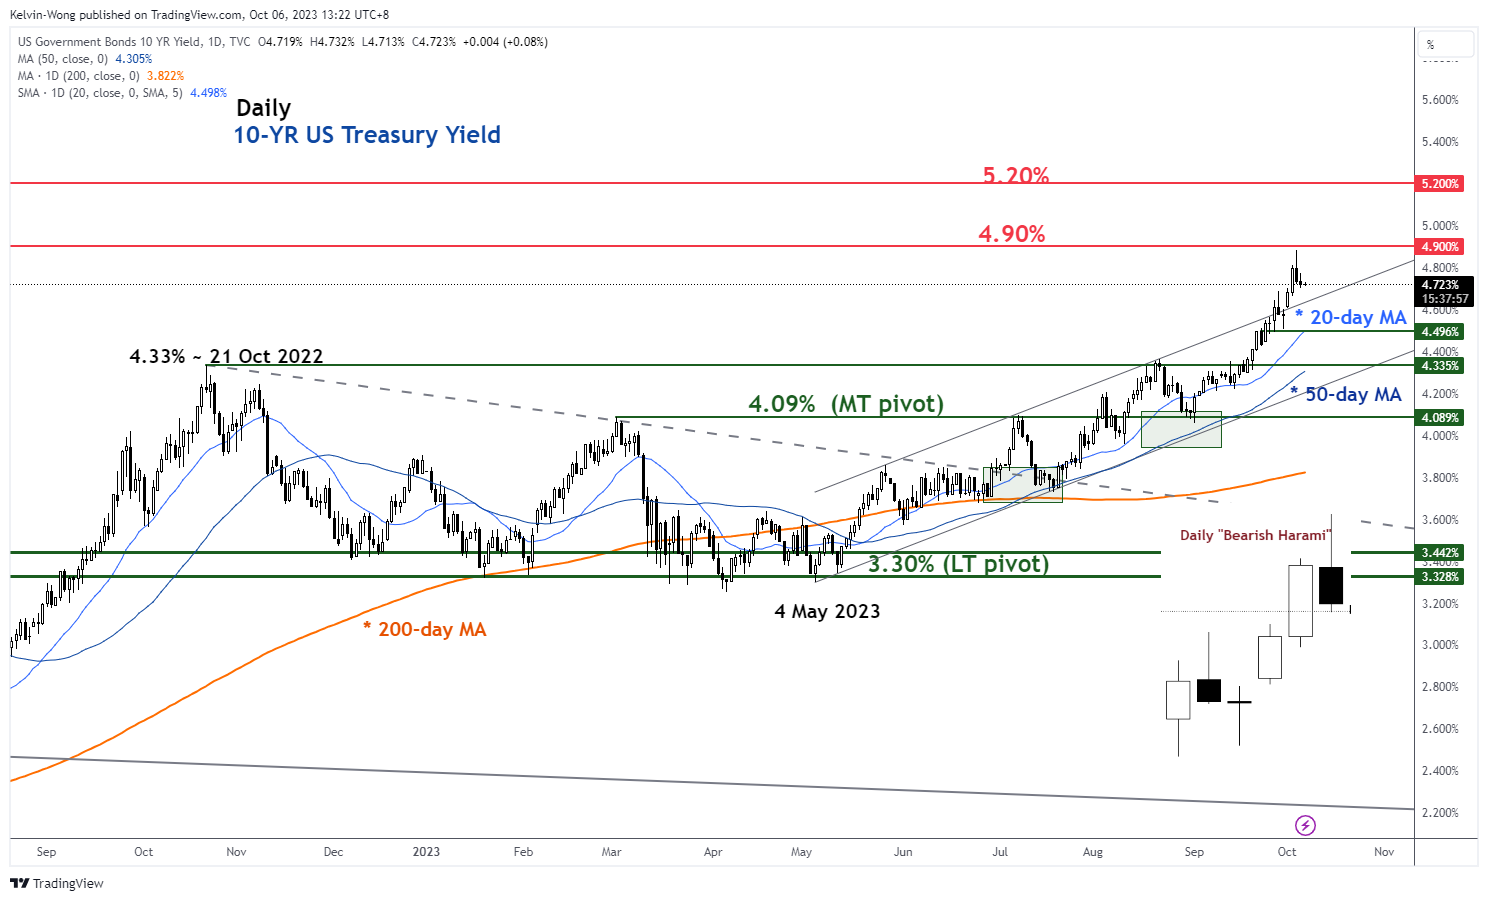
Fig 2: US 10-year Treasury yield medium-term trend as of 6 Oct 2023 (Source: TradingView, click to enlarge chart)
Its current short-term uptrend phase from the 1 September 2023 low of 4.06% has been overextended to the upside where it has formed a “Bearish Harami” right below a key-medium resistance of 4.90%, a two-candlestick bearish reversal pattern taking into account of its price actions on 3 and 4 October 2023 as seen on the daily chart.
Hence, the 10-yield US Treasury yield may start to shape a pull-back towards its 20 and 50-day moving averages acting as a support zone of 4.50%/4.33% that can provide some form of short-term ‘relief mean reversion rebound” for spot Gold (XAU/USD) given its significant indirect correlation with the 10-yield US Treasury yield since May 2023.
Watch the US$1,810 key medium-term support on Gold
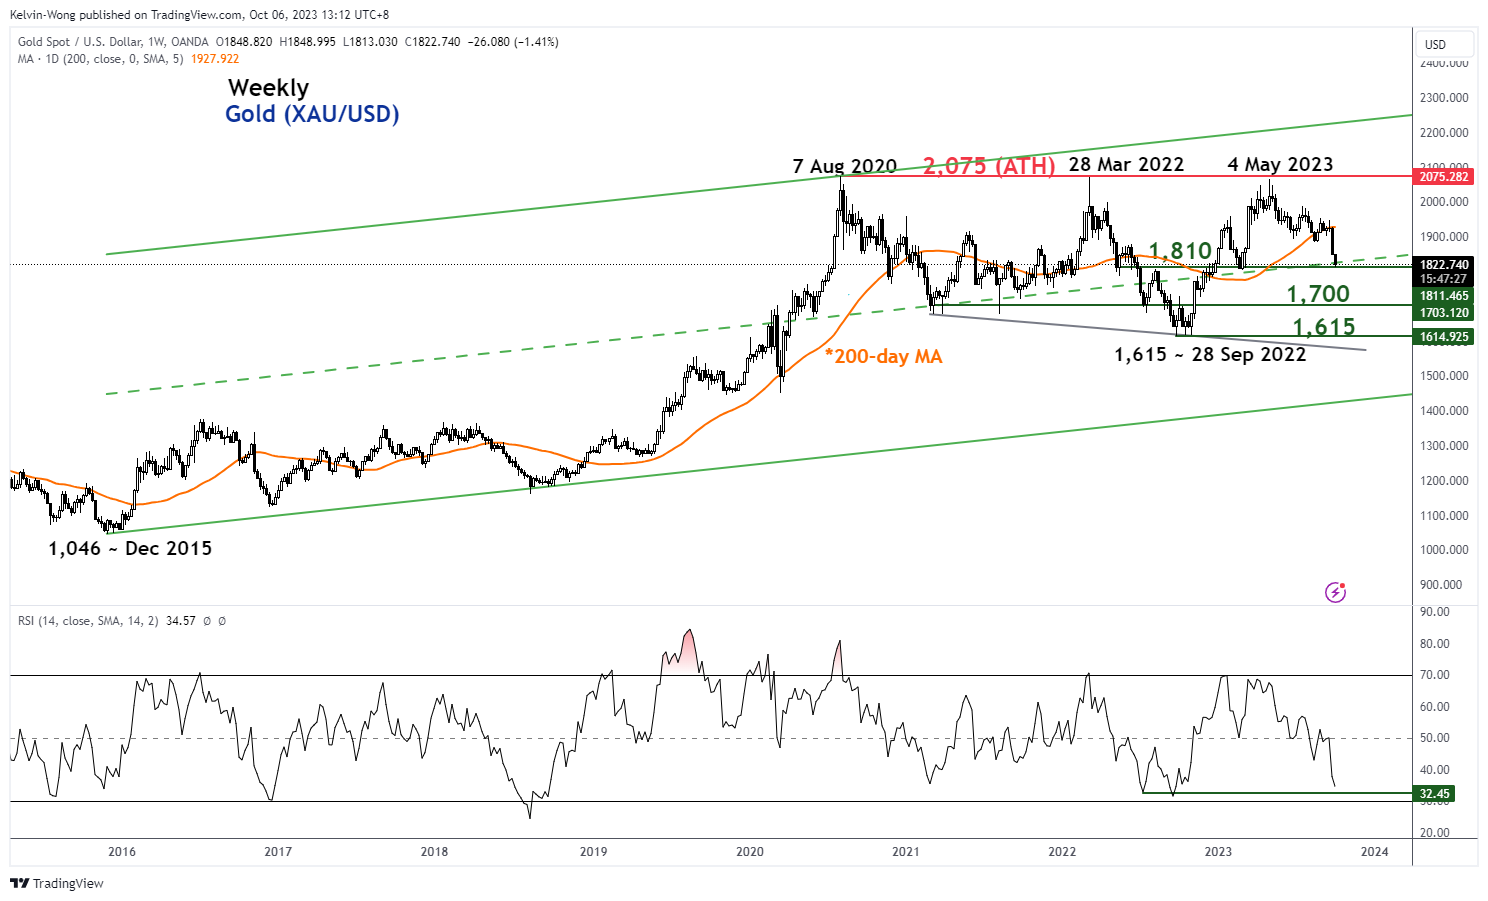
Fig 3: Spot Gold (XAU/USD) major trend as of 6 Oct 2023 (Source: TradingView, click to enlarge chart)
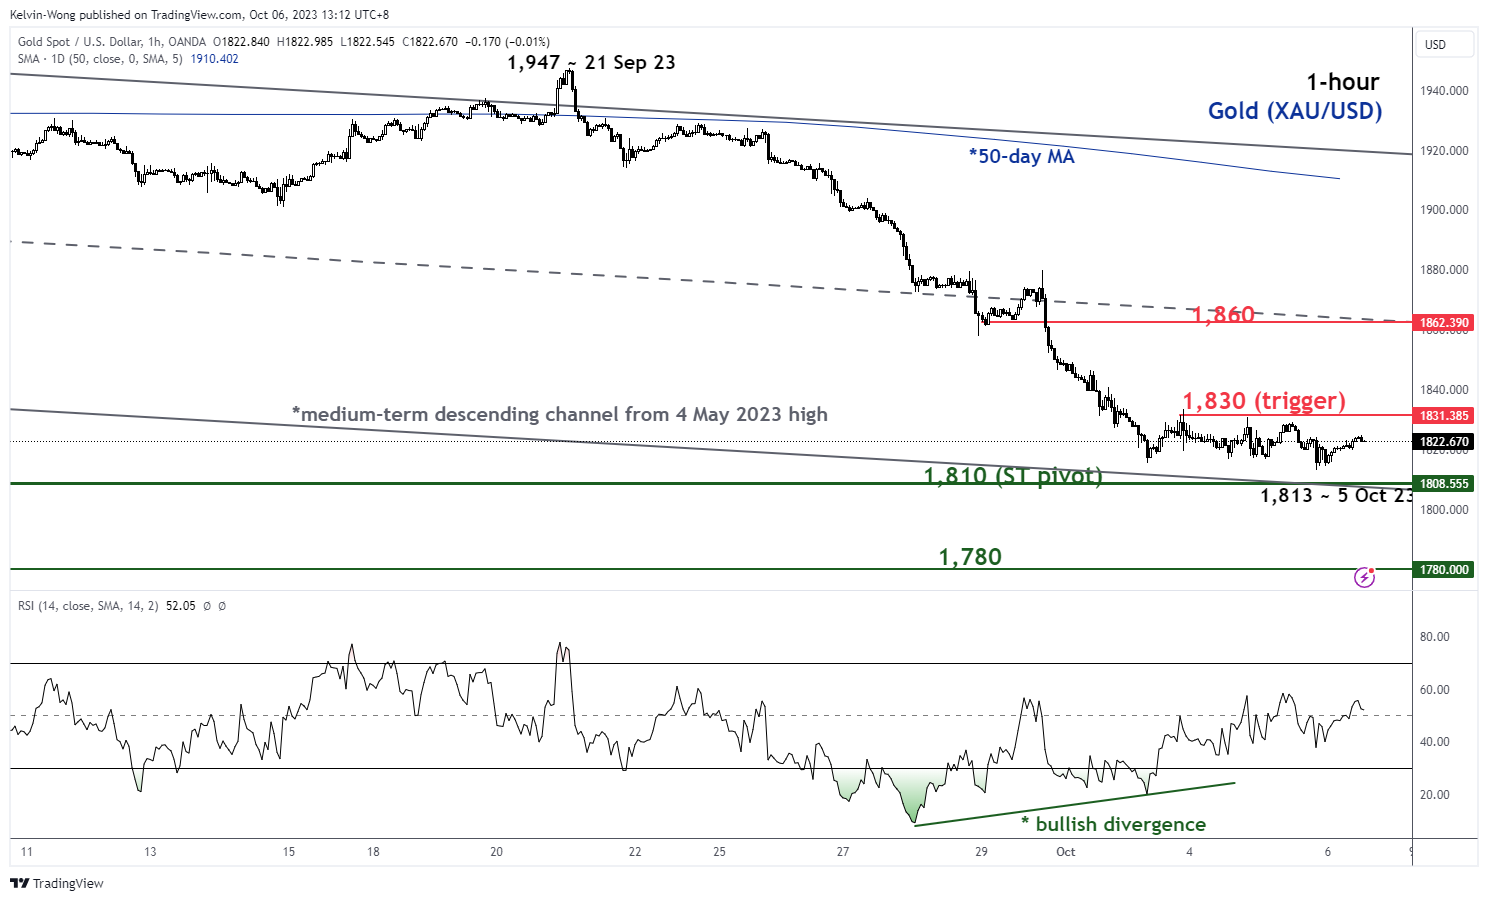
Fig 4: Spot Gold (XAU/USD) minor short-term trend as of 6 Oct 2023 (Source: TradingView, click to enlarge chart)
The five-month medium-term downtrend phase of spot Gold (XAU/USD) from its 4 May 2023 high of US$2,067 has reached a key medium-term support of US$1,810 which is defined by the median line of the long-term secular ascending channel in place since December 2015 low and close to the 61.8% Fibonacci retracement of the prior major uptrend phase from 28 September 2022 low to 4 May 2023 high as seen on the daily chart.
On the shorter-term chart, the 1-hour RSI oscillator has flashed a recent bullish divergence condition at its oversold region which suggests that the downside momentum of its short-term downtrend phase from the 21 September 2023 high to 5 October 2023 low has eased.
These observations suggest a potential short-term counter trend mean reversion rebound scenario may occur next. A break above the near-term resistance of US$1,830 sees the next resistance coming in at US$1,860 (the median line of the medium-term descending channel from 4 May 2023 high & 38.2% Fibonacci retracement of the recent decline from 21 September 2023 high to 5 October 2023 low).
On the other hand, a break below the US$1,810 pivotal support invalidates the mean reversion rebound scenario to expose the next support at US$1,780 (minor congestion area from 15 November 2023 to 15 December 2022) in the first step.
AUDUSD Bulls Step in But Caution Still Warranted
- AUDUSD pivots higher near familiar support
- Short-term risk remains skewed to the downside
- Next resistance expected to emerge near 20-SMA
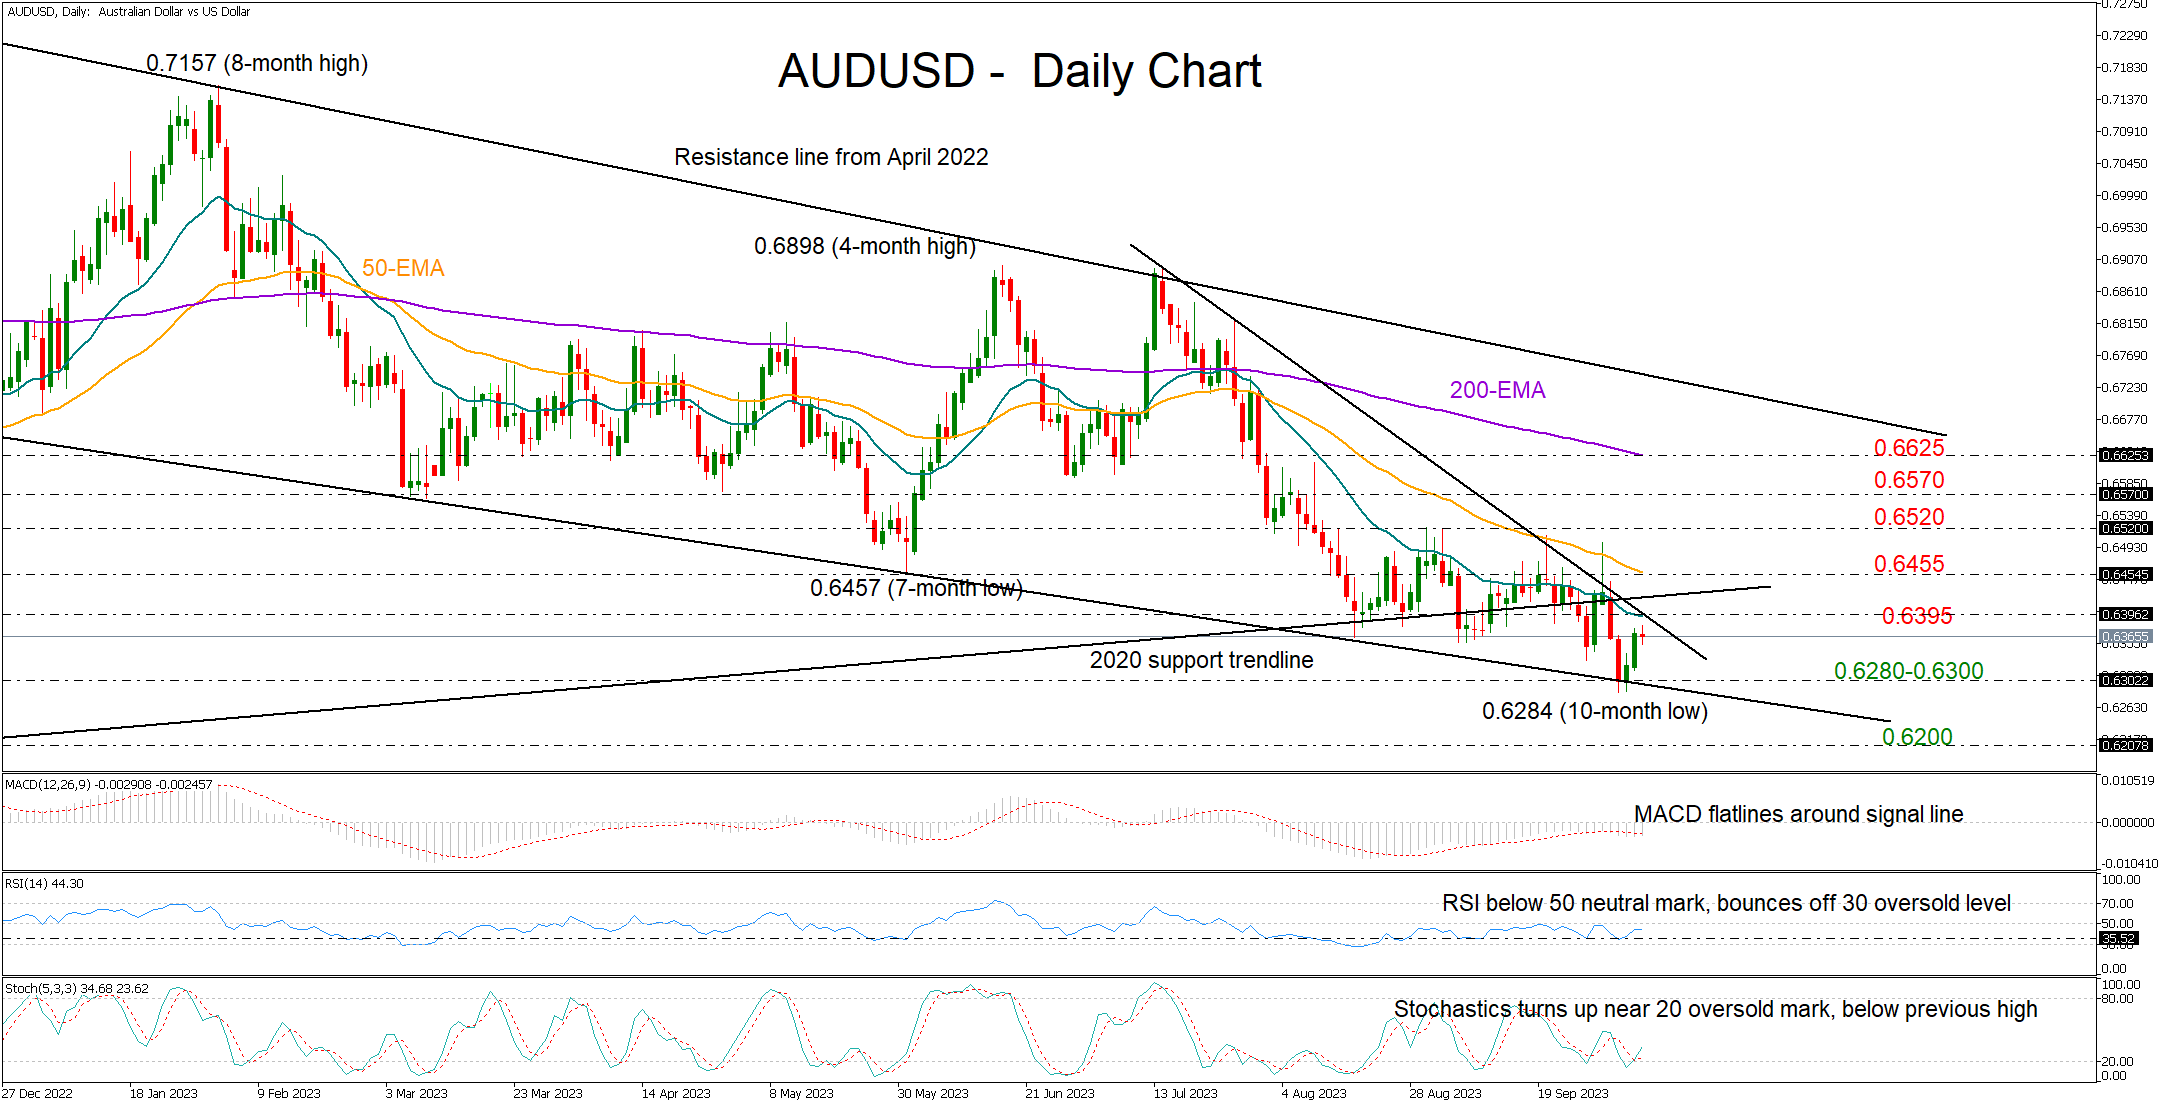
AUDUSD found shelter near the descending line drawn from December 2022 for the fifth time, avoiding any declines below the 0.6300 round level.
The RSI and the stochastic oscillators have deviated above their oversold levels, backing the recent rise in the price. Still, they haven’t exited the bearish area, keeping the focus on the 0.6395-0.6455 important resistance zone, where the 20- and 50-day simple moving averages (SMAs) as well as two constraining lines could reject any potential increases. Then the bulls will need to violate the downward path above 0.6520 and run beyond 0.6570 in order to meet the 200-day SMA at 0.6625.
Should the downtrend extend below the 0.6300 round-level and the critical support line, the price could initially seek protection near the 0.6200 mark and then within the 0.6100-0.6120 region last seen in April 2020.
Overall, AUDUSD has re-activated its bearish trajectory from mid-July earlier this week and a sustainable recovery above 0.6520 is now needed to eliminate negative risks in the market.
USDCAD Explodes to a Fresh 6-Month High
- USDCAD in an aggressive advance, smashing previous resistance zones
- Formation of a golden cross boosts bulls’ appetite
- Momentum indicators ease but remain deeply positive
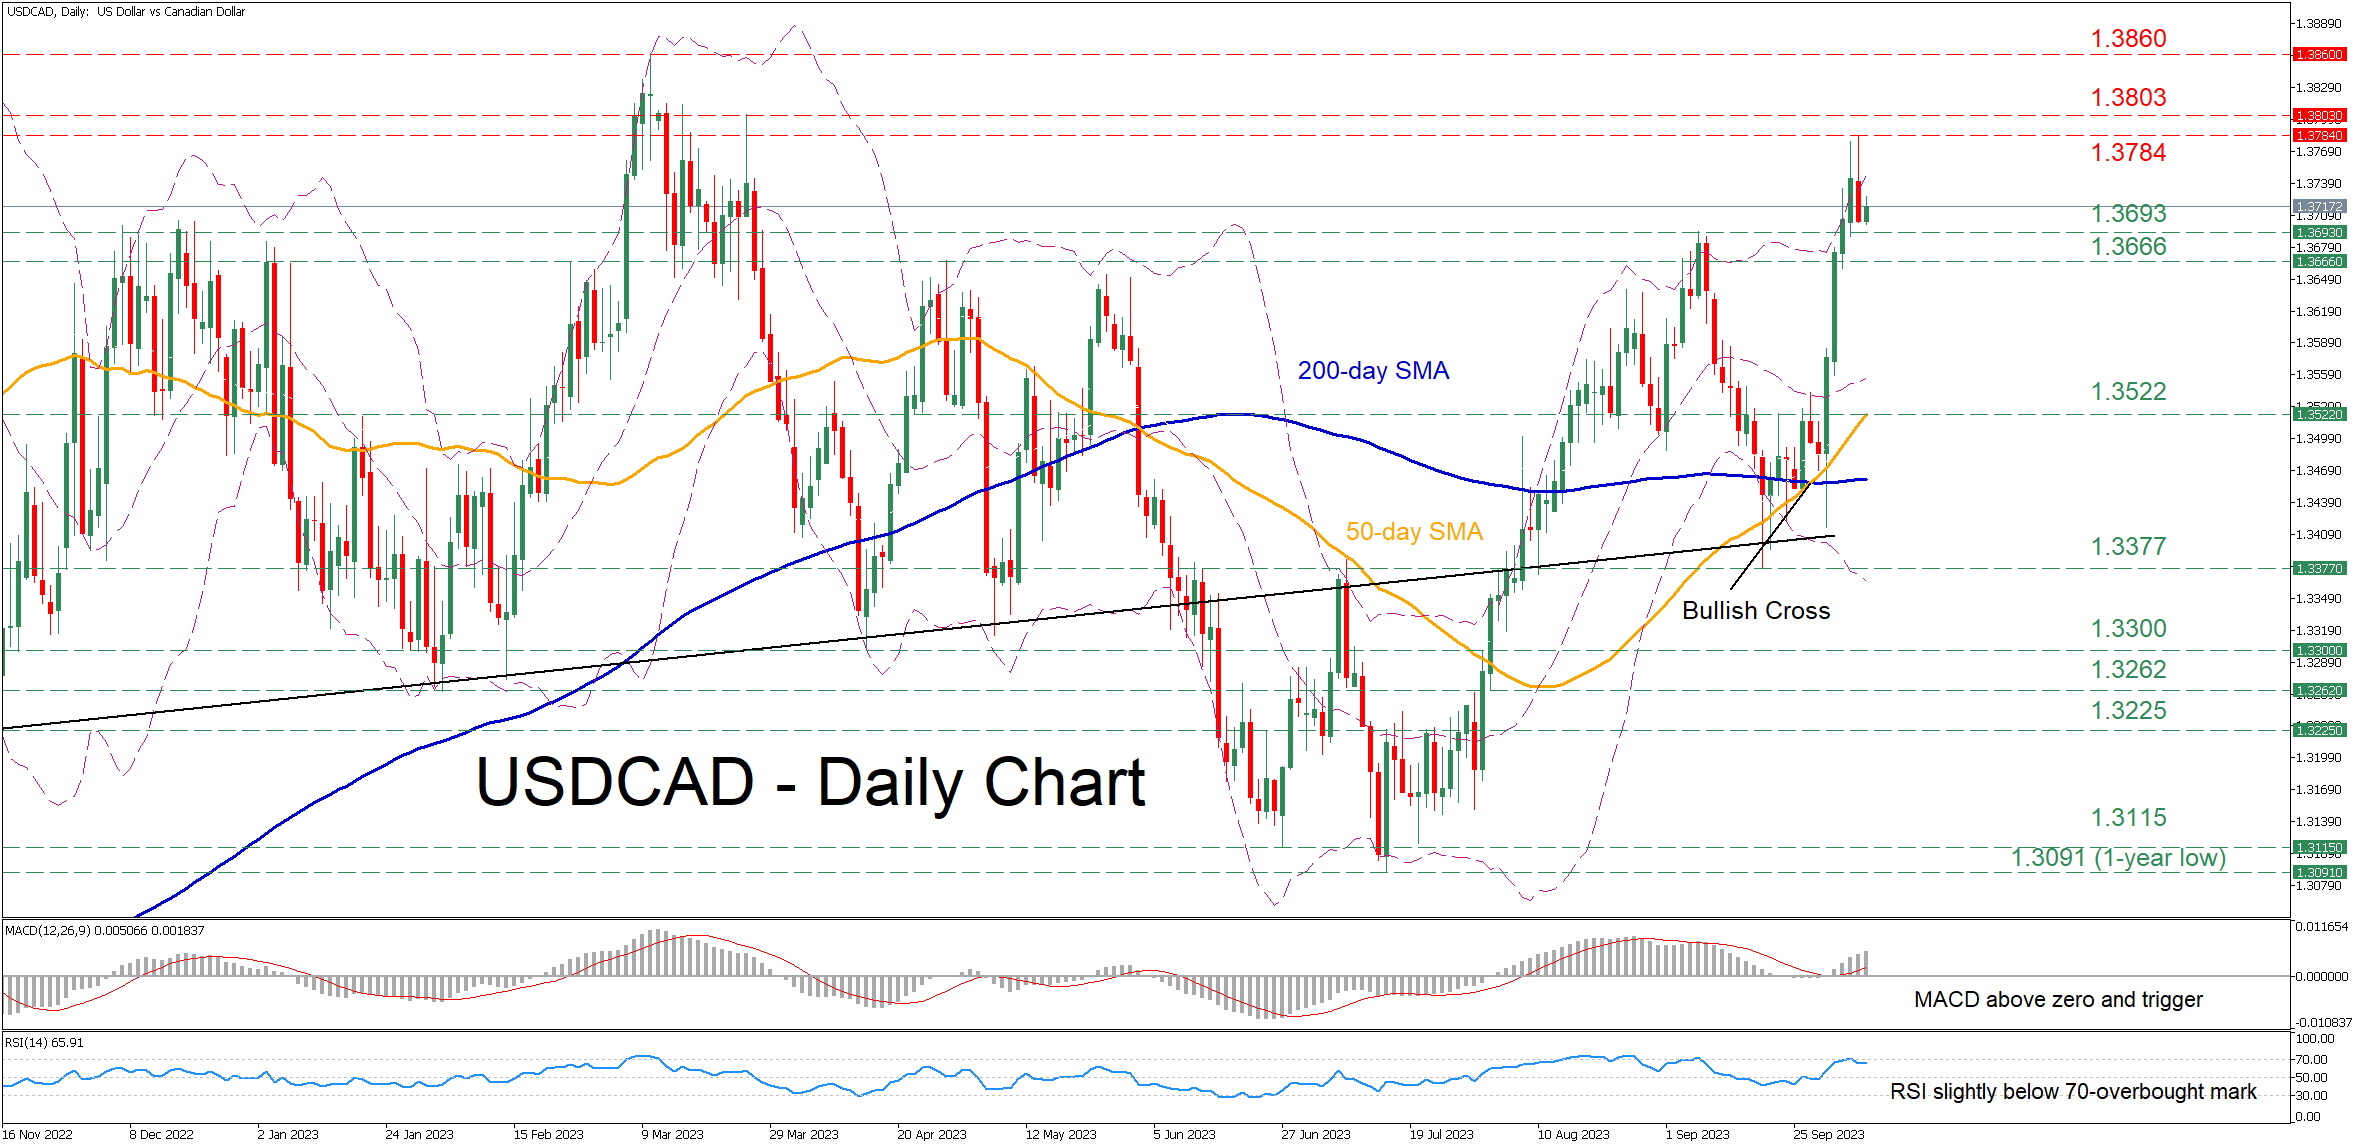
USDCAD managed to totally erase its recent downside correction and edge higher towards a fresh six-month peak of 1.3784. However, the pair has surrendered some gains in the last couple of sessions after the short-term oscillators pointed at overbought conditions.
Should buying interest persist, the pair could re-test the recent rejection region of 1.3784. A break above that zone could open the door for the March resistance of 1.3803. Even higher, the 2023 high of 1.3860 may cap further advances.
Alternatively, if the pair corrects to the downside, a couple of previous resistance regions such as 1.3693 and 1.3666 could provide initial downside protection. Sliding below the latter, the price could then test 1.3522, which overlaps with the 50-day simple moving average (SMA). Should that barricade also fail, the spotlight could turn to the September low of 1.3377.
In brief, USDCAD has experienced a solid rally in the past few sessions, storming to a fresh six-month peak just shy of the 1.3800 handle before paring some gains. Is this the beginning of a pullback or are the bulls poised to challenge the 2023 highs?
Dollar Index Keeps Bullish Stance Ahead of NFP Report
The dollar index is trading within a narrow range on Friday morning and expected quiet mode, as markets await release of the US NFP report, key event of the week.
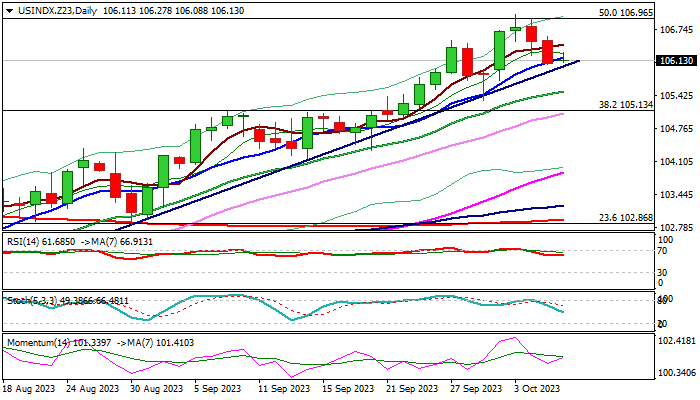
Near-term action remains above trendline support (106.01), following a two-day pullback from new 2023 peak (107.03) which so far looks like a healthy correction of a larger uptrend and offering better levels to re-enter bullish market.
Bullish daily studies continue to support the action for renewed attack through pivotal 107.00 resistance zone (50% retracement of 114.72/99.20 / psychological / weekly cloud top) break of which would signal bullish continuation.
However, fundamentals are likely to play a key role in signaling direction today, as traders look for more clues about the condition in the US labor market, which will directly influence Fed’s view on interest rates in the near future.
US job growth is expected to slightly slow in September (NFP Sep 170K f/c vs Aug 187K), but unemployment rate is expected to ease from 1 ½ year high (Sep 3.7% f/c vs Aug 3.8%) and wage growth expected to remain elevated (Sep 0.3% vs Aug 0.2%).
Forecasted numbers suggest that the US labor sector remains resilient and the least impacted from high borrowing cost among the economy’s key pillars, with expected small easing not to significantly impact overall positive picture.
The Federal Reserve would, in such conditions, opt for another rate hike by the end of the year, or more likely, keep monetary policy tight for some time, as recent drastic measures in putting inflation under control, still did not provide desired impact on the economy.
The other two reports from the US labor sector, released earlier this week, were mixed as job openings rose well above forecasts, while hiring in private sector fell significantly last month.
Better than expected numbers in Sep NFP report would add to Fed’s hawkish stance and subsequently further support the dollar, while demand for greenback would ease on NFP miss.
Expect initial direction signals on sustained break of trendline support (bearish) or lift above 107.00 zone pivotal barriers (bullish).
Res: 106.96; 107.13; 107.88; 108.79.
Sup: 106.01; 105.50; 105.13; 104.32.
AUD/USD and NZD/USD Aim Steady Recovery
AUD/USD is attempting a recovery wave from 0.6285. NZD/USD is also rising and facing a major hurdle near the 0.5980 level.
Important Takeaways for AUD/USD and NZD/USD Analysis Today
- The Aussie Dollar found support near 0.5870 and is now recovering against the US Dollar.
- There is a key rising channel forming with resistance near 0.6385 on the hourly chart of AUD/USD at FXOpen.
- NZD/USD is attempting a recovery wave above the 0.5930 resistance.
- There is a major bullish trend line forming with support near 0.5950 on the hourly chart of NZD/USD at FXOpen.
AUD/USD Technical Analysis
On the hourly chart of AUD/USD at FXOpen, the pair recovered above 0.6450. However, the Aussie Dollar failed to clear 0.6500 and started a fresh decline against the US Dollar.
The pair declined below the 0.6385 support. Finally, the bulls appeared near the 0.6285 zone. A low was formed near 0.6285 and the pair is now correcting losses. There was a move above the 23.6% Fib retracement level of the downward move from the 0.6500 swing high to the 0.6285 low.
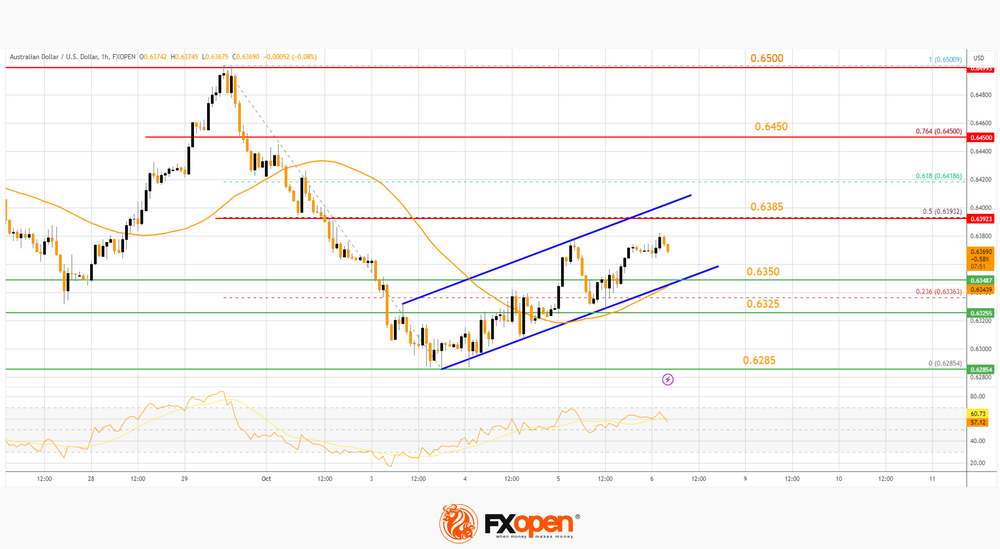
The pair is now above 0.6350 and the 50-hour simple moving average. On the upside, an immediate resistance is near the 50% Fib retracement level of the downward move from the 0.6500 swing high to the 0.6285 low at 0.6385.
The first major resistance is near a rising channel at 0.6450. A clear upside break above 0.6450 could send the pair toward 0.6500. The next major resistance on the AUD/USD chart is near 0.6550, above which the price could rise toward 0.6620. Any more gains might send the pair toward 0.6650.
On the downside, initial support is near the channel trend line at 0.6350. The next support could be the 0.6325. Any more losses might send the pair toward the 0.6285 support.
NZD/USD Technical Analysis
On the hourly chart of NZD/USD on FXOpen, the pair also followed a similar pattern and declined from the 0.6050 zone. The New Zealand Dollar gained bearish momentum and traded below 0.5950 against the US Dollar.
The pair even dropped below the 50-hour simple moving average and tested 0.5875. A low was formed near 0.5870 and the pair is now attempting a fresh increase. It is back above the 0.5930 level and the 50-hour simple moving average.
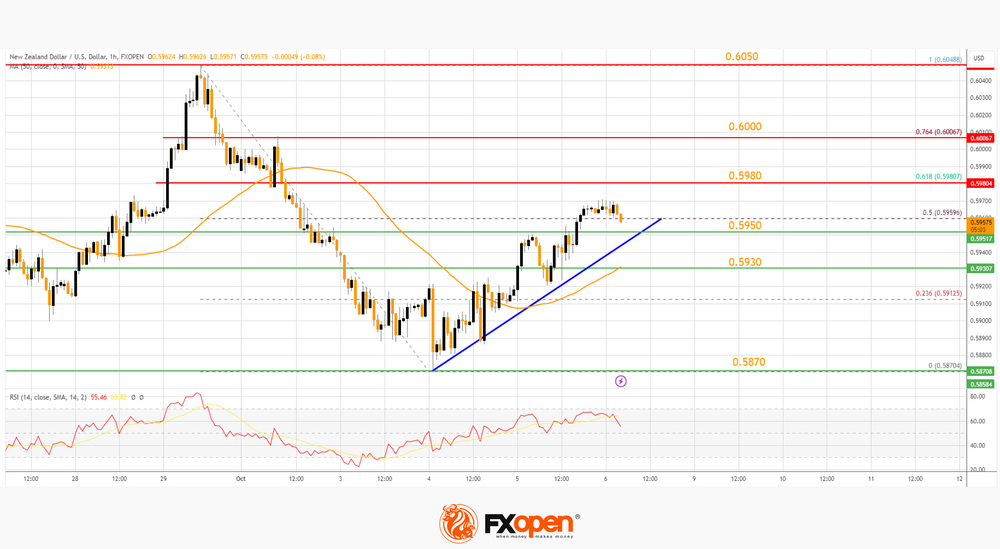
It is now consolidating to clear the 50% Fib retracement level of the downward move from the 0.6048 swing high to the 0.5870 low. There is also a major bullish trend line forming with support near 0.5950.
On the upside, the pair is facing resistance near the 61.8% Fib retracement level of the downward move from the 0.6048 swing high to the 0.5870 low at 0.5980. The next major resistance is near 0.6000. If there is a move above 0.6000, the pair could rise toward the 0.6050 resistance.
Any more gains might open the doors for a move toward the 0.6120 resistance zone. On the downside, immediate support on the NZD/USD chart is near 0.5950.
The next major support is near the 0.5930 zone. If there is a downside break below 0.5930, the pair could extend the decline toward the 0.5870 level. The next key support is near 0.5820.
Trade global forex with the Innovative Broker of 2022*. Choose from 50+ forex markets 24/5. Open your FXOpen account now or learn more about trading forex with FXOpen.
* FXOpen International, Innovative Broker of 2022, according to the IAFT
This article represents the opinion of the Companies operating under the FXOpen brand only. It is not to be construed as an offer, solicitation, or recommendation with respect to products and services provided by the Companies operating under the FXOpen brand, nor is it to be considered financial advice.
FX and Stock Markets Remain Reluctant to Really Enter Correction Mode
Markets
The (very) long end of the US yield curve failed to build out additional (Treasury) gains after Wednesday’s meaningful correction. A third consecutive week of extremely low jobless claims (202k-207k range) might already halted bond enthusiasts even as oil prices tanked further ($86/b to $84/b). However, we’d still err on the correction side today with US payrolls scheduled. Anything bar an outrageously positive number will likely call for some cautiousness going into the weekend. Consensus expects a net job gain of 170k with unemployment rate ticking lower again to 3.7%. Although the correlation is weaker than in the past, Wednesday’s job report by payroll processor ADP suggests that the US labour market is becoming more balanced again. Daily changes on the US yield curve eventually ranged between -4 bps (3-yr) and +3.2 bps (30-yr) yesterday. The outperformance at the front end of the curve is related to the recent underperformance of the very long end. As San Francisco Fed Daly pointed out at an high-profile event at The Economic Club of NY: the tightening of financial conditions is equivalent to about one rate hike. “When bond yields rose, we saw the probability on the November meeting go down. To me, that says the markets are understanding how we think about things and they do have the reaction function in mind,” she said. Additionally, holding rates steady is an active policy action she argues as policy will grow increasingly restrictive as inflation and inflation expectations fall. The German yield curve showed a more or less similar pattern with yields sliding 4.9 bps (5-yr) to 1.8 bps (30-yr). Intra-EMU spreads remain under pressure with the 10-yr Italian spread closing above 200 bps for the first time since the start of this year.
FX and stock markets remain reluctant to really enter correction mode as well. European equity markets recovered 0.5% while key US gauges ended with small losses. Technical pictures remain fragile for both going into Q3 earnings which get going next Friday with several US banks. Apart from the results, it could be (worrying) outlooks that influence risk sentiment. The trade-weighted dollar (DXY) closed at the intraday low of 106.32 from an open at 106.77, but remains within the upward trend channel since mid-July. EUR/USD rebounded from around 1.05 to 1.0550 and is similarly locked in a downward channel.
News and views
Japan labour earnings growth remained below expectations in August. Labour cash earning were unchanged at 1.1% Y/Y. Corrected for inflation this translated into a decline in real earnings by 2.5% Y/Y, indicating a further erosion of purchasing power for Japanese households. Real household spending dropped by 2.5% Y/Y but M/M-growth was rather strong at 3.9%, suggesting some improvement in spending momentum. The wage growth data are still below the (real) growth that the Bank of Japan considers as important to conclude that the structural deflationary trend isover. As such, the data suggest that the BoJ won’t be in a hurry to make a U-turn in its ultra-easy policy. At the same time, the combination of a weak yen and rising bond yields are putting pressure on the BoJ to consider catching up with the broader trend of monetary normalization. The 10-y Japanese bond yield holds this morning near the cycle top (0.805%). The yen stabilizes near USD/JPY 148 area after testing the 150 barrier earlier this week.
In a press conference one day after the National Bank of Poland cut its policy rate further by 25 bps to 5.75%, governor Glapinski commented on the NBP’s policy intentions/assessment. He indicated that the NBP favours gradual changes in the in the policy rate in order not to disturb economic agents. Glapinski expects CPI inflation near 6-7% at the end of this year, with a further decrease next year (5% mid 2024) as the economy would grow only slightly this year an gradual in 2024. He advocated that current cuts won’t affect the path to the NBP inflation target. He still considers the current rate level as high. On the zloty, Glapinski suggested that the NBP doesn’t worry about the current level of the zloty. There is no reason to intervene in the FX market now. Still a stronger zloty would help to bring inflation back under control over time. The zloty yesterday lost modest ground during the press conference after rebounding post the NBP decision on Wednesday (close EUR/PLN near 4.60).