Sample Category Title
Gold Collapses Towards 1,800, Stuck in Oversold Conditions
- Gold posts eighth straight daily loss, touching its lowest levels since March
- Decline shows no signs of easing, widening Bollinger bands point to high volatility
- Oscillators deep in oversold zone for quite some time, bulls remain on the sidelines
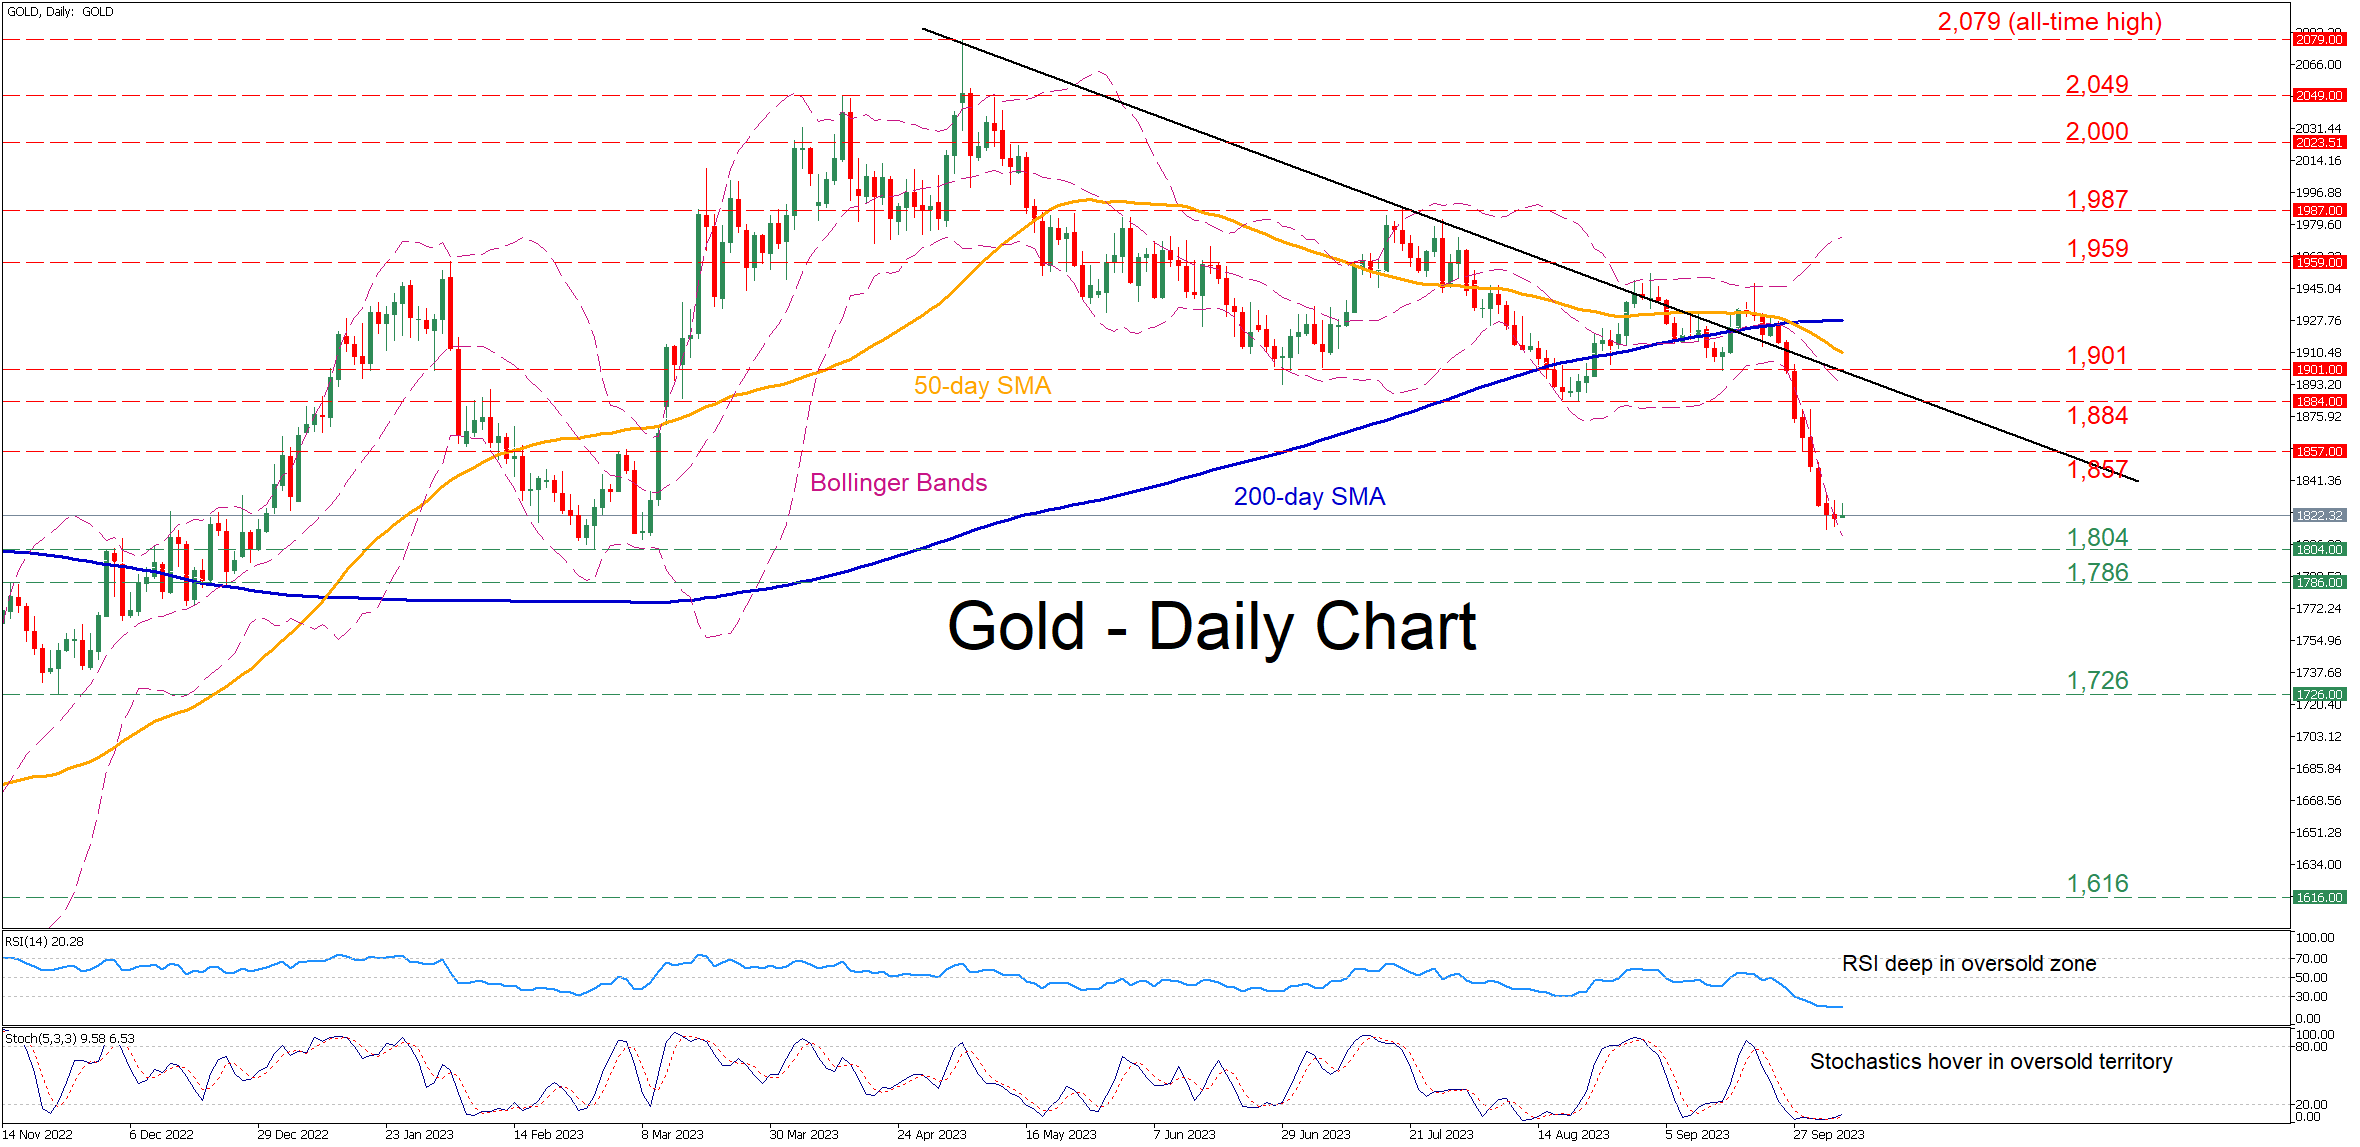
Gold has been in a steep downtrend after violating both its 50- and 200-day simple moving averages (SMAs). Even though the momentum indicators suggest that the retreat has been overstretched, the price appears unable to stage a rebound.
If the bears attempt to push the price even lower, the most prominent support could be the March bottom of 1,804, which is the lowest level observed in 2023. Falling to halt there, bullion might descend towards the November 2022 resistance of 1,786 that could serve as support in the future. Should that barricade also fail, the spotlight could turn to the November 2022 support of 1,726.
On the flipside, bullish actions could propel bullion towards the March resistance of 1,857. Surpassing that region, the price may face a couple of previous support regions such as 1,884 and 1,901. A violation of that region could set the stage for the February peak of 1,959.
All in all, gold seems to be under relentless downside pressure, which has pushed the price into oversold conditions. Can the bulls strike back?
US 30 Cash Index Takes a Much-Needed Breather
- US 30 cash index edges higher, a tad above the May 25 low
- The short-term bearish trend remains dominant
- Momentum indicators don't point to a reversal yet
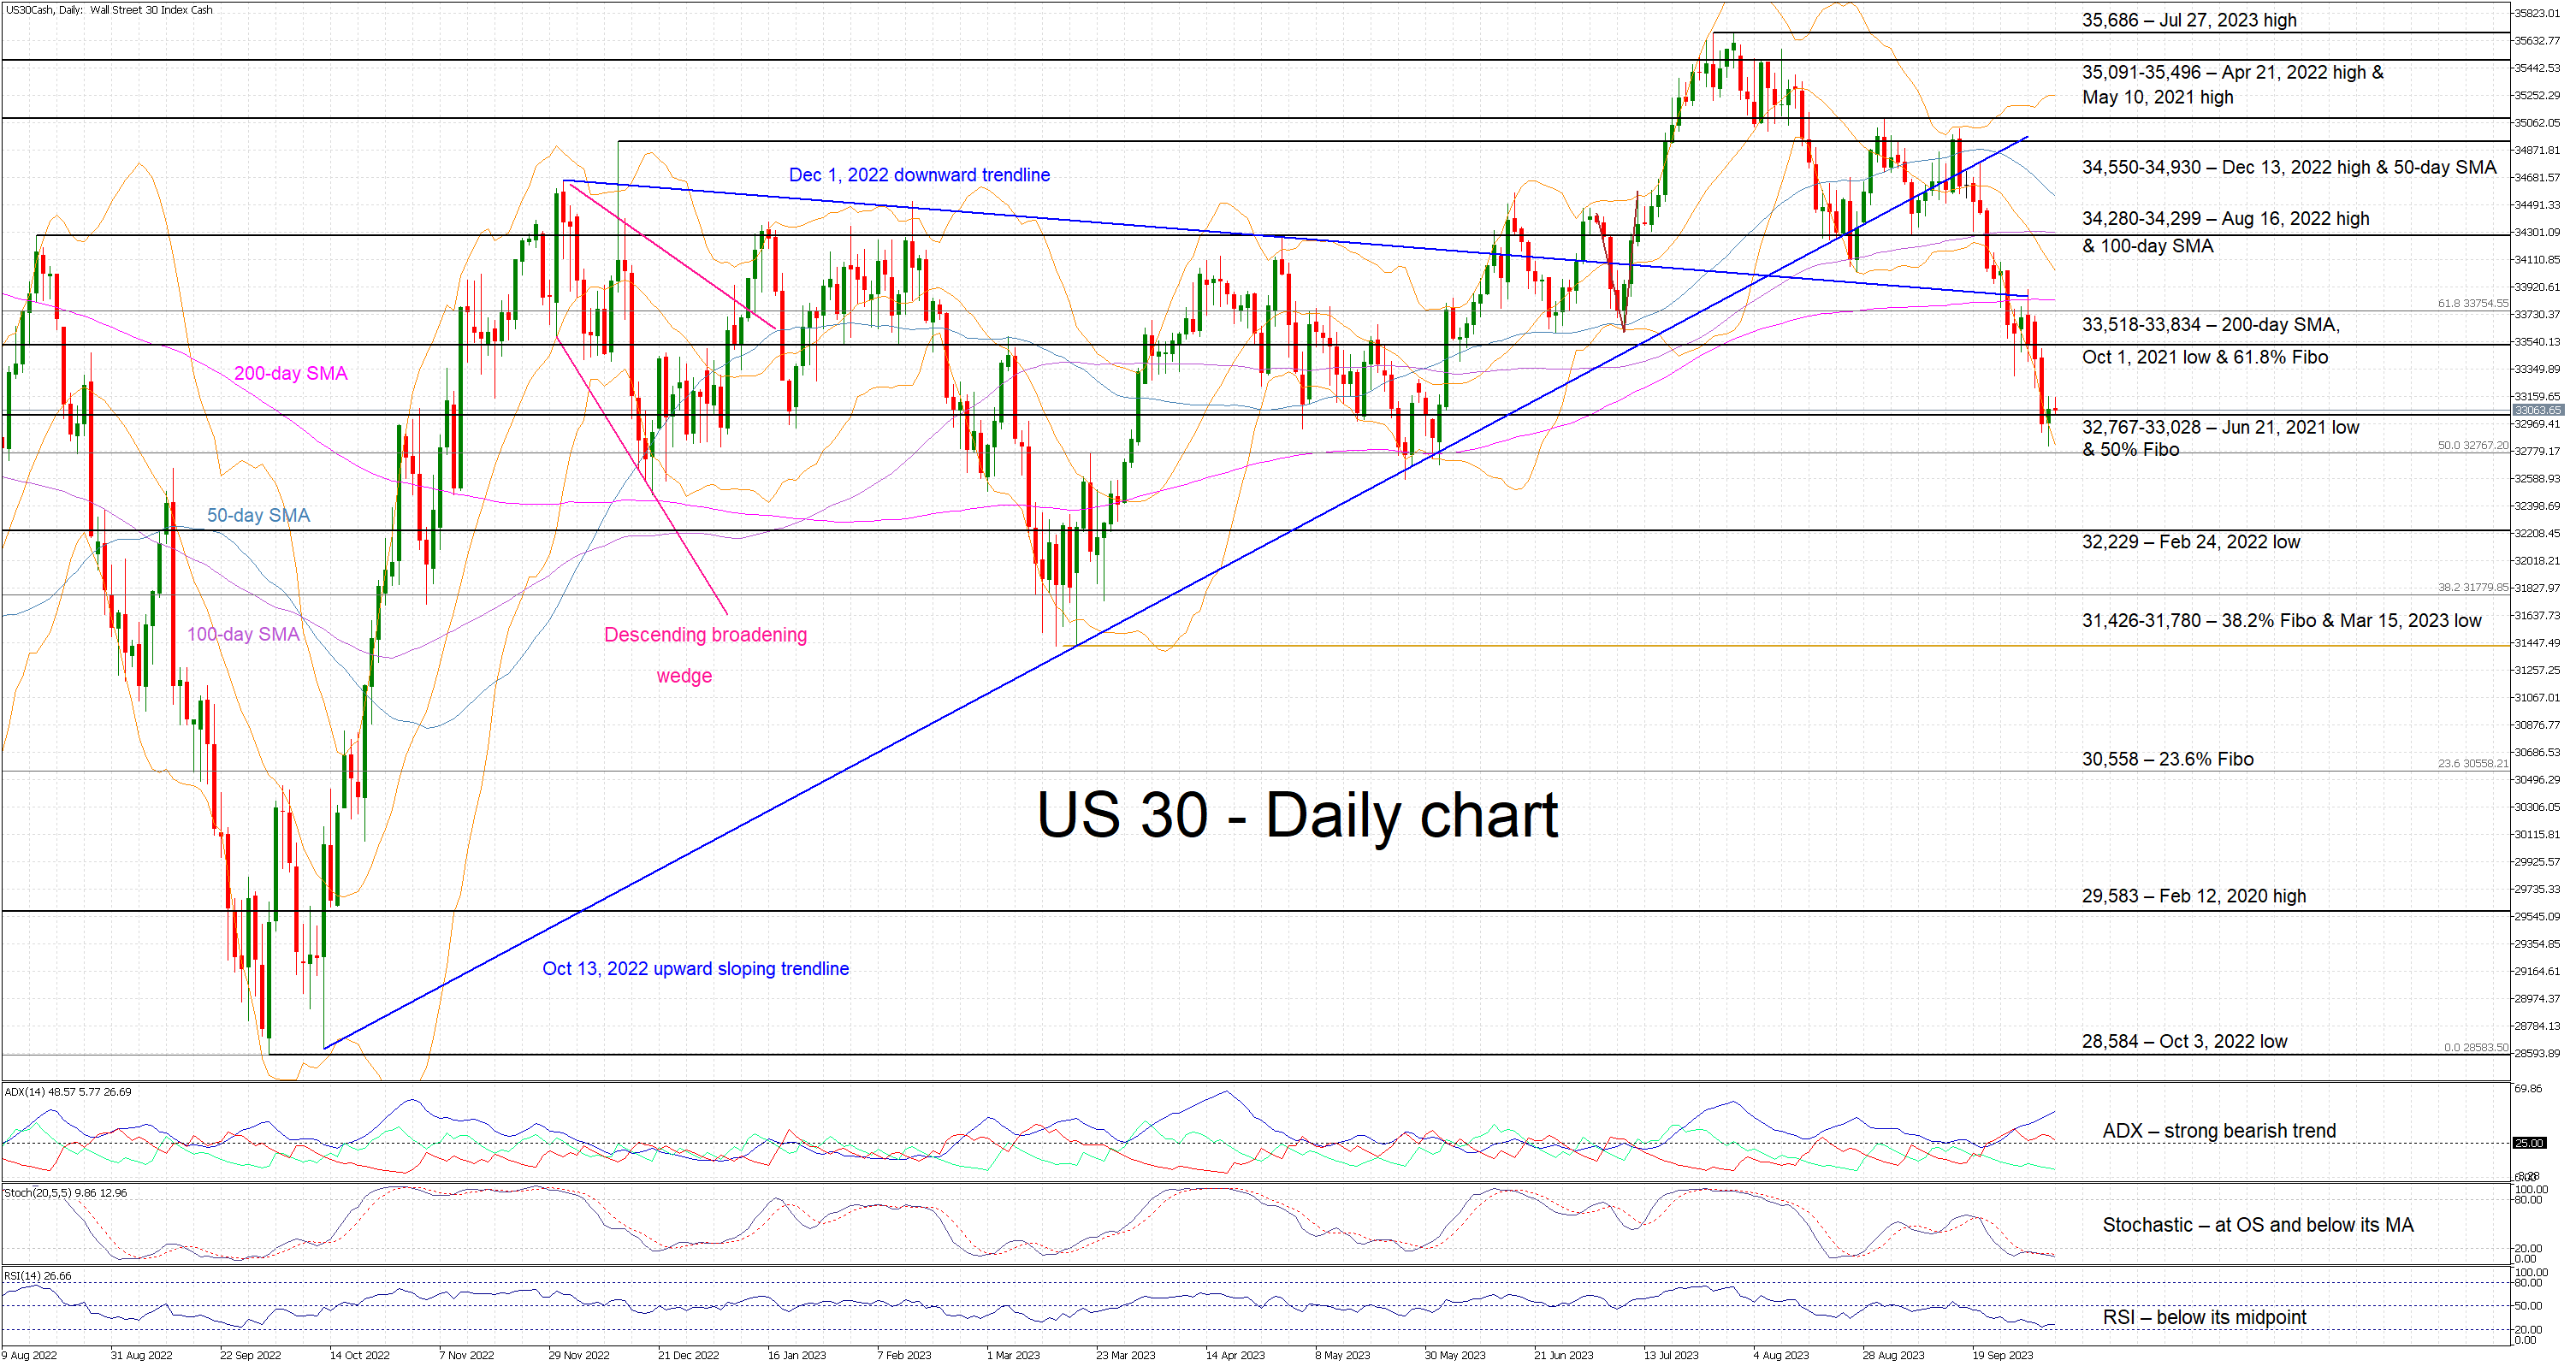
The US 30 cash index is trying to record the second consecutive green candle since it managed to bounce off the 50% Fibonacci retracement of the January 5, 2022 – October 3, 2022 downtrend. The bulls are desperately trying to set up their defense following the aggressive sell-off since the July 27 high, but the bearish series of lower lows and lower highs remains intact.
The momentum indicators appear to support the bears’ intention. The RSI is hovering at its lowest level since the September 2022 bearish move. Similarly, the Average Directional Movement Index (ADX) is still edging higher and signaling the presence of a strong bearish trend. Additionally, the stochastic oscillator continues to trade at the lower end of its oversold territory. While it can stay there for a while, a possible move higher, above both its moving average and oversold region, could be seen as a strong bullish signal.
Should the bears remain confident, they could try to break the busy 32,767-33,028 area that is populated by the June 21, 2021 low and the 50% Fibonacci retracement. If successful, they could set their eyes on the February 24, 2022 low at 32,229, and then potentially plot a course towards the important 31,426-31,780 region.
On the flip side, the bulls are keenly determined to keep the US 30 index above the 32,767-33,028 area. They could then have a go at overcoming the 33,518-33,834 range, set by the 200-day simple moving average (SMA), the October 1, 2021 low and the 61.8% Fibonacci retracement. Even higher, the next resistance area could come at the 34,280-34,302 region.
To sum up, the US 30 cash index bears remain in control of the market and are probably taking a breather after a strong sell-off. The bulls are hoping for a sizeable upleg but lack the support of the momentum indicators.
WTI Oil Analysis: Price Falls 10% in Less Than a Week
In our article “Oil Analysis: Finally, A Bearish Reversal?” on September 21, we drew attention to emerging signs that the initiative was shifting to the bears. This was noticeable in the changes in the dynamics of impulses and corrections, as well as in the analysis of the interaction between trading volumes and prices.
Since then, the bulls were able to update the high of the year on September 28, but the price did not stay there for long, falling sharply in the following days. Three bearish candles formed on the chart, which confirmed the problems of the bulls, and the double top pattern (A-B) also became relevant.
Another principle of technical analysis that emphasized the dominance of supply over demand is that each upward move was approximately 2 times weaker than the downward move. This can be seen in the consistent structure characteristic of a bearish trend:
→ the C→D move is approximately 50% of the B→C bearish momentum;
→ the rebound from the median line of the ascending channel E→F is approximately 50% of the bearish impulse D→E;
→ the bounce from the (now former) support line 87.50 G→H is approximately 50% of the bearish momentum F→G.

Yesterday, the US Energy Information Administration (EIA) reported that supplies of finished motor gasoline, reflecting demand, fell to about 8 million barrels per day, the lowest since the beginning of this year. The news contributed to the formation of a new bearish impulse, which broke through the ascending channel (shown in blue).
It is possible that another I→J rollback will follow. If so, then the formation of top J may be facilitated by resistance from the level of 87.50, the lower border of the ascending channel and the 50% Fibo level.
This article represents the opinion of the Companies operating under the FXOpen brand only. It is not to be construed as an offer, solicitation, or recommendation with respect to products and services provided by the Companies operating under the FXOpen brand, nor is it to be considered financial advice.
Bearish Bond Momentum Can Be on Hold
Markets
A final push lower (in bonds) in yesterday’s Asian session saw the German 10-yr yield touching 3% and the US 30-yr yield kissing 5%. From there on, an oversold market started looking for a floor. A crash in the oil price did the trick from European noon, triggering investors to square some positions after a breath-taking sell-off which started this summer and accelerated after the September FOMC meeting (5%+ policy rate until end 2024). Brent crude prices tumbled from a start above $91/b to $86/b, their lowest level since end August. The move was partly technically related after a drop below the $90.5/b neckline of a double top formation. The Saudi/Russian additional oil production cut confirmation until December, failed to bring counterweight. The oil market is looking for more of an equilibrium as well with $90+ levels being perhaps too optimistic over future demand despite restricted supply. At the end of the session, US yields corrected between 6.3 bps (10-yr) and 9.8 bps (2-yr) lower. The outperformance at the front end of the curve started after the September ADP employment report, which fell short of expectations (+89k vs 150k). The positive run of job gains, dating back to Feb2021, is prolonged but momentum fades bringing the labour market more in balance. The September services ISM moderated as expected from 54.5 to 53.6. Details remained solid, with markets singling out the only weak point which was a more pronounced setback in new orders (51.8 from 57.5). The market implied probability of a final Fed rate hike before the end of the year fell back from 50% to 40%. German yields lost 3 bps to 8.4 bps but contrary to the US it was the very long end which outperformed. Yesterday’s correction on bond markets impacted equity and FX markets as well. While main European stock indices still faced a mixed to slightly weaker close, key US gauges rebounded up to 1.35% for Nasdaq. The dollar correction is modest so far (trade-weighted from 107.06 open to 106.80 close) but continues this morning. EUR/USD follows a similar trajectory from a low near 1.0450 to 1.0520 currently. After yesterday’s move, we believe that bearish bond momentum can be on hold with for some time with consolidation kicking in (rebound on stock markets and further correcting USD). Especially so, if tomorrow’s US payrolls report would show signs of a less robust labour market as well. The consensus bar (+170k) seems on the high end.
News and views
The National Bank of Poland reduced is policy rate by 25 bps to 5.75% yesterday after starting its easing cycle last month with an astonishing 75 bps cut. A further slowdown in CPI inflation in September 8.2%Y/Y from 10.1% justified the easing. While the decline is for an important part due to lower energy and food prices, the NBP also sees a further moderation in core inflation. Together with low economic activity/demand, the NBP expects this will support a further decline in consumer prices in the coming quarters, adding to the restrictiveness of monetary policy. The NBP reiterated that that the decrease in inflation would be faster if supported by an appreciation of the zloty, which it deems consistent with the fundamentals of the Polish economy. It is keeping the option open to intervene in the foreign exchange market. The 2-y zloty swap rate yesterday jumped more than 20 bps (close 4.72%). The zloty after touching an intraday low against the euro just below EUR/PLN 4.65, rebounded to close at EUR/PLN 4.60.
South Korean inflation accelerated substantially more than expected for a second month in a row (0.6% M/M and 3.7% Y/Y). Prices already rose 1.0% M/M and 3.4% Y/Y in August after touching a cycle low of 2.3%Y/Y in July. In a monthly perspective, price gains were mainly driven by higher transport costs (+1.3% M/M), food prices (1.6% M/M) and housing/utility costs (1.3%). Core inflation (excluding volatile food and energy prices) remained unchanged at 3.3%. Both the Korean finance minister and the Bank of Korea indicated that they expect inflation to return to the 3% area at the end of this year. The Bank of Korea after a January rate hike to 3.5%, kept its policy rate unchanged this year. The next meeting is scheduled for Oct 19. Today’s inflation data will force the BOK to maintain a hawkish stance to keep rates at a high level for longer. Yesterday, South Korea August production data also showed a surprisingly strong rebound of 5.5% M/M. The Korean won yesterday touched the weakest level of this year at USD/KRW 1363 on broad-based USD strength. This morning the won ‘rebounds’ modestly to trade in the USD/KRW 1350 area.
USD/JPY Technical: Retesting 20-day Moving Average Support with Bearish Momentum
- Key technical elements have turned bearish for USD/JPY ex-post suspected BoJ’s invention.
- USD/JPY bulls’ first defence line at the 20-day moving average acting as a 148.25 support looks vulnerable.
- The next immediate support to watch will be at 146.10/146.00
The USD/JPY has shaped the expected push-up and hit the key resistance zone of 150.00/150.30 as it printed an intraday high of 150.16 on Tuesday, 3 October during the first half of the US session upon the release of the better-than-expected US JOLTs jobs numbers for August.
Thereafter within just 5 minutes, the USD/JPY tumbled by close to three big figures to print an intraday low of 147.34 on suspected Bank of Japan (BoJ) intervention under the instructions of Japan’s Ministry of Finance.
The odds have increased for a broad-based USD strength pull-back scenario
Yesterday’s movement in the broad-based FX market has started to show signs of a potential multi-week US dollar strength pull-back scenario as the US Dollar Index’s daily RSI indicator, a gauge on momentum has exhibited a bearish divergence condition at its overbought zone (its first occurrence since its medium-term uptrend kickstarted on 14 July 2023).
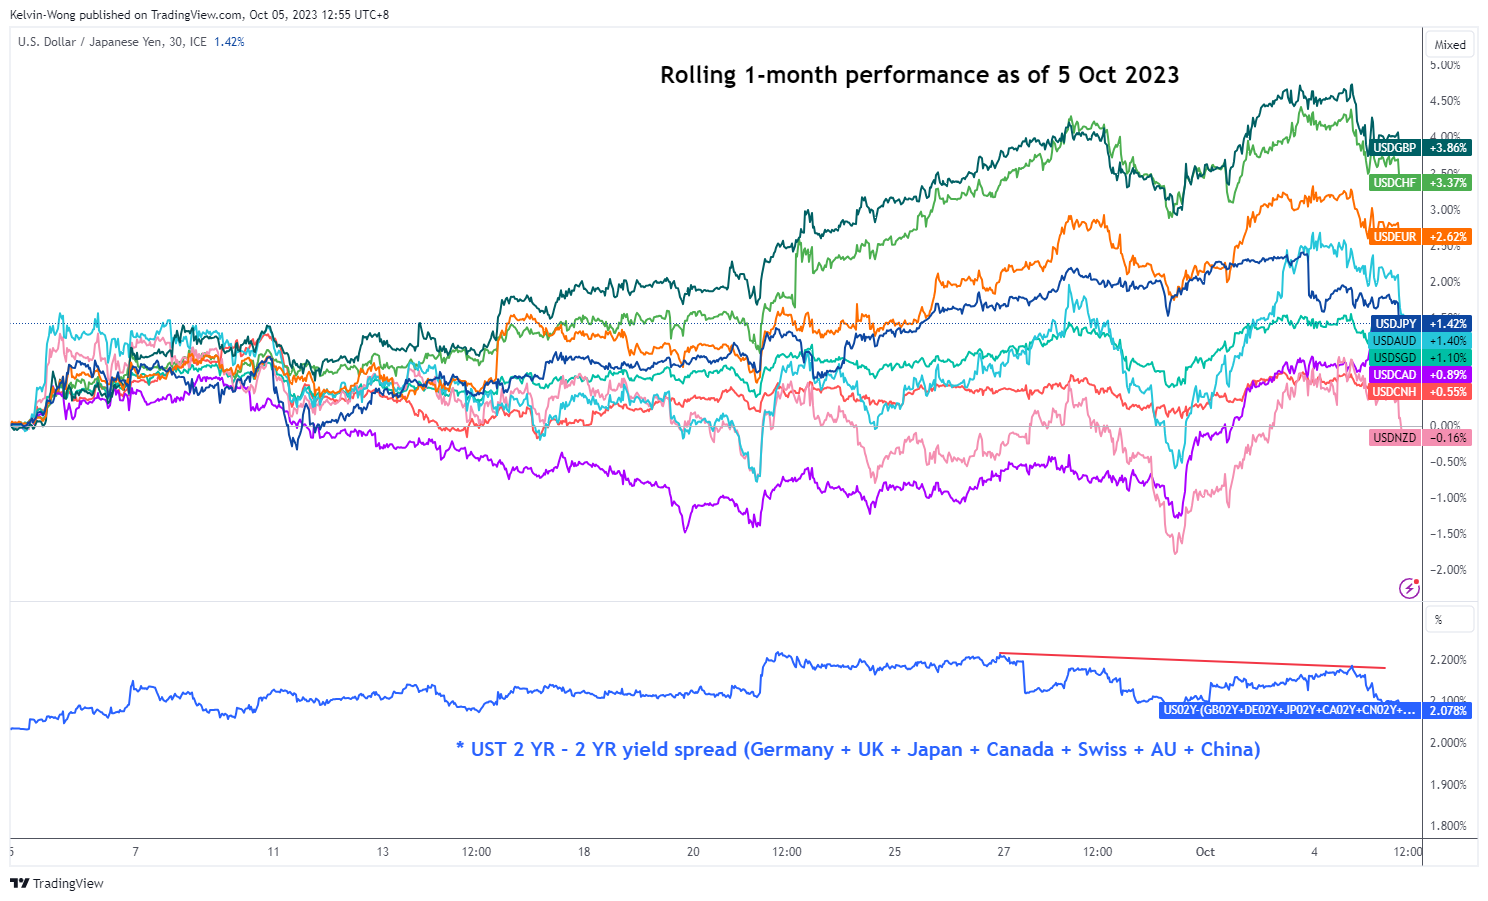
Fig 1: Rolling one-month US dollar performance with 2-year US Treasury yield premium spread as of 5 Oct 2023 (Source: TradingView, click to enlarge chart)
Also, the rolling one-month performances as of 5 October 2023 of the prior weakest currencies against the dollar (GBP, EUR, CHF) have started to display mean reversion movements from 27 September 2023 to cover the prior gaps with the other “lesser weaker” currencies (AUD, NZD, CAD, CNH, SGD) as measured against the US dollar.
In addition, the 2-year US Treasury yield premium over an equal-weighted average of the 2-year sovereign yields of Germany, the UK, Japan, Canada, Switzerland, Australia, and China has started to shrink over the same period.
These latest observations support a potential broad-based multi-week US dollar strength pull-back scenario which in turn reinforces another round of further potential weakness in the USD/JPY where the earlier unconfirmed BoJ’s intervention to halt a multi-month JPY down move is likely to have created a fear element in the mindset of short-term speculators that have a persistent bullish view on the USD/JPY.
Impending medium-term momentum bearish breakdown on USD/JPY
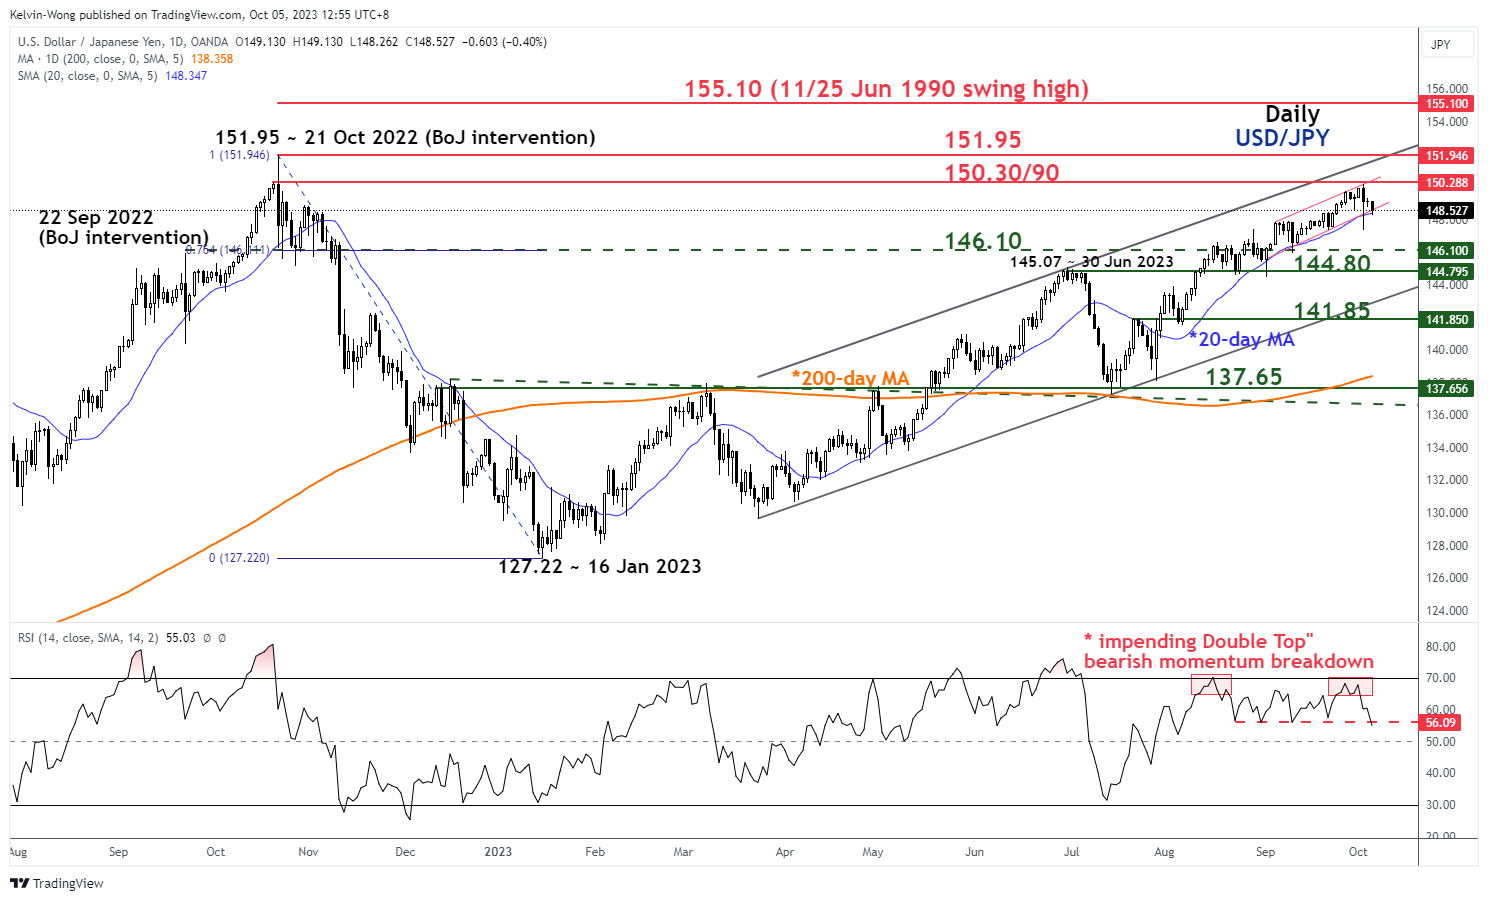
Fig 2: USD/JPY medium-term trend as of 5 Oct 2023 (Source: TradingView, click to enlarge chart)
The daily RSI of the USD/JPY has shaped an impending “Double Top” bearish reversal configuration around its overbought zone and right now, it is attempting to stage a bearish breakdown below a parallel support at the 56 level.
This key technical element suggests that the medium-term downside momentum of the USD/JPY has started to build up which may jeopardize the ongoing short to medium-term uptrend phases of the USD/JPY.
The 20-day moving average support on the USD/JPY looks vulnerable
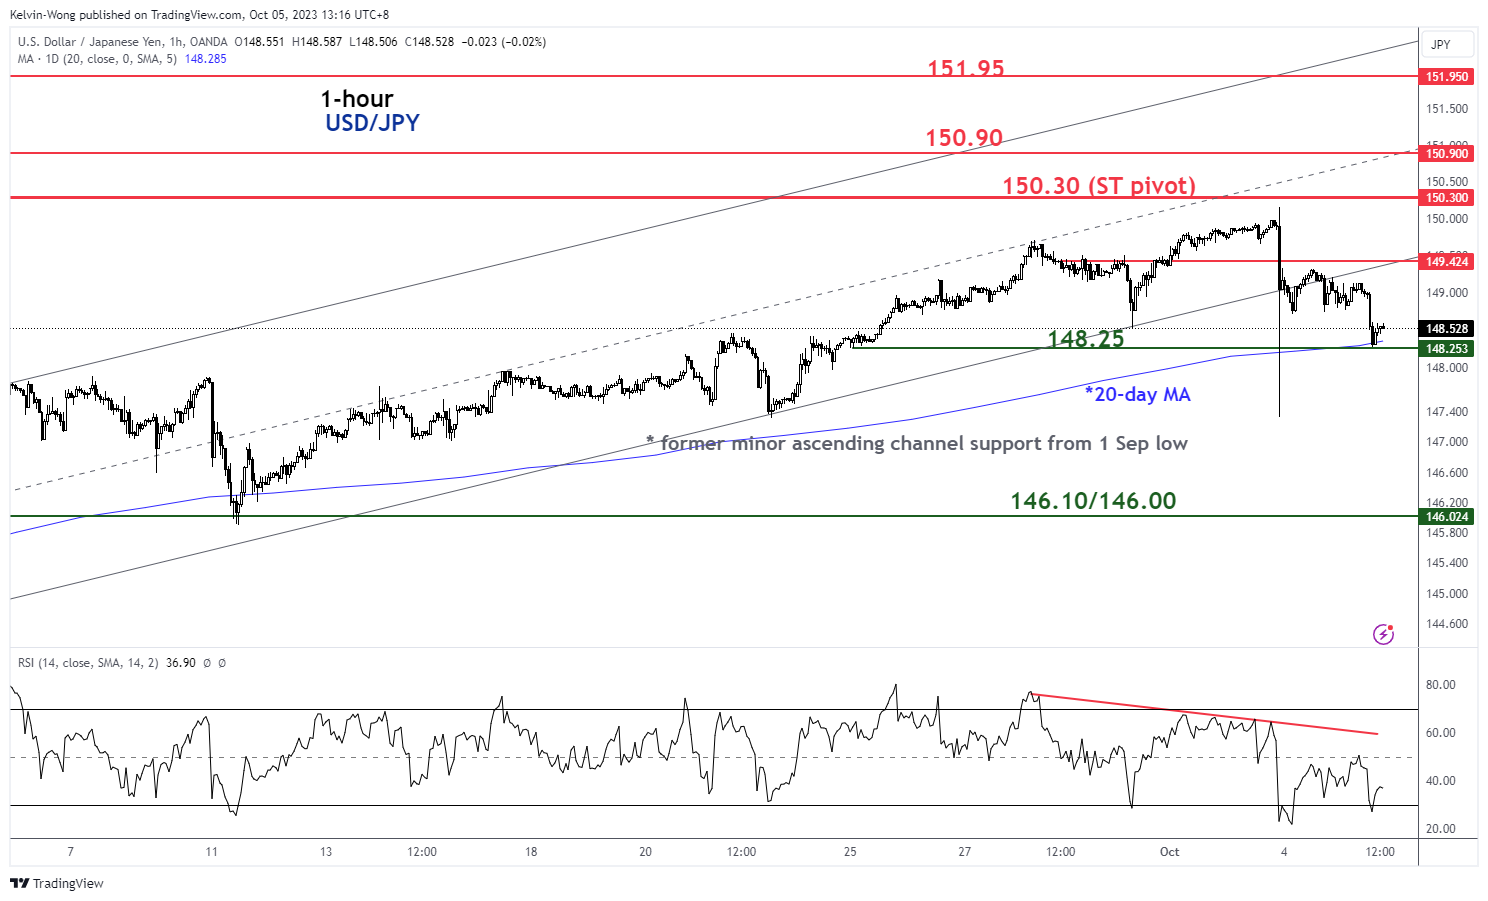
Fig 3: USD/JPY minor short-term trend as of 5 Oct 2023 (Source: TradingView, click to enlarge chart)
The bulls of the USD/JPY have managed to hold the defence line at the upward-sloping 20-day moving during Tuesday’s suspected BoJ’s intervention. The price actions of the USD/JPY have been trading at and above the 20-day moving average since 28 July 2023.
The 20-day moving average is now acting as support at around 148.25 where price actions retested it again in today’s Asian morning session and staged a minor bounce of 29 pips at this time of the writing.
However, other short-term technical elements have turned bearish where the price actions of the USD/JPY have staged a bearish breakdown from the lower boundary of its minor ascending channel from 1 September low now acting as a near-term pull-back resistance at 149.40.
Watch the 150.30 pivotal resistance and a breakdown below 148.25 may trigger the start of a potential short-term downtrend phase to expose the next support at 146.10/146.00 in the first step.
However, a clearance above 150.30 invalidates the bearish tone for a squeeze up towards the next major resistances of 150.90 and 151.95 (21 Oct 2022 swing high).
Saudi’s Commitment is Not Written into a Law
Markets are on an emotional rollercoaster ride this week. The slightest data is capable of moving oceans. Yesterday, the significantly softer-than-expected ADP report, and the announcement that 75’000 healthcare workers at Kaiser went on strike sparked a positive reaction from the market in a typical ‘bad news is good news’ day. The US economy added only 89K new private jobs in September, much less than 153K penciled in by analysts. It was also the slowest job additions since January 2021. The rest of the data was mixed. US factory orders were better than expected in August, but the services PMI came close to slipping into the contraction zone, and the ISM’s non-manufacturing component also hinted at slowing activity. Mortgage activity in the US fell to the lowest levels since 1995, as the 30-year mortgage rates spiked higher toward 8%. Housing and services are among the biggest contributors to high inflation besides energy prices, therefore, seeing these sectors cool down has a meaningful impact on inflation expectations, hence on Federal Reserve (Fed) expectations. As such, yesterday’s soft-looking data tempered the Fed hawks, after the stronger-than-expected JOLTs data triggered panic the day before. The US 2-year yield took a dive toward the 5% mark, the 10-year yield bounced lower after flirting with the 4.90% level, while the 30-year hit 5% for the very first time since 2007 before bouncing lower on relieving news of soft job additions. Hallelujah.
The US dollar index retreated across the board, and equities rebounded. The S&P500 jumped from the lowest levels since the beginning of June. The score is now one to one. One good news for the US jobs market, and one bad news. Everyone is now holding his or her breath into Friday’s jobs data, which will determine whether we will end this week with a sweet or a sour taste in our mouth. Sweet would be loosening jobs data, sour would be a still-strong jobs data which would fuel the hawkish Fed expectations and further boost US yields while the US yields are at a critical moment.
For the first time since 2002, the US 10-year yield comes at a spitting distance from the S&P500 earnings. The index is just about 60 points above its critical 200-DMA. Looking at the seasonality chart, the S&P500 could dip at about now. In this context, there is a chance that soft jobs data from the US marks a dip in the S&P500 selloff. But one thing is sure: the yields and the US dollar must come down to keep the S&P500 on a rising path. Profits at the S&P500 companies are inversely correlated with the US dollar as their international profits account for about a third of the total. If the yields and the US dollar continue to rise, the S&P500 will face severe headwinds into the year end.
Oil fell nearly 6%
Rising suspicions that the global economy is headed straight into a wall didn’t spare oil bulls yesterday. The barrel of American crude dived almost 6%, slipped below the 50-DMA ($85pb), and below the positive trend base building since the end of June. The 6.5-mio-barrel build in gasoline stockpiles last week helped bring the bears back to the market even though the data also showed a more than 2-mio-barrel draw in crude inventories over the same week.
Yesterday’s move shows that what matters the most for intraday moves is the rhetoric. This summer, the market focus was on the tightening global oil supply and how the US will ‘soft land’ despite the aggressive Fed tightening. Now we start talking about slowing economies and recession worries.
OPEC decided to maintain its oil production strategy unchanged at yesterday’s decision. Saudi and Russia repeated that they will keep their production restricted to maintain the positive pressure on oil. But if global demand cools down and volumes fall, both Saudi and Russia will be tempted to increase profits by selling more oil at a cheaper price. Saudi Arabia shouldering all the production cuts for OPEC is not written into a law, it could become uncertain if market conditions turn sour.
Bond Market Sell-Off Takes a Break
Market movers today
A string of central bank speakers on today's calendar. The interpretation of recent tightening of financial conditions will be closely watched.
The weekly jobless claims data in the US have been among those indicators pointing to a still-strong labour market, so this data will be interesting to follow today.
From Japan, we get August cash earnings at 1:30 CET Friday. It has disappointed over the summer, and a pick-up here is key for the BoJ to start normalising its policies.
The 60 second overview
US Macro: US data came in weaker than expected yesterday, providing some support to market sentiment. ADP private employment rose by only 89,000 new jobs in September, which was well below expectations of 150,000. The ADP figures have often deviated quite substantially from the official payrolls data, but markets took notice of the weakness as a sign of some renewed softening in the US labour market. The headline ISM Services index fell in line with expectations from 54.5 to 53.6 in September, but what stood out was a significant decline in the forward-looking new orders component from 57.5 to 51.8. In our view, this points towards some weakening of consumer demand ahead.
Oil: The oil price rally has clearly lost steam, and yesterday the Brent price plunged 6% to 86.4 USD/barrel yesterday, despite Russia and Saudi Arabia confirming their commitment to maintain the OPEC+ production curbs of 1 million barrels/day until the end of the year. Tighter financial conditions might be beginning to bite in the commodity markets, and furthermore, the weekly EIA report out yesterday showed further weakness in US gasoline demand, now being at the lowest level for the season in 25 years.
Equities: Equities finished a notch higher yesterday. The trigger for the turnaround was not hard to find: A pullback in yields. S&P 500 immediately rebounded 0.8% while Stoxx 600 only recovered to -0.1%. Large caps outperformed small caps, growth beat value and cyclicals rebounded. Huge sector rotation dispersion again, with best performing sector consumer discretionary up 2% and underperforming energy down -3%, as oil prices plunged. The yields fear is easing in Asia as well this morning, with BB APAC up 2%. US futures are unchanged.
FI: The bond market sell-off stalled yesterday as weaker US macro data supported the sentiment. 10Y Bund yields declined by 5bp to 2.91% throughout the day, while the 10Y UST yield ended the day 7bp lower at 4.73%. The 5y5y EUR inflation swap rate was close to unchanged implying that a decline in real yields was behind yesterday's move.
FX: Yesterday's session saw the latest USD rally take a breather amid rates rallying and equities rebounding. This contributed to lifting EUR/USD above 1.05. Notably, despite the slight relief in risk-sensitive assets neither NOK nor SEK saw any strength with both EUR/NOK and EUR/SEK continuing to move higher. USD/JPY still trades around the 149 level after Tuesday's knee-jerk reaction lower while EUR/GBP trades around the 0.865-mark.
Credit: Credit markets were in a wait-and-see mode yesterday as markets digested important macroeconomic numbers out of the US. The primary credit market was also muted with low new issuing activity. Main was 1bp wider while X-over was 4bp wider.
USD/JPY Daily Outlook
Daily Pivots: (S1) 148.81; (P) 149.06; (R1) 149.39; More...
Intraday bias in USD/JPY remains neutral for the moment and more sideway trading could be seen. On the downside, below 147.28 will turn bias to the downside for deeper pull back. But there is no confirmation of bearish trend reversal before firm break of 144.43 support. Another rally remains mildly in favor through 150.15 to retest 151.93 high.
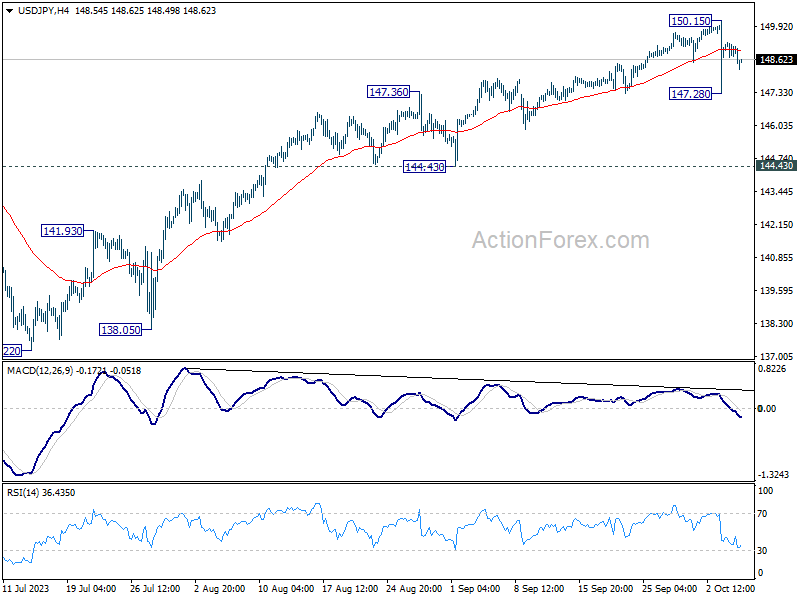
In the bigger picture, while rise from 127.20 is strong, it could still be seen as the second leg of the corrective pattern from 151.93 (2022 high). Rejection by 151.93, followed by sustained break of 145.06 resistance turned support will be the first sign that the third leg of the pattern has started. However, sustained break of 151.93 will confirm resumption of long term up trend.
EUR/USD Daily Outlook
Daily Pivots: (S1) 1.0460; (P) 1.0496; (R1) 1.0540; More...
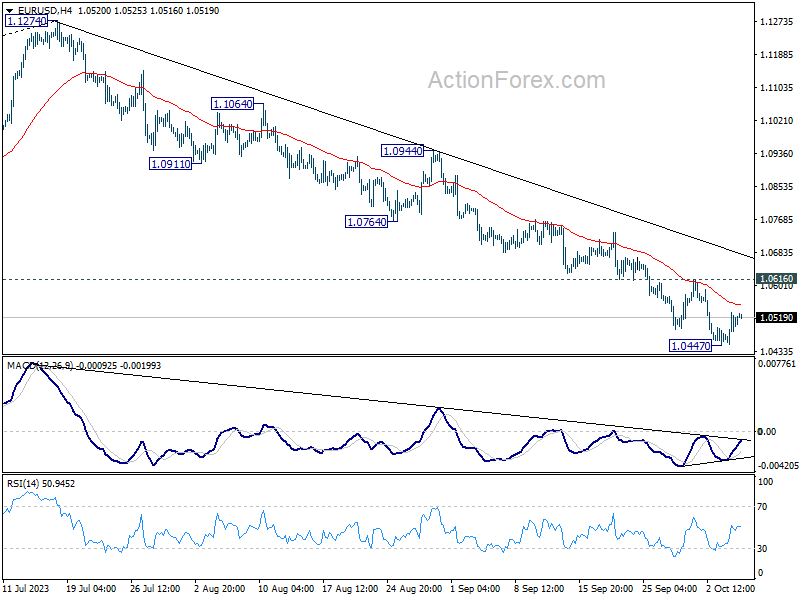
Intraday bias in EUR/USD Remains neutral for consolidation above 1.0447. Outlook will remain bearish as long as 1.0616 resistance holds. Break of 1.0477 will resume the fall from 1.1274 to 1.0199 fibonacci level next. Nevertheless, firm break of 1.06161 will confirm short term bottoming, and turn bias back to the upside for stronger rebound.
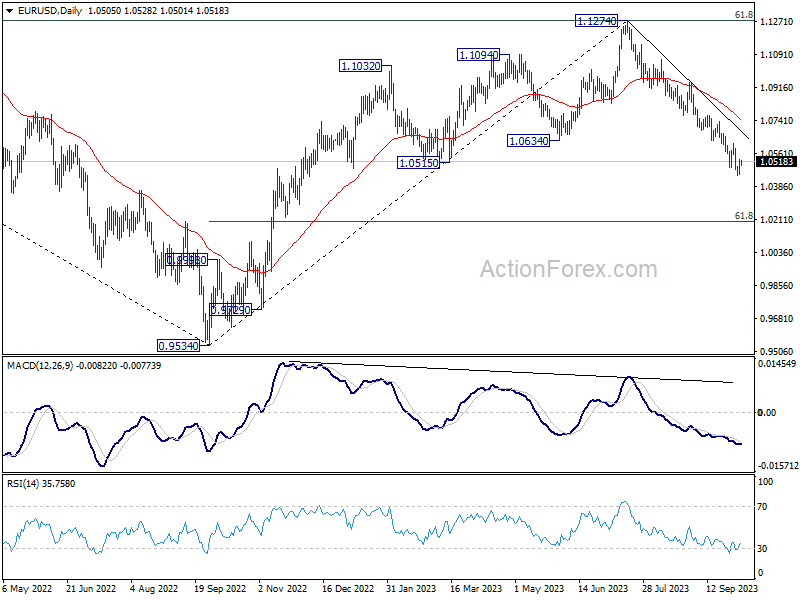
In the bigger picture, fall from 1.1274 medium term top could still be a correction to rise from 0.9534 (2022 low). But chance of a complete trend reversal is rising. In either case, current fall should target 61.8% retracement of 0.9534 to 1.1274 at 1.0199 next. For now, risk will stay on the downside as long as 55 D EMA (now at 1.0759) holds, in case of rebound.
GBP/USD Daily Outlook
Daily Pivots: (S1) 1.2056; (P) 1.2116; (R1) 1.2196; More...
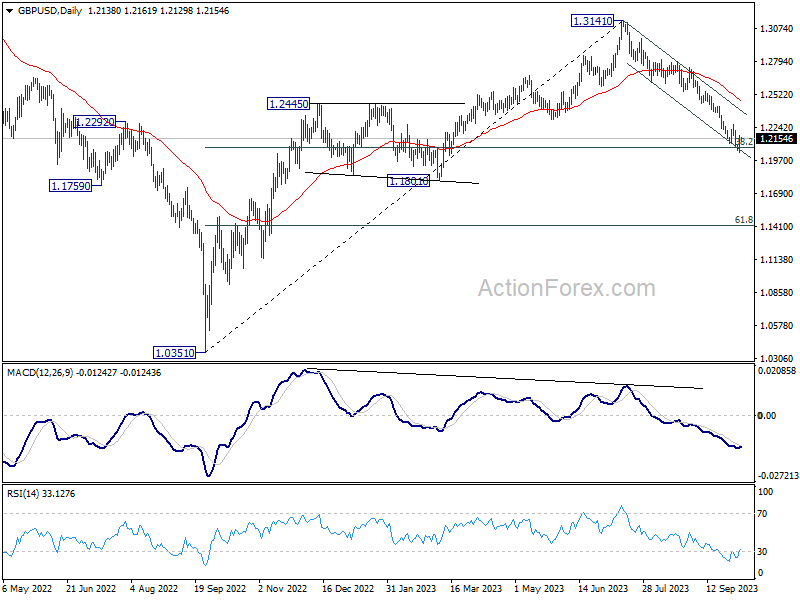
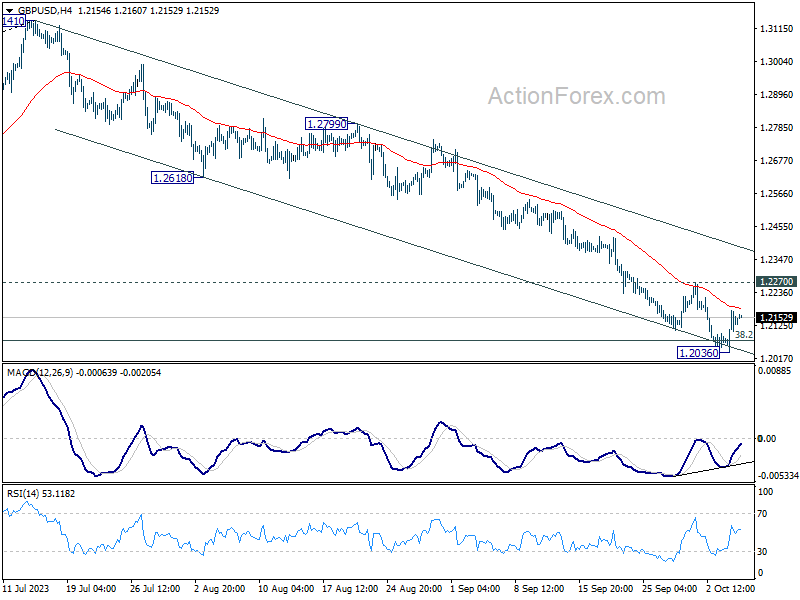
Intraday bias in GBP/USD remains neutral for consolidation above 1.2036. Outlook will stay bearish as long as 1.2270 resistance holds. Break of 1.2026 will resume the fall from 1.3141. Sustained trading below 1.2075 fibonacci level would carry larger bearish implication, and target 1.1801 support next. On the upside, firm break of 1.2270 resistance will indicate short term bottoming, and turn bias back to the upside.
In the bigger picture, fall from 1.3141 medium term top could still be a correction to up trend from 1.0351 (2022 low) only. But risk of complete trend reversal is rising. Sustained break of 38.2% retracement of 1.0351 to 1.3141 at 1.2075 will pave the way to 61.8% retracement at 1.1417. For now, risk will stay on the downside as long as 55 D EMA (now at 1.2486) holds, in case of rebound.