

Sample Category Title
Yen Moves Up on Wage Hike Push by PM, Halts Well Short of Intervention Peak
Japanese Yen is registering broad gains in today's Asian trading session, buttressed by the 10-year JGB yield which solidly remains above the 0.8% threshold. However, the yen's advancement is notably limited, still lingering below this week's high, which many attribute to a suspected, yet unverified, intervention. Japanese
The spotlight falls on Japanese Prime Minister Fumio Kishida, who, in his an address to Rengo, Japan's premier labor organization, underscored the imperative of instigating "a wave of sustainable wage hikes."
This stance resonates with BoJ's consistent viewpoint that persistent wage growth is the linchpin to attaining inflation target. Meeting this condition is a foundational step for BoJ to move away from its ultra-accommodative monetary stance. For many analysts, this shift by BoJ is critical for reversing the current bearish trend in Yen.
In tandem with the Yen, Australian New Zealand Dollar are also making positive strides today. Presently, global market sentiments hint at a semblance of stabilization, reflected in the pullback of global benchmark yields and recovery in stock markets. However, this tentative shift in market mood awaits validation, especially with the looming US non-farm payroll data scheduled for release tomorrow. Meanwhile, Dollar, Euro, and Sterling seem to be trailing, whereas Swiss Franc and Canadian Dollar are displaying mixed performances.
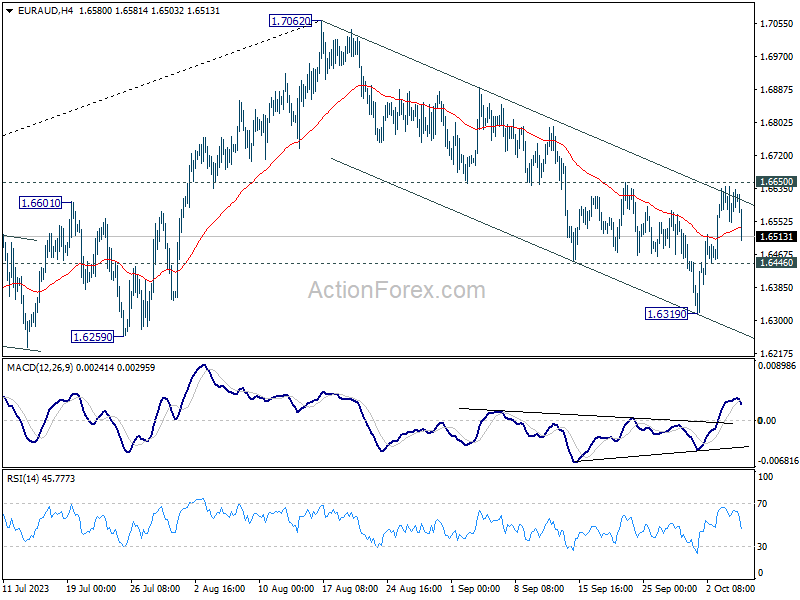
Technically, EUR/AUD dips notably after failing the break through 1.6650 resistance this week. The development keeps near term outlook bearish. Below 1.6446 minor support will likely resume whole decline from 1.7062 through 1.6319 support.
Should this EUR/AUD extended decline materialize, and be synchronized with decisive breaks below 0.8629 in EUR/GBP and 0.9617 in EUR/CHF, it could be indicative of a deep-rooted bearish momentum for the Euro, especially when analyzed in cross currency contexts.
In Asia, at the time of writing, Nikkei is up 1.66%. Hong Kong HSI is up 0.76%. Singapore Strait Times is up 0.75%. Japan 10-year JGB yield is down -0.003 at 0.805. Overnight, DOW rose 0.39%. S&P 500 rose 0.81%. NASDAQ rose 1.35%. 10-year yield dropped -0.067 to 4.735.
10% decline in oil prices raises questions on demand destruction
Oil prices took a significant dip overnight, with WTI now trading USD 10 beneath last week's peak of 95.50. This decline is notably perplexing given the absence of a clear triggering event. OPEC+'s resolution to uphold output cuts is conventionally a precursor for a bullish response in the market. However, the rapid and profound dip has spurred conversations around the onset of demand destruction, provoked by the Q3 oil price spike.
In this week's meeting, the OPEC+ ministerial panel opted for status quo, maintaining its existing oil output policy. Saudi Arabia pledged to persist with its voluntary cut of 1 million barrels per day through the end of 2023, while Russia committed to retaining its voluntary export reduction of 300k bpd until December's end.
A note from JPMorgan's commodity analysts titled "Demand destruction has begun (again)" highlighted that the repercussions of surging oil prices are re-emerging in the form of demand restraints in regions including US, Europe, and certain Emerging Markets.
The crux of global oil demand growth, anchored by China and India, is also showing signs of waning. China's decision to utilize domestic crude inventories following the surge in oil prices is indicative of this trend.
In the US, gasoline consumption has plummeted to a 22-year low. The considerable 30% hike in fuel prices in Q3 has reportedly dampened demand, leading to an atypical decline of 223k barrels per day.
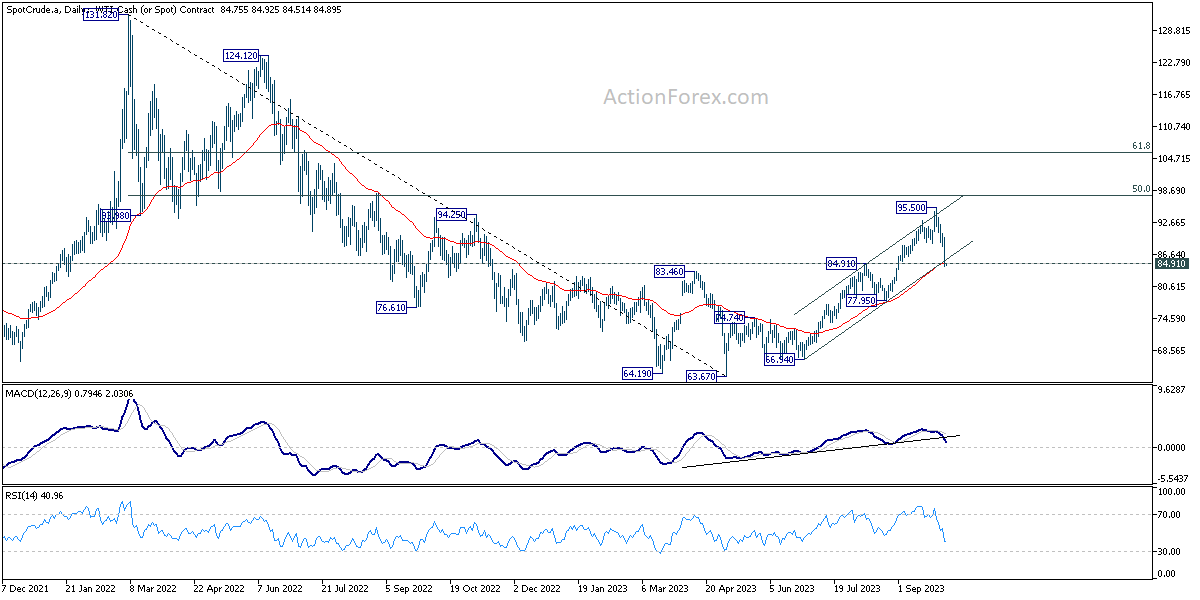
From a technical standpoint, WTI crude oil finds itself at a pivotal support juncture, which comprises the 84.91 resistance-turned-support and the 55 D EMA, currently pegged at 84.90. While a solid rebound from this position remains plausible, it's expected to be restrained well below 95.50 high.
On the other hand, sustained break of 84.91 would confirm rejection by 50% retracement of 131.82 to 63.67 at 97.74. WTI could then be reversing whole rally from May's low at 63.67, and risk falling further to 77.95 support.
Looking ahead
Germany trade balance, France industrial production and UK PMI construction will be released in European session. Later in the day, US will release jobless claims and trade balance. Canada will release trade balance and Ivey PMI.
GBP/JPY Daily Outlook
Daily Pivots: (S1) 179.94; (P) 180.60; (R1) 181.63; More...
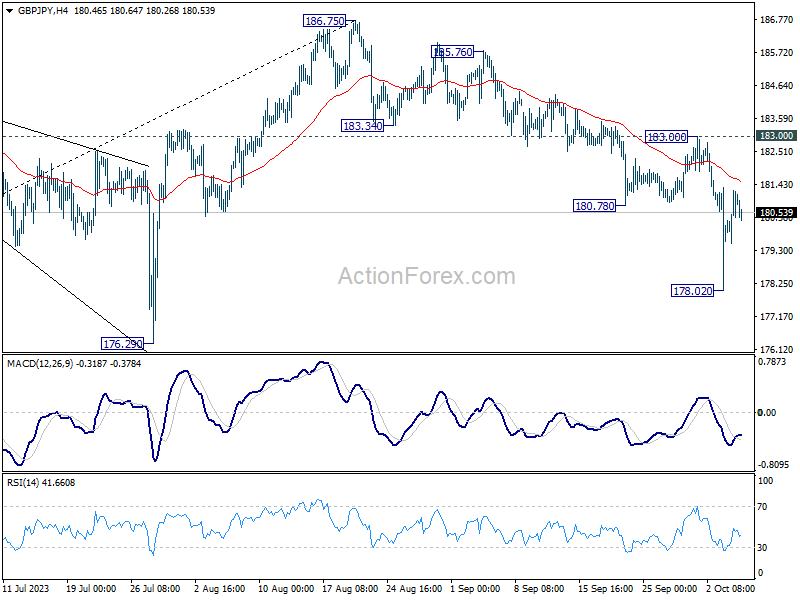
Intraday bias in GBP/JPY is turned neutral with the strong recovery from 178.02, and with 4H MACD crossed above signal line. Near term outlook stays bearish as long as 183.00 resistance holds. Break of 178.02 will resume the fall from 186.75 to 176.29 support. However, firm break of 183.00 will argue that the pull back has completed, and turn bias back to the upside.
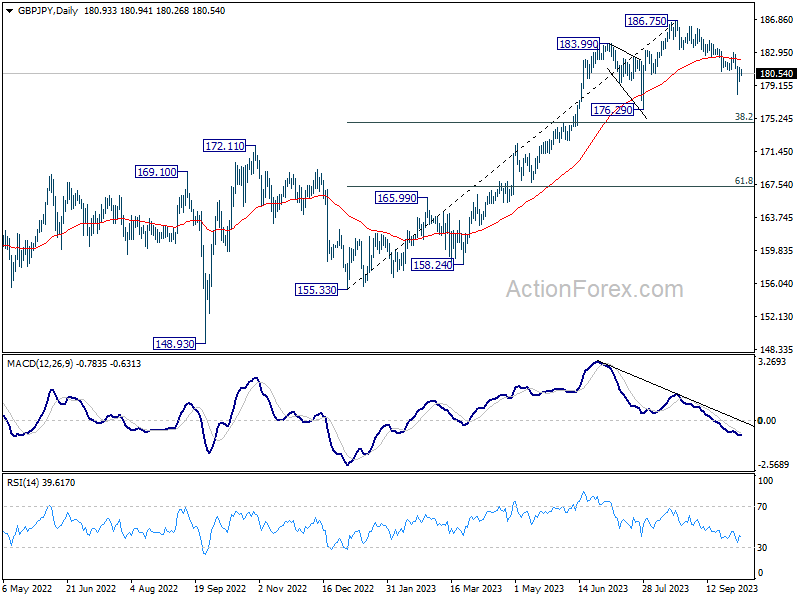
In the bigger picture, fall from 186.75 is currently seen as a corrective move only. As long as 176.29 support holds, larger up trend from 123.94 (202 low) should still be in progress. Break of 186.75 will target 195.86 (2015 high). Nevertheless, firm break of 176.29 will confirm medium term topping, and bring lengthier and deeper consolidations.
Economic Indicators Update
| GMT | Ccy | Events | Actual | Forecast | Previous | Revised |
|---|---|---|---|---|---|---|
| 00:30 | AUD | Trade Balance (AUD) Aug | 9.64B | 8.61B | 8.04B | 7.32B |
| 06:00 | EUR | Germany Trade Balance (EUR) Aug | 14.3B | 15.9B | ||
| 06:45 | EUR | France Industrial Output M/M Aug | -0.40% | 0.80% | ||
| 08:30 | GBP | Construction PMI Sep | 49.9 | 50.8 | ||
| 11:30 | USD | Challenger Job Cuts Y/Y Sep | 266.90% | |||
| 12:30 | USD | Initial Jobless Claims (Sep 29) | 211K | 204K | ||
| 12:30 | USD | Trade Balance (USD) Aug | -65.1B | -65.0B | ||
| 12:30 | CAD | Trade Balance (CAD) Aug | -1.4B | -1.0B | ||
| 14:00 | CAD | Ivey PMI Sep | 50.8 | 53.5 | ||
| 14:30 | USD | Natural Gas Storage | 97B | 90B |
EURUSD Short Term Rally Still Expected to Fail
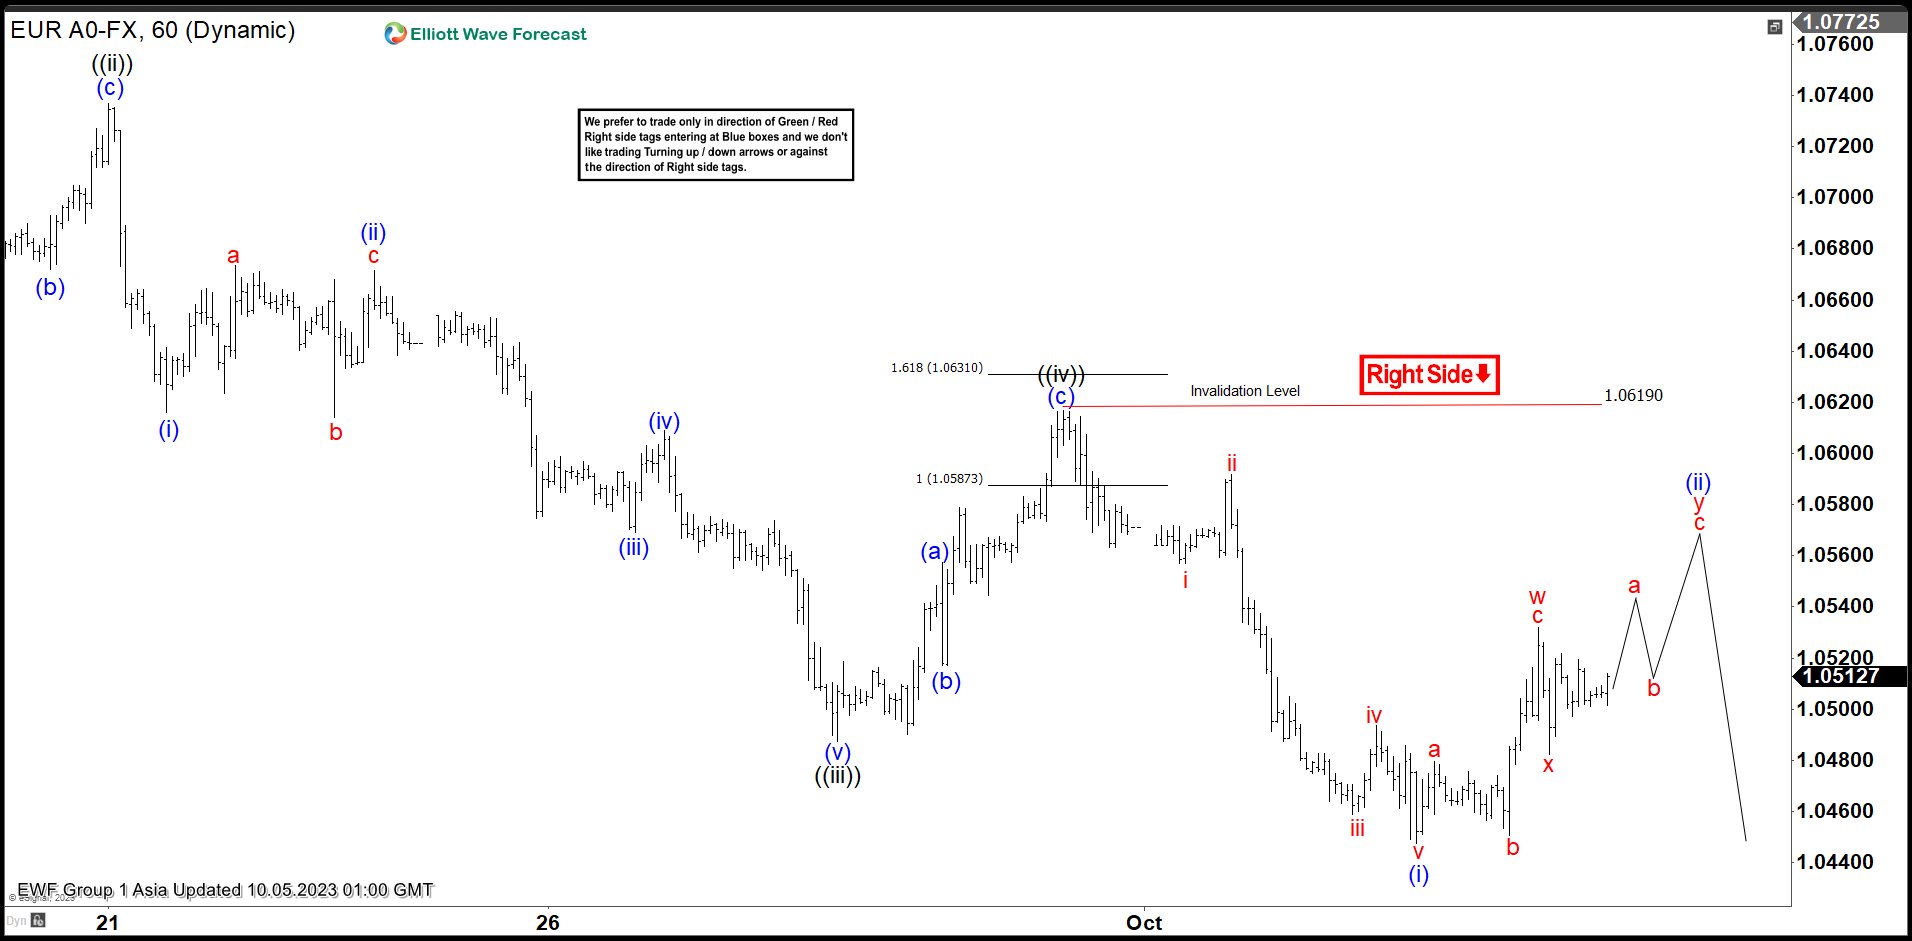
Short Term Elliott Wave in EURUSD suggests cycle from 8.30.2023 high is in progress as a 5 waves impulse. Down from 8.30.2023 high, wave ((i)) ended at 1.063 and rally in wave ((ii)) ended at 1.0737 as the 1 hour chart below shows. Pair then extended lower in wave ((iii)) with internal subdivision as another 5 waves in lesser degree. Down from wave ((ii)), wave (i) ended at 1.0616 and wave (ii) ended at 1.0671. The pair extended lower in wave (iii) towards 1.0569, wave (iv) ended at 1.0609, and wave (v) lower ended at 1.048. This completed wave ((iii)) in higher degree.
Rally in wave ((iv)) ended at 1.0619 with internal subdivision as a zigzag. Up from wave ((iii)), wave (a) ended at 1.055 and wave (b) ended at 1.0517. Wave (c) higher ended at 1.0619 which completed wave ((iv)). Pair has resumed lower in wave ((v)). Down from wave ((iv)), wave (i) ended at 1.0447. Wave (ii) rally is in progress to correct cycle from 9.29.2023 high. Internal subdivision of wave (ii) is unfolding as a double three. Up from wave (i), wave w ended at 1.053, and pullback in wave x ended at 1.048. Expect wave y of (ii) to fail below 1.0619 for the next leg lower. As far as pivot at 1.0619 high stays intact, expect rally to fail in 3, 7, or 11 swing for further downside.
EURUSD 60 Minutes Elliott Wave Chart
EURUSD Elliott Wave Video
https://www.youtube.com/watch?v=MuuwGJ5DDAM
Technical Outlook and Review
DXY:
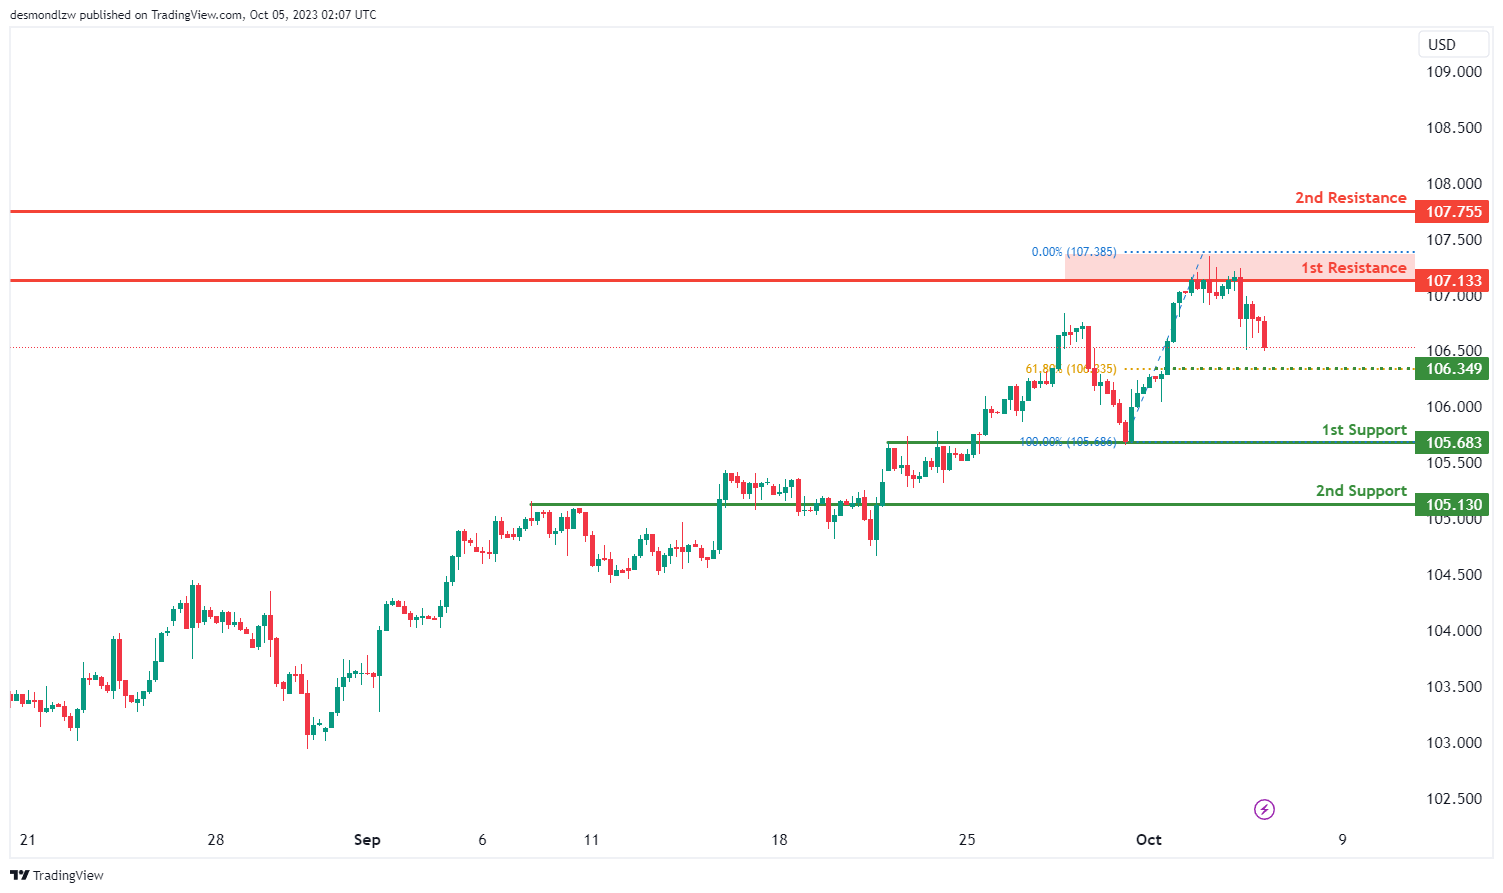
The DXY (US Dollar Index) chart currently exhibits a bearish momentum, and there’s a potential scenario of a bearish continuation towards the 1st support level at 105.68, which is considered significant as it’s identified as an overlap support.
The 2nd support at 105.13 is also notable as a pullback support, further reinforcing its potential role as a support level.
On the resistance side, the 1st resistance level at 107.13 is characterized as a multi-swing high resistance, which suggests it could act as a barrier to upward movements.
Additionally, there’s an intermediate support level at 106.34, which is identified as a pullback support.
EUR/USD:
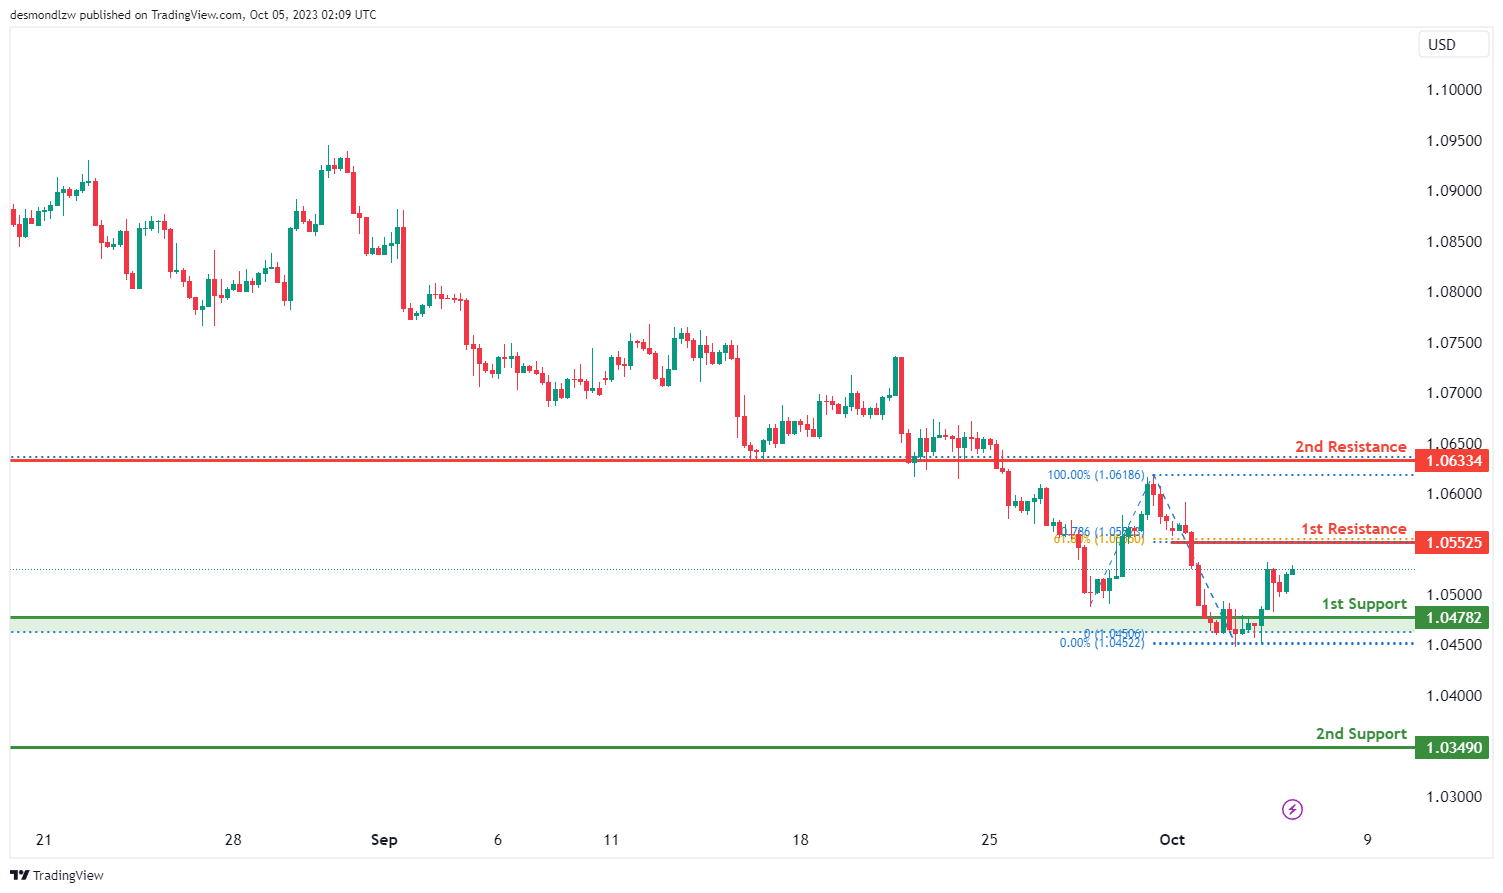
The EUR/USD chart currently exhibits bullish momentum, and there’s a potential scenario of a bullish continuation towards the 1st resistance level at 1.0552. This level is considered significant as it aligns with both the 61.80% Fibonacci Retracement and the 78.60% Fibonacci Projection, indicating a potential Fibonacci confluence.
The 1st support at 1.0478 is another notable level, characterized as a multi-swing low support, which suggests it could provide support in case of a price pullback.
Additionally, the 2nd support at 1.0349 is identified as a swing low support, further reinforcing its importance as a potential support level.
EUR/JPY:
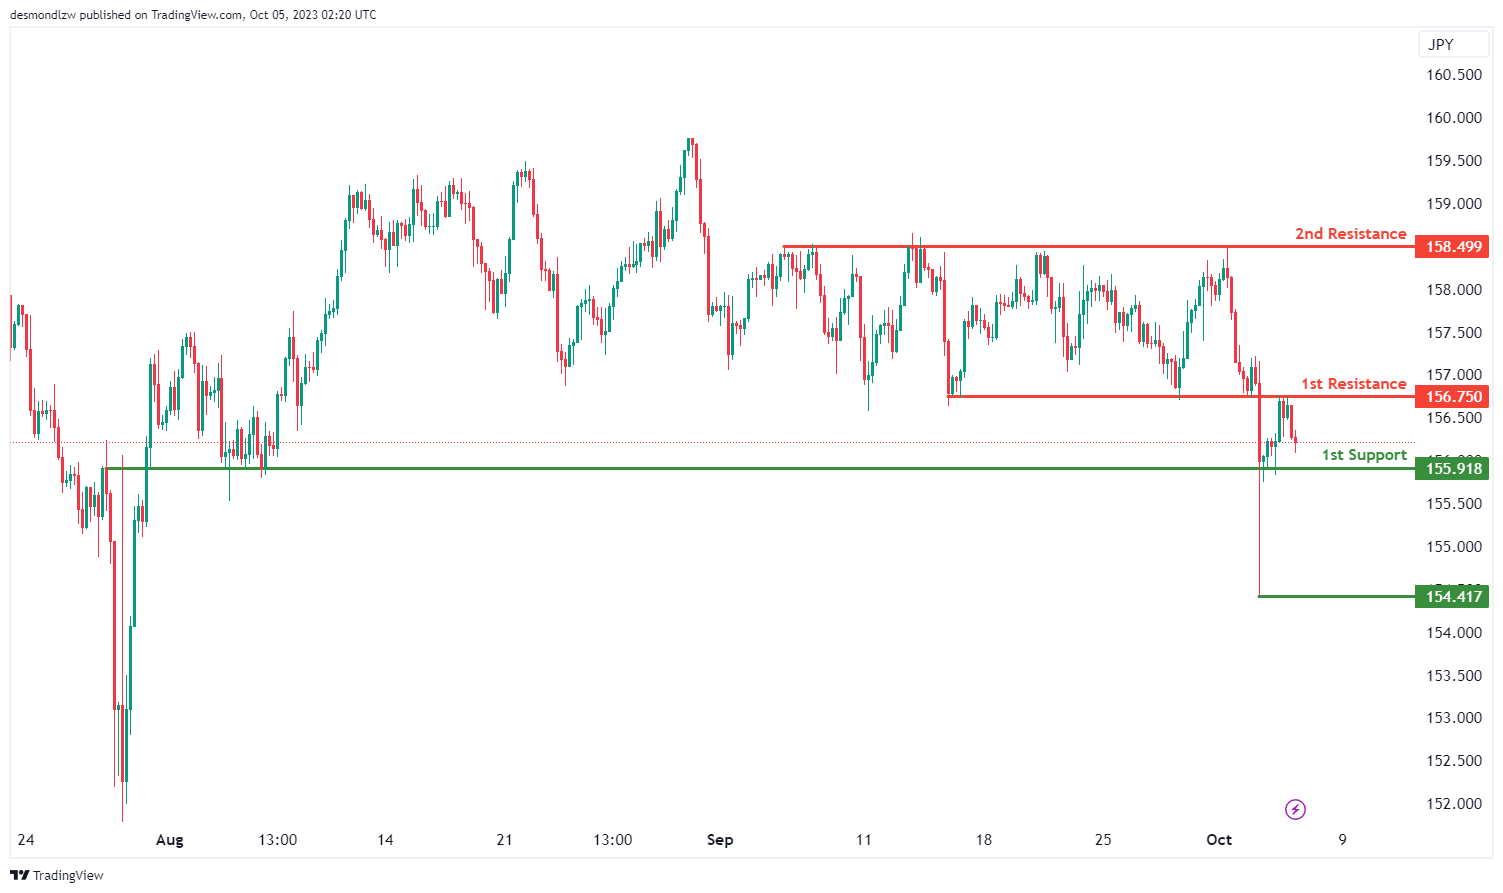
The EUR/JPY chart currently exhibits bearish overall momentum, and there’s a potential scenario of a bearish continuation towards the 1st support level.
The 1st support at 155.91 is considered significant as it’s identified as an overlap support, making it a crucial level for potential price support. Additionally, the 2nd support at 154.41 is categorized as a swing low support, further reinforcing its importance as a potential zone where the price may find support.
On the resistance side, the 1st resistance level at 156.75 is recognized as an overlap resistance, suggesting it may act as a barrier to price increases. Beyond this, the 2nd resistance at 158.49 is identified as a multi-swing high resistance, emphasizing its significance in potential price reversals.
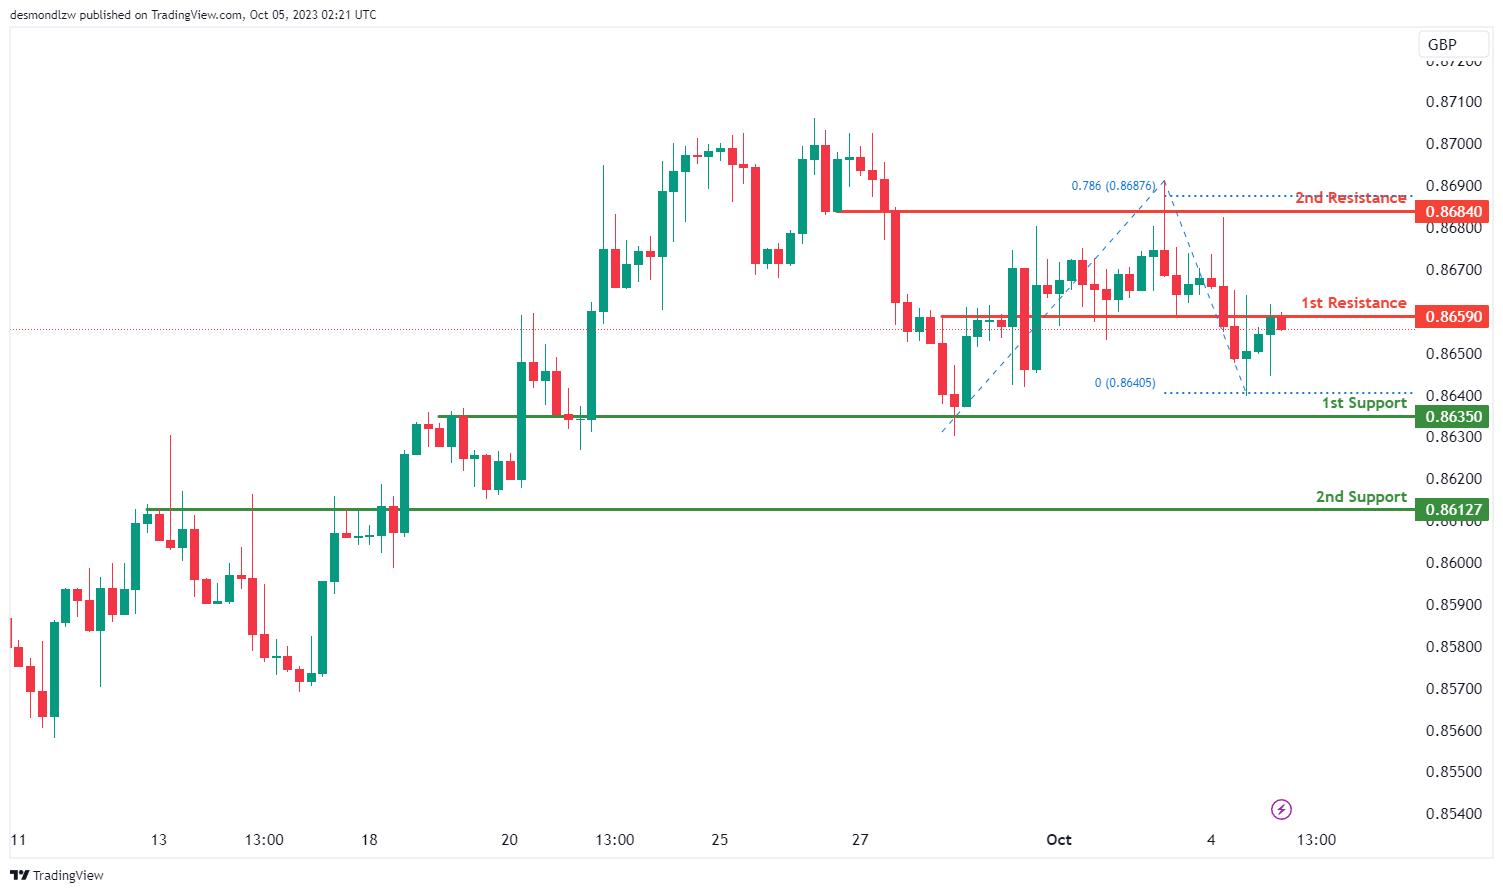
EUR/GBP:
The EUR/GBP chart currently exhibits a bearish overall momentum, and there’s a potential scenario of a bearish reaction off the 1st resistance level towards the 1st support level.
The 1st support at 0.8635 is considered significant as it’s identified as an overlap support, making it a crucial level for potential price support. Furthermore, the 2nd support at 0.8612 is also categorized as an overlap support, reinforcing its importance as a potential zone where the price may find support.
On the resistance side, the 1st resistance level at 0.8659 is recognized as an overlap resistance, suggesting it may act as a barrier to price increases. Similarly, the 2nd resistance at 0.8684 is also identified as an overlap resistance, further emphasizing its significance in potential price reversals.
GBP/USD:
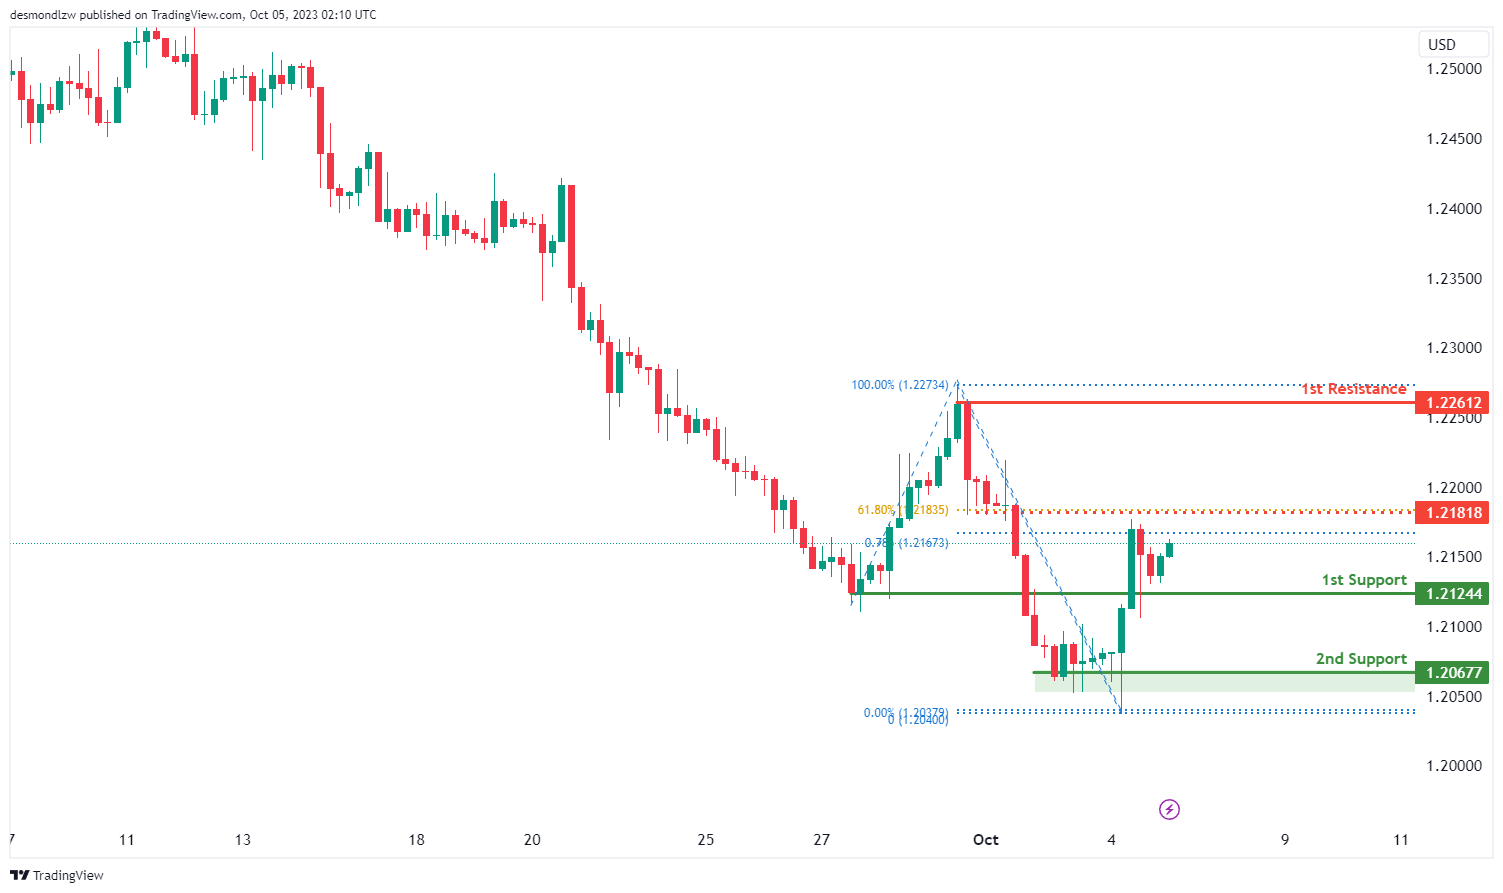
The GBP/USD chart currently maintains a bullish momentum, with the potential scenario of a bullish continuation towards the 1st resistance level at 1.2261. This level is identified as a swing high resistance, suggesting it could act as a barrier to further price increases.
Support levels are also in play, with the 1st support at 1.2124 categorized as an overlap support, reinforcing its significance as a potential level where the price may find support. Additionally, the 2nd support at 1.2067 is characterized as a multi-swing low support, further highlighting its importance as a potential support zone.
An intermediate resistance level at 1.2181 is identified as an overlap resistance and is supported by the 61.80% Fibonacci Retracement, which could potentially influence price movements.
GBP/JPY:
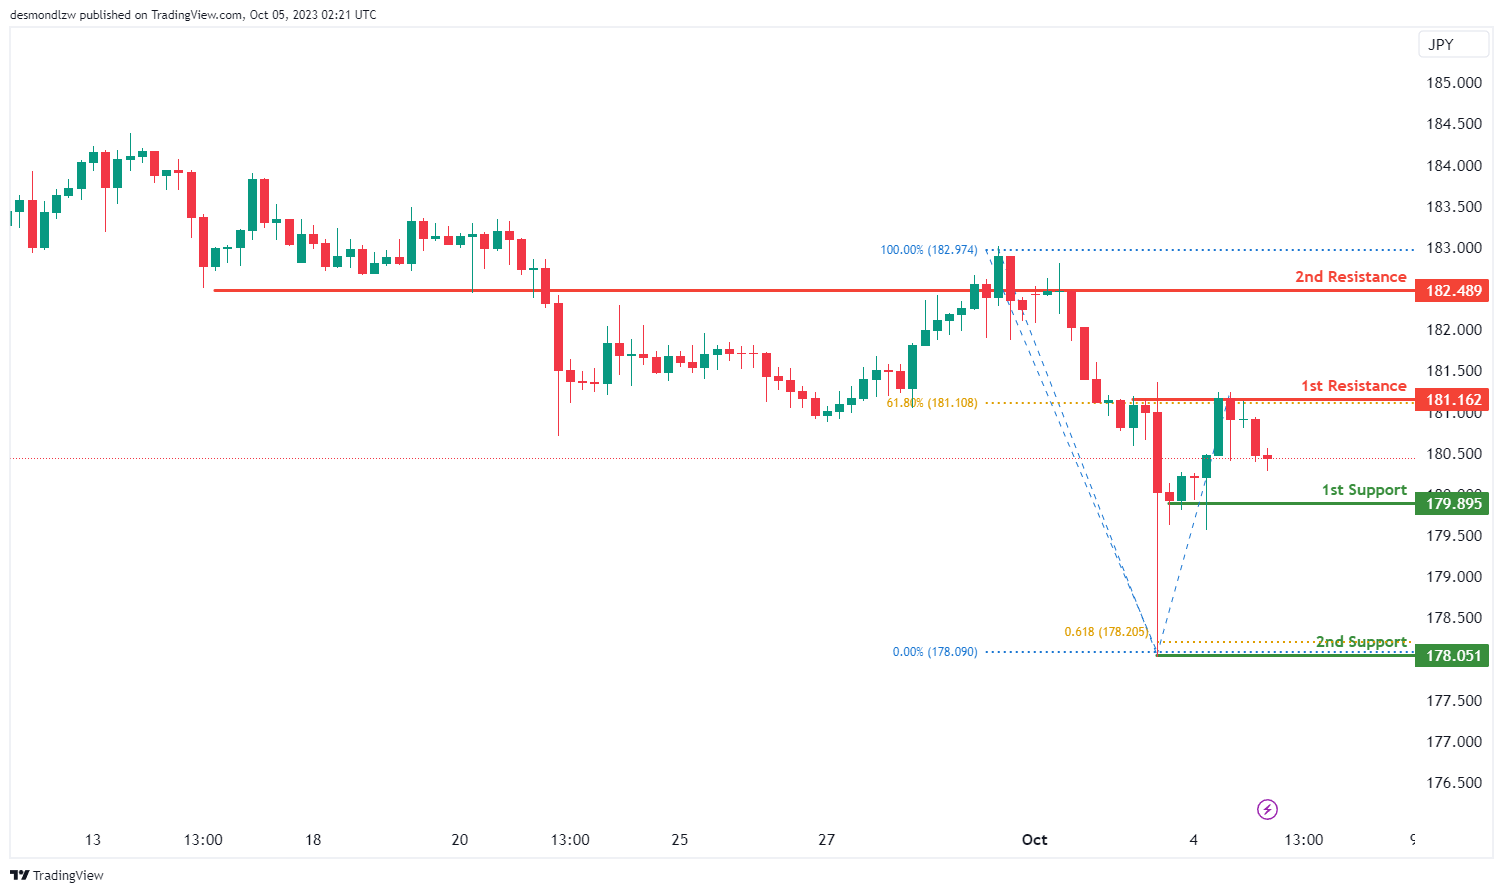
The GBP/JPY chart currently maintains a bearish overall momentum, and there’s a potential scenario of a bearish continuation towards the 1st support level.
The 1st support at 179.89 is considered significant as it’s identified as a multi-swing low support, making it an important level for potential price support. Additionally, the 2nd support at 178.05 is categorized as a swing low support and is reinforced by the presence of the 61.80% Fibonacci Projection, further emphasizing its significance as a potential support level.
On the resistance side, the 1st resistance level at 181.16 is characterized as a multi-swing high resistance and coincides with the 61.80% Fibonacci Retracement, suggesting it may act as a barrier to bullish movements. Beyond this, the 2nd resistance at 182.48 is identified as an overlap resistance, indicating its potential role as a resistance level.
USD/CHF:
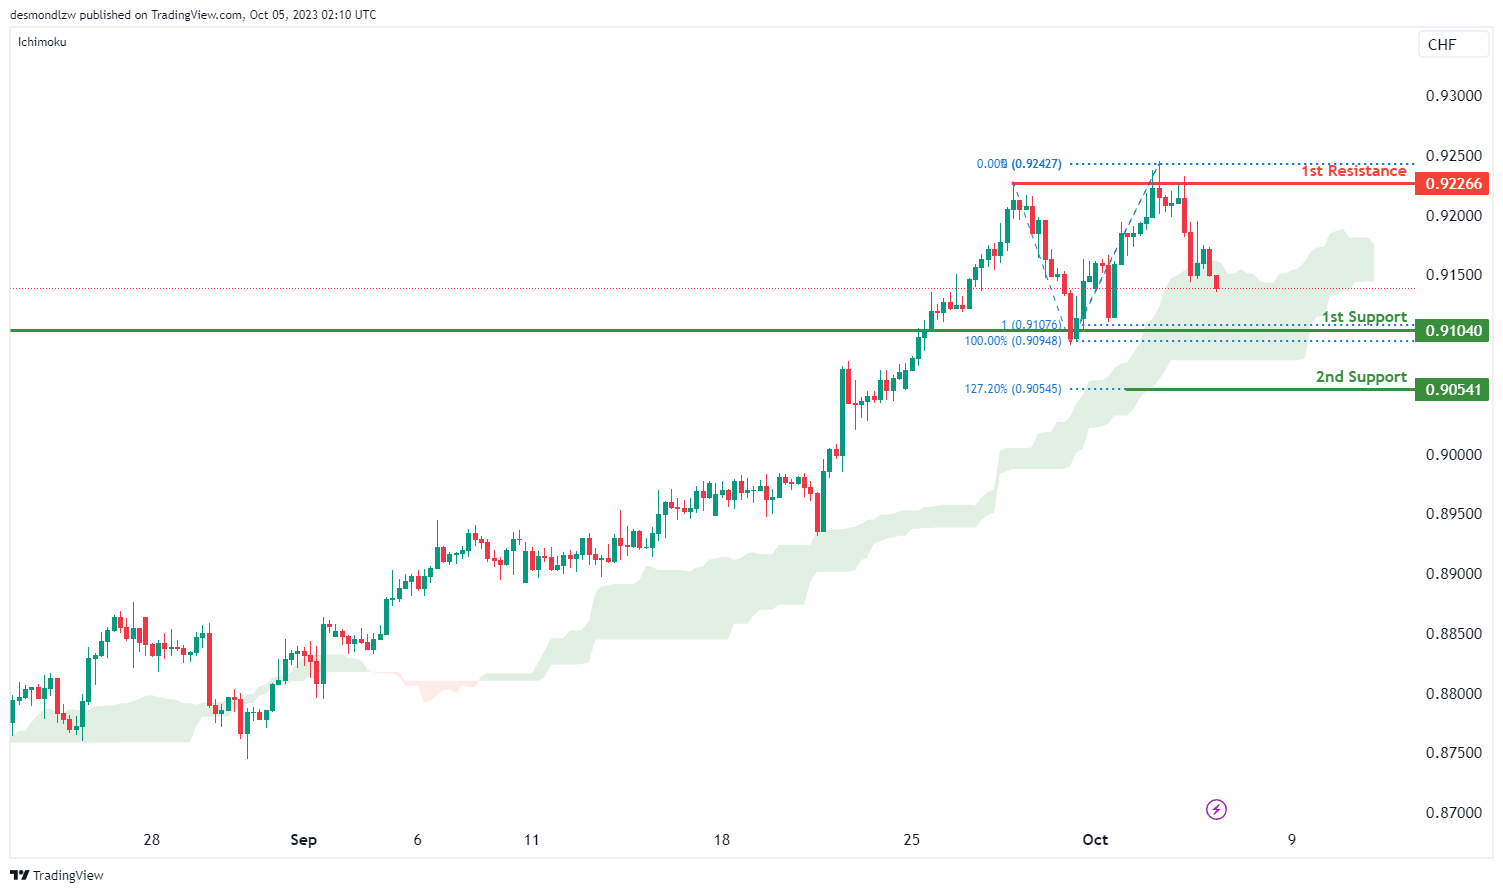
The USD/CHF chart currently exhibits a bearish momentum, with several factors contributing to this direction. One key factor is that the price is within the bearish Ichimoku cloud, which typically suggests that a reversal might occur from this area.
There is a potential scenario of a bearish continuation towards the 1st support level at 0.9104. This support is considered significant due to the presence of the 100% Fibonacci Projection, further reinforcing its importance as a potential level where price may find support. Additionally, the 2nd support at 0.9054 is identified as an overlap support and is supported by the 127.20% Fibonacci Extension, making it another noteworthy level for potential price reversals.
On the resistance side, the 1st resistance level at 0.9226 is marked as a multi-swing high resistance, which could act as a barrier to upward movements.
USD/JPY:
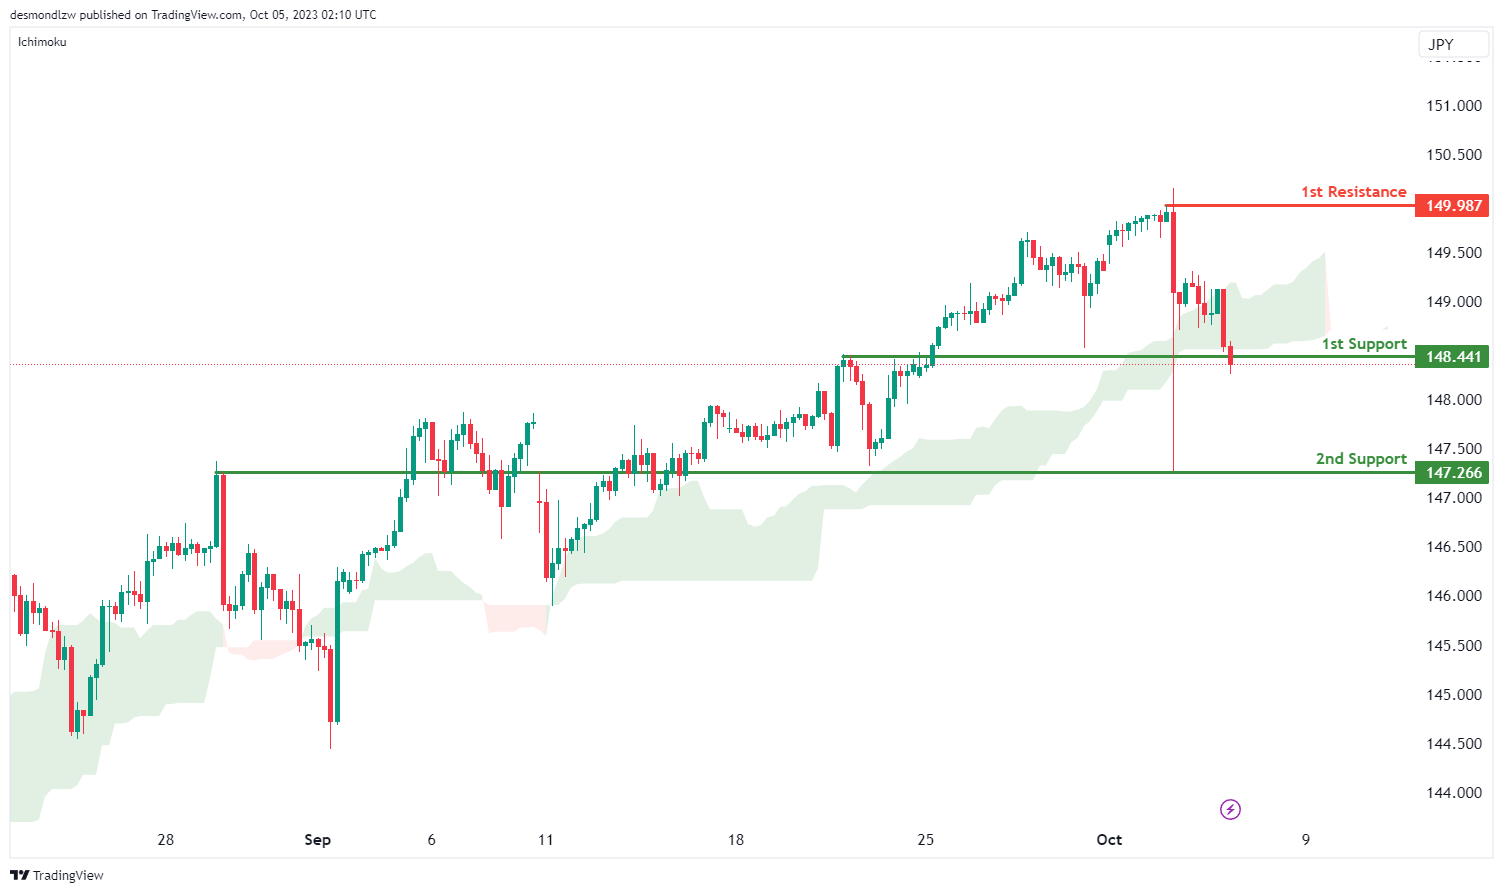
The USD/JPY chart is currently displaying a bearish momentum, with one significant contributing factor being that the price has crossed below the Ichimoku cloud. Given this context, there is a potential scenario where price could experience a bearish break off the 1st support level and drop towards the 2nd support.
The 1st support at 148.44 is considered a pullback support and could be a crucial level for potential price support. Additionally, the 2nd support at 147.26 is identified as an overlap support, reinforcing its significance as a potential zone where price may find support.
On the resistance side, the 1st resistance level at 149.98 is marked as a swing high resistance, which could act as a barrier to upward movements.
USD/CAD:
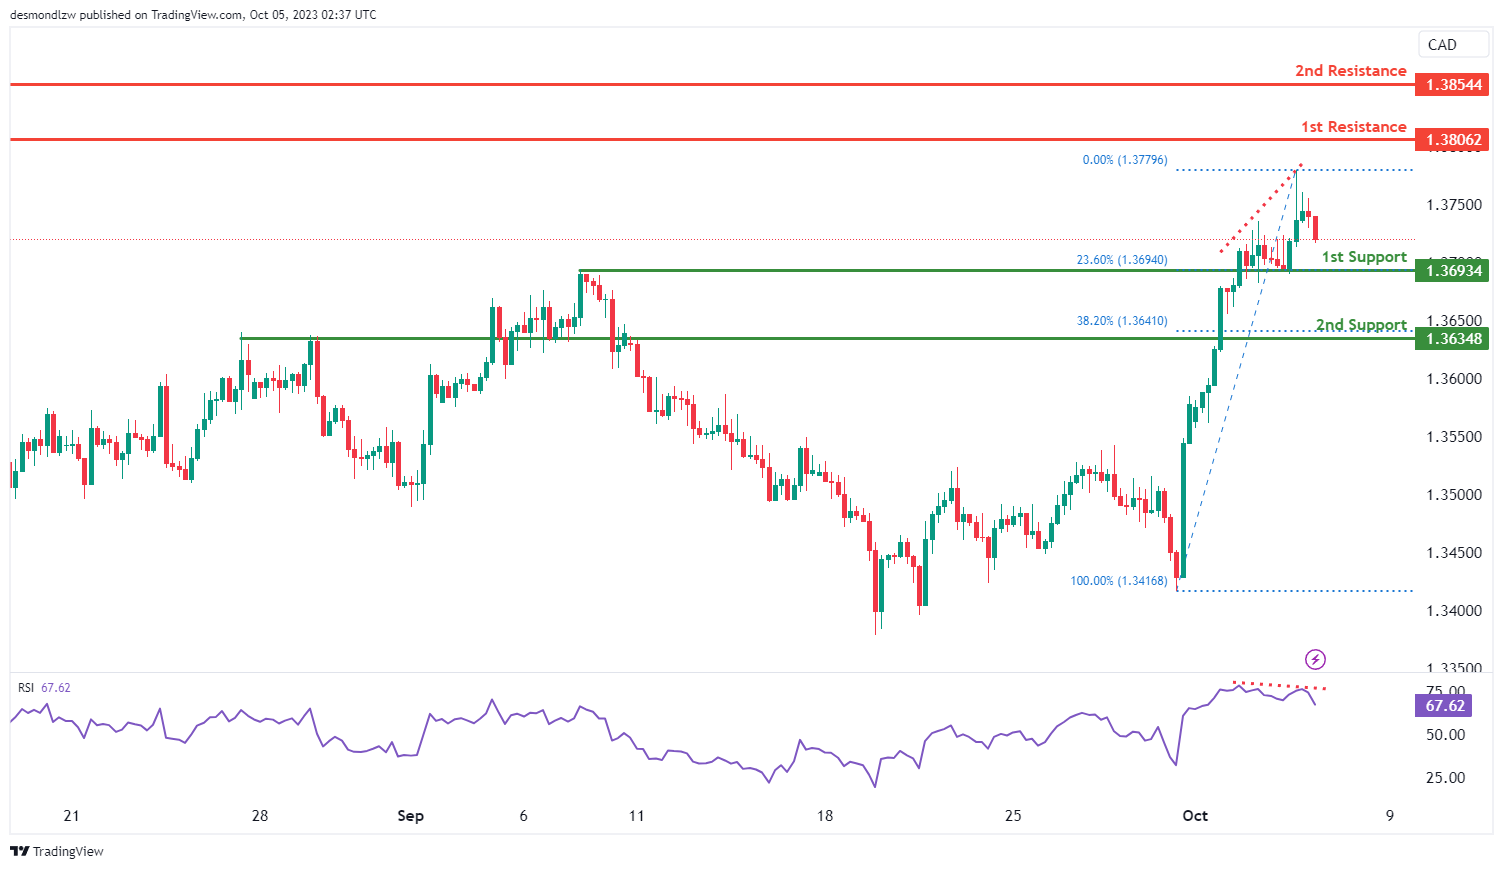
The USD/CAD chart is currently showing an overall bearish momentum suggesting the possibility of a bearish continuation towards the 1st support, supported by the Relative Strength Index (RSI) which is highlighting a bearish divergence versus price action.
The 1st support level at 1.3693 is identified as an overlap support that aligns with the 23.60% Fibonacci retracement level. Additionally, the 2nd support level at 1.3634 is also noted as an overlap support that aligns with the 38.20% Fibonacci retracement level, further reinforcing its importance.
To the upside, the 1st resistance level at 1.3806 is identified as a pullback resistance while the 2nd resistance level at 1.3854 is also marked as a pullback resistance.
AUD/USD:
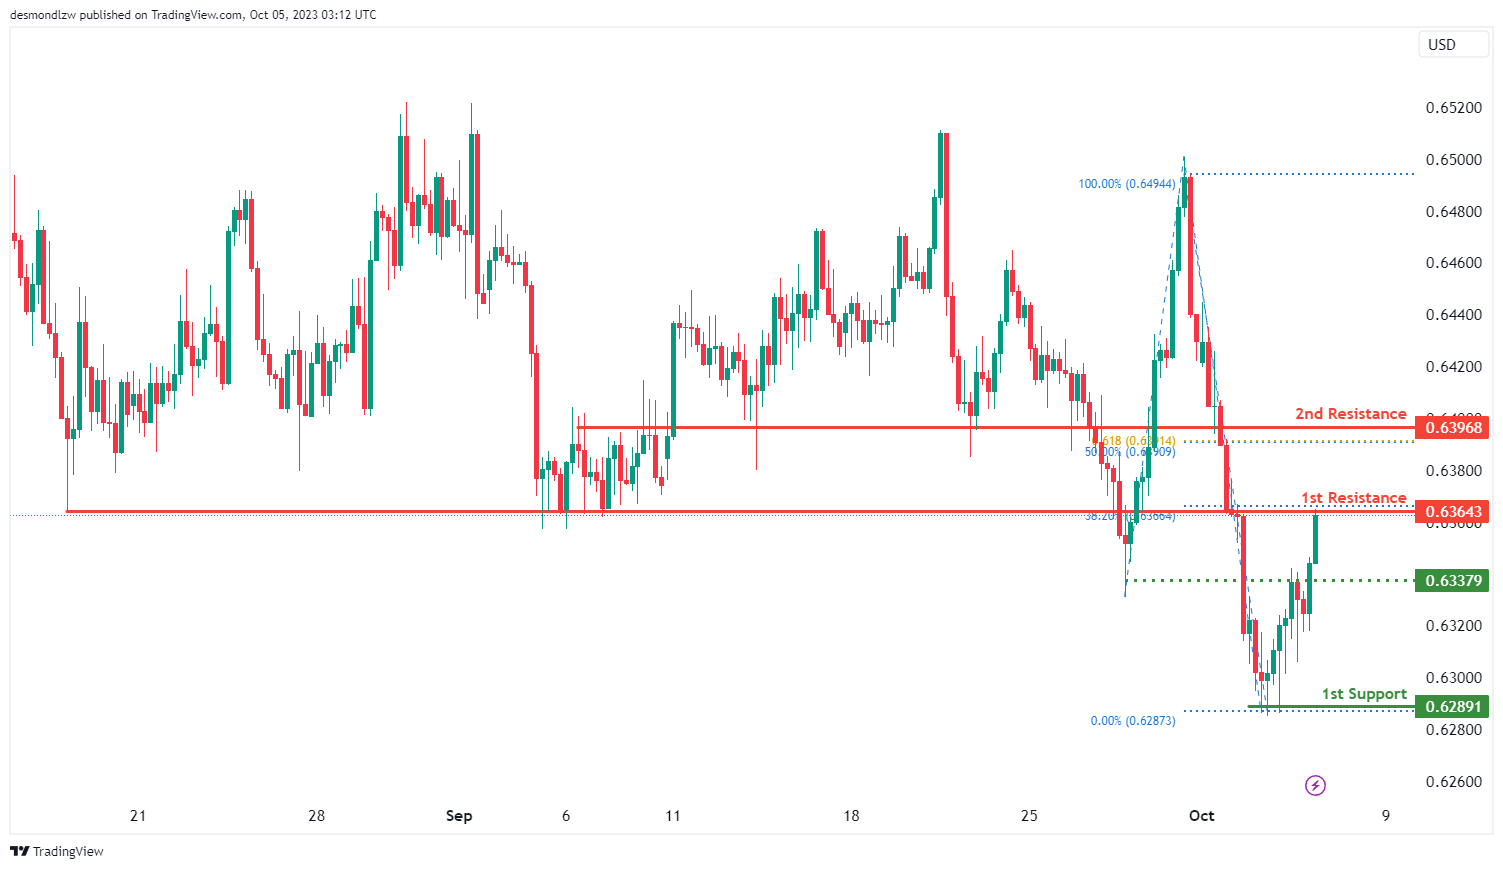
The AUD/USD chart currently exhibits an overall bullish momentum with a potential scenario of a bullish continuation towards the 1st resistance level.
The 1st resistance level at 0.6364 is identified as a pullback resistance that aligns with the 38.20% Fibonacci retracement level. Further up, the 2nd resistance level at 0.6397 is marked as an overlap resistance that aligns with a confluence of Fibonacci levels i.e. the 50% retracement and the 61.80% projection levels.
To the downside, the intermediate support level at 0.6338 is identified as an overlap support while the 1st support level at 0.6289 is marked as a swing-low support, reinforcing its importance as a potential support level.
NZD/USD
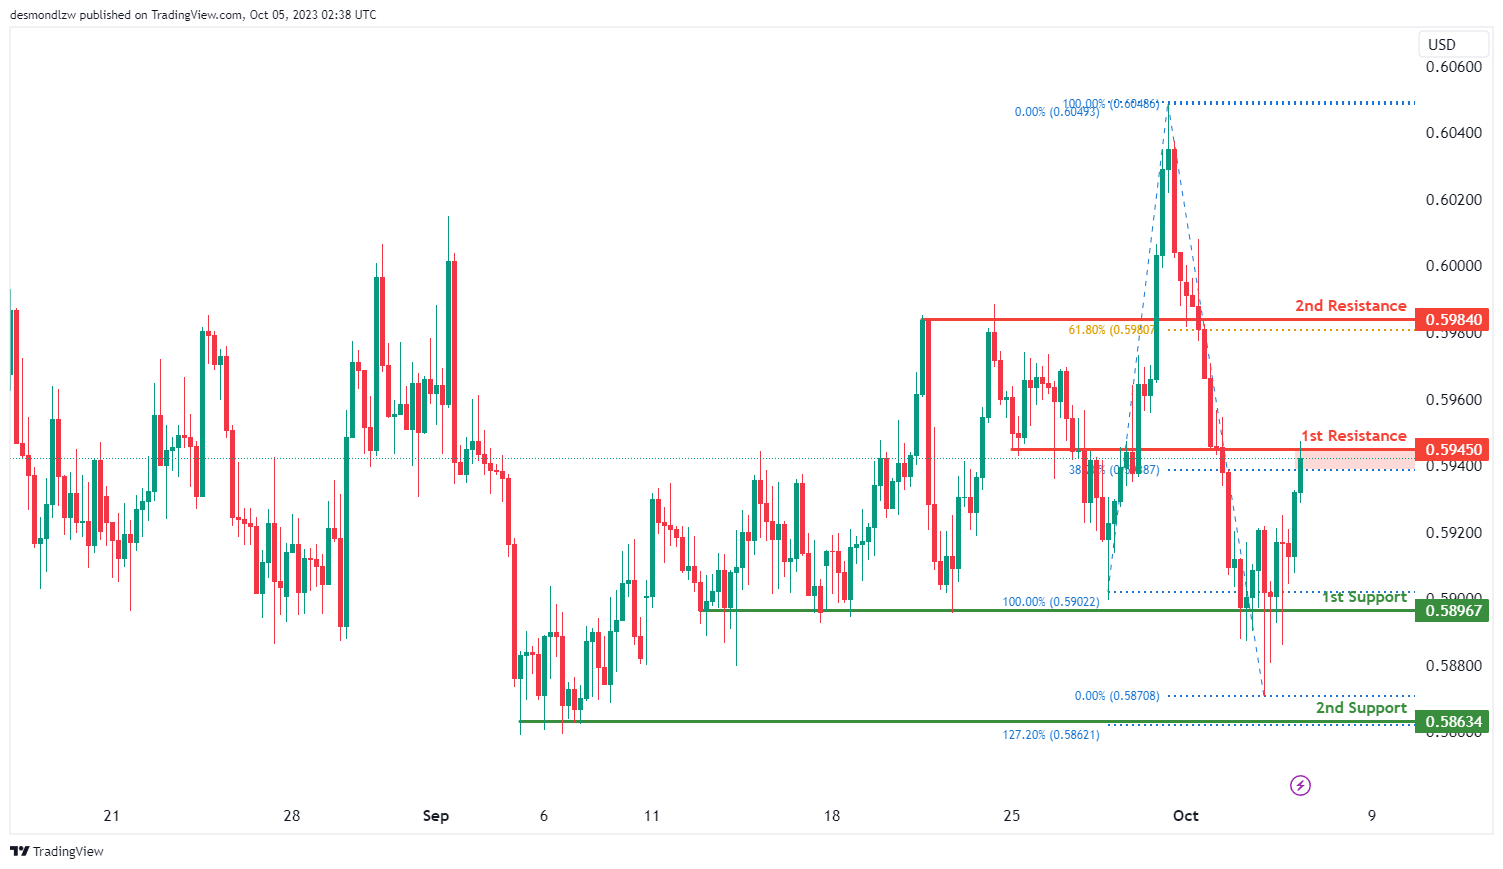
The NZD/USD chart currently exhibits an overall bullish momentum with a potential scenario of a bullish continuation towards the 1st resistance level.
The 1st resistance level at 0.5945 is identified as an overlap resistance that aligns close to the 38.20% Fibonacci retracement level. Additionally, the 2nd resistance level at 0.5984 is marked as a pullback resistance that aligns with the 61.80% Fibonacci Retracement, further emphasizing its significance as a barrier for future price increases..
To the downside, the 1st support level at 0.5897 is identified as a pullback support while the 2nd support level at 0.5863 is also noted as pullback support that coincides with the 127.20% Fibonacci extension level.
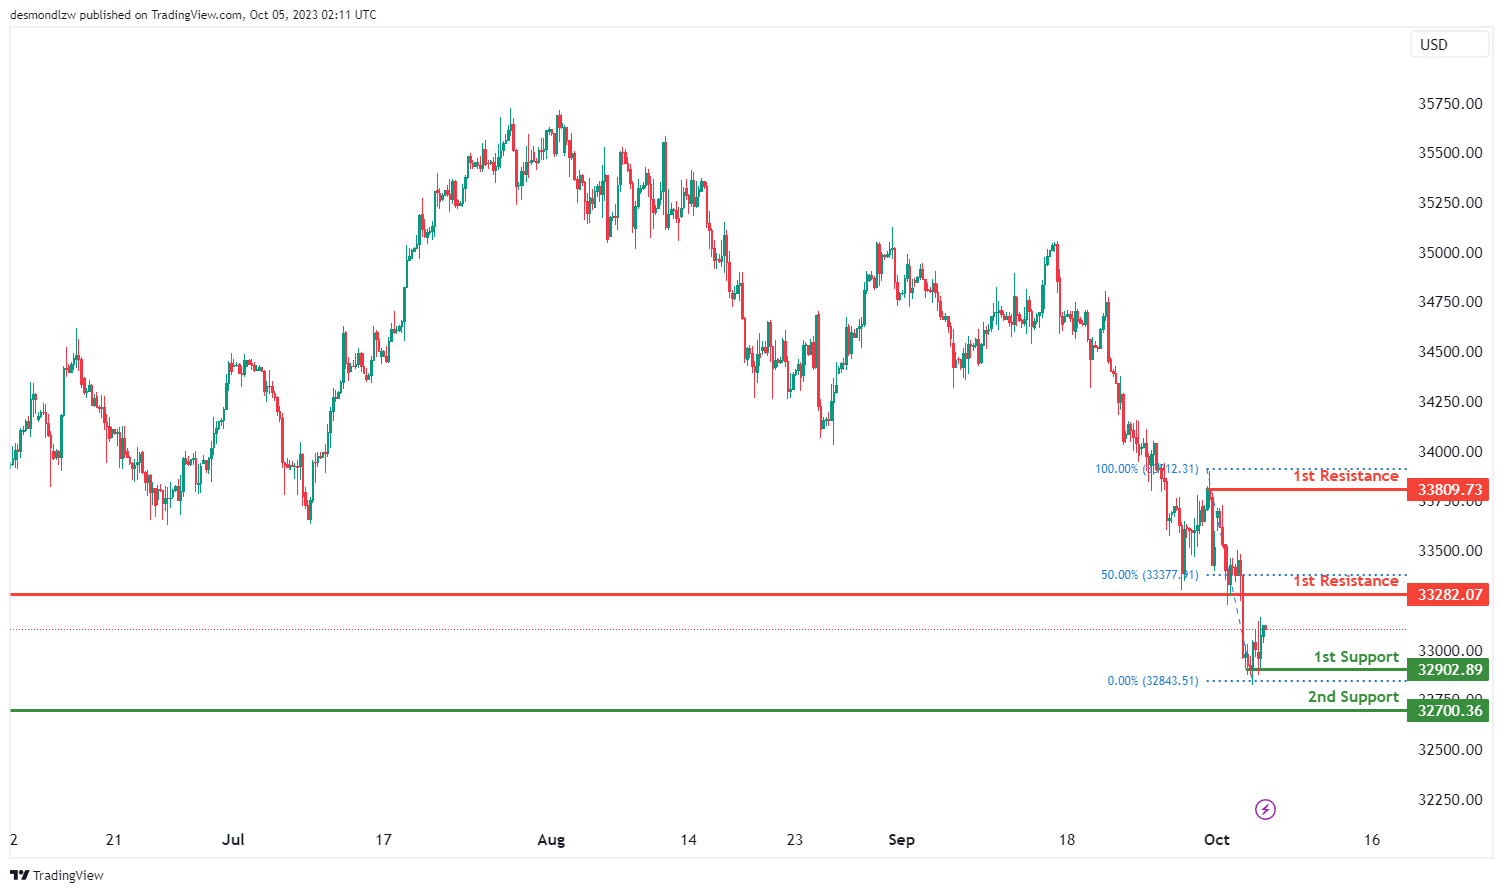
DJ30:
The DJ30 (Dow Jones Industrial Average) chart currently exhibits a bullish overall momentum, and there’s a potential scenario of a bullish continuation towards the 1st resistance level.
The 1st support at 32902.89 is considered significant as it’s identified as a multi-swing low support, making it an important level for potential price support. Additionally, the 2nd support at 37700.36 is also categorized as a multi-swing low support, reinforcing its significance as a potential support zone.
On the resistance side, the 1st resistance level at 33282.07 is marked as a pullback resistance, potentially limiting upward movements. Beyond this, the 2nd resistance at 33809.73 is identified as a swing high resistance, further emphasizing its significance in potential price reversals.
GER40:
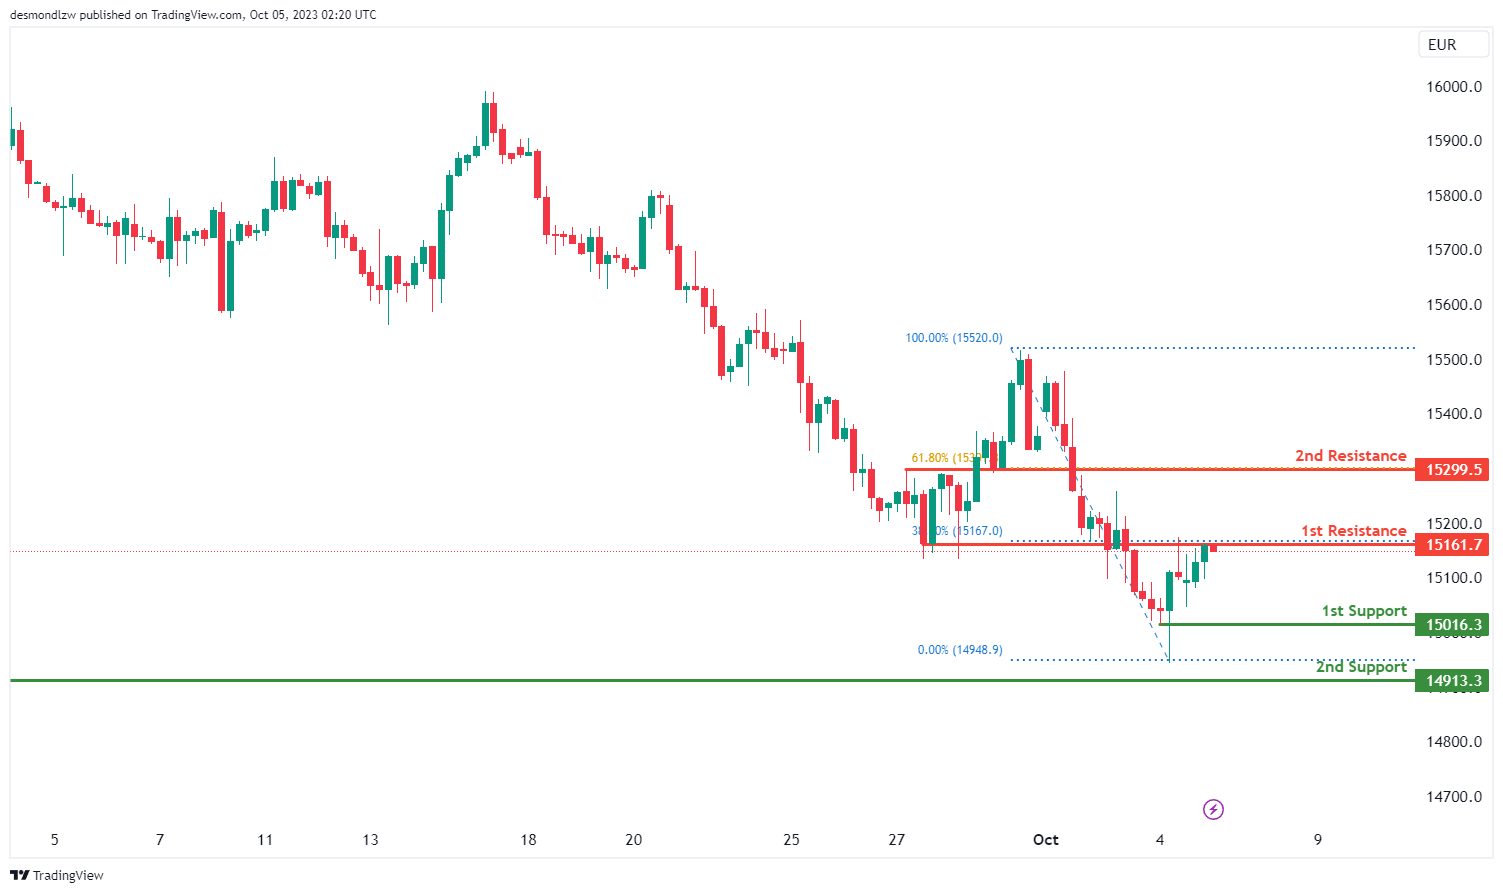
The GER40 (DAX 30) chart currently has a bearish overall momentum, and there’s a potential scenario where the price could react bearishly off the 1st resistance level and drop towards the 1st support level.
The 1st support at 15016.30 is identified as a swing low support, making it a significant level for potential price support. Additionally, the 2nd support at 14913.30 is also marked as a swing low support, reinforcing its importance as a potential level where the price may find support.
On the resistance side, the 1st resistance level at 15161.70 is characterized as an overlap resistance and is accompanied by the presence of a 38.20% Fibonacci Retracement level, suggesting it may act as a barrier to price increases. Beyond this, the 2nd resistance at 15299.50 is identified as a pullback resistance and is associated with a 61.80% Fibonacci Retracement level.
US500
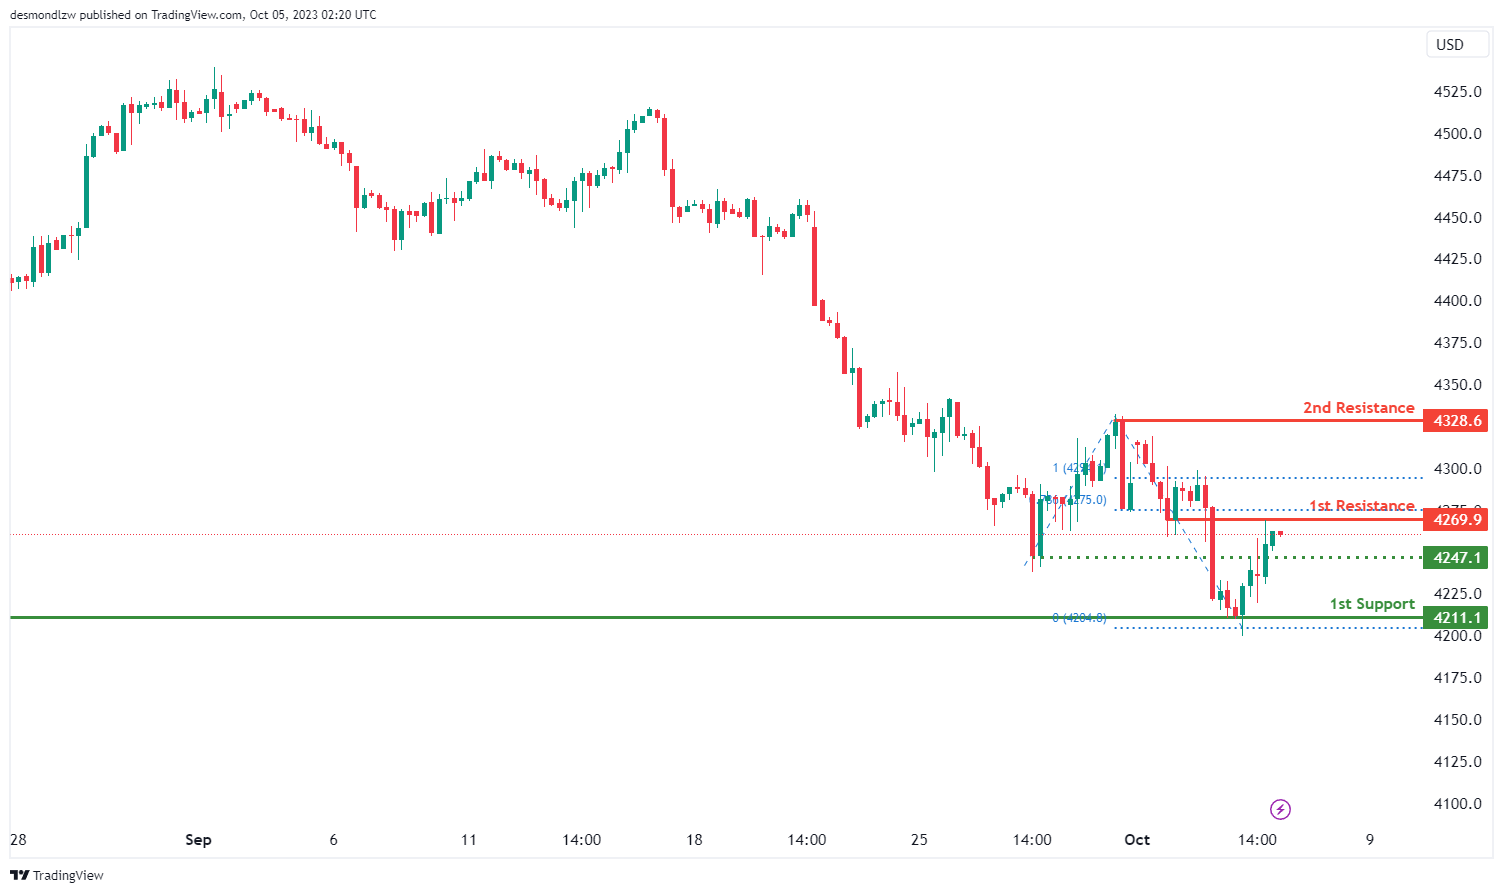
The US500 (S&P 500) chart currently exhibits a bearish overall momentum, and there’s a potential scenario where the price could react bearishly off the 1st resistance level and drop towards the 1st support level.
The 1st support at 4211.1 is identified as a swing low support, making it a noteworthy level for potential price support. Additionally, there is an intermediate support at 4247.1, marked as a pullback support, further reinforcing its significance as a potential level where the price may find support.
On the resistance side, the 1st resistance level at 4269.9 is characterized as an overlap resistance and is accompanied by the presence of a 78.60% Fibonacci Projection level, suggesting it may act as a barrier to price increases. Beyond this, the 2nd resistance at 4328.6 is identified as a swing high resistance.
BTC/USD:
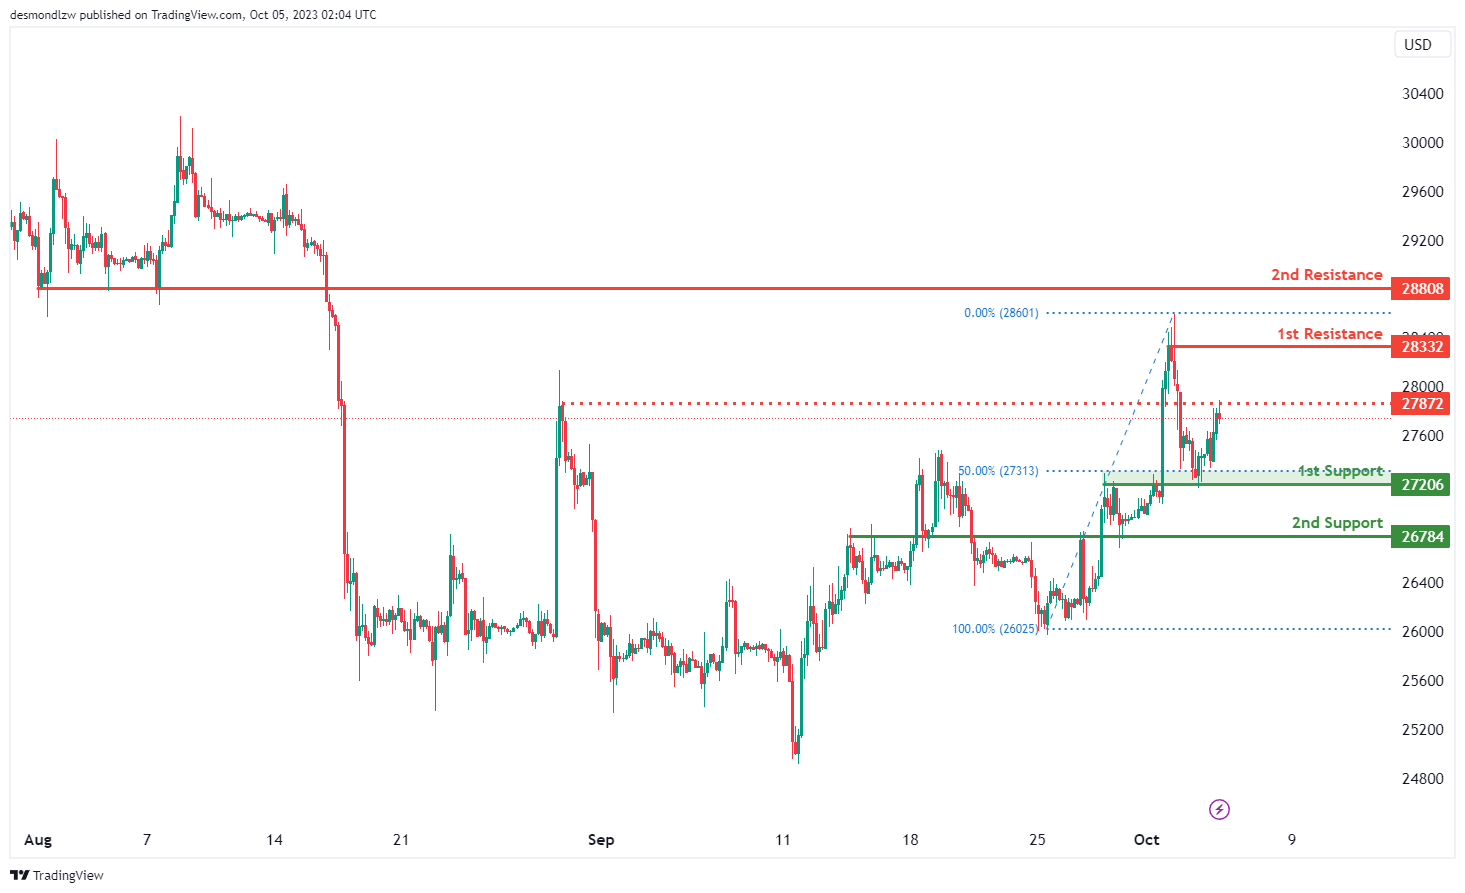
The BTC/USD (Bitcoin/US Dollar) chart currently has a bearish overall momentum, and there’s a potential scenario where the price could continue its bearish movement towards the 1st support level.
The 1st support at 27206 is considered significant as it’s identified as an overlap support and is accompanied by a 50% Fibonacci Retracement level, suggesting potential price support. Additionally, the 2nd support at 26784 is categorized as an overlap support, reinforcing its importance as a potential level where the price may find support.
On the resistance side, the 1st resistance level at 28332 is marked as a swing high resistance. Beyond this, the 2nd resistance at 28808 is identified as a pullback resistance, indicating it may act as a barrier to the price’s upward movement. There is also an intermediate resistance at 27872, which is marked as an overlap resistance.
ETH/USD:
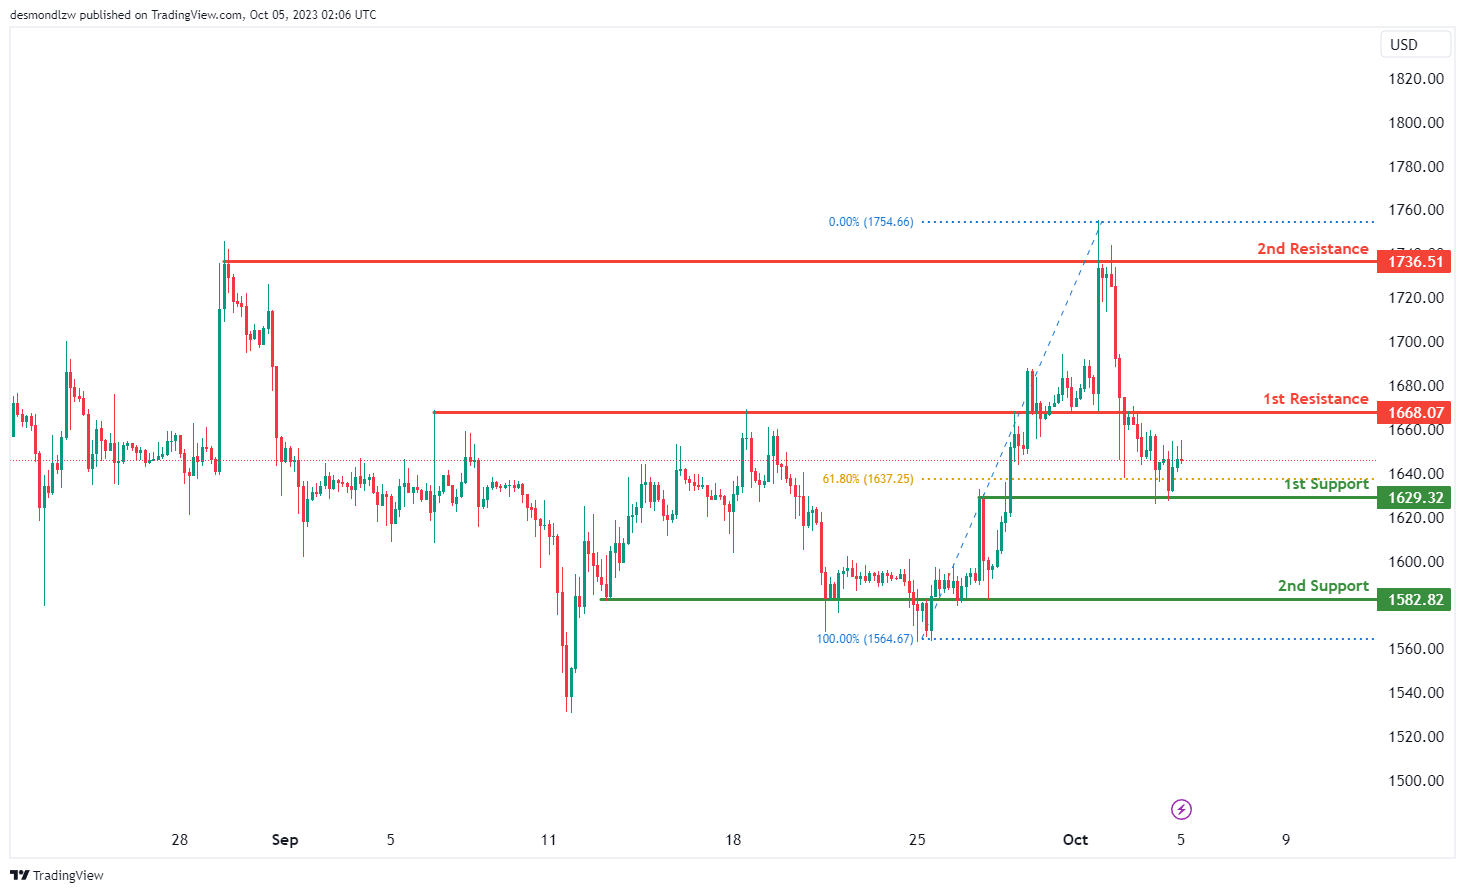
The ETH/USD (Ethereum/US Dollar) chart is currently exhibiting a neutral momentum, and there’s a potential scenario where the price may fluctuate between the 1st resistance and 1st support levels.
The 1st support at 1629.32 is considered significant as it’s identified as an overlap support and is accompanied by a 61.80% Fibonacci Retracement level, indicating potential price support. Additionally, the 2nd support at 1582.82 is categorized as an overlap support, reinforcing its significance as a potential area where the price may find support.
On the resistance side, the 1st resistance level at 1668.07 is marked as an overlap resistance. Beyond this, the 2nd resistance at 1736.51 is identified as a multi-swing high resistance, which suggests that it could potentially act as a barrier to the price’s upward movement.
WTI/USD:
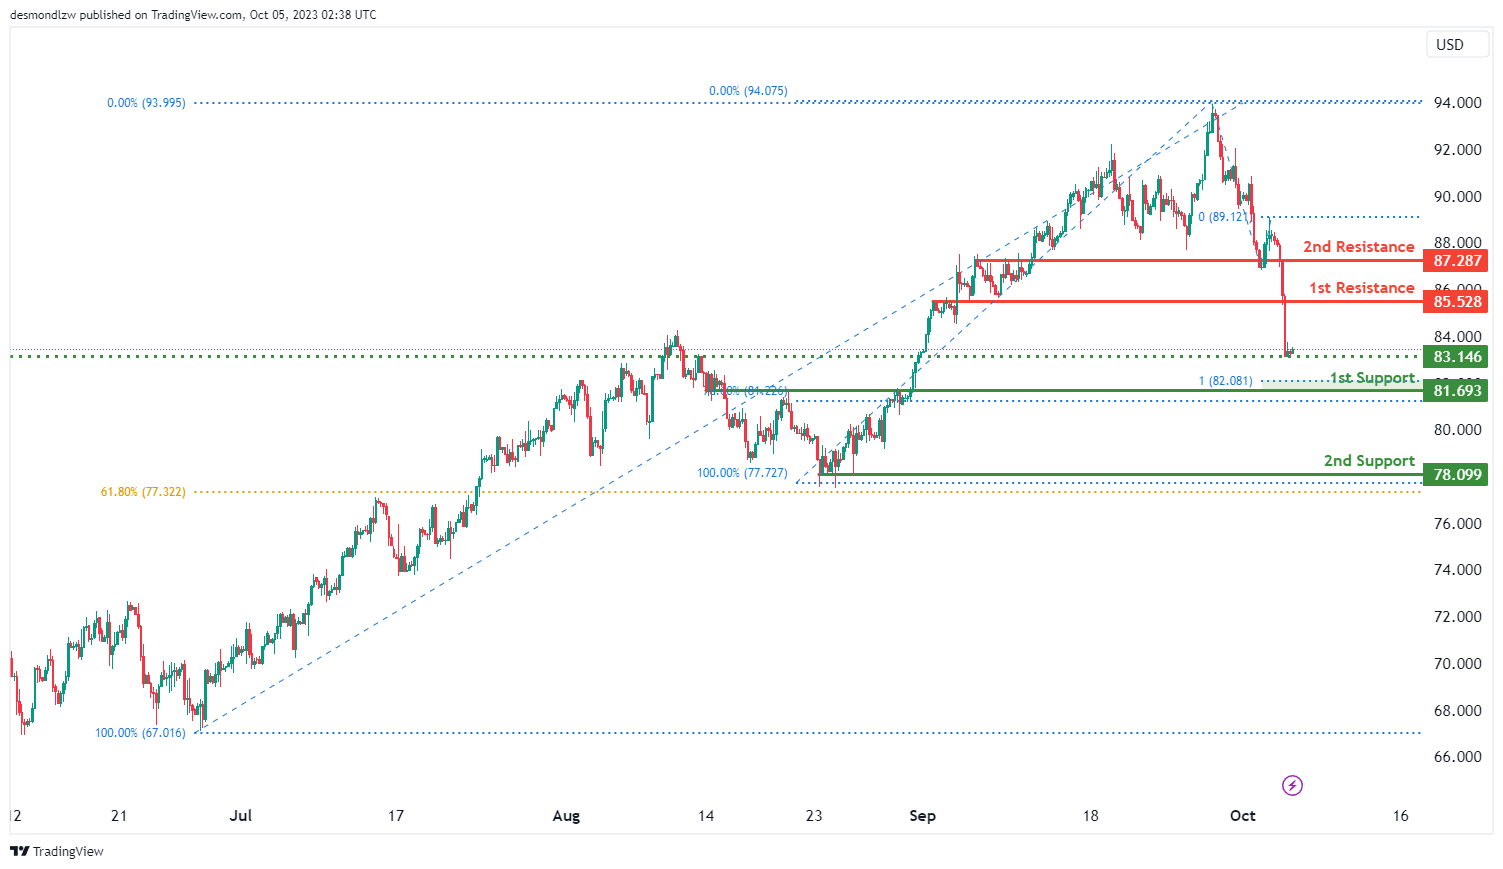
The WTI chart currently shows an overall bearish momentum and there is a potential for a bearish continuation towards the 1st support should price break below the intermediate support level.
The intermediate support level at 83.15 is identified as a pullback support while the 1st support level at 81.69 is noted as an overlap support that aligns close to a confluence of Fibonacci levels i.e. the 78.60% retracement and the 100.00% projection levels. Additionally, the 2nd support level at 78.09 is marked as a pullback support that aligns close to the 61.80% Fibonacci retracement level.
To the upside, the 1st resistance level at 85.53 is identified as an overlap resistance while the 2nd resistance level at 87.29 is also noted as an overlap resistance.
XAU/USD (GOLD):
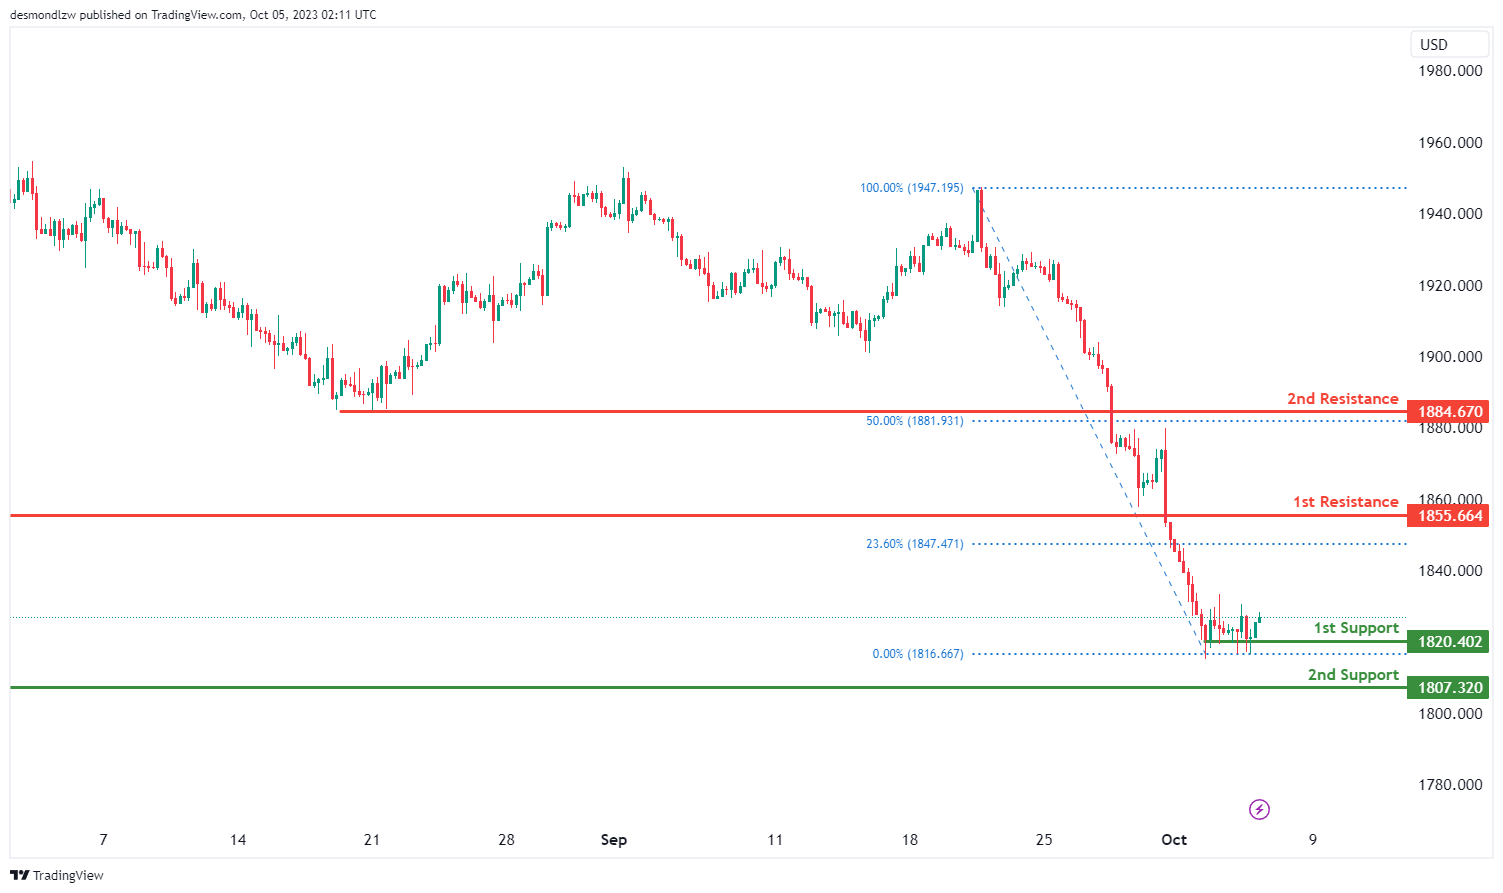
The XAUUSD (Gold/US Dollar) chart is currently showing a bullish momentum, and there’s a potential scenario where price could continue its bullish movement towards the 1st resistance level.
The 1st support at 1820.40 is considered significant as it’s identified as an overlap support, making it an important level for potential price support. Additionally, the 2nd support at 1807.00 is categorized as a swing low support, further reinforcing its significance as a potential area where the price may find support.
On the resistance side, the 1st resistance level at 1855.66 is marked as a pullback resistance, which could limit further upward movements. Beyond this, the 2nd resistance at 1884.64 is identified as an overlap resistance and is accompanied by a 50% Fibonacci Retracement level, which indicates potential resistance to the price’s upward movement.
10% decline in oil prices raises questions on demand destruction
Oil prices took a significant dip overnight, with WTI now trading USD 10 beneath last week's peak of 95.50. This decline is notably perplexing given the absence of a clear triggering event. OPEC+'s resolution to uphold output cuts is conventionally a precursor for a bullish response in the market. However, the rapid and profound dip has spurred conversations around the onset of demand destruction, provoked by the Q3 oil price spike.
In this week's meeting, the OPEC+ ministerial panel opted for status quo, maintaining its existing oil output policy. Saudi Arabia pledged to persist with its voluntary cut of 1 million barrels per day through the end of 2023, while Russia committed to retaining its voluntary export reduction of 300k bpd until December's end.
A note from JPMorgan's commodity analysts titled "Demand destruction has begun (again)" highlighted that the repercussions of surging oil prices are re-emerging in the form of demand restraints in regions including US, Europe, and certain Emerging Markets.
The crux of global oil demand growth, anchored by China and India, is also showing signs of waning. China's decision to utilize domestic crude inventories following the surge in oil prices is indicative of this trend.
In the US, gasoline consumption has plummeted to a 22-year low. The considerable 30% hike in fuel prices in Q3 has reportedly dampened demand, leading to an atypical decline of 223k barrels per day.
From a technical standpoint, WTI crude oil finds itself at a pivotal support juncture, which comprises the 84.91 resistance-turned-support and the 55 D EMA, currently pegged at 84.90. While a solid rebound from this position remains plausible, it's expected to be restrained well below 95.50 high.
On the other hand, sustained break of 84.91 would confirm rejection by 50% retracement of 131.82 to 63.67 at 97.74. WTI could then be reversing whole rally from May's low at 63.67, and risk falling further to 77.95 support.
Crude Oil Price Trims Gains As Dollar Accelerates Higher
Key Highlights
- Crude oil prices started a major decline from the $95.40 zone.
- A major bearish trend line is forming with resistance near $87.20 on the 4-hour chart.
- Gold prices are trading in a bearish zone below $1,840.
- EUR/USD is struggling to recover above the 1.0550 resistance.
Crude Oil Price Technical Analysis
Crude oil price formed a medium-term top near $95.40 against the US Dollar. The price started a major decline below the $92.00 and $90.00 support levels.
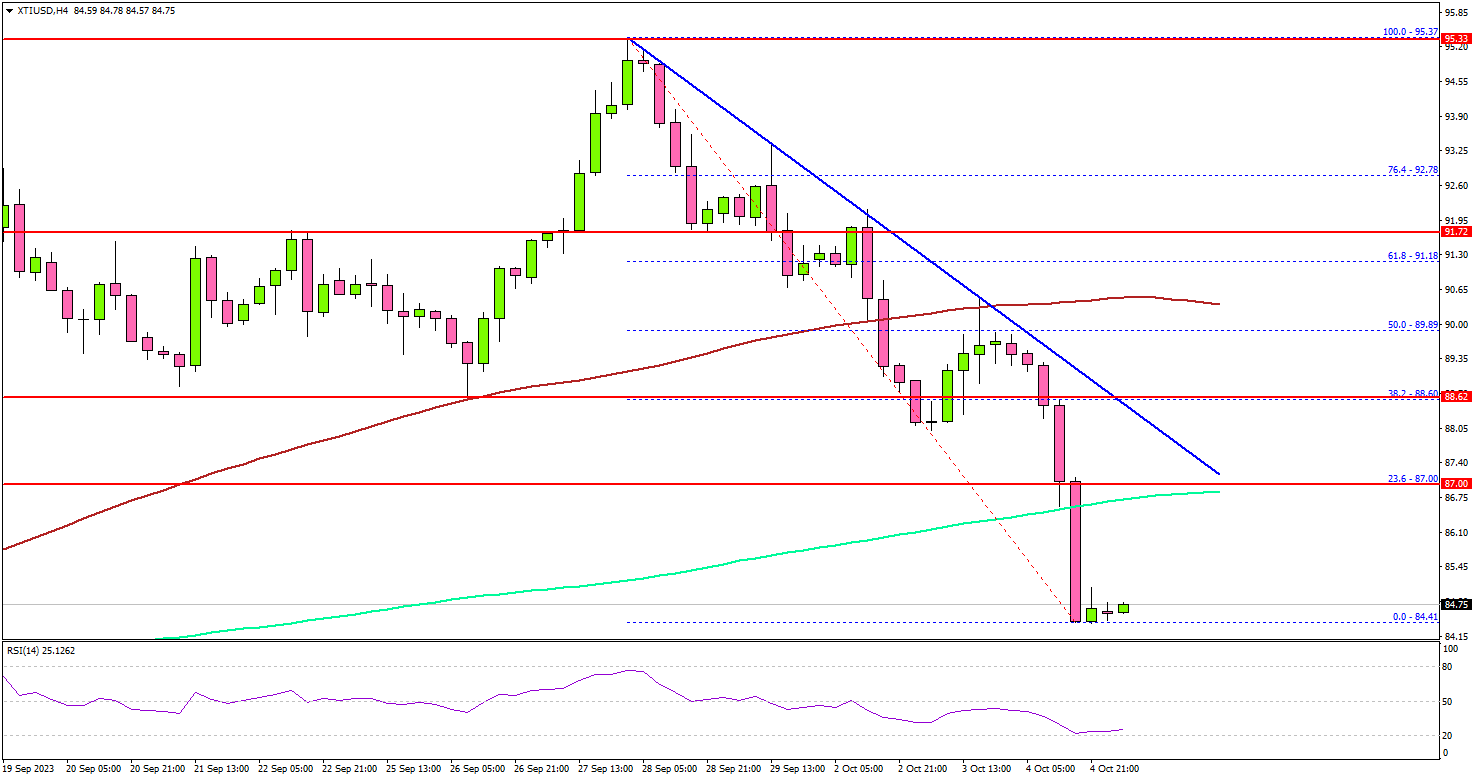
Looking at the 4-hour chart of XTI/USD, the price accelerated lower below the $90 level and the 100 simple moving average (red, 4-hour). It even traded below the 200 simple moving average (green, 4-hour).
Besides, there is a major bearish trend line forming with resistance near $88.20 on the same chart. If the bears remain in action, there could be a drop toward the $84.00 support.
The next major support sits near the $83.20 zone. Any more losses might call for a test of the $82.50 support zone or a trend change and drop toward the $80.00 support zone.
On the upside, the price might face resistance near the $86.20 level. The next major resistance is near the $87.00 level or the trend line, above which the price may perhaps accelerate higher. In the stated case, it could even visit the $90 resistance.
Looking at gold prices, there was a major decline, and the price is now showing bearish signs below the $1,840 level.
Economic Releases to Watch Today
- US Initial Jobless Claims - Forecast 210K, versus 204K previous.
- US Goods and Services Trade Balance for August 2023 - Forecast $-62.3B, versus $-65.0B previous.
Earnings Data on Schedule as Yen Intervention Dominates Sentiment
- Key earnings data will be released on Friday 02.30 GMT as the BoJ is fixated on wages
- The market remains focused on the rumoured intervention from Japanese authorities
- A strong set of data could offer some short-term respite to the ailing yen
Yen Intervention in focus
The market is still digesting Tuesday’s rumoured intervention, and it is trying to evaluate the likely next steps from Japanese authorities. The yen has been left unprotected with the market continuously favouring the US dollar due to the massive yield differential. Despite this yen suffering, the Bank of Japan needs sufficient economic evidence in order to start scaling back its policy accommodation, starting with an abandonment of negative rates that have been in place since February 2016.
BoJ needs stronger economic data
The latest quarterly Tankan was mostly positive, retail sales continue to surprise on the upside, but the August inflation figures confirmed the deceleration seen in other regions, potentially making the BoJ’s job even harder. However, the BoJ has probably been waiting for this pullback in inflation as one of the policy board members, Tamara, recently mentioned that “Japan's inflation is likely to slow for time being, and then accelerate moderately again”.
The BoJ cares a lot about wages
For this inflation acceleration to be confirmed, the BoJ is putting a lot of faith on continued wage increases. Since taking over in April, Governor Ueda has been quite explicit about the importance of wages, and therefore earnings, on finally achieving an exit from the current loose monetary policy stance.
The April 2023 wage round was very positive from a monetary policy perspective, and Governor Ueda has been nonstop on the wires highlighting this situation. At his September 25 speech in Osaka, he stated that the “key to whether Japan is close to achieving our target is whether wage growth leads to moderate rise in inflation”.
Earning data could whet the BoJ’s appetite
Importantly, on Friday we will get the August labour cash earnings and the overall household spending numbers. The former has been recording decent annual increases, but the BoJ would prefer higher prints going forward. Their wish might come true on Friday as the August figure is seen accelerating to 1.5% YoY from 1.3% in July. Similarly, the overall household spending has been hovering in negative territory, but economists forecast an improved print at -4.0% YoY.
Understandably, the current figures are not extremely pleasing to the eye for BoJ members, but they verify the improvement across the economic spectrum seen over the past year in Japan. In this context, the often-overlooked leading economic index is also published on Friday. It is expected to jump higher again, building upon the continued improvement recorded by this forward-looking indicator since the January 2023 trough.
Yen is trying to recover against the euro
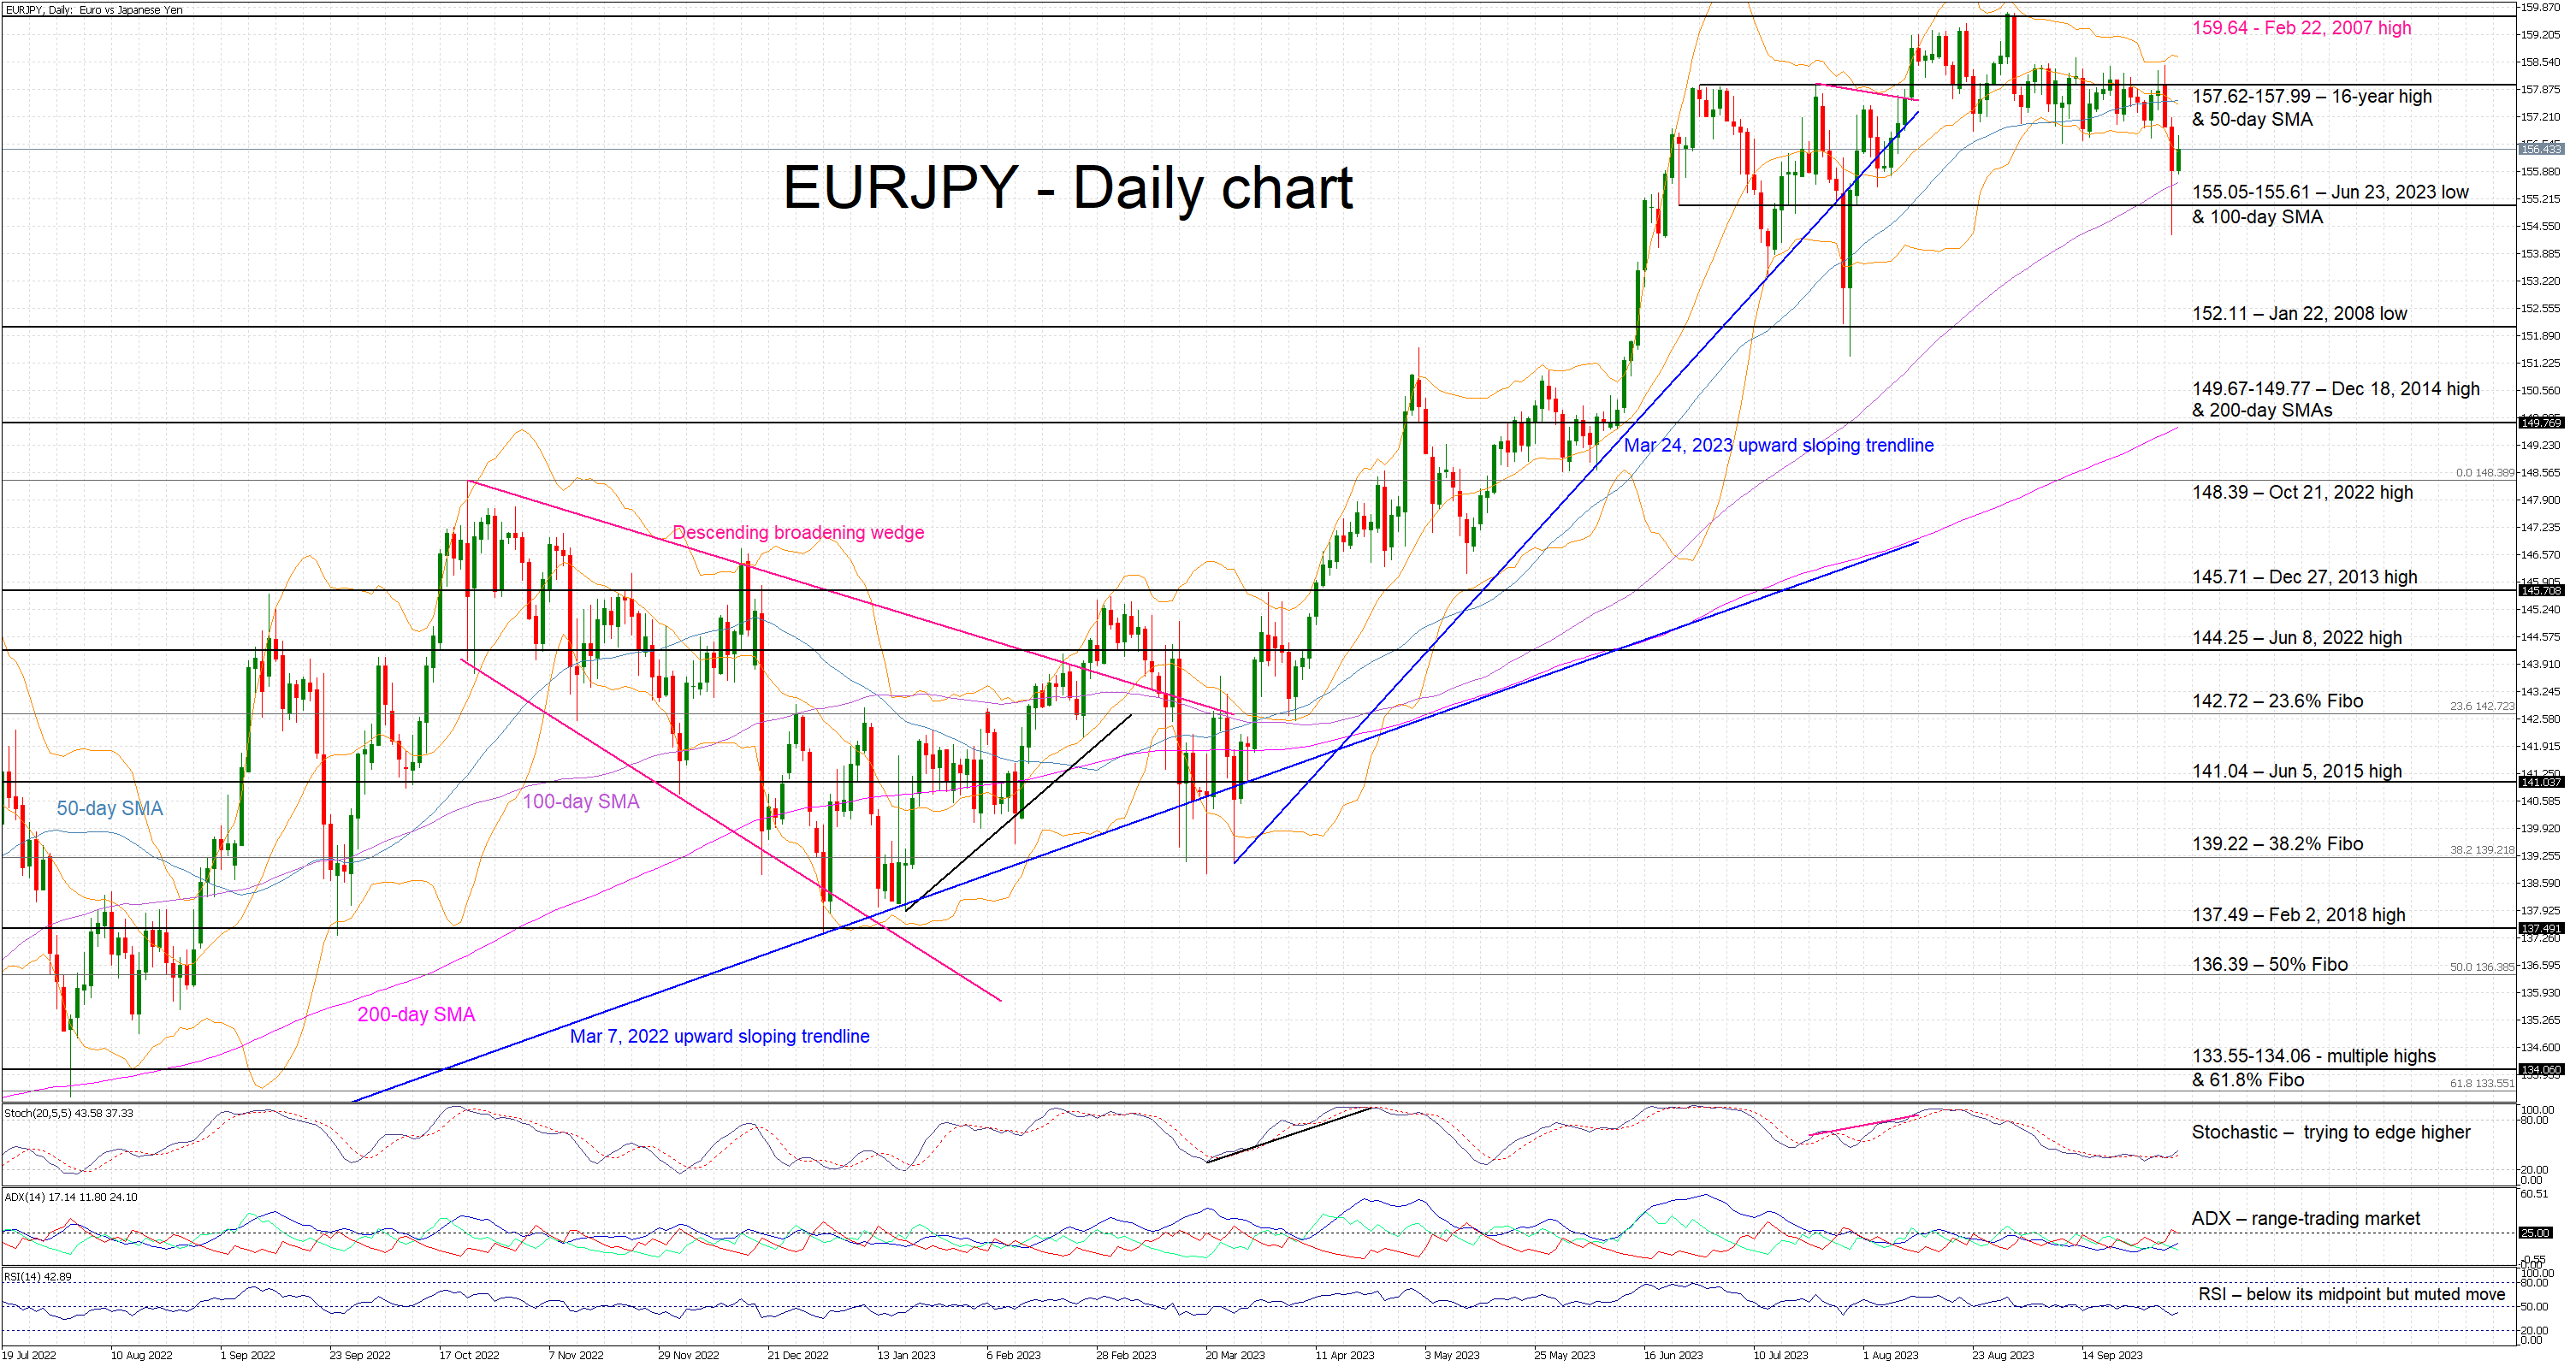
The yen has been on the back foot against most developed economies’ currencies. The focus is understandably on the US dollar/yen pair, which is trading a tad below the 150 perceived threshold, but euro/yen is exhibiting a similar tendency. It peaked at 159.75 on August 30, which is the strongest level since February 22, 2007. It is now hovering around the 155 region as the market is digesting Tuesday's rumoured intervention. A positive set of data could allow the bears to aim for a lower euro/yen print, but at the end of the day, the continued threat of market intervention by the Japanese authorities will mostly determine the market reaction function.
EURGBP Heads Lower; Support at 20-day SMA
- EURGBP extends its pullback from 4-month high
- Mildly bearish bias in the near term
- But plenty of support at 20-day SMA and uptrend line
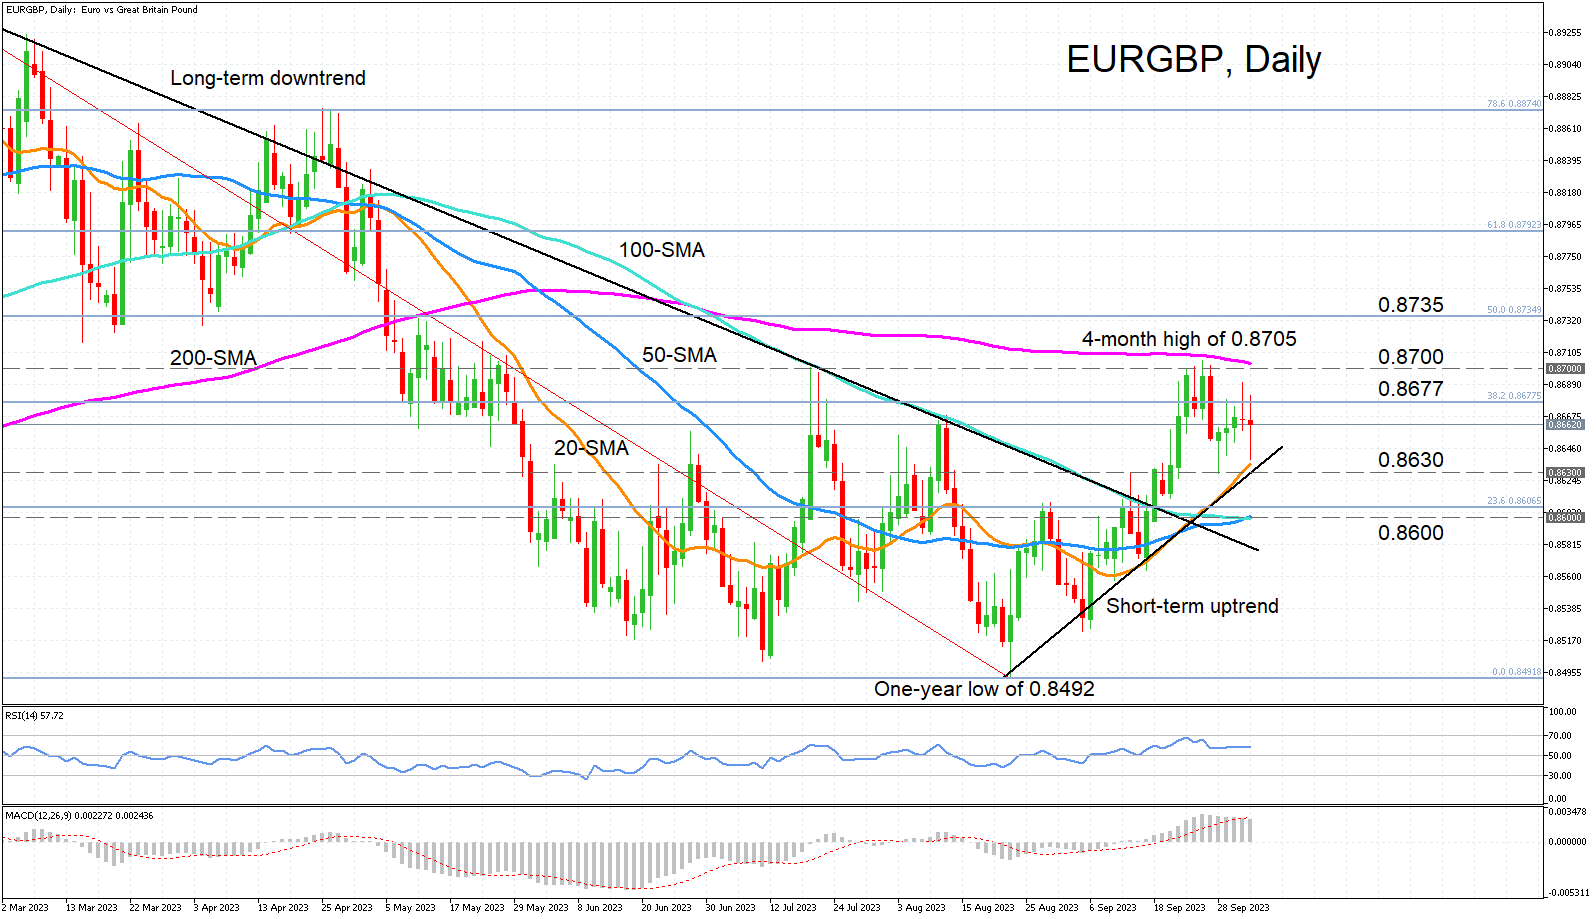
EURGBP has been gradually edging lower after scaling a four-month high in late September. The momentum indicators are mixed as the RSI has flatlined slightly above the 50-neutral level but the MACD just crossed below its red signal line.
If the bearish pressure intensifies, the pair could soon test the crucial support zone in the 0.8630 region encompassing the 20-day simple moving average (SMA) and the short-term ascending trendline. A break lower would bring into the spotlight another set of moving averages – the 100- and 200-day SMAs, which are converging around the 0.8600 level. Should prices breach this support too, there might be nothing stopping the plunge until the August low of 0.8492.
However, if EURGBP is able to bounce off the 20-day SMA, there’s likely to be some friction around the 38.2% Fibonacci retracement of the February-August downtrend at 0.8677. Overcoming this would open the way for the 200-day SMA slightly above the 0.8700 mark. Higher up, the 50% Fibonacci of 0.8735 is significant as a climb above it would strengthen the bulls, putting the uptrend on a more sustainable path.
In brief, the near-term picture could easily turn bullish again if EURGBP holds above its ascending trendline and can then successfully tackle the 200-day SMA. However, a slip below the trendline would shift the focus back to the downside.
CHFJPY Wave Analysis
- CHFJPY reversed from support level 160.00
- Likely to rise to resistance level 164.00
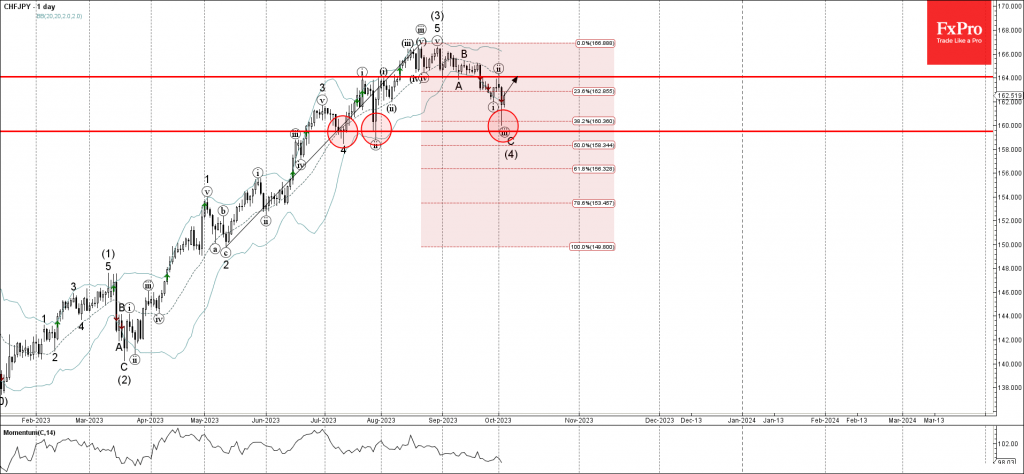
CHFJPY currency pair recently reversed up from the key support level 160.00 (which has been reversing the pair from July), lower daily Bollinger Band and 50% Fibonacci correction of the upward impulse from February.
The upward reversal from the support level 160.00 stopped the C-wave of the intermediate ABC correction (4) from the end of August.
Given the clear daily uptrend and the reversal of the yen sentiment, CHFJPY can be expected to rise further toward the next resistance level 164.00 (top of the previous wave ii).
Ethereum’s Organised Retreat
Market Picture
The crypto market lost ground throughout Tuesday but has been attempting to turn around since Wednesday morning. So far, it seems to be following the sentiment of the stock market, which is trying to recover from the previous day’s sell-off.
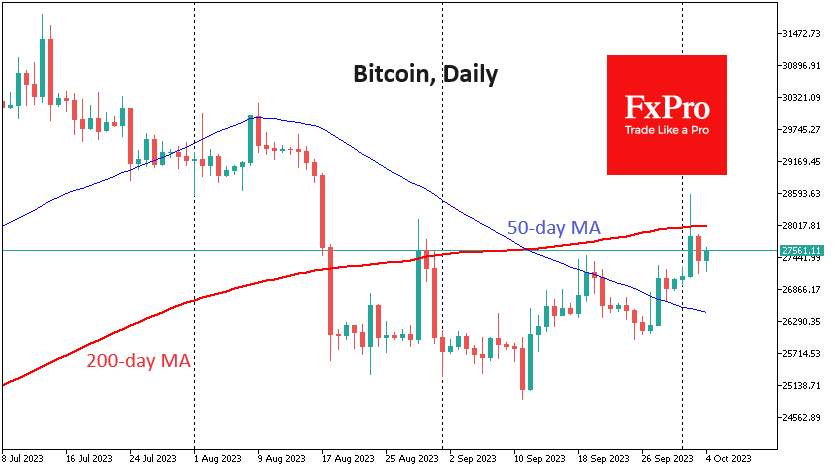
Despite Tuesday’s pressure, bitcoin has remained in an uptrend for the past week. But the bears aren’t giving up their red lines either, as BTCUSD remains below its 200-day moving average at $28,000. The ability to consolidate above it could trigger an intensification of buying. But for now, it’s best to stay on the sidelines.
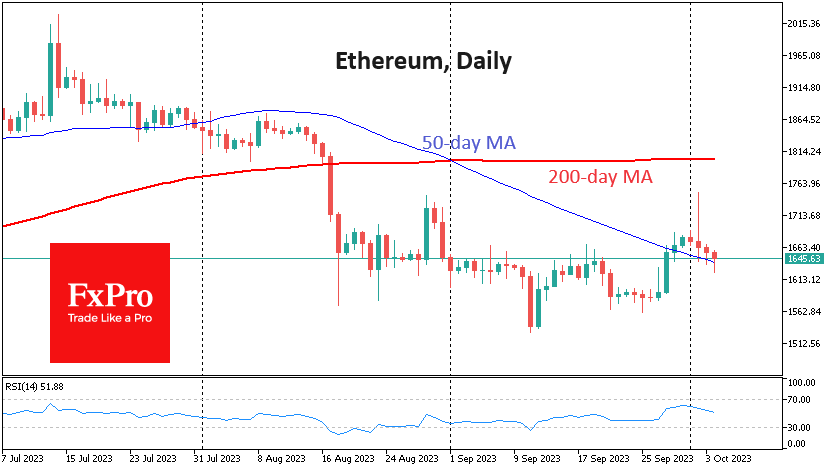
This is especially true as Ethereum is in a tight sell-off. It has lost almost evenly for the fourth consecutive session and only finds sustainable buying when it touches the 50-day average. However, it is pointing down, so the move looks like an organised retreat.
News Background
In another recalculation, bitcoin’s mining difficulty rose by a paltry 0.35% to a new high of 57.32T.
According to CryptoQuant, the number of bitcoins on exchanges has fallen to its lowest level since January 2018. 69% of bitcoins are held by hodlers who haven’t moved coins in over 12 months. Santiment estimates that shark and whale reserves increased by 41,500 BTC over the month.
Rostin Banham, US CFTC’s chief, said that the agency has become more likely to fine crypto companies, with $6bn in fines for fiscal year 2023.
California-based investor Nir Lahav filed a class action lawsuit against Binance and its CEO Changpeng Zhao, alleging unfair competition and intentional destruction of the FTX exchange. At issue are tweets published by Zhao in early November 2022. He decided to liquidate the company’s assets in FTX exchange tokens in one of them.
According to PeckShield, attackers have stolen $1.15 billion worth of cryptocurrency since the beginning of 2023. A third of this year’s losses occurred in September, when at least 22 hacks were recorded.