

Sample Category Title
Eurozone PMI composite finalized at 47.2, can’t jump on the hope train yet
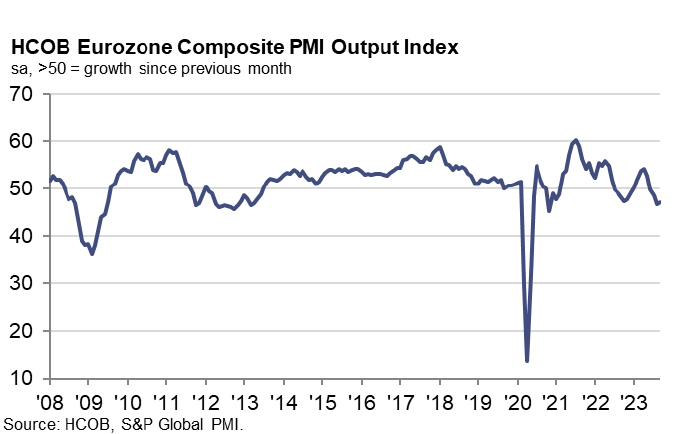
The latest Eurozone PMI Services data brings both a glimmer of optimism and a note of caution to an economic region. The finalized PMI Services for September stood at 48.7, marking an increment from August's 47.9. Composite index also saw a marginal uplift to 47.2 from the previous month's 46.7. While the numbers reflect an uptick, the fragility of the recovery becomes apparent when examining the country-specific data and underlying factors.
A look at the composite PMI output index reveals a contrasting scenario among the countries. Ireland tops the chart with a two-month low of 52.1, while France lags at a 34-month low of 44.1. Germany (46.4) and Italy (49.2), despite being on a multi-month high, are still not out of the woods, pointing towards a segmented recovery pattern.
Cyrus de la Rubia, Chief Economist at Hamburg Commercial Bank, offers a balanced perspective. "The HCOB Composite PMI for the Eurozone did rebound a bit. However, we can't jump on the hope train yet," he cautioned. The declining new business, especially in powerhouse economies like Germany and France, underscores this sentiment, indicating a continual decline in outstanding business and a drop in business expectations.
In the corridors of ECB, where deliberations over the next interest rate decision are underway, the latest PMI data could act as a double-edged sword. The hawks find solace in the Input Price Index, propelled by wages and energy costs, marking a four-month pinnacle. In contrast, the doves might highlight the moderated pace at which service prices are increasing – the slowest since the summer of 2021.
"Prices are nevertheless still climbing the ladder rather fast, a weird twist when the economy is singing the blues," de la Rubia noted.
EUR/USD Tumbles While USD/JPY Seems Unstoppable
EUR/USD remained in a bearish zone and declined below 1.0530. USD/JPY is again rising and might climb toward the 150.00 level.
Important Takeaways for EUR/USD and USD/JPY Analysis Today
- The Euro started a fresh decline below the 1.0530 support zone.
- There is a short-term bearish trend line forming with resistance near 1.0475 on the hourly chart of EUR/USD at FXOpen.
- USD/JPY climbed higher above the 148.00 and 148.75 levels.
- There was a rejection noticed near a bearish trend line at 150.15 on the hourly chart at FXOpen.
EUR/USD Technical Analysis
On the hourly chart of EUR/USD at FXOpen, the pair remained in a bearish zone below the 1.0650 level, as mentioned in the previous analysis. The Euro declined below the 1.0530 support zone against the US Dollar.
The pair even settled below the 1.0500 zone and the 50-hour simple moving average. A low is formed near 1.0448 and the pair is now consolidating losses. On the upside, the pair is now facing resistance near a short-term bearish trend line at 1.0475.
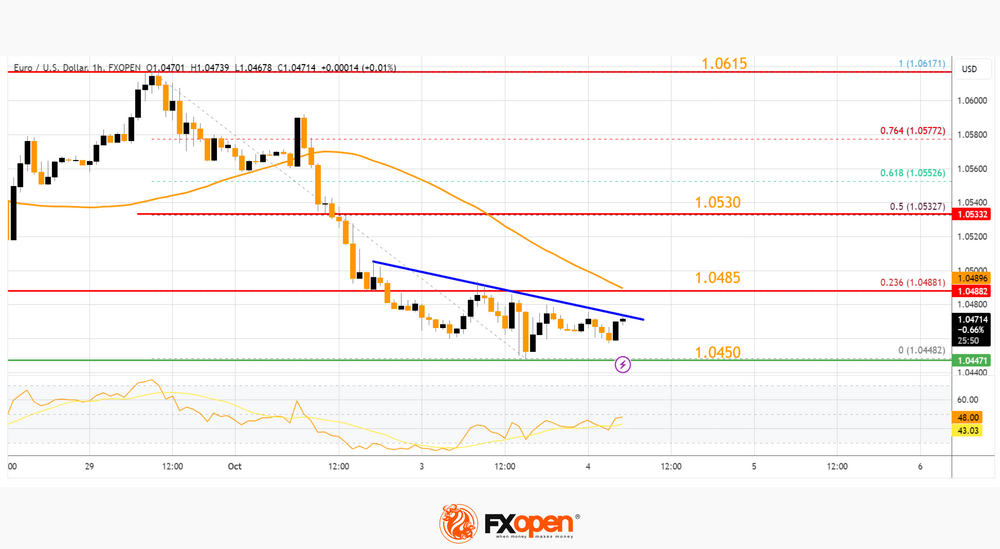
The next key resistance is near the 50-hour simple moving average and the 23.6% Fib retracement level of the recent decline from the 1.0617 swing high to the 1.0448 low at 1.0485.
A clear move above the 1.0485 level could send the pair toward the 1.0530 resistance. It is close to the 50% Fib retracement level of the recent decline from the 1.0617 swing high to the 1.0448 low. An upside break above 1.0530 could set the pace for another increase. In the stated case, the pair might rise toward 1.0615.
If not, the pair might resume its decline. The first major support on the EUR/USD chart is near 1.0450. The next key support is at 1.0420. If there is a downside break below 1.0420, the pair could drop toward 1.0380. The next support is near 1.0335, below which the pair could start a major decline.
USD/JPY Technical Analysis
On the hourly chart of USD/JPY at FXOpen, the pair started a decent increase from the 145.00 zone. The US Dollar gained bullish momentum above 148.00 against the Japanese Yen.
It settled above the 50-hour simple moving average and 148.75. However, the pair faced a rejection noticed near a bearish trend line at 150.15. There was a sharp decline below the 148.00 level. However, it turned out to be a false move and the price trimmed most losses.
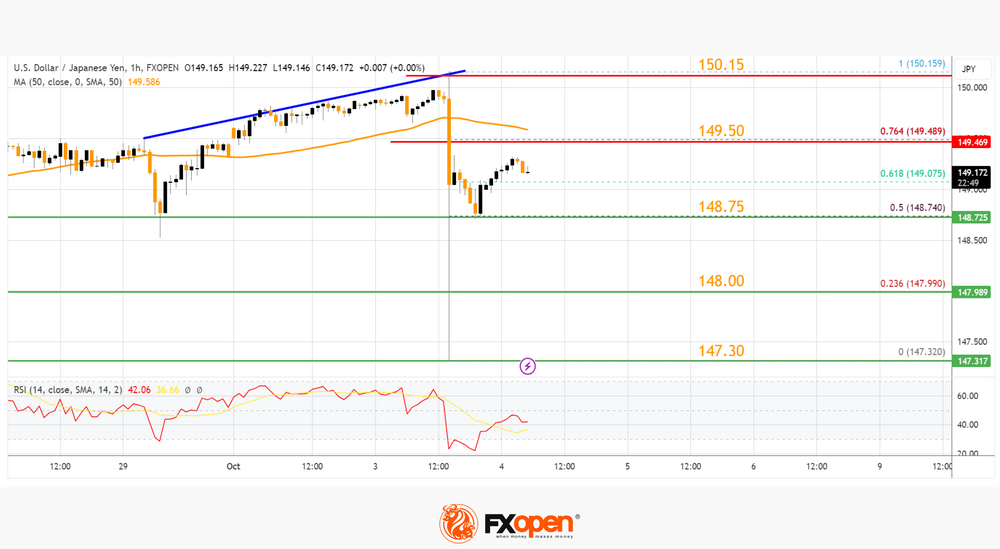
It is back above the 148.75 level and the 61.8% Fib retracement level of the downward move from the 150.15 swing high to the 147.32 low.
Immediate resistance on the USD/JPY chart is near the 50-hour simple moving average at 149.50. It is close to the 76.4% Fib retracement level of the downward move from the 150.15 swing high to the 147.32 low.
The first major resistance is near 150.15. If there is a close above the 150.15 level and the RSI moves above 50, the pair could rise toward 151.20. The next major resistance is near 152.00, above which the pair could test 153.50 in the coming days.
On the downside, the first major support is near 148.75. The next major support is 148.00. If there is a close below 148.00, the pair could decline steadily.
In the stated case, the pair might drop toward the 147.30 support zone. The next stop for the bears may perhaps be near the 145.50 region.
This article represents the opinion of the Companies operating under the FXOpen brand only. It is not to be construed as an offer, solicitation, or recommendation with respect to products and services provided by the Companies operating under the FXOpen brand, nor is it to be considered financial advice.
GBP/JPY Daily Outlook
Daily Pivots: (S1) 179.01; (P) 180.20; (R1) 181.19; More...
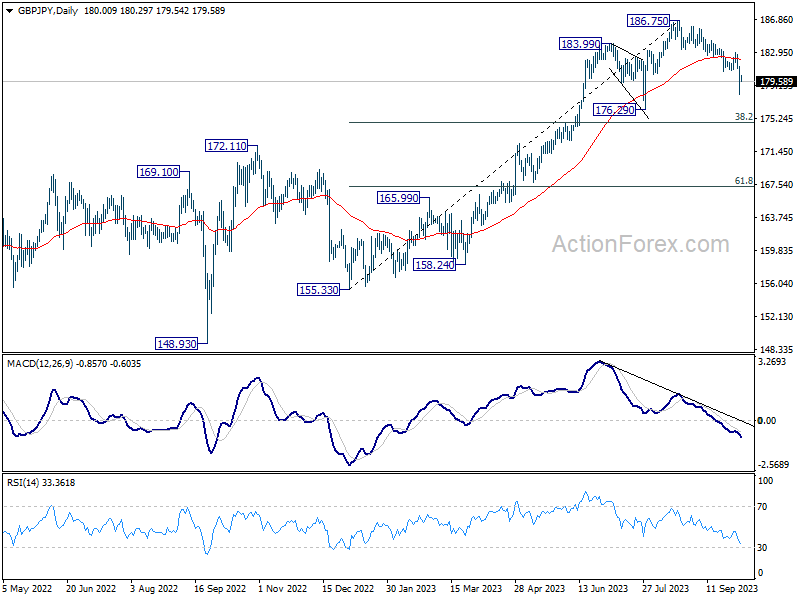
GBP/JPY's fall from 186.75 resumed by breaking through 180.78. Intraday bias is back on the downside for 176.29 support next. For now, risk will stay on the downside as long as 183.00 resistance holds, in case of recovery.
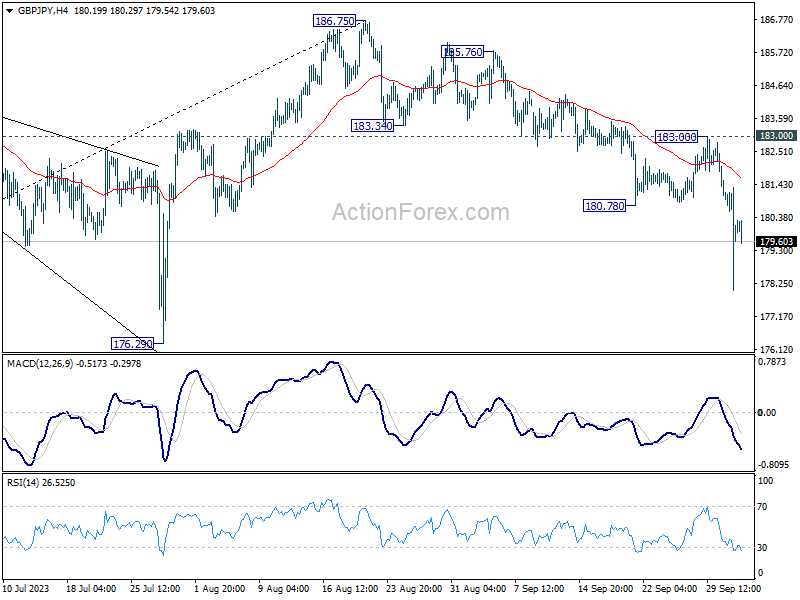
In the bigger picture, fall from 186.75 is currently seen as a corrective move only. As long as 176.29 support holds, larger up trend from 123.94 (202 low) should still be in progress. Break of 186.75 will target 195.86 (2015 high). Nevertheless, firm break of 176.29 will confirm medium term topping, and bring lengthier and deeper consolidations.
EUR/JPY Daily Outlook
Daily Pivots: (S1) 155.09; (P) 156.16; (R1) 157.05; More....
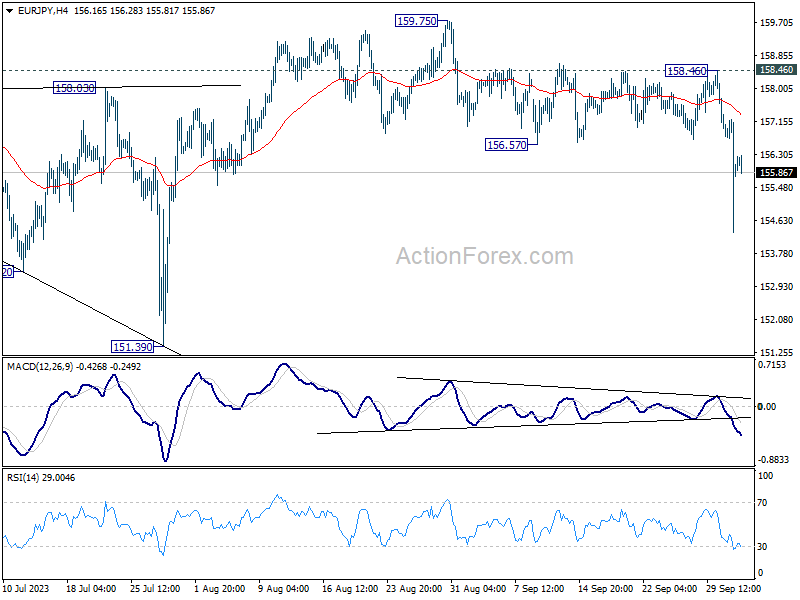
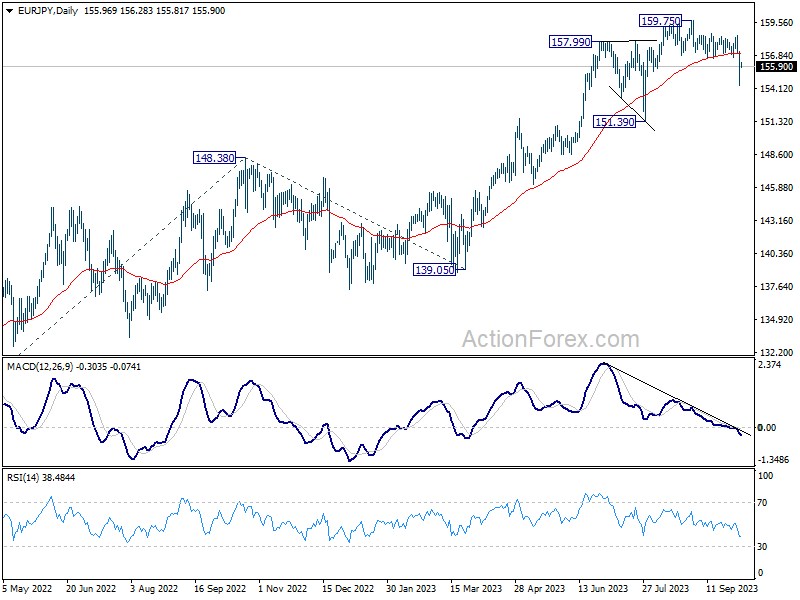
EUR/JPY's fall from 159.75 resumed by breaking through 156.57 and intraday bias is back on the downside. This decline is seen as a larger scale correction. Deeper fall would be seen to 151.39 support. For now, risk will stay on the downside as long as 158.46 resistance holds, in case of recovery.
In the bigger picture, as long as 151.39 support holds, rise from 114.42 (2020 low) is still expected to continue. Next target is 100% projection of 124.37 to 148.38 from 139.05 at 163.06. Sustained break there will pave the way to retest long term resistance at 169.96.
EUR/GBP Daily Outlook
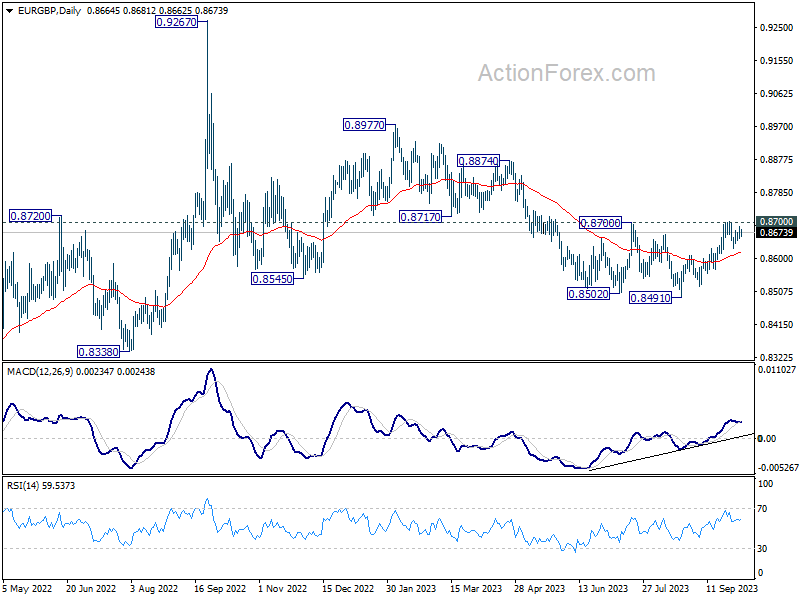
Daily Pivots: (S1) 0.8654; (P) 0.8672; (R1) 0.8686; More....
Range trading continues in EUR/GBP and intraday bias remains neutral. On the upside, decisive break of 0.8700 resistance will carry larger bullish implication and bring stronger rally to 0.8874 resistance next. Nevertheless, rejection by this resistance will maintain bearish outlook that larger down trend is not over. Firm break of 0.8629 resistance turned support will turn bias back to the downside for 0.8568 support first.
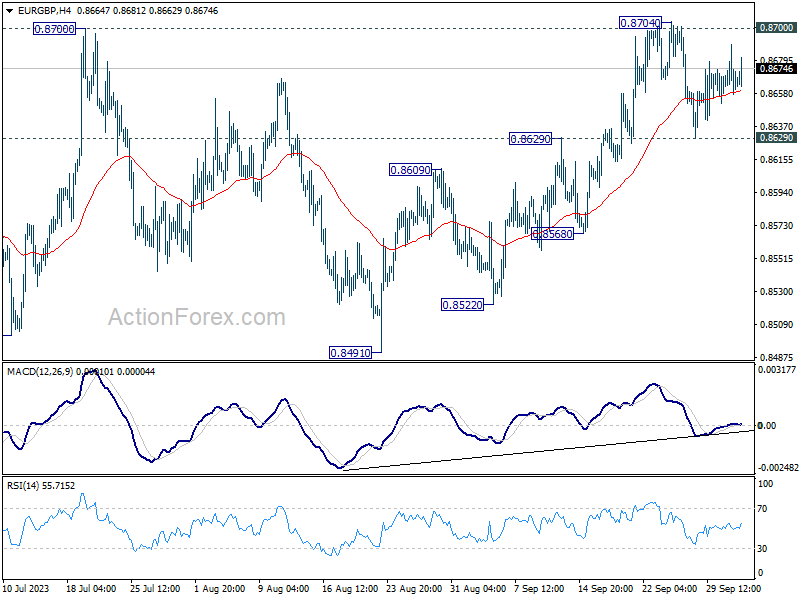
In the bigger picture, the down trend from 0.9267 (2022 high) is seen as part of the long term range pattern from 0.9499 (2020 high). Decisive break of 0.8700 resistance will argue that this decline has completed with three waves down to 0.8491. Rise from 0.8491 could then be another leg inside the pattern and targets 0.8977 and above. However, rejection by 0.8700 will keep the down trend alive for another fall through 0.8491 at a later stage.
EUR/AUD Daily Outlook
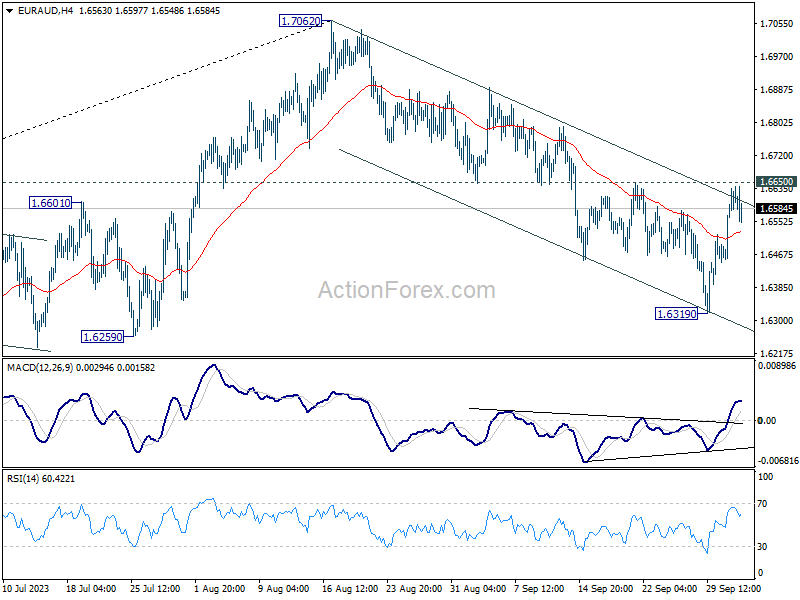
Daily Pivots: (S1) 1.6483; (P) 1.6564; (R1) 1.6688; More...
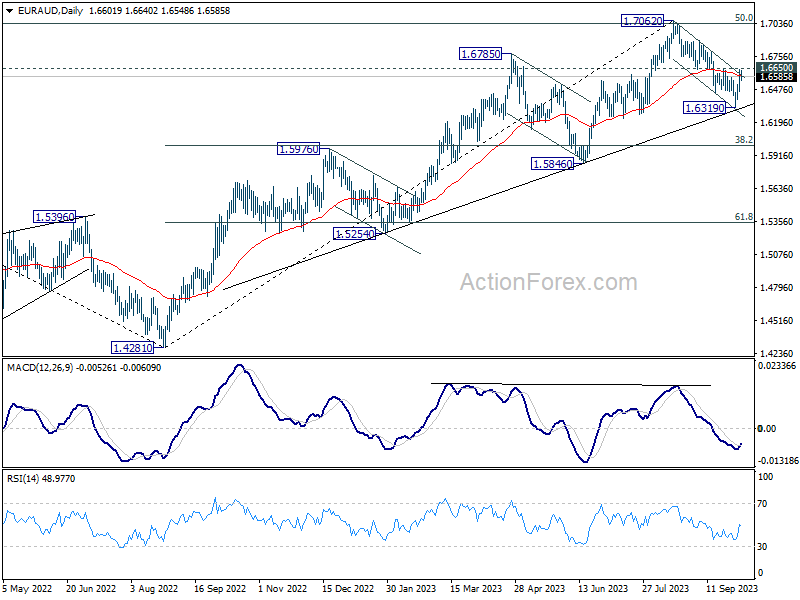
Intraday bias in EUR/AUD remains neutral first. On the upside, firm break of 1.6650 resistance will argue that pull back from 1.7062 has completed, after drawing support from medium term rising trend line. Further rally would be seen back to retest 1.7062. Nevertheless, break of 1.6319 will resume the fall to 1.6000 fibonacci level.
In the bigger picture, fall from 1.7062 is probably correcting whole up trend from 1.4281 (2022 low). Deeper decline would be seen to 38.2% retracement of 1.4281 to 1.7062 at 1.6000. Strong support could be seen there to bring rebound, at least on first attempt. This will remain the favored case as long as 1.6650 resistance holds.
EUR/CHF Daily Outlook
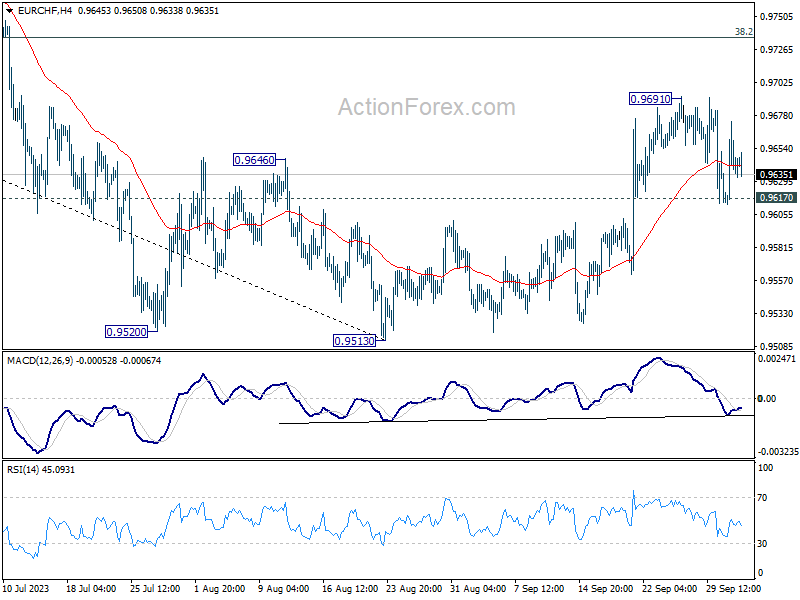
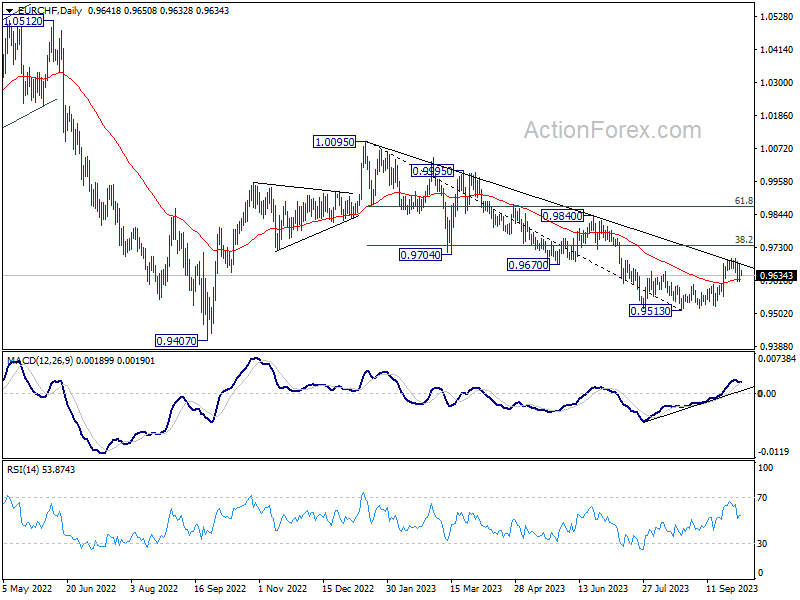
Daily Pivots: (S1) 0.9611; (P) 0.9644; (R1) 0.9672; More...
Intraday bias in EUR/CHF remains neutral and outlook is unchanged. Further rally is expected as long as 0.9617 support holds. Above 0.9691 will resume the rebound from 0.9513 to 38.2% retracement of 1.0095 to 0.9513 at 0.9735. However, firm break of 0.9617 will turn bias back to the downside for retesting 0.9513 low.
In the bigger picture, medium term outlook will stay bearish as long as the cross is capped well below falling 55 W EMA (now at 0.9804). That is, down trend from 1.2004 (2018 high) could still resume through 0.9407 (2022 low). However, sustained trading above the 55 W EMA will raise the chance that 0.9470 is already a long term bottom. Further rise would then be seen to 1.0095 resistance to indicate bullish trend reversal.
As US Yields Surge, How High Can They Go?
- Skyrocketing bond yields put markets in a spin
- Fed’s higher for longer calls grow louder
- US 10-year yield approaches 4.8% at 16-year high
- Can they reach 5.0% and how soon before something breaks?
Yields heeding the higher for longer message
Yields on government bonds are flying again as central banks are all singing from the same hymn sheet lately, flagging that interest rates will stay high for a longer period of time. This isn’t exactly a new revelation for investors but more recently, the message has started to sink in deeper as the combination of persistent price pressures and resilient economies has taken everyone by surprise.
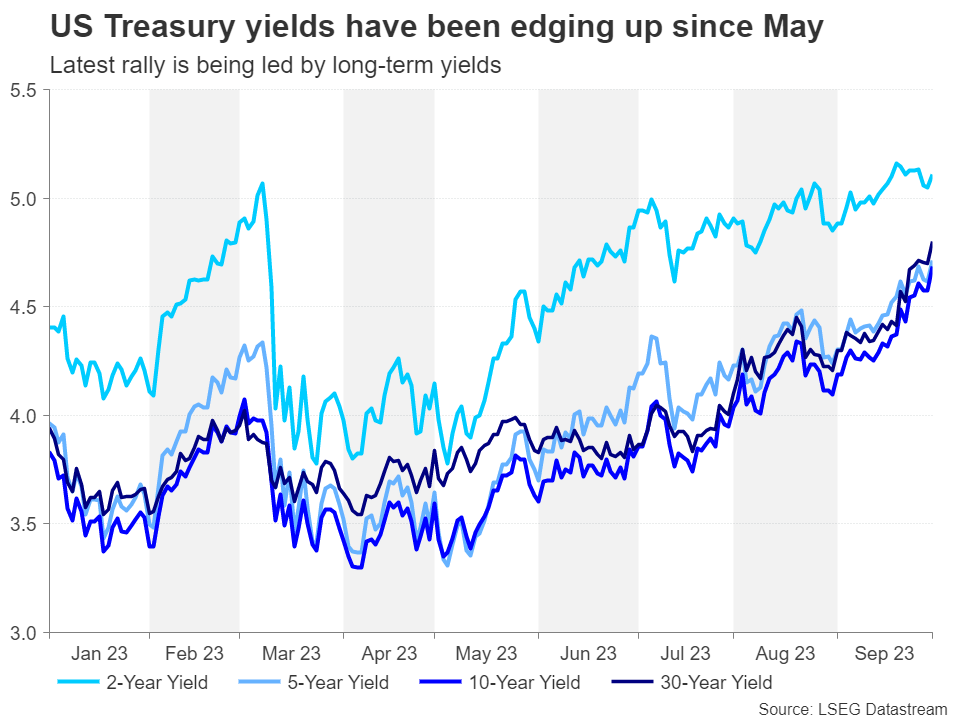
With rates potentially yet to peak in the United States and elsewhere, government bond yields have been rallying since May when the US banking turmoil began to dissipate. However, this latest leg of the rally isn’t so much driven by expectations of where interest rates will peak but more about how long they will stay at elevated levels.
There may be more tightening to come
The Federal Reserve and even the European Central Bank may yet have to tighten further, but it’s unlikely this would involve anything more than a 25-basis-point hike. What’s gotten markets so jittery is the prospect of rates staying near current levels for an extended duration. That is why long-dated government bonds have borne the brunt of the latest selloff, pushing 10-year yields to more-than-decade highs.
The last time the 10-year Treasury yield was above 4.8% was at the onset of the global financial crisis in the summer of 2007. Not long after that, rock-bottom rates became the norm. This highlights just how markedly the inflation picture has altered since the pandemic, with the supply and energy shocks irreversibly lifting prices.
Job not done yet on inflation
However, falling inflation has been the big story of 2023 – so why are the Fed and other central banks still thinking about hiking further? The problem is that despite good progress, inflation in most places has some distance to cover before reaching the 2% target. In the US, the core PCE measure of inflation stood at 3.9% in August – almost double the Fed’s objective.
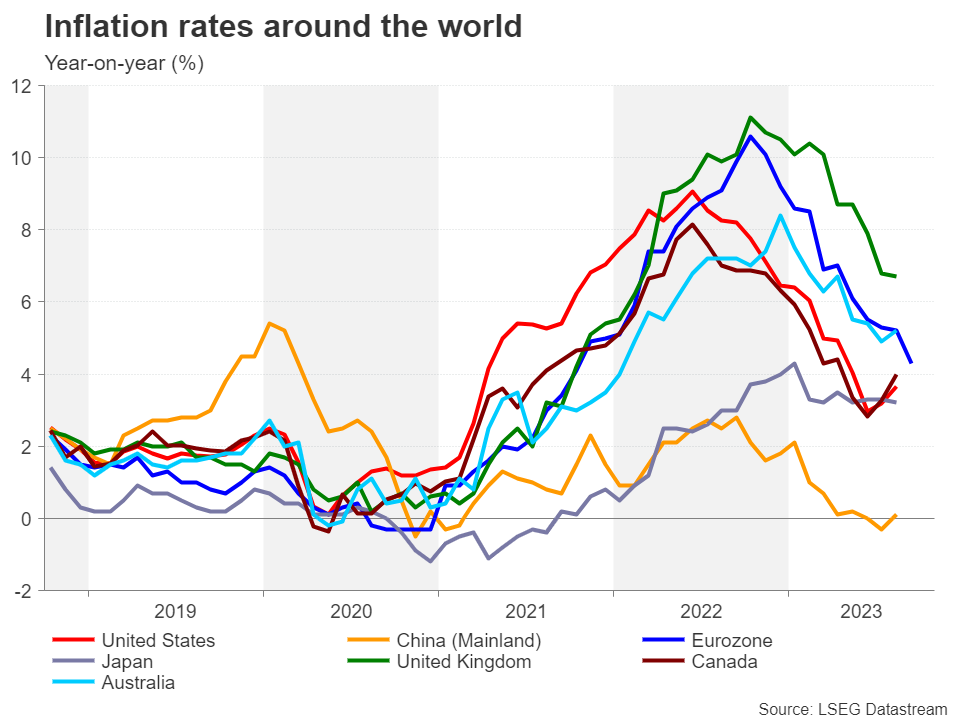
Inflation may have come down sharply over the past year as the energy crisis subsided, but the next phase may take a lot longer. There are several factors that could prevent inflation from dropping all the way down to 2% in a quick manner and they vary in each country. In America, it is the tight labour market and robust consumer spending.
The elusive soft landing
The Fed is in a tricky spot at the moment when it comes to correctly gauging how restrictive policy has become. It risks tightening more than it has to should it act solely on the actual data, or doing too little should its caution on the basis that there are transmission lags in monetary policy prove to be a miscalculation. With various measures of inflation expectations converging slightly above 2% and hiring slowing down lately, the Fed seems to be taking its chances with the latter option.
But this is not the entire explanation. The Fed is desperate to engineer a soft landing for the economy, which comes at a price as it would necessitate taking a more patient approach to hitting the 2% target in a sustainable manner. Policymakers are thus effectively making a conscious decision to let inflation run above target for longer so as not to choke off economic growth.
What this means for monetary policy, however, is that whilst rates would peak somewhat lower, they’re less likely to be cut sooner. For the US where the economy continues to display remarkable resilience, this is even more significant as any cut would risk fuelling renewed inflationary pressures.
Is the only way up for yields?
The recent gains in Treasury yields may be a reflection of this realisation by investors. The question now is, can yields rise further, and if so, at what point will higher yields inflict some serious damage on the economy?
For the moment, neither consumption nor the labour market are showing any major signs of cracks. Should this still be the case by December, the Fed may well end the year with another rate increase. Not only that, but the Fed might also lift its projected rate path again, spurring another rally in long-term yields.
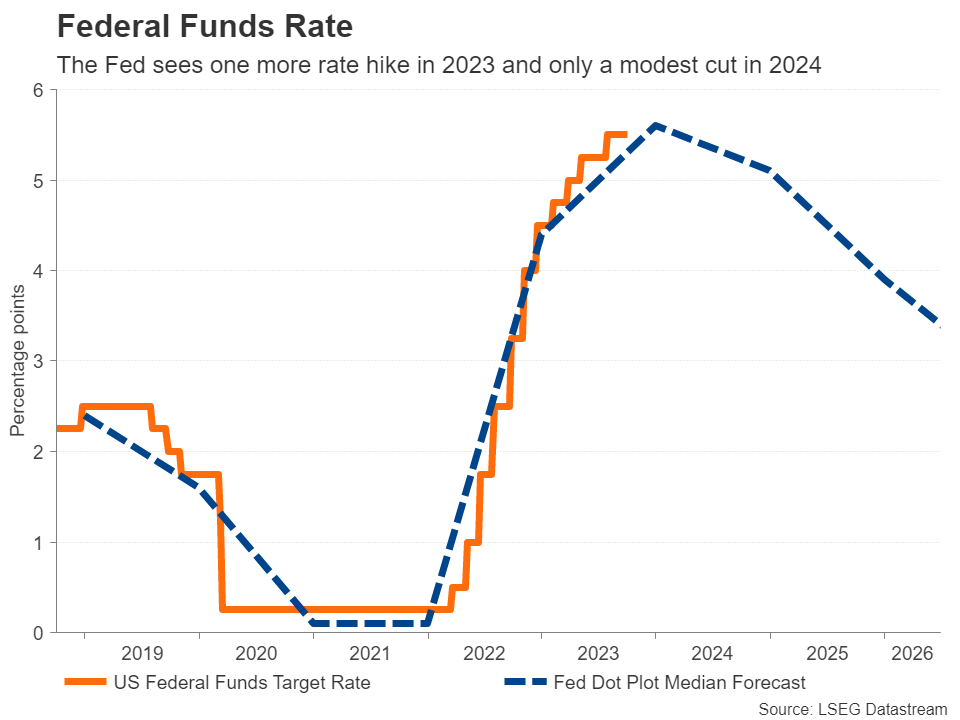
Assuming that the outlook in Europe and elsewhere doesn’t improve, the US dollar would be in a position to appreciate further, while there could be more pain in store for US equities. So far though, the upside surprises in the economic data, the artificial intelligence (AI) mania as well as the defensive nature of many tech stocks have all contributed to driving Wall Street indices higher even as financial conditions have tightened.
Small cracks are appearing in the economy
But it’s hard to see this picture lasting once the 10-year yield nears the 5.0% level. Looking under the hood, there are several signs of trouble brewing. The manufacturing sector is contracting, and banks are lending less, hitting struggling businesses and new investment. Households have almost drawn down on their excess savings and this coincides with an increase in the number of households unable to pay their credit card debts. In addition, Americans will soon have to start repaying their student loans as the pandemic support expires.
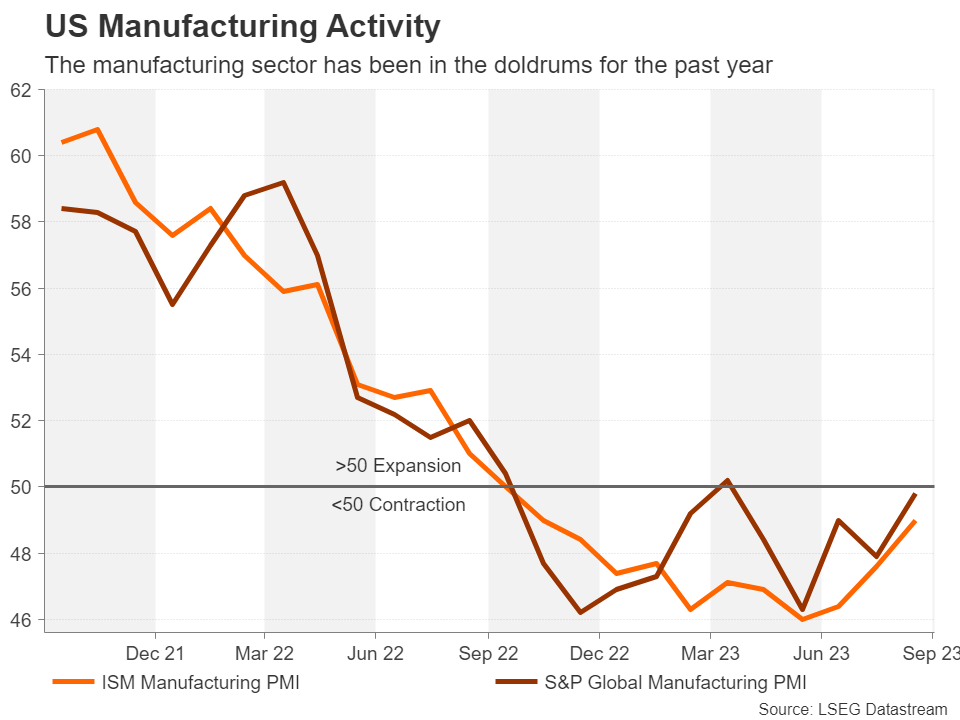
Resurgent oil prices are another worry as they threaten to push up costs again just as the pain was easing. Not to forget the slowdown in Europe and China that’s bound to affect the earnings for US multinationals, all this could yet kill any momentum in the economy, if not tip it into recession.
Is a recession only delayed, not cancelled?
For now, the expectation of a soft landing is maintaining the upward pressure on yields, while the deluge of new debt issuance by the Treasury Department is worsening the rout in the bond market. Unless there’s a sharp deterioration in the outlook, it is difficult to envisage bond yields retreating substantially in the near future.
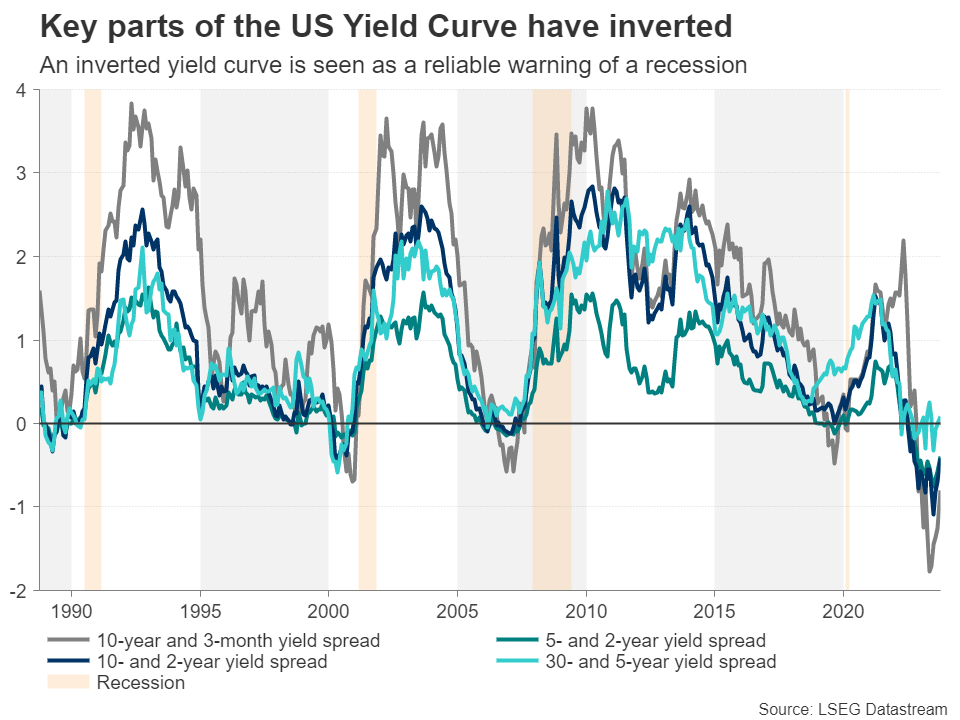
The danger is that the risk of a recession may not be as low as policymakers and investors would like to believe. The inverted yield curve continues to flash red even though the gap between long- and short-term yields has narrowed over the last few months. The other cause of concern is that in the past, calls for a soft landing have often tended to precede recessions and what may be happening now is simply the timing of one being pushed further and further back.
Yields vs stocks
Adding to the confusion is the broken negative relationship between Treasury yields and the stock market. When yields reach a cycle peak, stocks traditionally enter a bear market. However, during the post-pandemic recovery, the S&P 500 and the 10-year yield rallied in tandem.
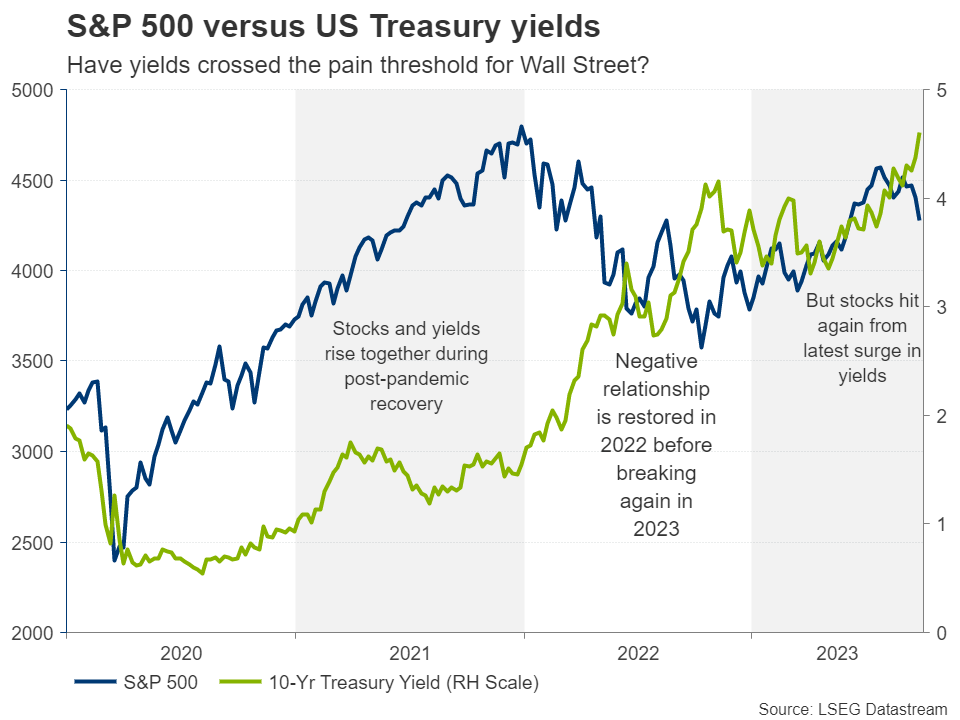
The negative relationship corrected itself last year when Wall Street declined and yields kept rising, but it broke again in the first half of 2023. Since September, however, yields and stocks have gone their opposite ways once more, in a possible sign that yields may have already reached the pain threshold for Wall Street. Does this hold true for the economy as well?
Could USDJPY Change Course after the Rumoured Intervention?
- USDJPY is edging higher today after yesterday’s tumultuous session
- It continues to hover inside a wide ascending trend channel
- Stochastic oscillator could be close to giving a bearish signal
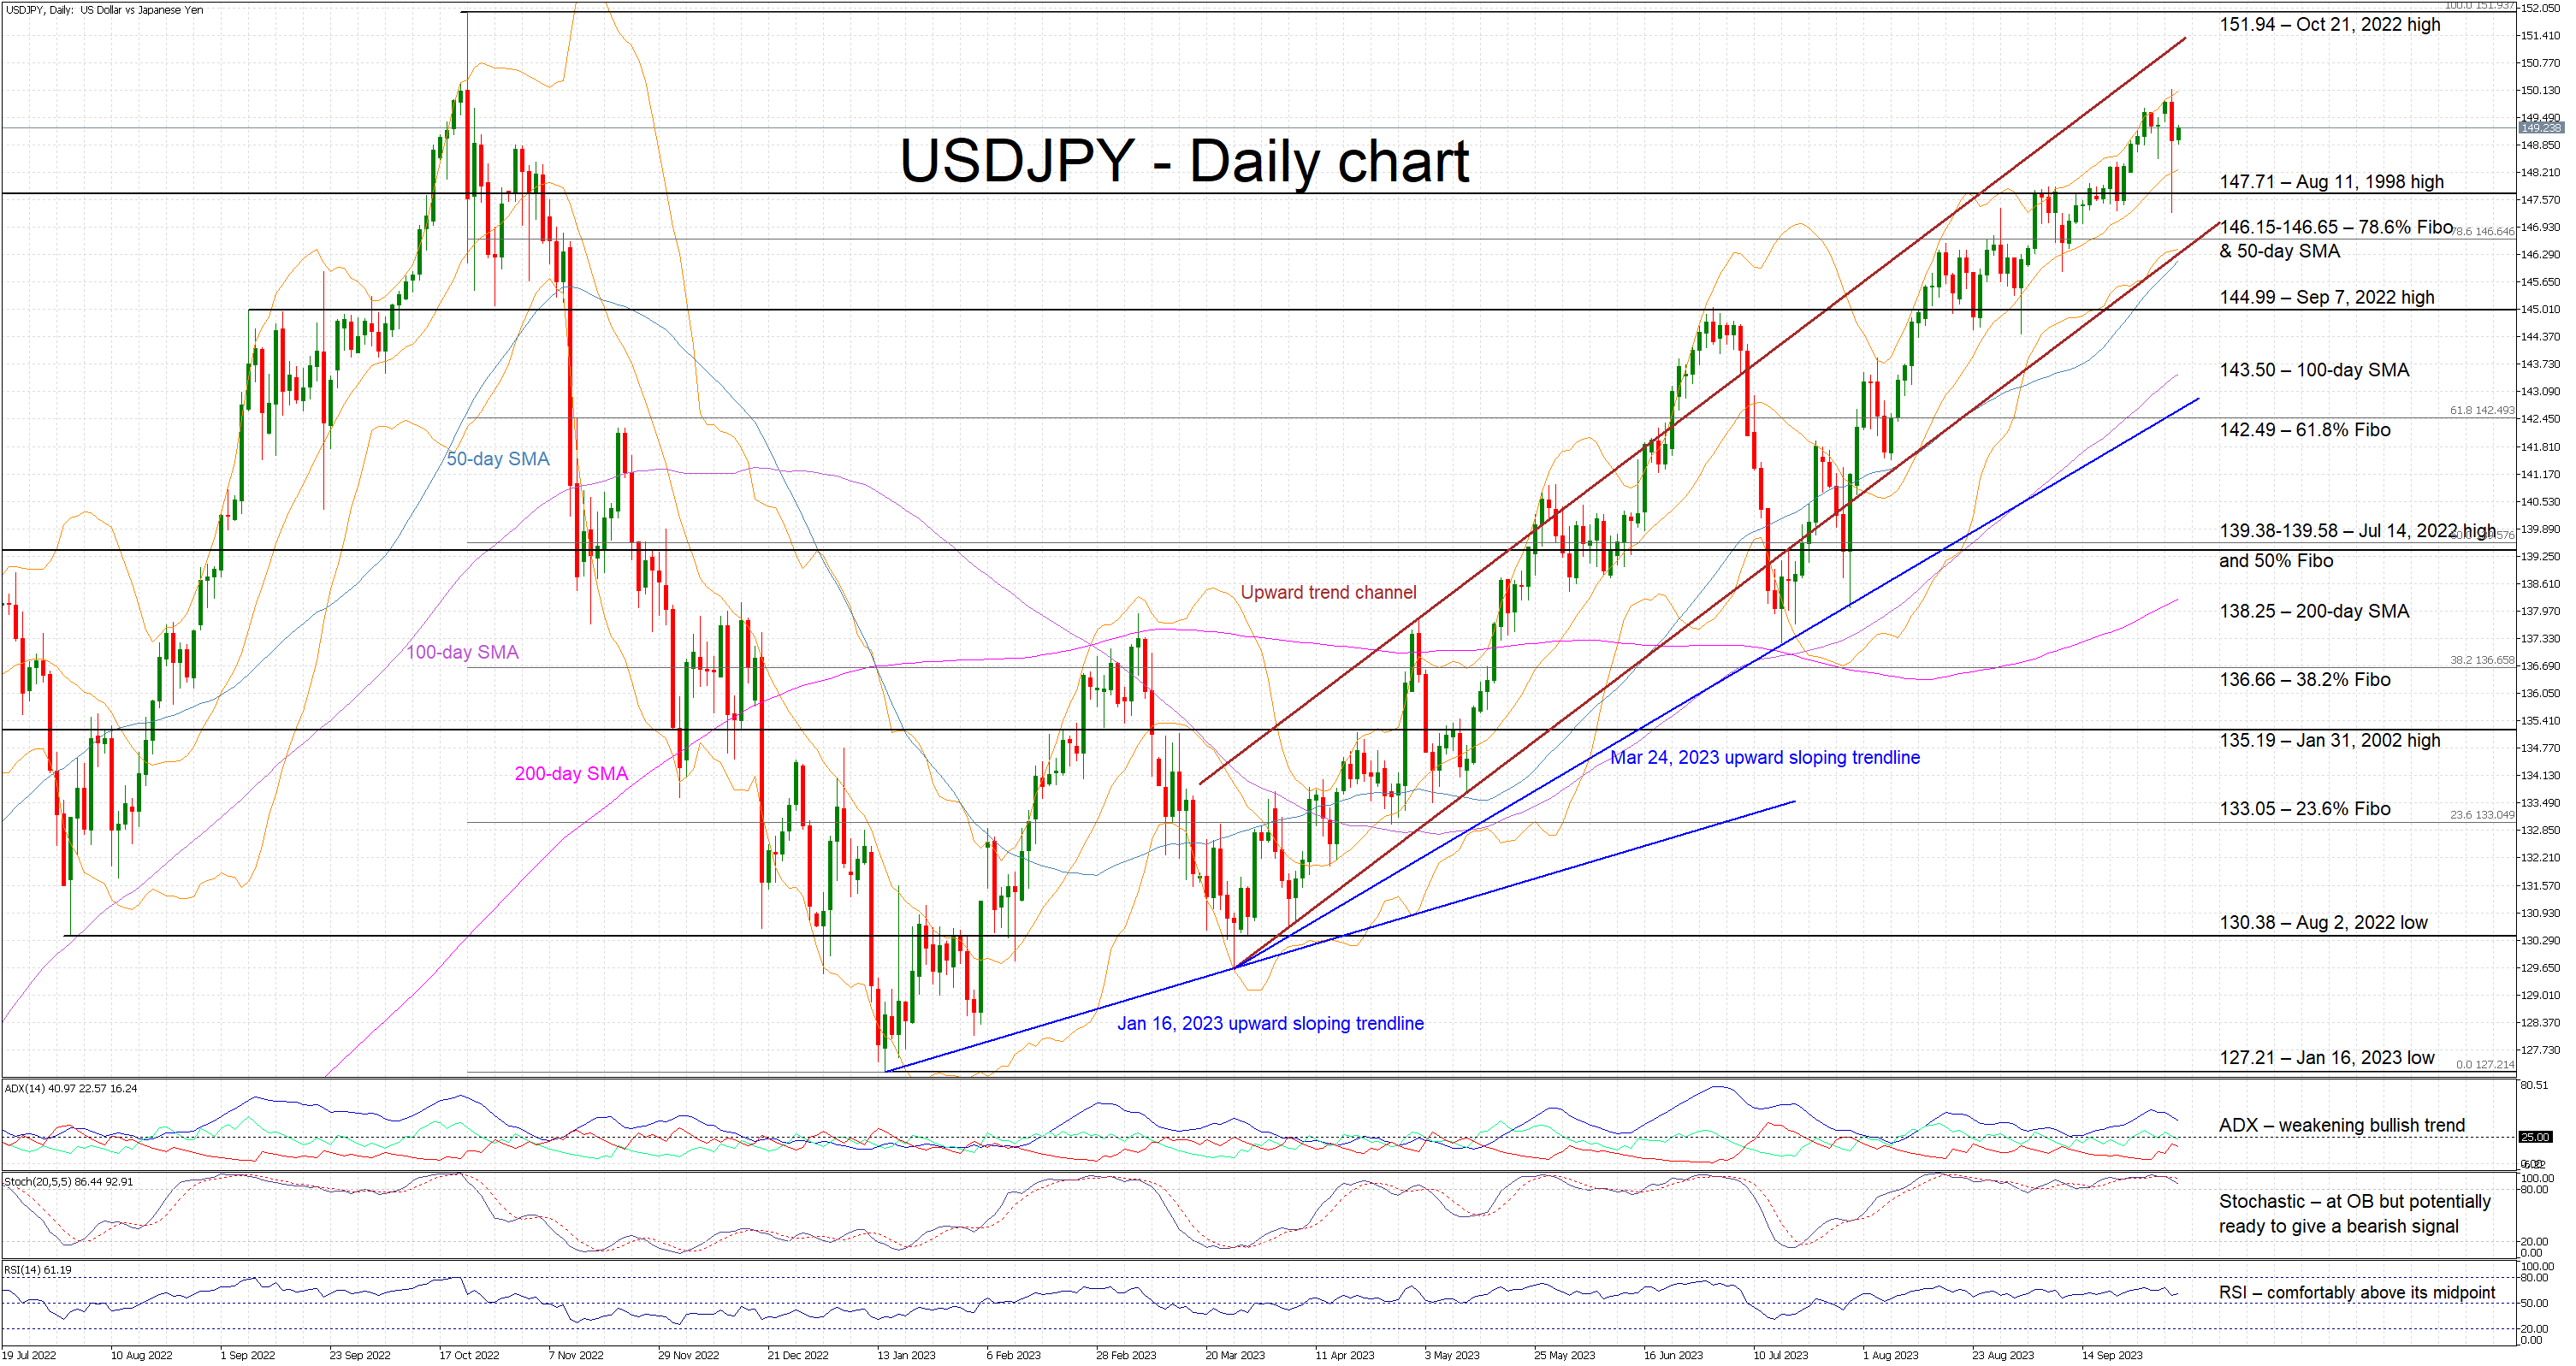
USDJPY is in the green today as market participants are trying to find their foot following yesterday’s alleged intervention from the Japanese authorities. The pair continues to trade at extremely elevated levels and remains comfortably inside an upward trend channel.
However, the picture portrayed by the momentum indicators is not so clear cut. The Average Directional Movement Index (ADX) is edging lower but continues to show a weakening bullish trend. Similarly, the RSI remains comfortably above its 50-midpoint, spending 2.5 months in bullish territory. However, the stochastic oscillator is currently at a precarious position. It has broken below its moving average and looks ready to edge below its overbought region. Should this take place, it would be seen as a strong bearish signal.
Should the bears feel energized to stage a pullback, they would try to push USDJPY below the August 11, 1998 high at 147.71. Lower, the busy 146.15-146.65 area, defined by the 78.6% Fibonacci retracement of October 21, 2023 - January 16, 2023 downtrend at 146.65, the 50-day simple moving average (SMA) and the lower boundary of the upward trend channel, could prove a very strong support area.
On the flip side, the bulls are trying to digest the alleged intervention. Should they remain committed to recording new highs, they could try to overcome yesterday's high at 150.15 and then potentially set a course for the October 21, 2022 high at 151.94.
To sum up, USDJPY bulls are still in control of the market, but they could be walking on thin ice as a JPY intervention threat remains at large.
Japanese Officials Won’t be Able to Fight Strong USD Without Backing by BoJ U-Turn
Markets
The US manufacturing ISM on Monday and US JOLTS job openings (9.61mn from 8.8mn vs stabilization expected) yesterday. Eco data provided the bearish bond trend with some additional ammo, delaying in time any US recession bets and keeping the Fed’s preferred soft landing scenario alive. US money markets for the first time attach a 50/50 probability that the US central bank will effectively deliver on its “promised” (via dot plot) final rate hike this year. The sell-off nevertheless centered again at the longer end of the curve. US yields added 4.7 bps (2-yr) to 13.5 bps (30-yr) in a daily perspective. Since the Fed delivered the 5%+ message until end 2024 at the September 20 policy meeting, the US 10-yr yield and 30-yr yield increased by 44 bps and 50 bps respectively driven by higher real rates. Both are obviously at cycle and multiyear highs respectively at 4.85% and 4.97%. The US 10-yr real rate (2.43%) overtook inflation expectations (2.40%) for the first time since 2009. Other (global) core bonds followed US Treasuries south with the Fed’s course serving as a template for the rest. German yield changes varied between -1.7 bps (2-yr) and +7.6 bps (30-yr). The German 10-yr yield closed at a cycle high 2.97% and is about to pass beyond 3% for the first time since June 2011. The German 30-yr yield closed at 3.21%. The trade-weighted dollar closed off the intraday highs yesterday following a suspicious move in USD/JPY. The pair was fighting the psychologic 150 threshold which is seen as line in the sand for Japanese officials. As the pair tried to make its way beyond 150 following JOLTS data, it was countered by strong JPY inflows, pulling the FX rate temporary to USD/JPY 147.50. Currently, we’re back around 149.25, adding strength to our case that Japanese officials won’t be able to fight a strong USD without backing by a BoJ policy U-turn. Stock markets were wacked again with key European indices losing over 1% and Wall Street losses ranging between -1.3% (Dow) and -1.9% (Nasdaq). Technical pictures become more and more dire, with the trading pattern shifting to sell-on-upticks. We don’t fight ruling trends today even though the eco calendar might cause some additional 2-way volatility with ADP employment change and the services ISM scheduled in the US. The key European focus is on ECB President Lagarde’s speech at a monetary policy conference in Frankfurt with often overlooked Q2 Italian deficit data serving as a wildcard. As the Italian spread over Germany (10y) is on the verge of passing 200 bps for the first time since end of last year.
News & Views
The Reserve Bank of New Zealand this morning kept its policy rate unchanged at 5.50%. The Monetary Policy Committee assessed that interest rates are constraining economic activity and reducing inflationary pressure as required. Even as GDP growth in the June quarter was stronger than expected (0.9% Q/Q 1.8% Y/Y), the RBNZ expects demand in the economy to continue to slow. Weakening global demand is putting downward pressure on New Zealand export volumes and prices. Global import prices (ex oil) are seen easing. While the imbalance between supply and demand is moderating, the RBNZ indicates that a prolonged period of subdued activity remains required to reduce inflation, supporting the case to keep policy restrictive. At the same time, the RBNZ in the press release didn’t given a clear hint on further tightening. The central bank sees a near-term risk that activity and inflation do not slow as much as needed. Over the medium term, a greater slowdown in global demand, particularly in China, could weigh more on commodity prices and New Zealand exports. Markets expected a more hawkish tone. The 2-y government bond yields eased 3 bps after the decision (5.79%). The kiwi dollar dropped to NZD/USD 0.59.
Kevin McCarthy, the Republican Speaker of the US House of Representatives, was removed from his function as the House in a 216-210 vote approved a ‘motion to vacate’. Eight Republicans joined the 208 democrats in the vote. The vote came after opposition within the Republican party led by Matt Geatz, after McCarthy last week needed the support from democratic representatives to approve a bill avoiding a partial government shutdown. The House now needs to look for a new speaker, but there remains a high degree of dissent within the Republican party. The current situation de facto brings legislative action to a halt. A new agreement to fund the US government is needed by mid-November to again prevent a government shut-down. Also other key topics including US aid to Ukraine might be blocked in the process.