Sample Category Title
Market Mayhem: Escalating Risk Aversion Meets Yen Intervention
Dollar is finding strength amidst an atmosphere of palpable anxiety in the financial markets, stemming from a continuation of the risk-off mood from US into Asian session. This prevailing anxiety in the markets has been heightened by the pronounced drop in US stocks overnight, coupled with a surge in long-end treasury yields. Adding to the complexity, there's been a quick normalization in the yield curve accompanied by a notable spike in the VIX fear index. As investors brace themselves, the focus now pivots towards the forthcoming US ADP employment and ISM Services data. However, the market is caught in a conundrum, trying to decipher if positive data will quell or exacerbate the prevailing anxiety.
At the same time, Yen has made significant strides, an strong bounce that could be attributed to Japan's unconfirmed intervention in the currency markets. However, this edge was short-lived, with USD/JPY experiencing a swift rebound. Current behavior suggests that speculators might have been gearing up to capitalize on Yen sales, rather than aligning with Japan's presumed objective of buying the currency. With the financial climate teetering on unease and impending significant data releases like Friday's US NFP, we can expect substantial fluctuations in USD/JPY in the immediate future.
Following RBNZ's decision to keep interest rates steady, New Zealand Dollar is currently languishing near the bottom of the currency chart. Aussie, too, is underperforming, particularly after RBA's parallel decision yesterday. For the time being, European majors display a mixed performance, though the Swiss Franc is exhibiting a slight advantage. Yet, when considering their performances against each other, Euro, Sterling, and Swiss Franc are trading within their usual bounds.
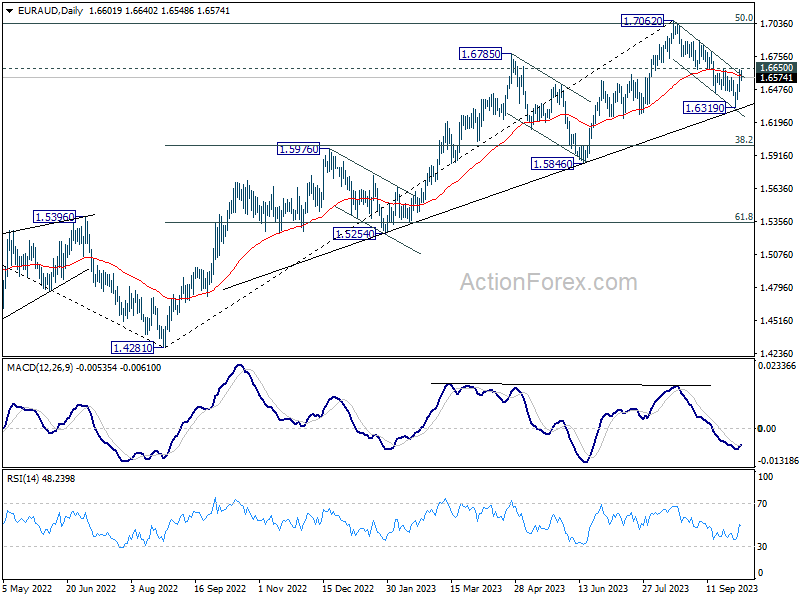
Technically, EUR/AUD is now pressing 1.6650 resistance after this week's bounce. Firm break there will argue that correction from 1.7062 has completed after drawing support from medium term rising trend line. Stronger rally would be seen back to retest 1.7062 high next. If realized, that would be a signal of more broad based selloff in Aussie, as probably intensification of risk aversion too.
In Asia, at the time of writing, Nikkei is down -1.87%. Hong Kong HSI is down -0.99%. Singapore Strait Times is down -1.50%. Japan 10-year JGB yield is up 0.033 at 0.797, just shy of 0.8 handle. Overnight, DOW dropped -1.29%. S&P 500 dropped -1.37%. NASDAQ dropped -1.87%. 10-year yield rose 0.119 to 4.802.
Japan's top brass remains mum on intervention claims
Market watchers were in a frenzy after Japanese Yen surged from 150 to the 147 zone against Dollar overnight , fuelling speculation that Japan's government may have stealthily intervened to push up the struggling currency. While evidence of a Yen-buying, Dollar-selling maneuver abounds, top officials in Japan remained tight-lipped today.
Finance Minister Shunichi Suzuki, when confronted by reporters, chose the path of silence over confirmation. He held back from validating the swirl of speculations about intervention. Suzuki reiterated a standard narrative, emphasizing the desirability of market-driven, stable currency movements that mirror economic fundamentals.
"Currency rates ought to move stably driven by markets, reflecting fundamentals. Sharp moves are undesirable," Suzuki noted. "The government is monitoring market developments very carefully with a sense of urgency. We will take appropriate steps against excessive volatility without excluding any options."
Masato Kanda, the top currency diplomat, provided insights into the government's assessment mechanism for currency movements. "If currencies move too much on a single day or, say, a week, that's judged as excess volatility," Kanda explained.
The implied volatility stands as a critical metric, among others, shaping the official perspective on whether Yen's moves are reaching alarming amplitudes.
Kanda further outlined that even in the absence of abrupt shifts, a gradual yet one-sided build-up of significant currency movements over time is also classified as excessive volatility. However, he too refrained from offering a direct commentary on the overnight upswing of Yen.
RBNZ holds rates, hints at longer duration of restrictive policy
RBNZ has opted to keep the Official Cash Rate stable at 5.50%, aligning with broad market anticipations. The minutes of the meeting revealed a consensus among committee members that restrictive interest rate environment might be needed "for a more sustained period of time".
In the short term, RBNZ is looking at a scenario where domestic demand could exhibit "greater resilience", spurred by migration. This situation could "slow the pace of expected disinflation". A related concern is wage inflation, which could take a longer time to ease than initially expected. Recent rise in oil prices could also risk "headline inflation being higher than expected".
Looking at the medium term, the minuted noted concerns about greater slowdown in global growth. Such a downturn could lead to further reductions in non-oil import prices. Moreover, weakened global demand, with a particular emphasis on China, could exert additional pressure on commodity prices, subsequently affecting New Zealand's export revenues.
Anxiety grips Wall Street: DOW plummets, VIX jumps, Yields soar
Economic storm clouds appear to be gathering on the horizon. With DOW experiencing its most significant drop since March and key Treasury yields touching multi-year highs, whispers of a potential recession are becoming more audible. This is further exacerbated by the behavior of VIX, often dubbed the "fear index", which indicates heightened market apprehensions.
DOW plummeted by -430.97 points, or -1.29%, nudging it into negative territory for the year, now lagging by -0.4%. This downturn wasn't isolated to stocks. The 10-year yield reached a staggering 4.8%, a pinnacle not seen in 16 years. Similarly, 30-year yield hit a peak of 4.925%, levels of which we haven't seen since 2007.
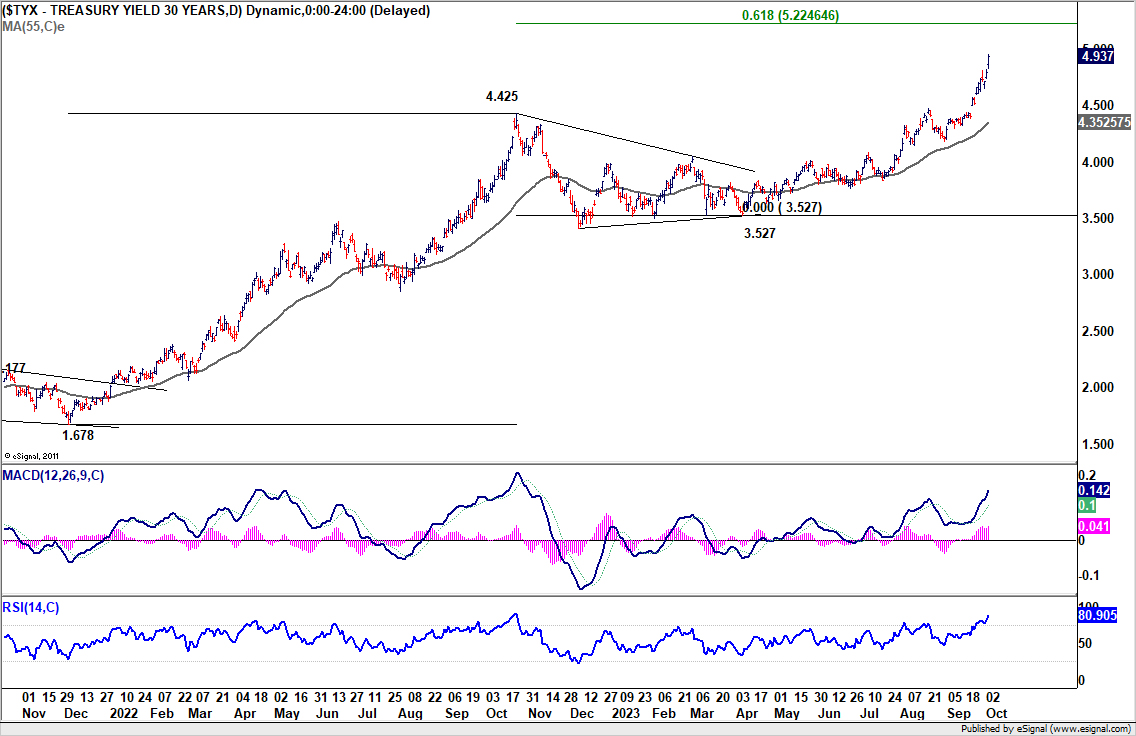
The narrowing gap between the 2-year and 10-year Treasury yields, contracting to a mere 35 basis points from over 100 basis points a few months earlier, is especially concerning. This normalization, or "de-inverting", of a vital part of the yield curve is often viewed as a precursor to economic downturns, igniting debates on the imminence of a recession.
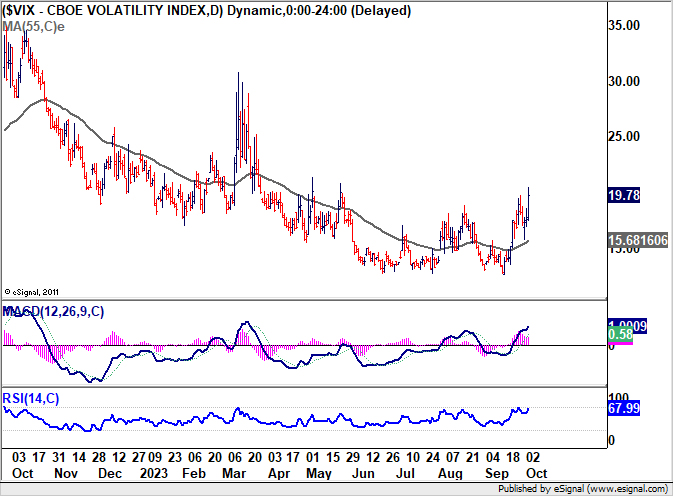
Adding to the market's jitters, VIX has climbed for three consecutive sessions, momentarily crossing the critical 20 level and finishing at a six-month high. Values below 20 on the VIX generally signify market stability, but as it surpasses this threshold, it denotes an environment fraught with investor unease and skittishness.
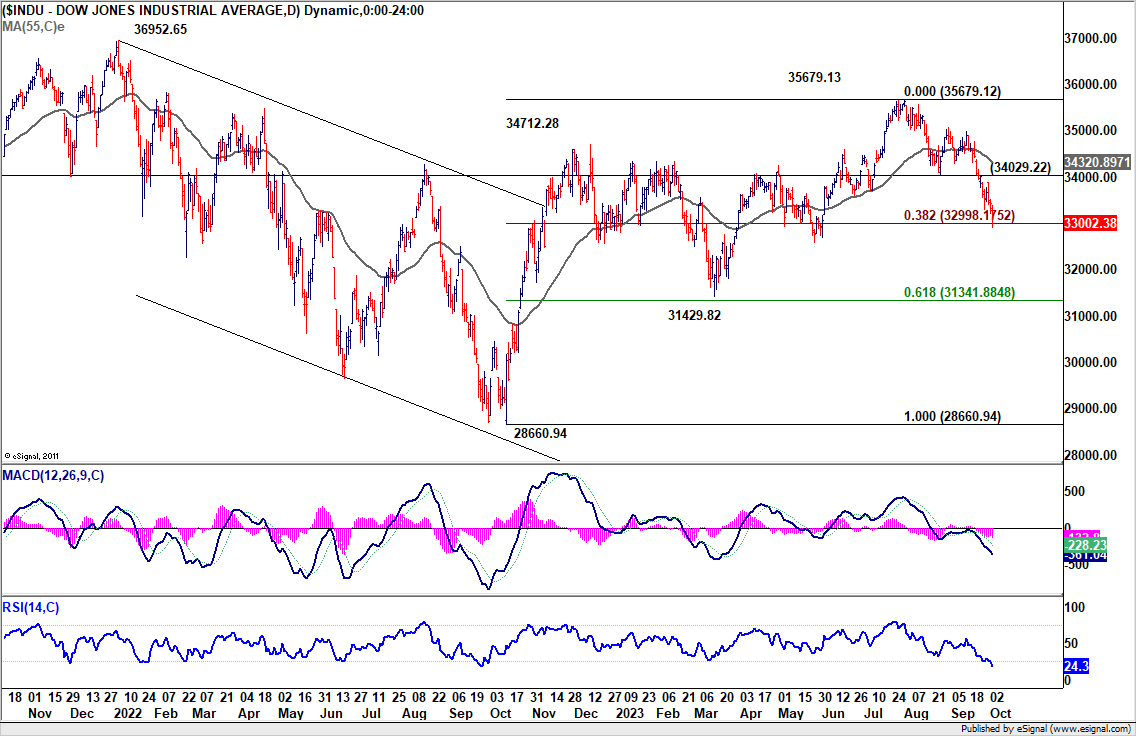
Back to DOW, it's now pressing and important near fibonacci support at 38.2% retracement of 28660.94 to 35679.13 at 32998.17. Sustained break of this level will strengthen the case that fall from 35679.13 is reversing whole rise from 28660.94. This decline could be viewed as the third leg of the long term pattern from 36952.65 high. Deeper fall would be seen to 31.429.82 support, which is close to 61.8% retracement at 31341.88.
In any case, near term outlook will stay bearish as long as 34029.22 support turned resistance holds. The rest of the week, with ISM services today and non-farm payrolls release on Friday, will be crucial.
Looking ahead
Eurozone PMI services final, PPI and retail sales will be released in European session. UK will also release PMI services final. Later in the day, US ADP employment ISM services and factory orderes will take center stage.
USD/JPY Daily Outlook
Daily Pivots: (S1) 148.21; (P) 149.18; (R1) 150.03; More...
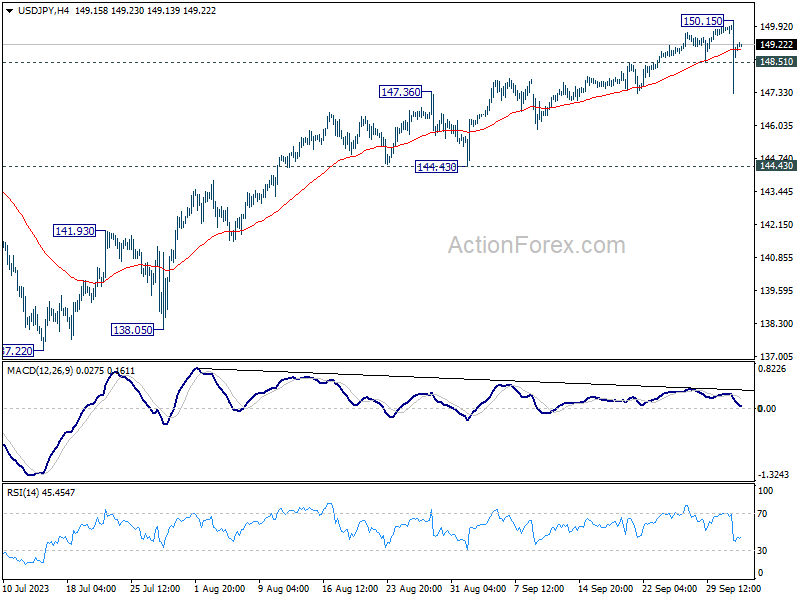
USD/JPY spiked lower to 147.28 overnight, on alleged intervention by Japan, but recovered quickly since then. As short term top should be in place at 150.15, on bearish divergence condition in 4H MACD. Intraday bias is turned neutral first and more corrective could be seen. But there is no confirmation of bearish trend reversal before firm break of 144.43 support. Another rally remains mildly in favor through 150.15 to retest 151.93 high.
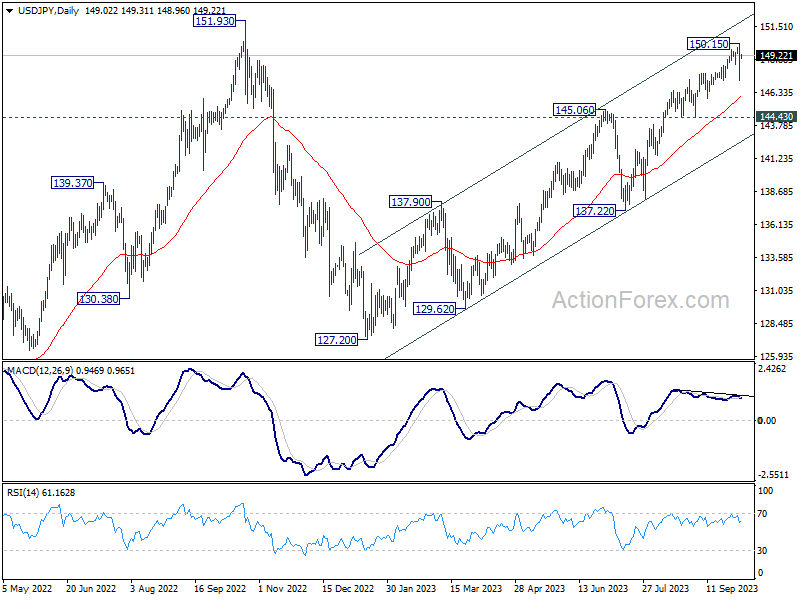
In the bigger picture, while rise from 127.20 is strong, it could still be seen as the second leg of the corrective pattern from 151.93 (2022 high). Rejection by 151.93, followed by sustained break of 145.06 resistance turned support will be the first sign that the third leg of the pattern has started. However, sustained break of 151.93 will confirm resumption of long term up trend.
Economic Indicators Update
| GMT | Ccy | Events | Actual | Forecast | Previous | Revised |
|---|---|---|---|---|---|---|
| 01:00 | NZD | RBNZ Interest Rate Decision | 5.50% | 5.50% | 5.50% | |
| 07:45 | EUR | Italy Services PMI Sep | 50 | 49.8 | ||
| 07:50 | EUR | France Services PMI Sep F | 43.9 | 43.9 | ||
| 07:55 | EUR | Germany PMI Sep F | 49.8 | 49.8 | ||
| 08:00 | EUR | Eurozone Services PMI Sep F | 48.4 | 48.4 | ||
| 08:30 | GBP | Services PMI Sep F | 47.2 | 47.2 | ||
| 09:00 | EUR | Eurozone PPI M/M Aug | 0.60% | -0.50% | ||
| 09:00 | EUR | Eurozone PPI Y/Y Aug | -11.60% | -7.60% | ||
| 09:00 | EUR | Eurozone Retail Sales M/M Aug | -0.50% | -0.20% | ||
| 12:15 | USD | ADP Employment Change Sep | 155K | 177K | ||
| 13:45 | USD | Services PMI Sep F | 50.2 | 50.2 | ||
| 14:00 | USD | ISM Services PMI Sep | 53.6 | 54.5 | ||
| 14:00 | USD | Factory Orders M/M Aug | 0.20% | -2.10% | ||
| 14:30 | USD | Crude Oil Inventories | -0.1M | -2.2M |
NZ First Impressions: RBNZ Monetary Policy Review
The RBNZ left the OCR unchanged at 5.5% as expected. The tone of the accompanying statement is somewhat more dovish than expected.
- The RBNZ left the OCR unchanged at 5.5% as expected.
- The tone of the accompanying statement is somewhat more dovish than expected.
- The RBNZ assessment of the balance of risks looks unchanged from the August Statement
- We think this means that the RBNZ is less likely to raise the OCR by 25 basis points at the November Monetary Policy Statement than we forecast.
- Key factors that will determine the probability and size of a November tightening will be the outcome of the Q3 CPI due 17 October and the Q3 Labour market reports due 1 November.
The RBNZ left the OCR unchanged at 5.5% and communicated a relatively dovish statement on the future OCR in the accompanying statement.
The overall tone of the statement and record of meeting displayed a similar degree of concern regarding the persistence of inflation pressures than previously communicated. Market pricing for around a 60% chance of a 25-bps tightening at the November Monetary Policy Statement looks too hawkish and is now adjusting.
The MPC’s seems to still be concerned about the possibility of persistent inflation pressures and that the economy might not weaken as fast as required in the short term. The MPC noted that GDP was stronger than they expected in the first half of 2023. However, the RBNZ retains confidence that the required amount of slowdown will ultimately occur in light of recent indicators such as the QSBO and PMI indicators. Notably, concerns around increased house prices are not as prominent as in our own assessment with the MPC wanting to see how house prices evolve in the summer period when more activity usually occurs. The MPC seems to also take comfort from the increase in mortgage rates that has occurred since August as global long-term rates have increased, helping add disinflationary pressure.
Medium term growth and inflation pressures are seen as being held in check by the continued slowing of the global economy and China in particular given that commodity prices continue to be lower than last year.
We see this statement as more dovish than our expectations. We anticipated the RBNZ would craft a statement that broadly endorsed current market pricing for around a 50/50 chance of a 25 bp rate rise in November. This statement suggests that view was too hawkish. By not communicating any further concern on the inflation outlook means the hurdle for a November tightening remains high.
While we continue to see a 25 bp rate hike in November at this stage, but this must be a lower probability than previously thought. The Q3 CPI and Labour market data will be key to the probability/size of that rate increase as also will global economic and financial markets developments.
Technical Outlook and Review
DXY:
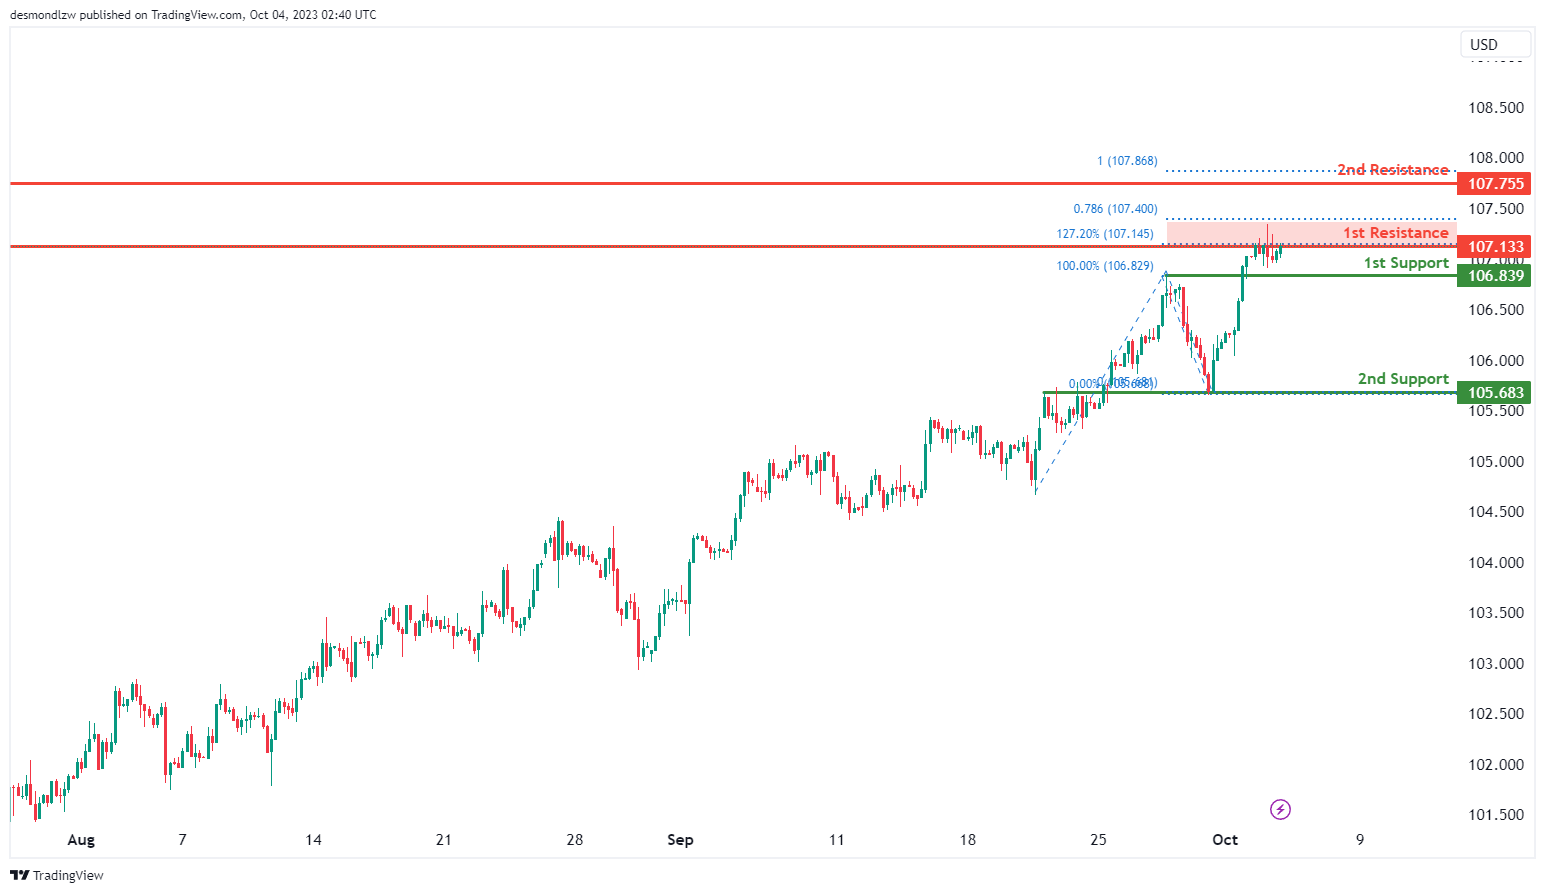
The DXY chart currently has a bearish overall momentum. There’s a potential scenario of price fluctuating between the 1st resistance and 1st support levels.
The 1st support at 106.83 is considered a pullback support, while the 2nd support at 105.68 is an overlap support.
On the resistance side, the 1st resistance at 107.13 is marked as a multi-swing high resistance with the presence of the 127.20% Fibonacci Extension and 78.60% Fibonacci Projection, suggesting Fibonacci confluence. Additionally, the 2nd resistance at 107.75 is a swing high resistance with the 100% Fibonacci Projection.
EUR/USD:
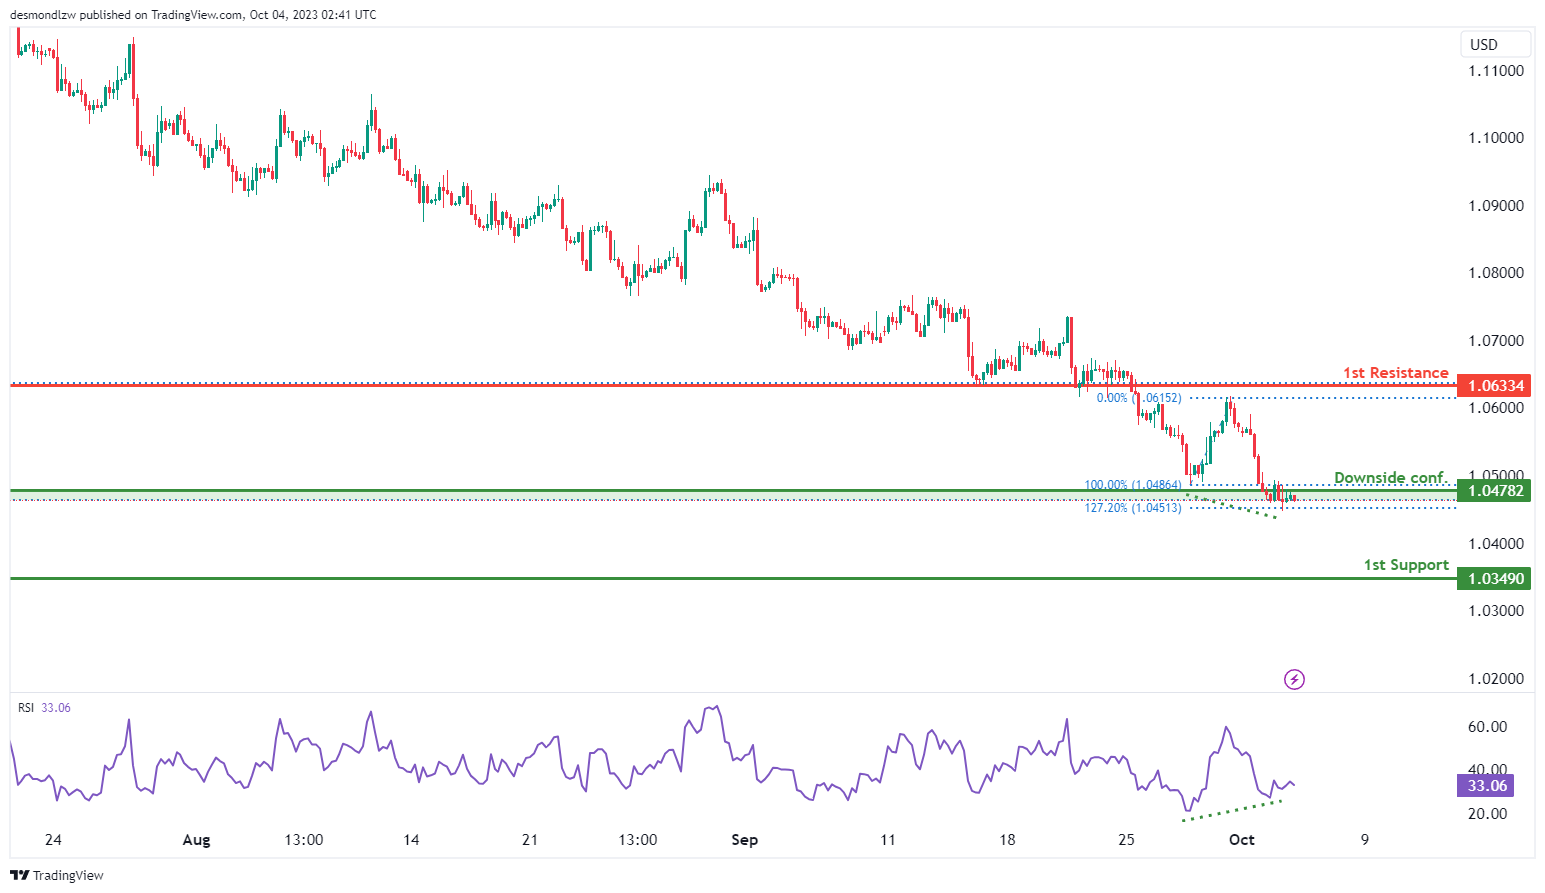
The EUR/USD chart currently shows a bearish momentum, and there is a potential scenario of a bearish continuation towards the 1st support level at 1.0349. This support level is significant as it aligns with the 127.20% Fibonacci Extension, indicating potential support.
Additionally, the 2nd support at 1.0478 is identified as a swing low support, further reinforcing its importance as a potential support level.
On the resistance side, the 1st resistance level at 1.0633 is categorized as an overlap resistance, which could act as a barrier to upward movements.
Moreover, the RSI is displaying bullish divergence versus price, suggesting the possibility of a bounce in the near future. This indicates that despite the bearish momentum, there might be a temporary reversal or retracement.
EUR/JPY:
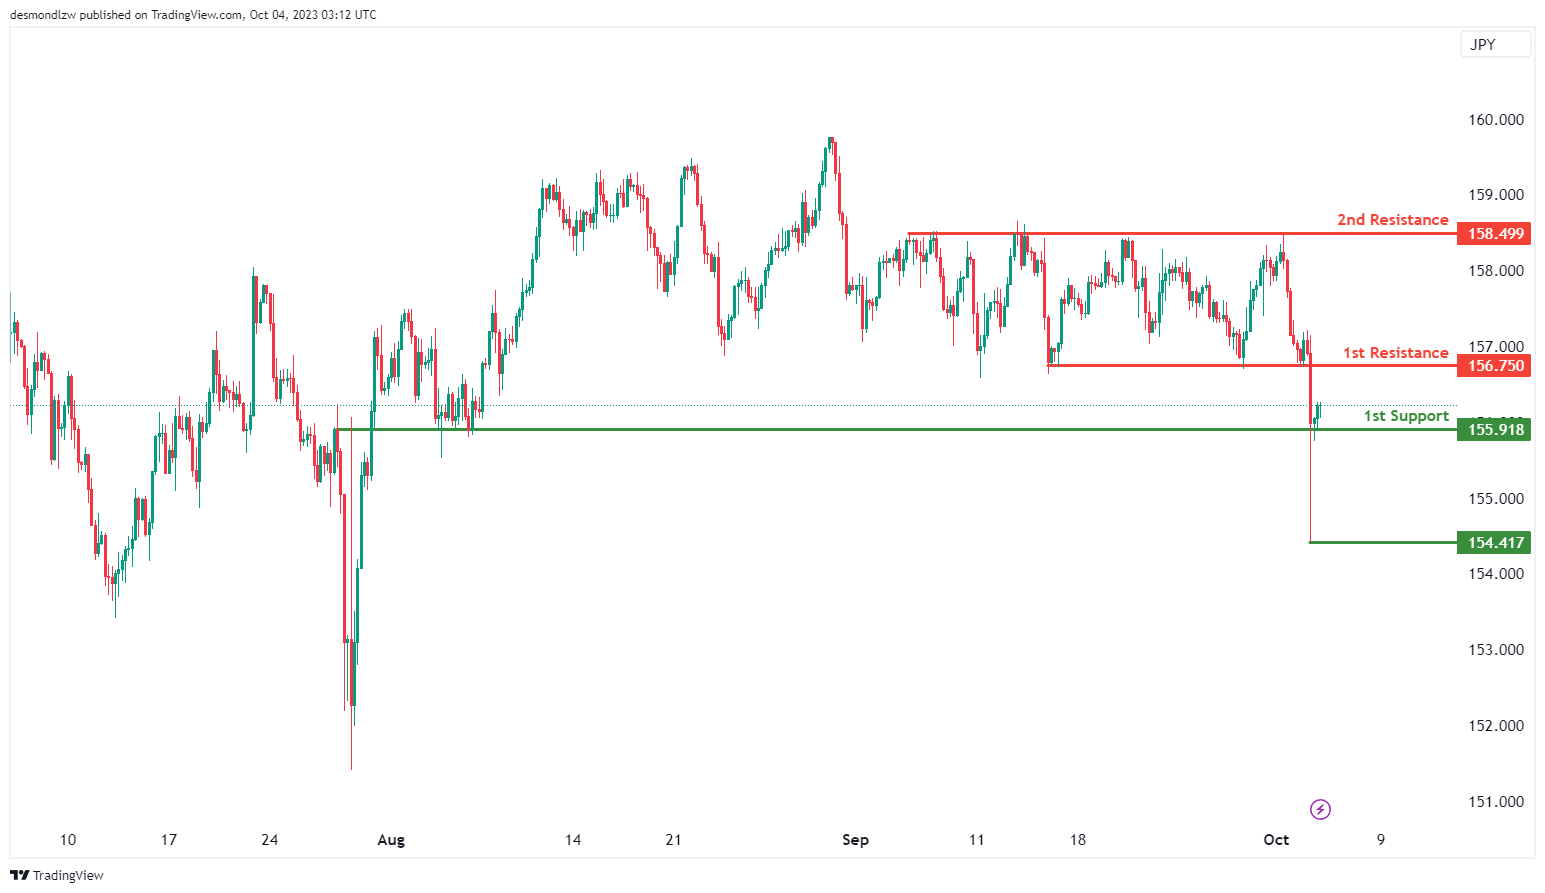
The EUR/JPY chart currently demonstrates bullish momentum, indicating the potential for a bullish bounce off the 1st support level towards the 1st resistance. The 1st support at 155.91 is considered significant, marked as an overlap support. Additionally, the 2nd support at 154.41 serves as a swing low support, further emphasizing its importance as a potential price support level.
On the resistance side, the 1st resistance at 156.75 is characterized as a pullback resistance, potentially limiting further upward movements. The 2nd resistance at 158.49 is identified as a multi-swing high resistance, suggesting it may act as a significant barrier to bullish price movements.
EUR/GBP:
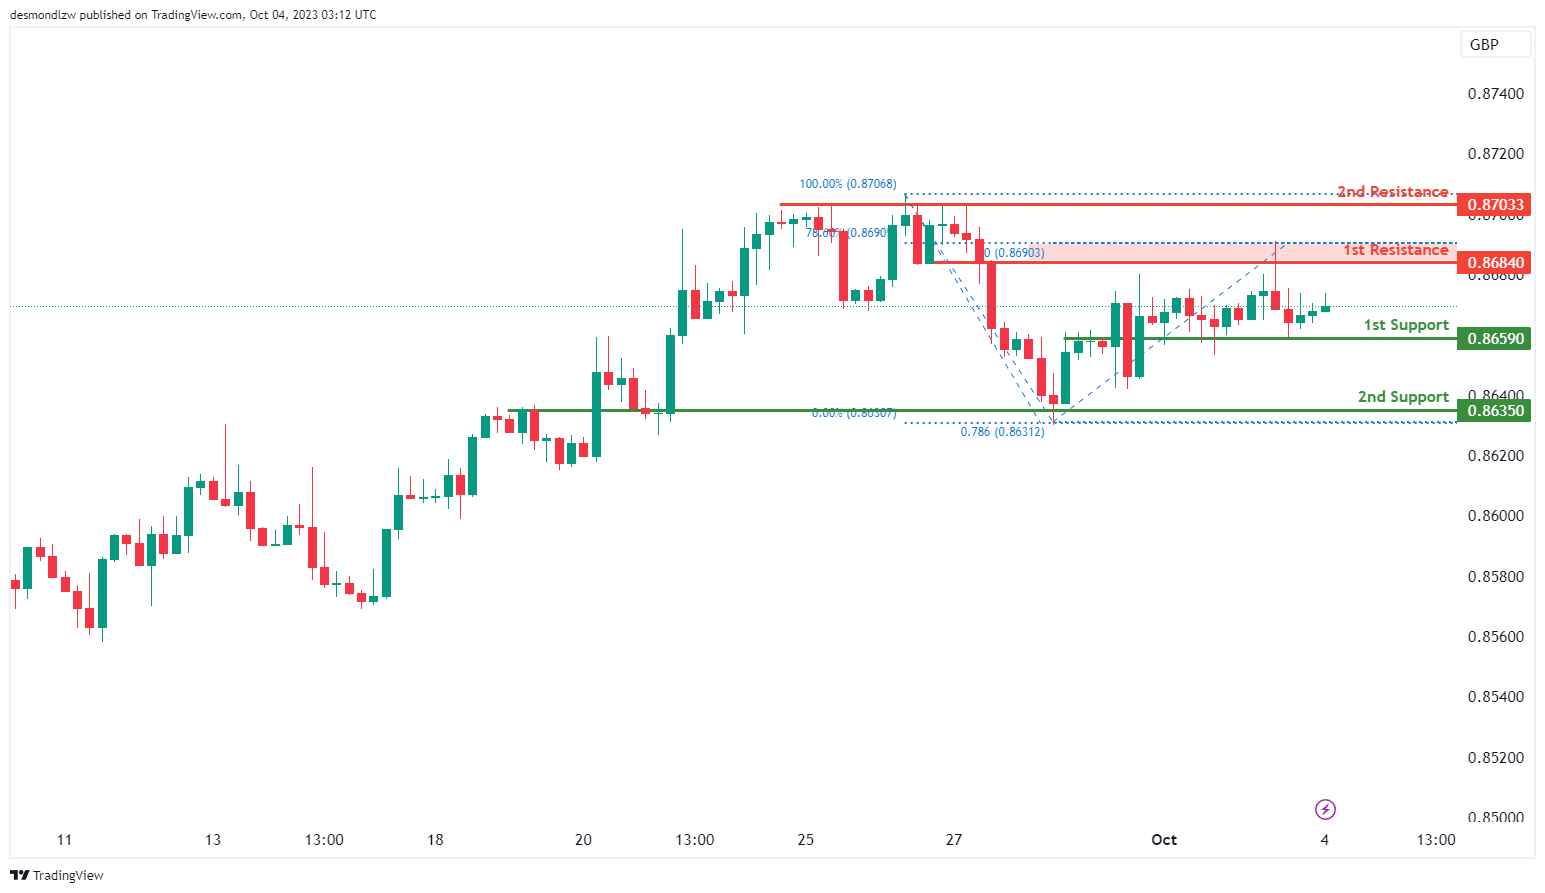
The EUR/GBP chart is currently showing neutral momentum, suggesting a potential scenario where the price could fluctuate between the 1st support and 1st resistance levels. The 1st support at 0.8659 is considered significant as it’s identified as an overlap support, making it a crucial level for potential price support. Similarly, the 2nd support at 0.8635 is also categorized as an overlap support, reinforcing its importance as a potential support zone.
On the resistance side, the 1st resistance level at 0.8684 is recognized as an overlap resistance and is associated with the 78.60% Fibonacci Retracement, suggesting it may act as a barrier to price increases. The 2nd resistance at 0.8703 is identified as a multi-swing high resistance, emphasizing its significance in potential price reversals.
GBP/USD:
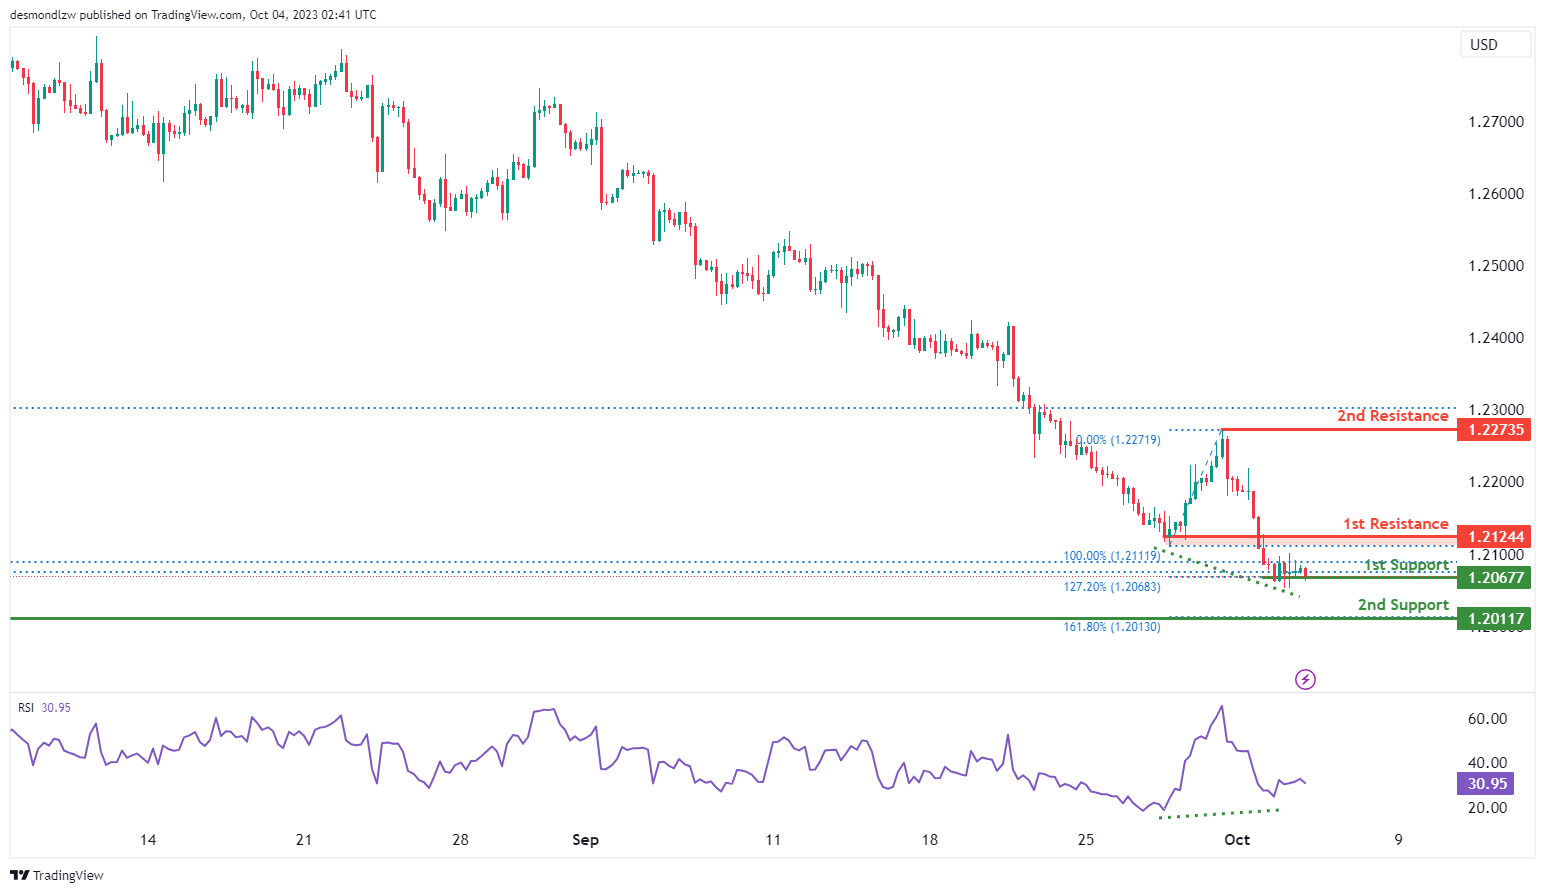
The GBP/USD chart currently exhibits a bullish momentum, and there is a potential scenario of a bullish bounce off the 1st support level at 1.2067. This support level is considered significant as it aligns with the 127.20% Fibonacci Extension. Furthermore, the 2nd support at 1.2011 is identified as a swing low support and coincides with the 161.80% Fibonacci Extension, reinforcing its importance.
On the resistance side, the 1st resistance at 1.2124 is characterized as an overlap resistance, suggesting it may act as a barrier to bullish movements. Beyond this, the 2nd resistance at 1.2273 is recognized as a swing high resistance, indicating its significance in potential price reversals.
Additionally, the RSI is displaying bullish divergence versus price, implying the possibility of a forthcoming bounce.
GBP/JPY:
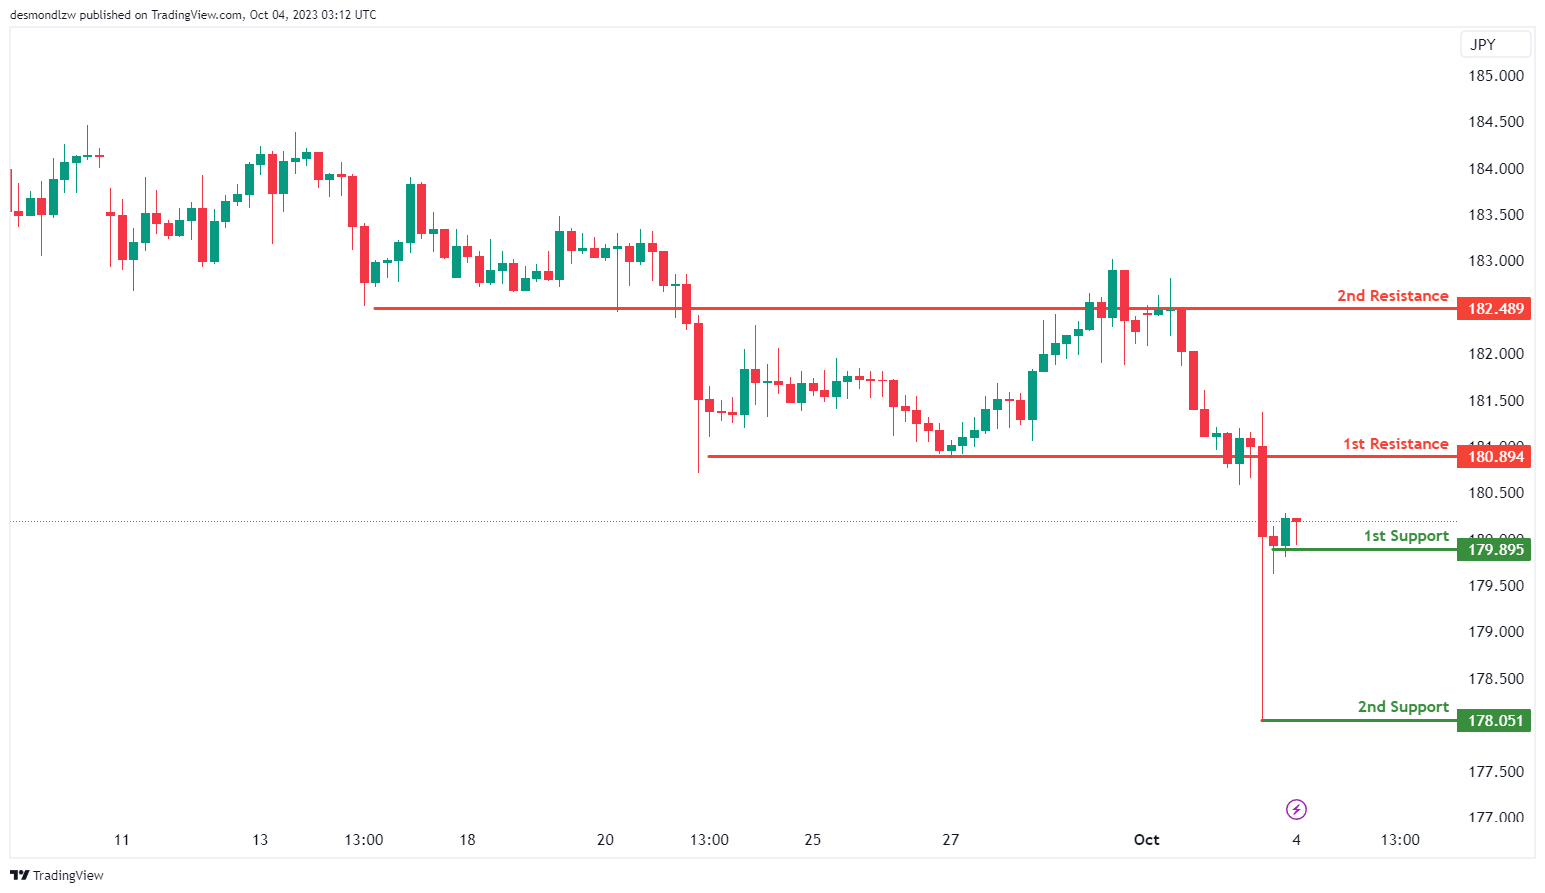
The GBP/JPY chart currently has a bullish momentum, indicating a potential scenario where the price could experience a bullish bounce off the 1st support and move towards the 1st resistance level. The 1st support at 179.89 is considered significant as it aligns with a swing low support level. Additionally, the 2nd support at 178.05 is another swing low support, further reinforcing its importance as a potential area of price support.
On the resistance side, the 1st resistance level at 180.89 is identified as a pullback resistance, potentially limiting upward movements. Beyond this, the 2nd resistance at 182.48 is categorized as an overlap resistance, suggesting it may act as a barrier to further bullish movements.
USD/CHF:
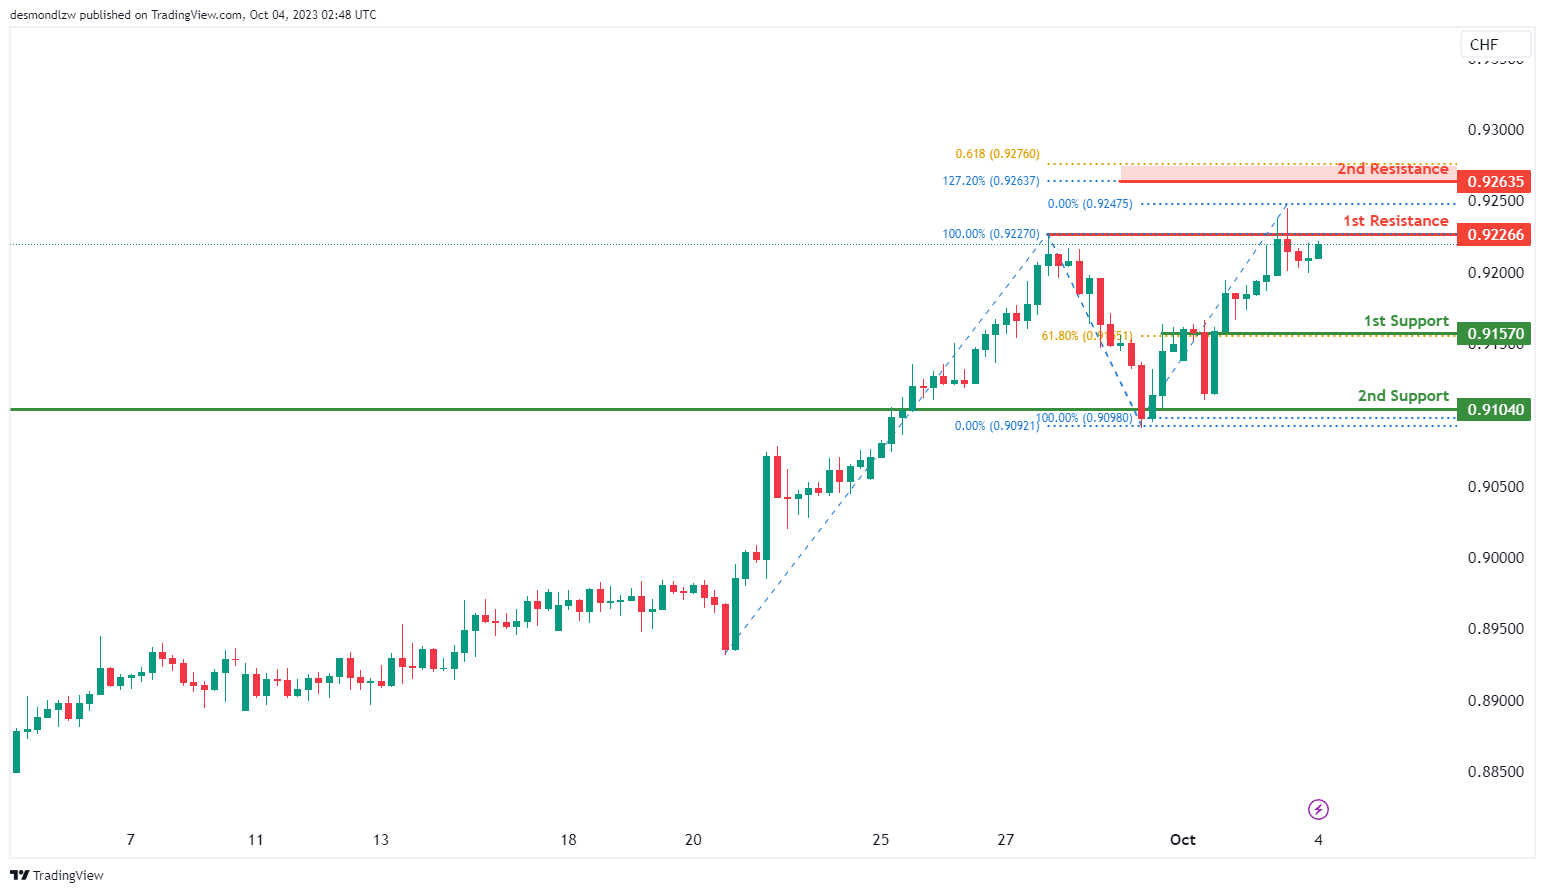
The USD/CHF chart currently has a bearish momentum, and there is a potential scenario of a bearish reaction off the 1st resistance level at 0.9226, which is supported by the presence of the 50% Fibonacci retracement. This resistance level could lead to a drop towards the 1st support at 0.9157, which is considered significant due to its alignment with the 61.80% Fibonacci retracement.
Additionally, the 2nd support at 0.9104 is identified as an overlap support, reinforcing its importance as a potential zone for price support. On the other hand, the 2nd resistance at 0.9263 is noteworthy as it exhibits Fibonacci confluence, with both the 161.80% Fibonacci Extension and 61.80% Fibonacci retracement indicating its significance in potential price reversals.
USD/JPY:
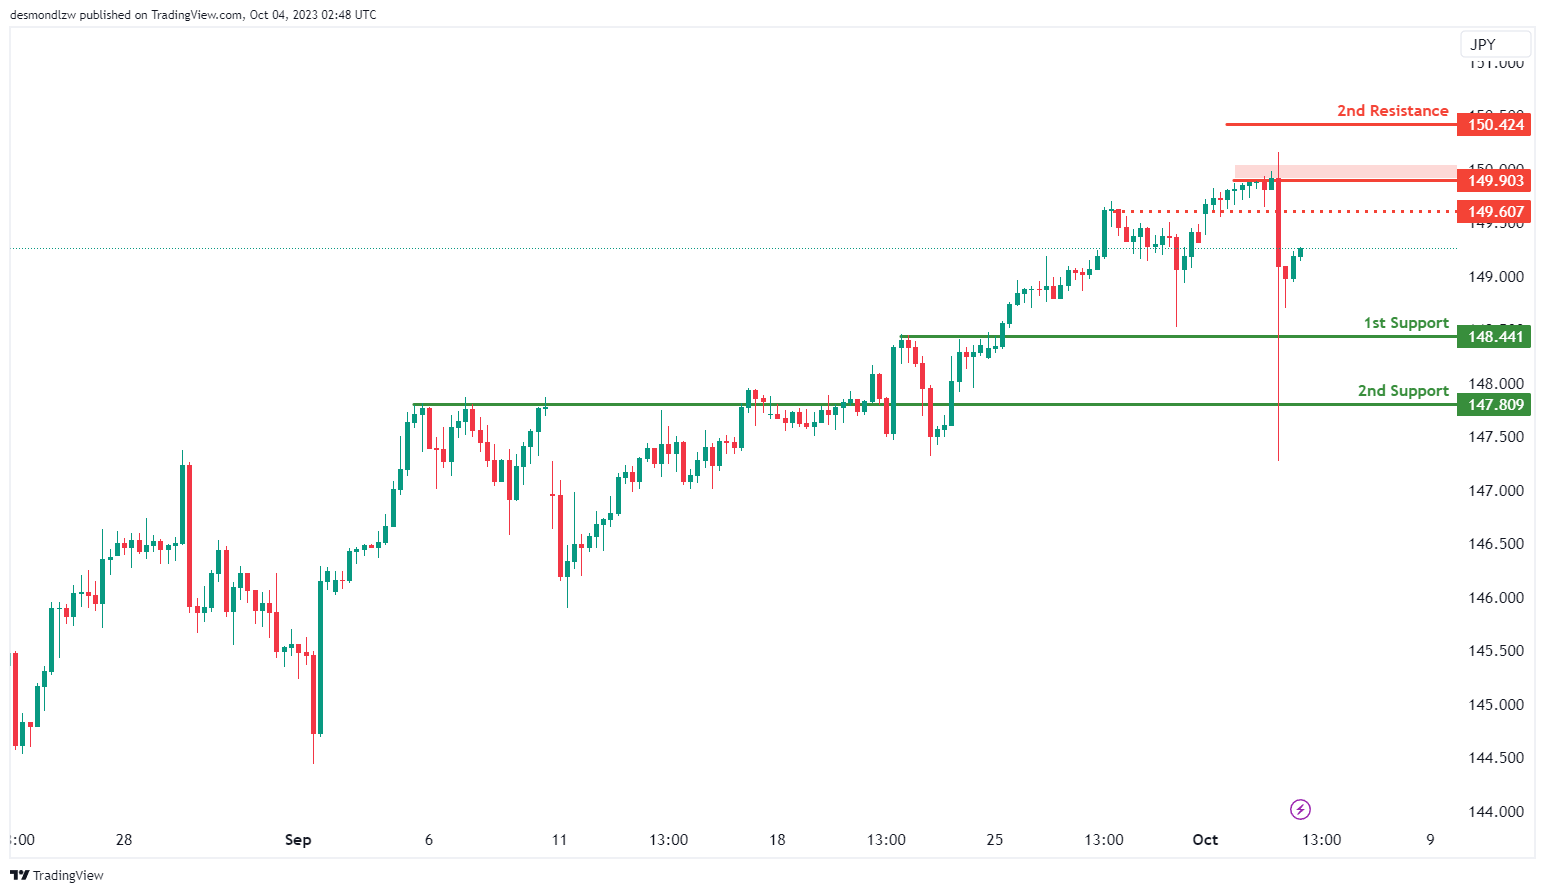
The USD/JPY chart currently exhibits a bullish momentum, and there is a potential scenario of a bullish continuation towards the 1st resistance level at 149.90, which is considered significant as it’s marked as a swing high resistance. This resistance level may act as a barrier to further upward movements.
On the support side, the 1st support at 148.44 is categorized as a pullback support, potentially providing necessary support in case of pullbacks. Additionally, the 2nd support at 147.80 is also identified as a pullback support, indicating its importance for potential price reversals. Furthermore, there is an intermediate resistance at 149.60, which is marked as a pullback resistance, contributing to potential price movements.
USD/CAD:
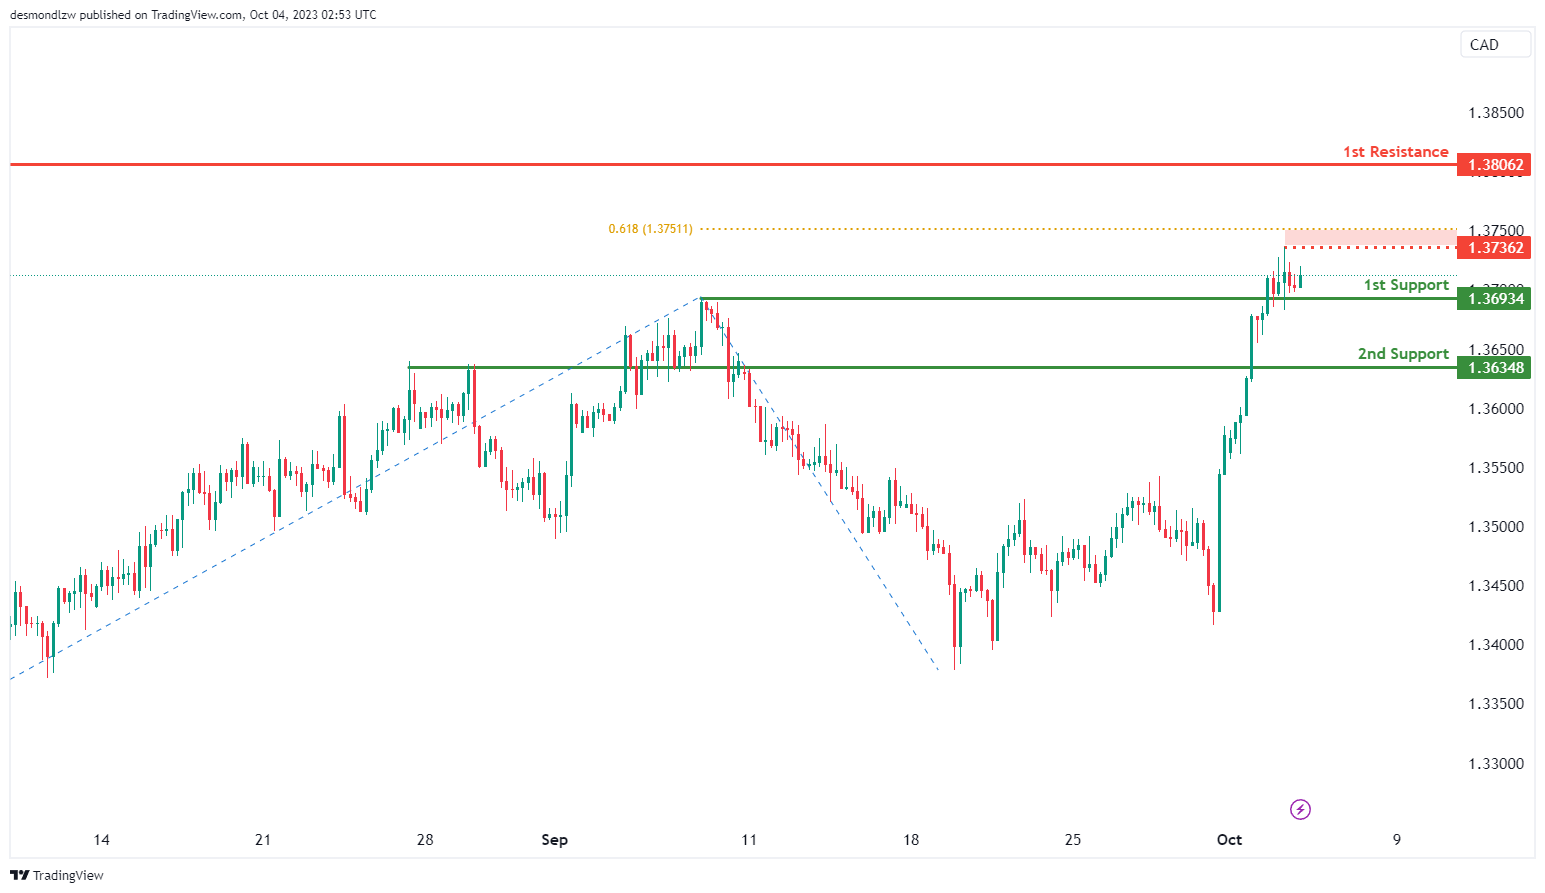
The USD/CAD chart is currently showing bullish momentum, and it suggests the possibility of a bullish continuation towards the 1st resistance level. The 1st support at 1.3693 is considered a significant level of potential price support, characterized as an overlap support. Additionally, the 2nd support at 1.3634 acts as a pullback support, further reinforcing its importance.
On the resistance side, the 1st resistance at 1.3806 is a swing high resistance, which may hinder further upward movement. Intermediate resistance at 1.3736 holds significance due to its alignment with the 61.80% Fibonacci Projection, indicating its potential role in price reversals.
AUD/USD:
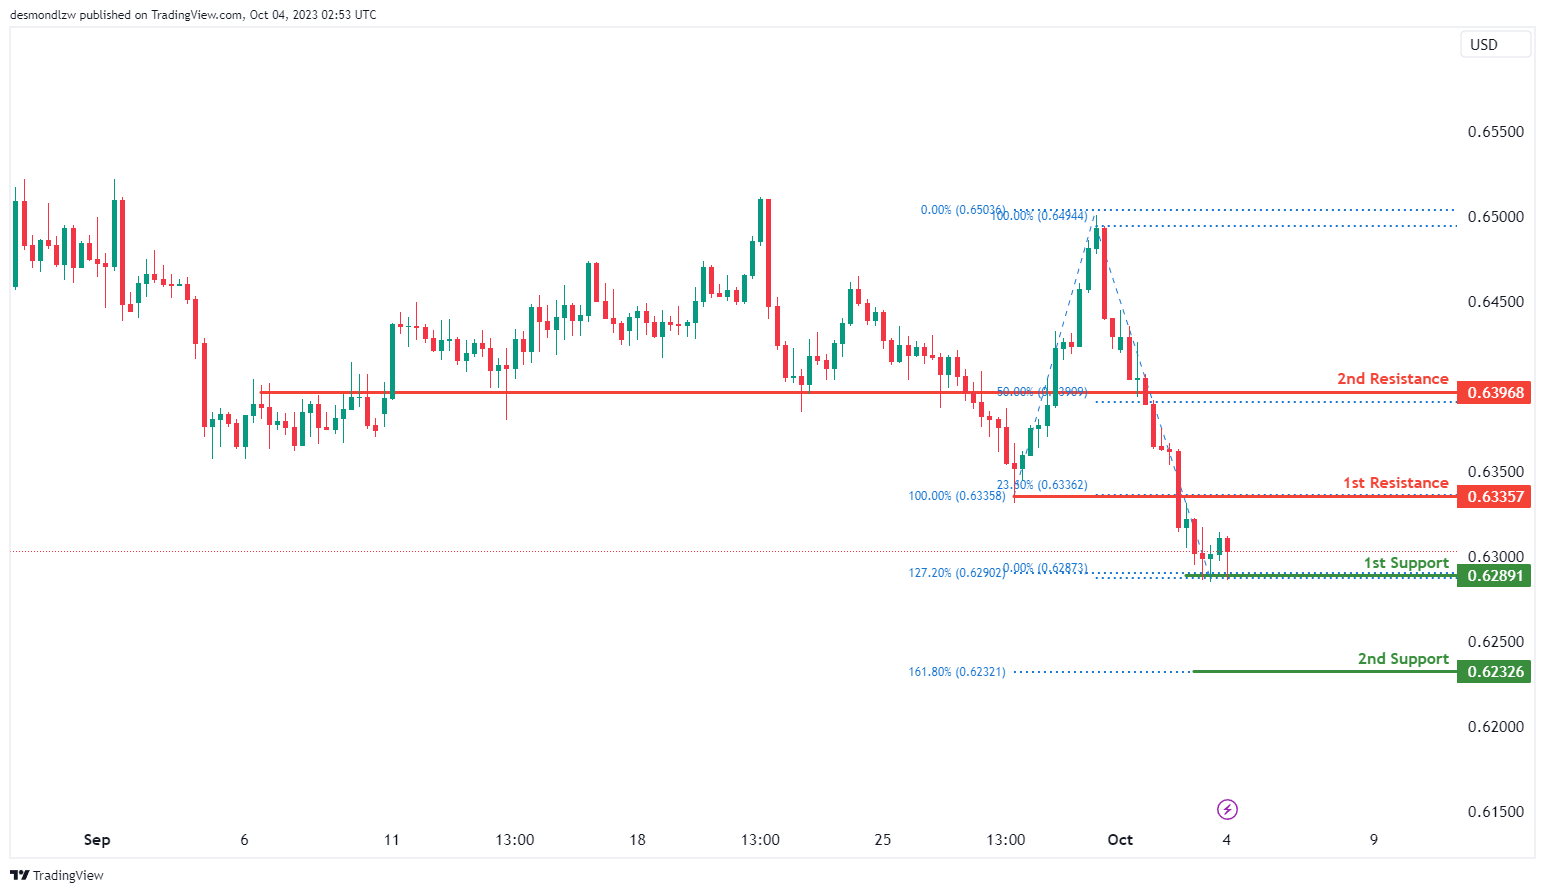
The AUD/USD chart currently has a bullish momentum, and there is a potential scenario for a bullish bounce off the 1st support level at 0.6289. This support level is considered significant as it aligns with a multi-swing low support and the 127.20% Fibonacci Extension, indicating it could provide strong support for price movements.
Additionally, the 2nd support at 0.6291 is also noteworthy, as it coincides with the 161.80% Fibonacci Extension, reinforcing its importance as a potential support level.
On the resistance side, the 1st resistance level at 0.6335 is categorized as a pullback resistance, which could potentially limit further upward movements. Beyond this, the 2nd resistance at 0.6396 is marked as a pullback resistance and aligns with the 50% Fibonacci Retracement, further emphasizing its significance in potential price reversals.
NZD/USD
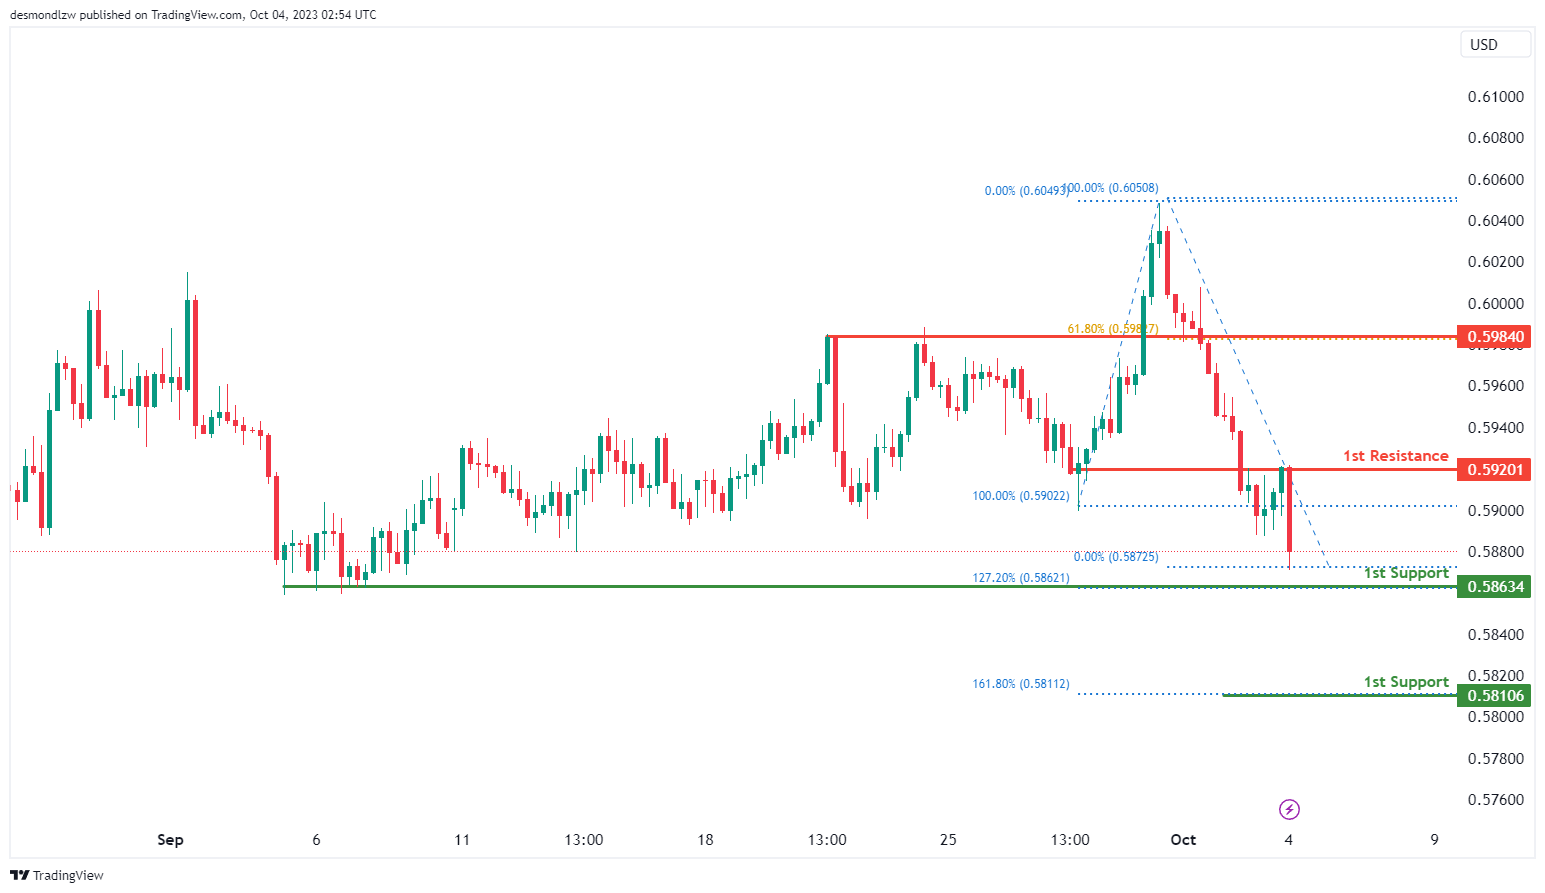
The NZD/USD chart currently exhibits a bearish momentum, with a potential scenario of a bearish continuation towards the 1st support level at 0.5863. This support level is significant as it aligns with a multi-swing low support and the 127.20% Fibonacci Extension, suggesting it could act as a strong support zone.
Furthermore, the 2nd support at 0.5810 is also noteworthy, as it is identified as a multi-swing low support and coincides with the 161.80% Fibonacci Extension, reinforcing its importance as a potential price support level.
On the resistance side, the 1st resistance level at 0.9520 is categorized as an overlap resistance, which could potentially hinder bullish movements. Additionally, the 2nd resistance at 0.5984 is marked as a pullback resistance and aligns with the 61.80% Fibonacci Retracement, further emphasizing its significance in potential price reversals.
DJ30:
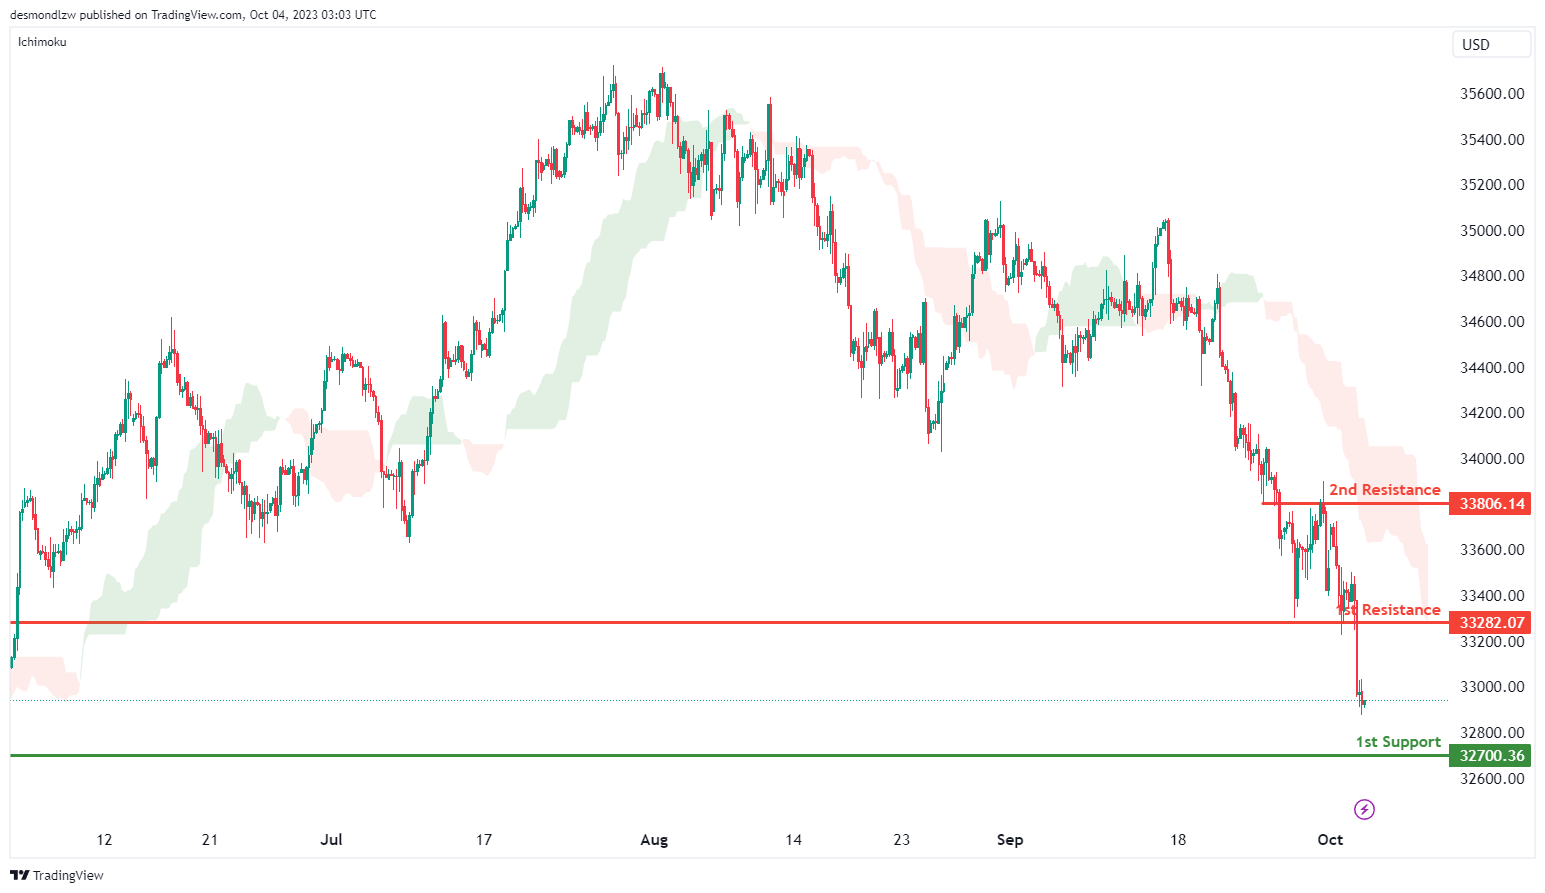
The DJ30 (Dow Jones 30) chart currently exhibits a bearish momentum, driven by its position below the bearish Ichimoku cloud. There is a potential scenario of a bearish continuation towards the 1st support level at 32700.36, which is identified as a swing low support, making it a significant level for potential price support.
On the resistance side, the 1st resistance at 33282.07 is considered a pullback resistance, indicating its potential to limit upward movements. Beyond this, the 2nd resistance at 33806.14 is categorized as an overlap resistance, suggesting it may act as a barrier to further bullish movements.
GER40:
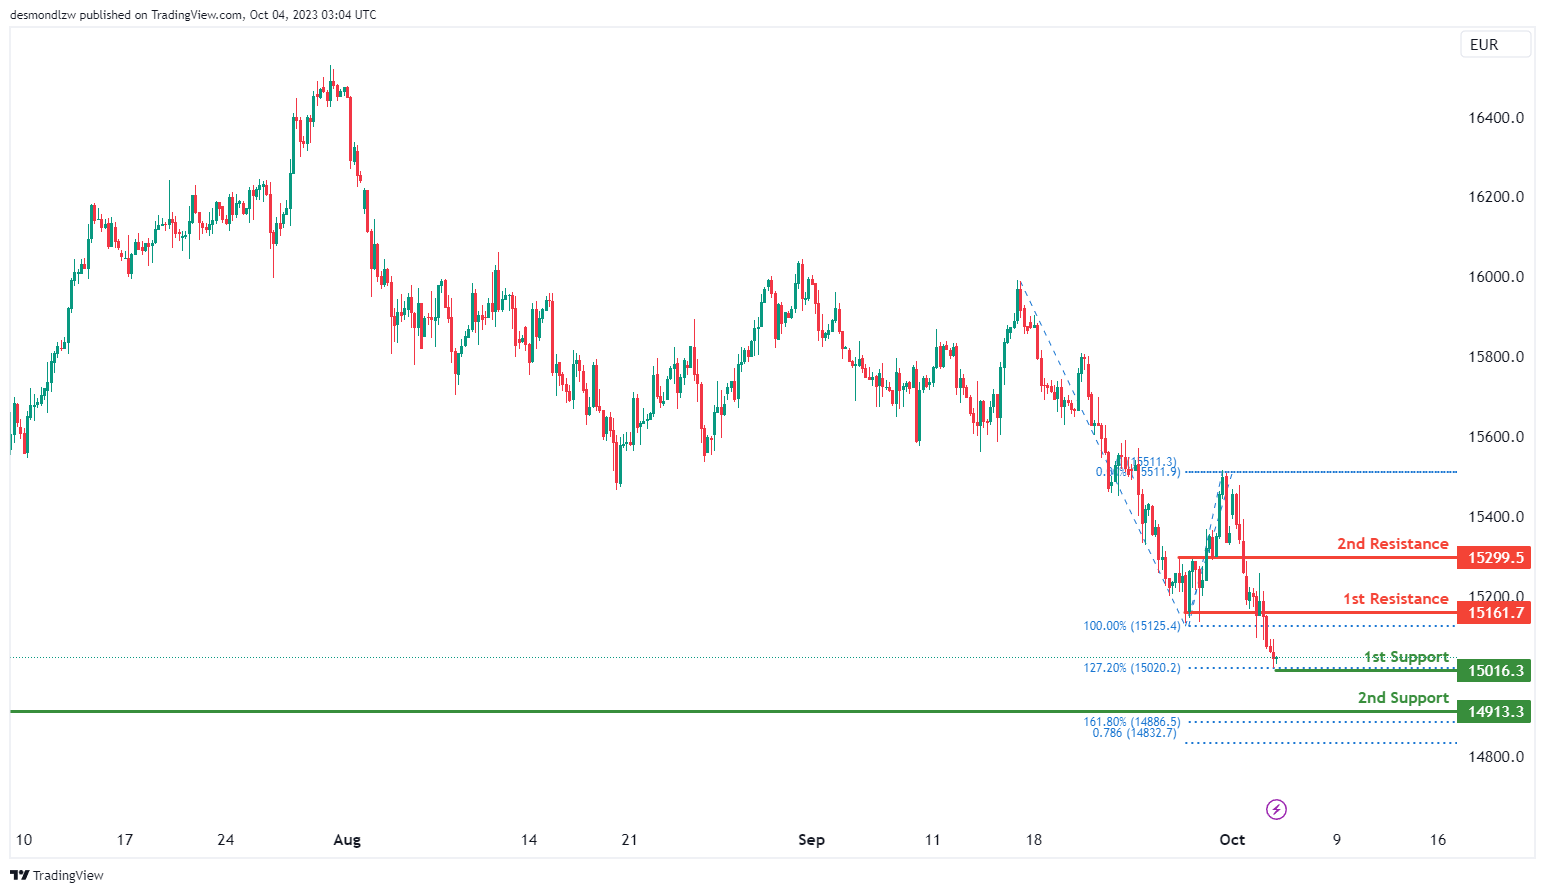
The GER40 (Germany 40) chart currently maintains a bullish momentum. There is a potential scenario where the price could experience a bullish bounce off the 1st support level at 15016.30, which is noted for its 127.20% Fibonacci Extension, highlighting its significance as a potential reversal point. Additionally, the 2nd support at 14913.30 is identified as a swing low support and aligns with the 161.80% Fibonacci Extension and the 78.60% Fibonacci Projection, further emphasizing its importance as a potential support level.
On the resistance side, the 1st resistance level at 15161.70 is characterized as a pullback resistance, indicating its potential role as a barrier to further upward movements. Beyond this, the 2nd resistance at 15299.50 is also identified as a pullback resistance, potentially adding further resistance to the price’s upward movement.
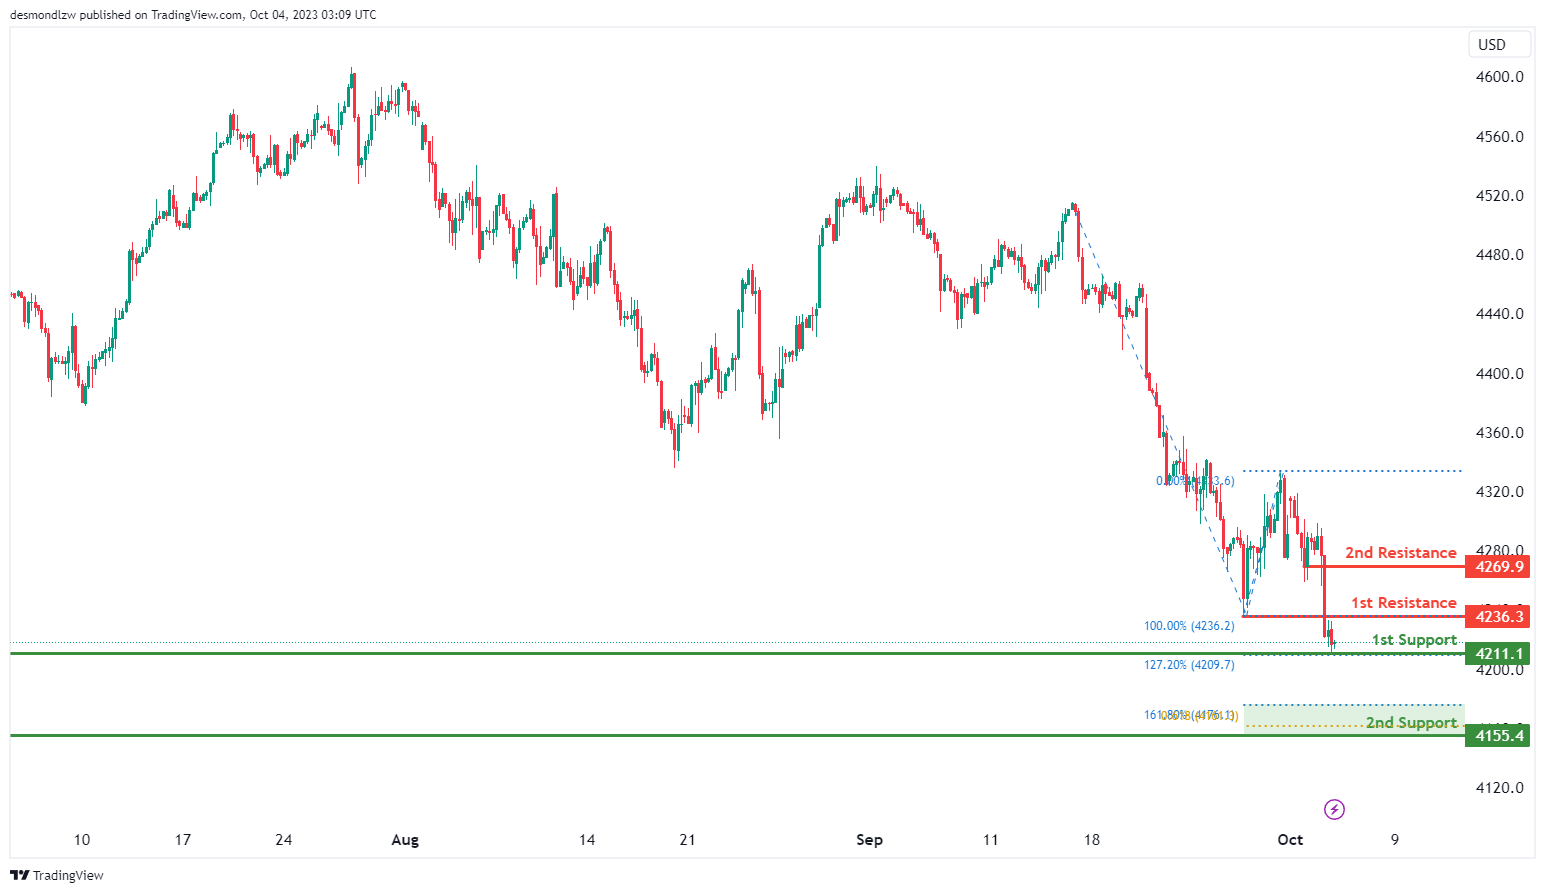
US500
The US500 (S&P 500) chart currently exhibits a bearish momentum, and there is a potential scenario where the price may fluctuate between the 1st resistance and 1st support levels.
The 1st support level at 4211.1 is considered significant due to its designation as a swing low support and the presence of the 127.20% Fibonacci Extension, suggesting it could act as a crucial level for potential price support. Additionally, the 2nd support at 4155.4 is identified as a swing low support and aligns with the 161.80% Fibonacci Extension as well as the 61.80% Fibonacci Projection, further reinforcing its importance as a potential support zone.
On the resistance side, the 1st resistance level at 4236.3 is recognized as an overlap resistance, indicating it may act as a barrier to further upward movements. Beyond this, the 2nd resistance at 4269.9 is categorized as a pullback resistance, potentially providing additional resistance to the price’s upward movement.
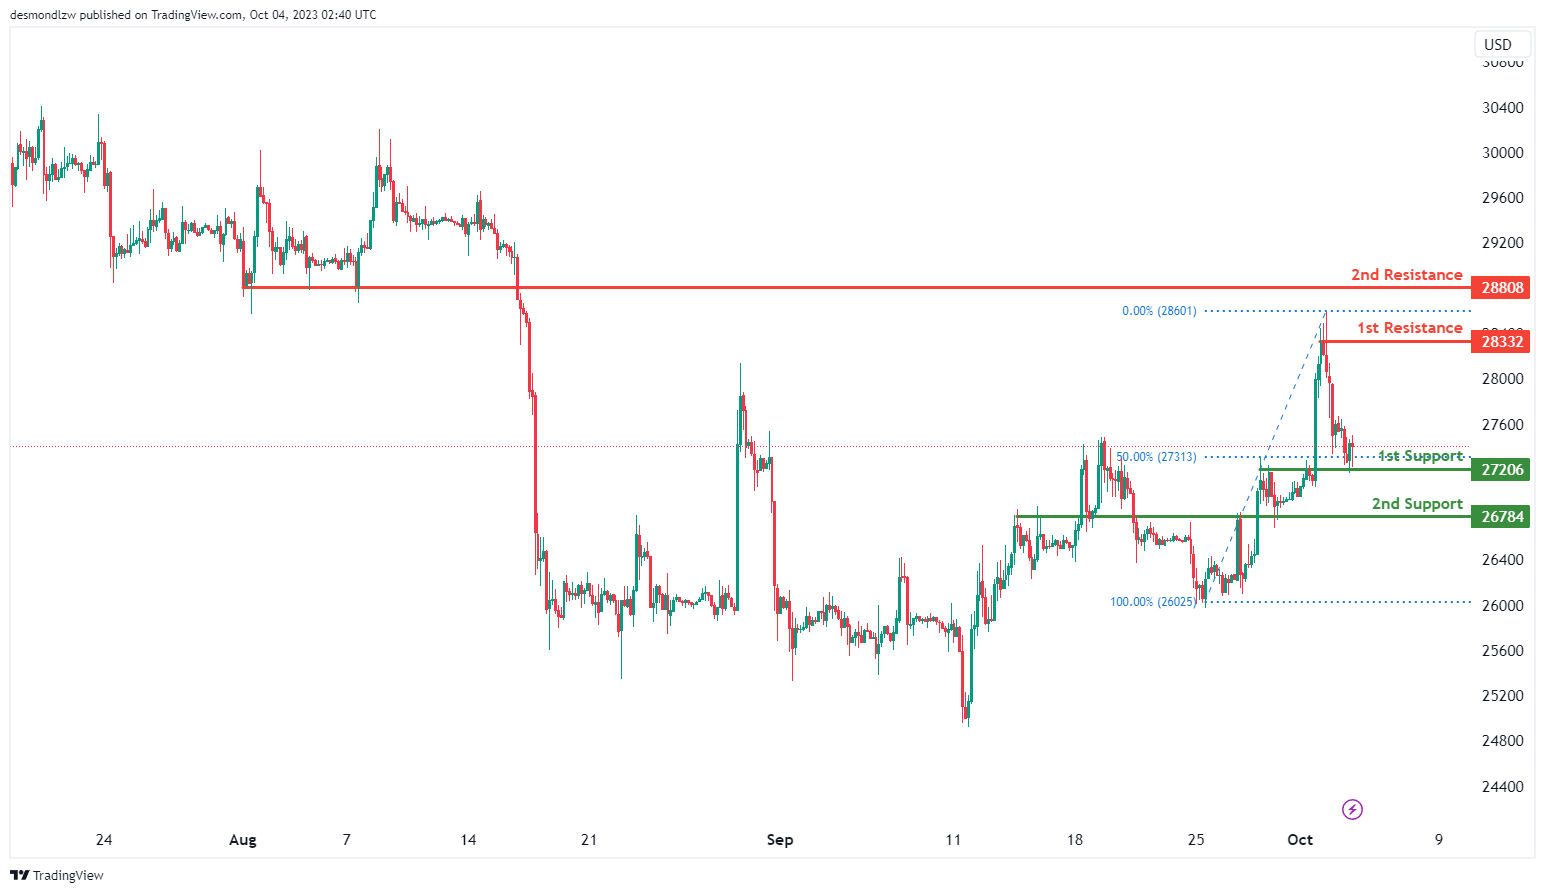
BTC/USD:
The BTC/USD chart currently maintains a bullish momentum, with a potential scenario of a bullish bounce off the 1st support level at 27206, which is supported by its designation as an overlap support and the presence of the 50% Fibonacci Retracement.
Additionally, the 2nd support at 26784 is also categorized as an overlap support, reinforcing its importance as a potential zone where the price may find support.
On the resistance side, the 1st resistance level at 28332 is marked as a swing high resistance, potentially limiting further upward movements. Beyond this, the 2nd resistance at 28808 is identified as a pullback resistance, indicating it may provide additional resistance to the price’s upward movement.
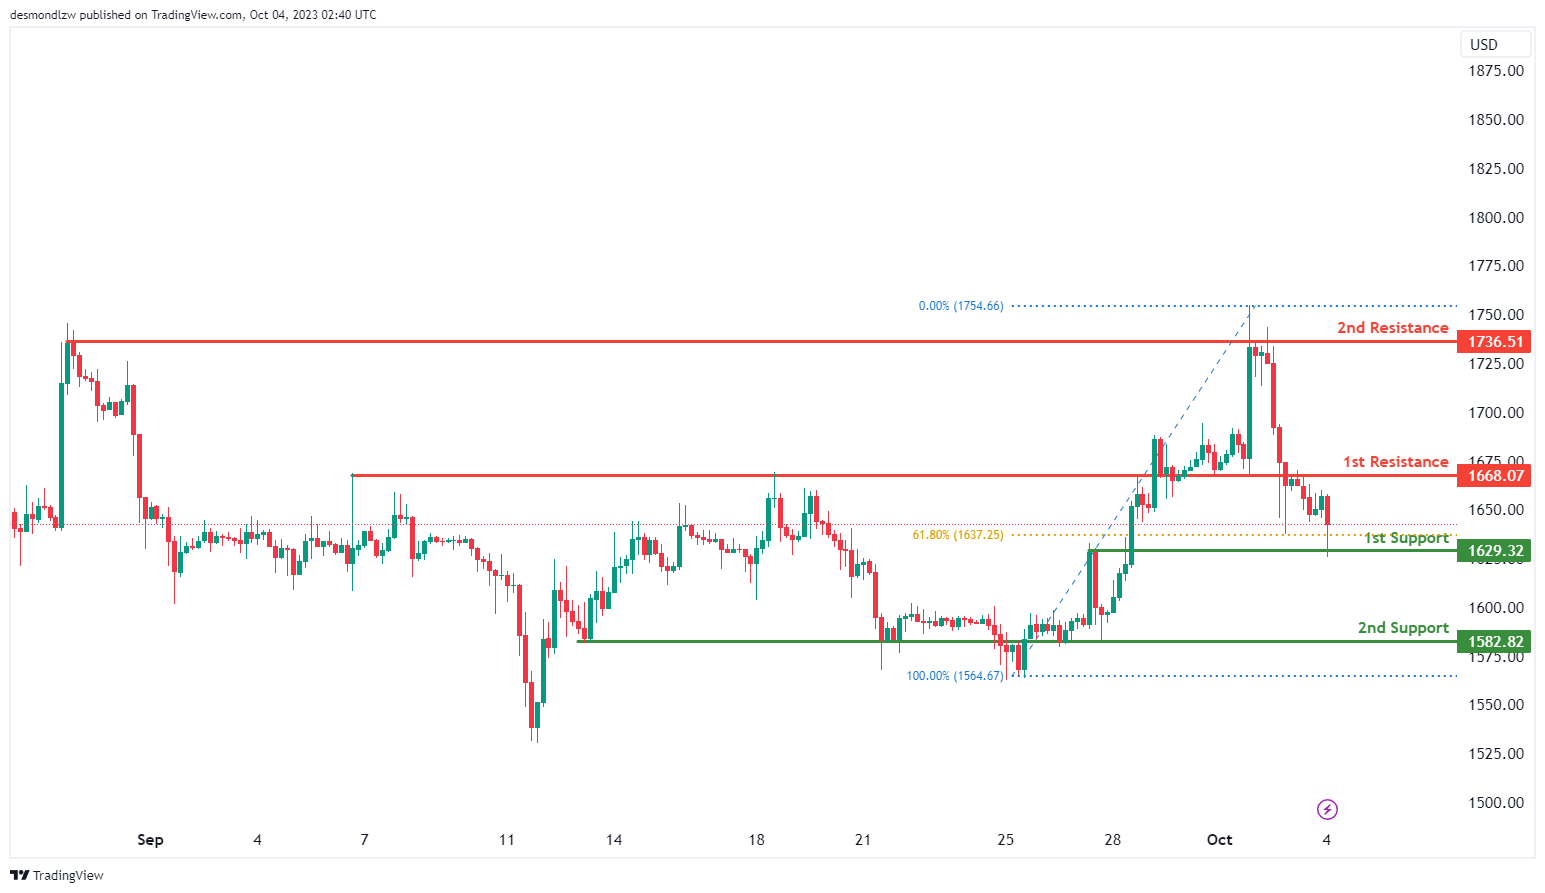
ETH/USD:
The ETH/USD chart currently maintains a neutral momentum, with a potential scenario of price fluctuation between the 1st support level at 1629.32 and the 1st resistance level at 1668.07.
The 1st support is considered significant as it’s identified as an overlap support, making it a crucial level for potential price support. Additionally, the 2nd support at 1582.82 is also categorized as an overlap support, reinforcing its importance as a potential zone where the price may find support.
On the resistance side, the 1st resistance level at 1668.07 is recognized as an overlap resistance, suggesting it may act as a barrier to price increases. Beyond this, the 2nd resistance at 1736.51 is identified as a multi-swing high resistance, emphasizing its significance in potential price reversals.
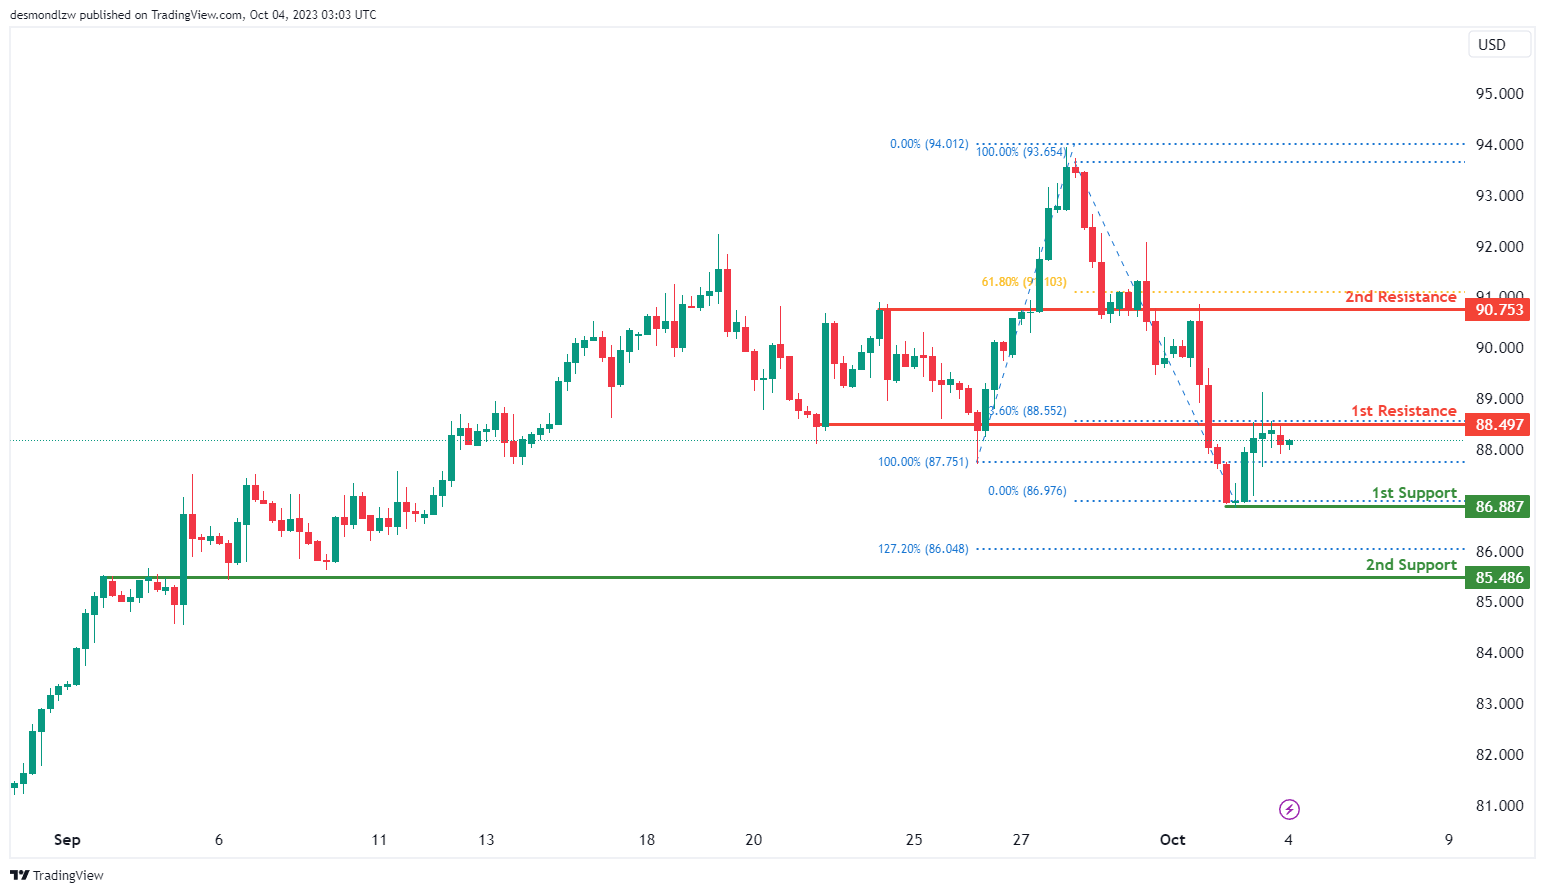
WTI/USD:
The WTI chart currently shows a bearish momentum, and there is a potential scenario of a bearish reaction off the 1st resistance level at 88.49, which is identified as an overlap resistance and is reinforced by the presence of the 23.60% Fibonacci Retracement.
On the support side, the 1st support at 86.88 is considered a swing low support, and the 2nd support at 85.48 is categorized as an overlap support, highlighting their significance as potential zones for price support.
XAU/USD (GOLD):
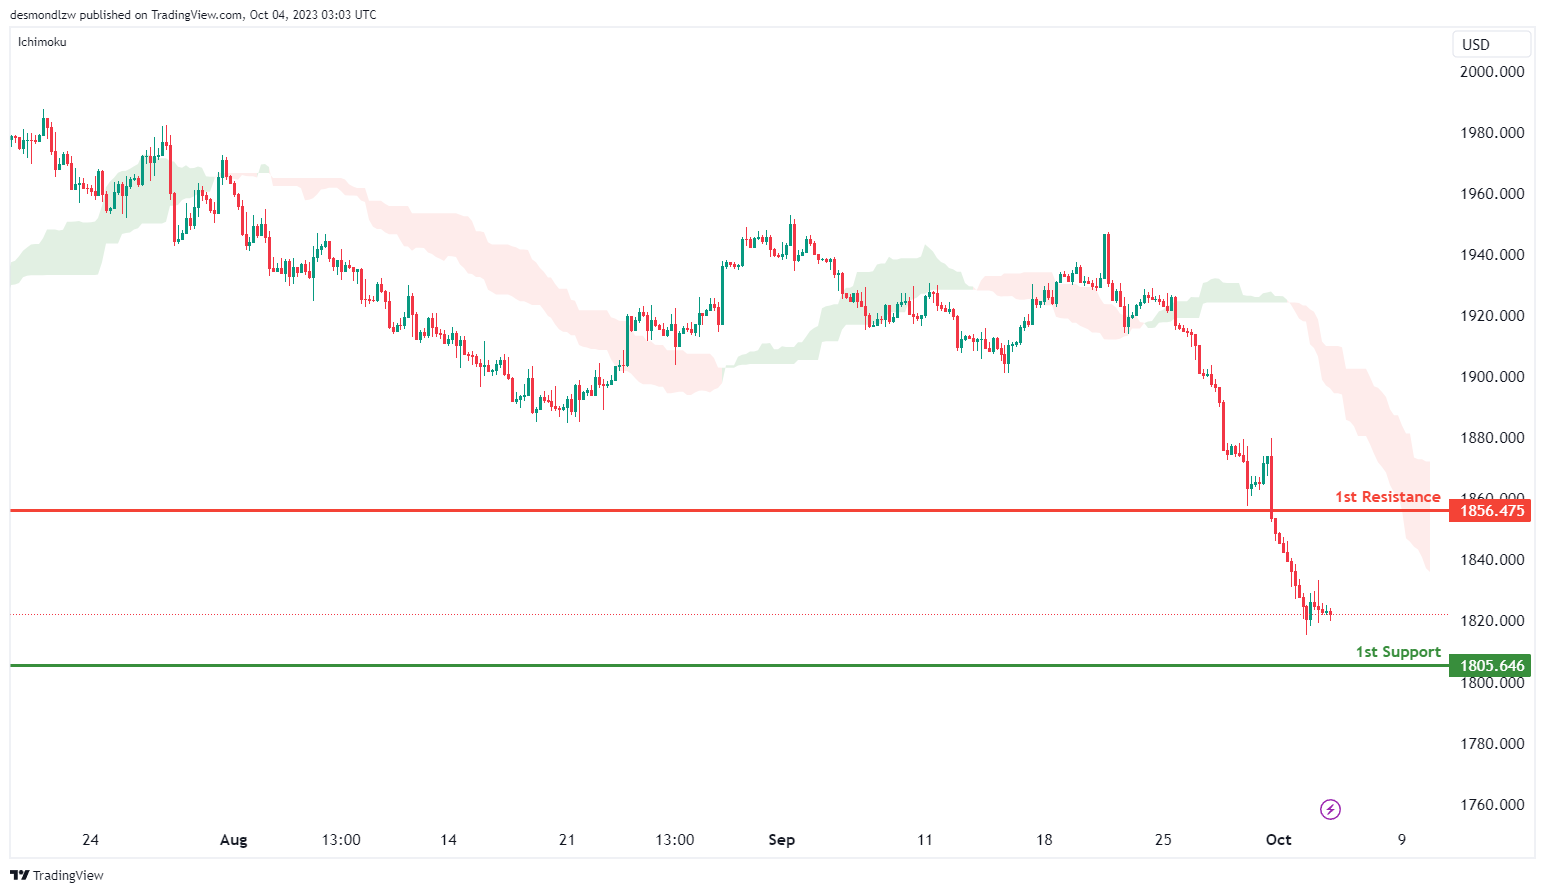
The XAUUSD chart currently has a bearish momentum, and there is a potential scenario of a bearish continuation towards the 1st support level at 1805.64, which is identified as an overlap support, indicating its significance as a potential zone for price support.
On the resistance side, the 1st resistance level at 1856.47 is marked as a pullback resistance, potentially limiting upward movements.
Anxiety grips Wall Street: DOW plummets, VIX jumps, Yields soar
Economic storm clouds appear to be gathering on the horizon. With DOW experiencing its most significant drop since March and key Treasury yields touching multi-year highs, whispers of a potential recession are becoming more audible. This is further exacerbated by the behavior of VIX, often dubbed the "fear index", which indicates heightened market apprehensions.
DOW plummeted by -430.97 points, or -1.29%, nudging it into negative territory for the year, now lagging by -0.4%. This downturn wasn't isolated to stocks. The 10-year yield reached a staggering 4.8%, a pinnacle not seen in 16 years. Similarly, 30-year yield hit a peak of 4.925%, levels of which we haven't seen since 2007.
The narrowing gap between the 2-year and 10-year Treasury yields, contracting to a mere 35 basis points from over 100 basis points a few months earlier, is especially concerning. This normalization, or "de-inverting", of a vital part of the yield curve is often viewed as a precursor to economic downturns, igniting debates on the imminence of a recession.
Adding to the market's jitters, VIX has climbed for three consecutive sessions, momentarily crossing the critical 20 level and finishing at a six-month high. Values below 20 on the VIX generally signify market stability, but as it surpasses this threshold, it denotes an environment fraught with investor unease and skittishness.
Back to DOW, it's now pressing and important near fibonacci support at 38.2% retracement of 28660.94 to 35679.13 at 32998.17. Sustained break of this level will strengthen the case that fall from 35679.13 is reversing whole rise from 28660.94. This decline could be viewed as the third leg of the long term pattern from 36952.65 high. Deeper fall would be seen to 31.429.82 support, which is close to 61.8% retracement at 31341.88.
In any case, near term outlook will stay bearish as long as 34029.22 support turned resistance holds. The rest of the week, with ISM services today and non-farm payrolls release on Friday, will be crucial.
Gold Price Nosedives, Recovery Could Be Limited
Key Highlights
- Gold price declined heavily below the $1,900 support.
- It could start a recovery if it clears the $1,840 resistance on the 4-hour chart.
- Crude oil prices corrected lower from the $95.00 resistance.
- The US ISM Services PMI could decline from 54.5 to 53.6 in Sep 2023.
Gold Price Technical Analysis
Gold price started a major decline from well above $1,920 against the US Dollar. The price declined heavily below the $1,900 support zone.
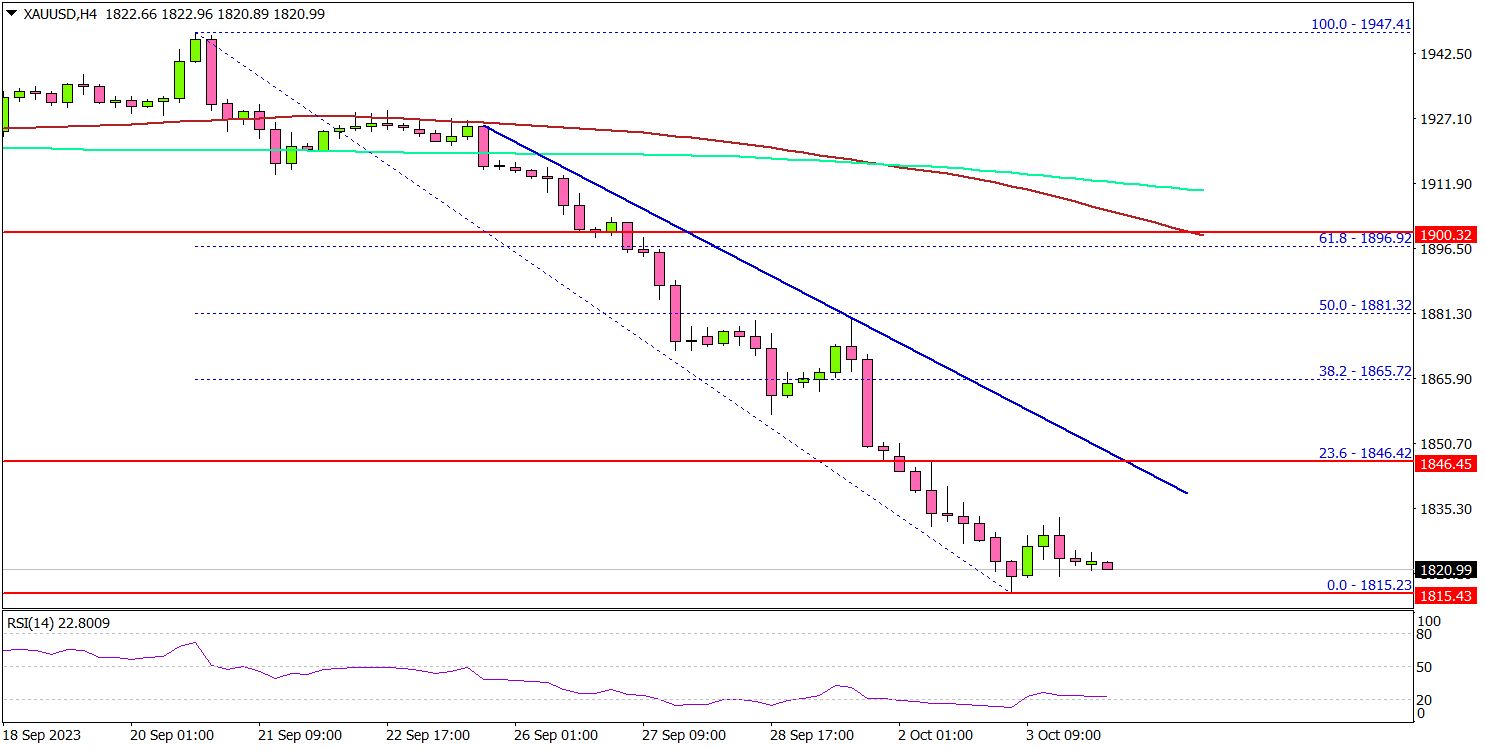
The 4-hour chart of XAU/USD indicates that the price settled above the $1,865 level, the 200 Simple Moving Average (green, 4 hours), and the 100 Simple Moving Average (red, 4 hours).
The decline was even extended below the $1,840 level. A low was formed near $1,815 and the price is now consolidating losses. On the upside, the price is facing resistance near the $1,832 and $1,835 levels.
The next major resistance is near the $1,840 level, above which Gold could revisit the key $1,850 resistance zone. Any more gains might call for a move toward $1,880.
On the downside, the price might find support near the $1,815 level. The next key support is near $1,800. If the bulls fail to protect the $1,800 support, there is a risk of a major decline. In the stated case, the price could decline toward the $1,750 level.
Looking at crude oil prices, there was a sustained upward move toward the $95.00 level before the bears appeared and initiated a downside correction.
Economic Releases to Watch Today
- Germany’s Services PMI for Sep 2023 - Forecast 49.8, versus 49.8 previous.
- Euro Zone Services PMI for Sep 2023 – Forecast 48.4, versus 48.4 previous.
- UK Services PMI for Sep 2023 – Forecast 47.2, versus 47.2 previous.
- US Services PMI for Sep 2023 – Forecast 50.2, versus 50.2 previous.
- US ISM Services PMI for Sep 2023 – Forecast 53.6, versus 54.5 previous.
Japan’s top brass remains mum on intervention claims
Market watchers were in a frenzy after Japanese Yen surged from 150 to the 147 zone against Dollar overnight , fuelling speculation that Japan's government may have stealthily intervened to push up the struggling currency. While evidence of a Yen-buying, Dollar-selling maneuver abounds, top officials in Japan remained tight-lipped today.
Finance Minister Shunichi Suzuki, when confronted by reporters, chose the path of silence over confirmation. He held back from validating the swirl of speculations about intervention. Suzuki reiterated a standard narrative, emphasizing the desirability of market-driven, stable currency movements that mirror economic fundamentals.
"Currency rates ought to move stably driven by markets, reflecting fundamentals. Sharp moves are undesirable," Suzuki noted. "The government is monitoring market developments very carefully with a sense of urgency. We will take appropriate steps against excessive volatility without excluding any options."
Masato Kanda, the top currency diplomat, provided insights into the government's assessment mechanism for currency movements. "If currencies move too much on a single day or, say, a week, that's judged as excess volatility," Kanda explained.
The implied volatility stands as a critical metric, among others, shaping the official perspective on whether Yen's moves are reaching alarming amplitudes.
Kanda further outlined that even in the absence of abrupt shifts, a gradual yet one-sided build-up of significant currency movements over time is also classified as excessive volatility. However, he too refrained from offering a direct commentary on the overnight upswing of Yen.
RBNZ holds rates, hints at longer duration of restrictive policy
RBNZ has opted to keep the Official Cash Rate stable at 5.50%, aligning with broad market anticipations. The minutes of the meeting revealed a consensus among committee members that restrictive interest rate environment might be needed "for a more sustained period of time".
In the short term, RBNZ is looking at a scenario where domestic demand could exhibit "greater resilience", spurred by migration. This situation could "slow the pace of expected disinflation". A related concern is wage inflation, which could take a longer time to ease than initially expected. Recent rise in oil prices could also risk "headline inflation being higher than expected".
Looking at the medium term, the minuted noted concerns about greater slowdown in global growth. Such a downturn could lead to further reductions in non-oil import prices. Moreover, weakened global demand, with a particular emphasis on China, could exert additional pressure on commodity prices, subsequently affecting New Zealand's export revenues.
(RBNZ) Official Cash Rate remains at 5.5%
The Monetary Policy Committee today agreed to hold the Official Cash Rate (OCR) at 5.50%
Interest rates are constraining economic activity and reducing inflationary pressure as required.
Demand growth in the economy continues to ease. While GDP growth in the June quarter was stronger than anticipated, the growth outlook remains subdued. With monetary conditions remaining restrictive, spending growth is expected to decline further.
Globally, economic growth remains below trend and headline inflation has eased for most of our trading partners. Core inflation has also eased, but to a lesser extent. Weakening global demand is putting downward pressure on New Zealand export volumes and prices. Apart from oil, global import prices have eased.
While the imbalance between supply and demand continues to moderate in the New Zealand economy, a prolonged period of subdued activity is required to reduce inflationary pressure.
There is a near-term risk that activity and inflation do not slow as much as needed. Over the medium term, a greater slowdown in global economic demand, particularly in China, could weigh more on commodity prices and New Zealand export revenue.
The Committee agreed that the OCR needs to stay at a restrictive level to ensure that annual consumer price inflation returns to the 1 to 3% target range and to support maximum sustainable employment.
Monetary Policy Committee Summary record of meeting
The Monetary Policy Committee discussed recent developments in the New Zealand economy. The Committee agreed that monetary conditions are restricting spending and reducing inflationary pressure. While supply constraints in the economy continue to ease, inflation remains too high. Spending needs to remain subdued to better match the economy's ability to supply goods and services, so that consumer price inflation returns to its target range.
Global economic activity remains below trend. While global growth has been resilient in recent months this momentum is beginning to fade. Recent data show continued regional variation, with economic strength in the United States but slow momentum in Europe and historically low growth in China. Easing global demand is placing downward pressure on New Zealand exports, in terms of both volumes and prices. Global oil prices have increased, but other import prices have been slightly lower.
Globally, headline inflation continues to fall but declines in core inflation are more gradual and uneven across economies. In discussing recent central bank policy moves, the Committee noted that policy rates are now expected to remain at restrictive levels for a sustained period of time, in order to bring inflation back to respective central bank policy target levels.
The Committee discussed domestic economic developments. The rebound in June quarter GDP data was larger than anticipated, partly reflecting the effects of population growth from high net immigration and momentum in household spending. However, demand growth in the economy continues to ease broadly as expected. The more recent Performance of Manufacturing and Services Indices (PMI and PSI) and NZIER Quarterly Survey of Business Opinion (QSBO) show easing capacity pressures. The Committee noted that with monetary conditions remaining restrictive, they expect to see further declines in per capita spending and for GDP growth to be subdued.
Financial conditions have continued to tighten with an increase in wholesale and retail lending rates. Members noted that the average mortgage rate on outstanding loans continues to rise, and debt servicing costs as a share of income are still increasing. Members also noted that house prices were slightly higher, but that this was on low sales volumes. House prices remain around estimates of sustainable levels.
Members discussed the Pre-election Economic and Fiscal Update 2023 (PREFU) and noted that total government spending as a share of potential GDP is still forecast to decline, but by less than previously expected. Members noted the material increase in government investment over the medium term, due to infrastructure resilience requirements.
The Committee discussed the balance of risks for inflation, output, and employment. Members agreed that the risks to the outlook remained similar to those discussed in the August MPS.
In the near term, members agreed that the risk of greater resilience in domestic demand remained. Upside surprises to, or greater than expected demand-side stimulus from, migration could sustain growth momentum for longer. More resilience in domestic demand could slow the pace of expected disinflation. An easing in wage inflation could take longer, but members noted the lack of recent wage data. The recent rise in global oil prices could increase domestic costs over coming months, risking headline inflation being higher than expected.
Over the medium term, the Committee agreed downside risks around the outlook for global growth remain. A greater slowdown in global growth could see further falls in the price of non-oil imports. Weaker global demand, particularly from China, would likely weigh further on commodity prices and therefore on export revenues.
The Committee discussed the risks around the lagged effect of previous monetary tightening on households and businesses. Recent data show continuing weak demand for credit other than for business working capital requirements. Members agreed the ongoing slowdown in economic activity is not even across sectors of the economy, due to global factors and the varied impact of high domestic interest rates. In particular, the Committee noted that pockets of stress have emerged for some in the household, commercial property, and agricultural sectors.
The Committee agreed that in the current circumstances, there is no material trade-off between meeting the Committee's inflation and employment objectives and maintaining stability of the financial system. Members noted that debt levels are high in some parts of the economy and debt servicing costs have increased. While broad indicators of stress have increased, non-performing loans remain at low levels.
In discussing their Remit objectives, the Committee noted inflation is still expected to decline to within the target band by the second half of 2024. While employment is above its maximum sustainable level, recent indicators show that employment intentions are flat and difficulty in finding labour has reduced.
The Monetary Policy Committee discussed the appropriate stance of monetary policy. The Committee agreed that interest rates may need to remain at a restrictive level for a more sustained period of time, to ensure annual consumer price inflation returns to the 1 to 3% target range and to support maximum sustainable employment.
On Wednesday 4 October, the Committee reached a consensus to maintain the Official Cash Rate at 5.50%.
GBPAUD Wave Analysis
- GBPAUD reversed from pivotal support level 1.8945
- Likely to rise to resistance level 1.9400
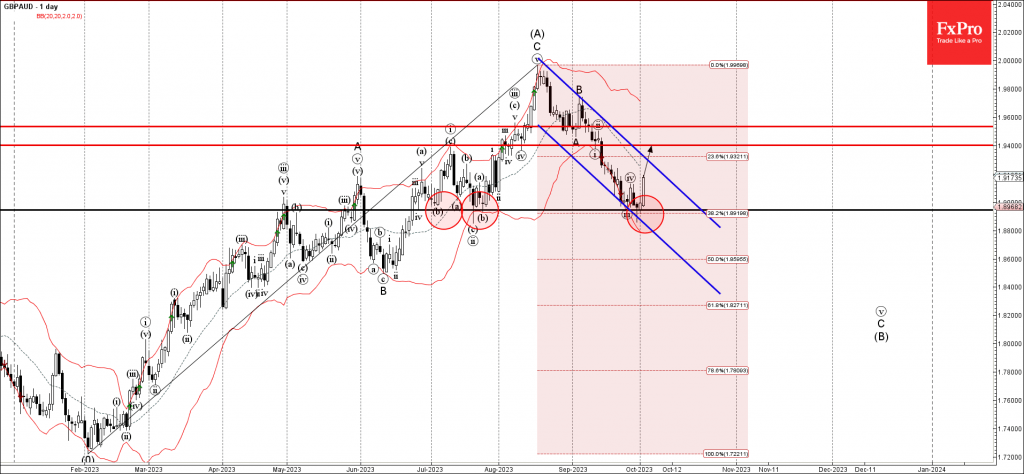
GBPAUD currency pair recently reversed up from the pivotal support level 1.8945 (which has been repeatedly reversing the pair from the start of July) intersecting with the lower daily Bollinger Band and support trendline of the daily down channel from August.
The upward reversal from the support level 1.8945 stopped the C-wave from the start of September.
Given the clear daily uptrend and strong AUD sales across the FX markets, GBPAUD can be expected to rise further toward the next resistance level 1.9400.
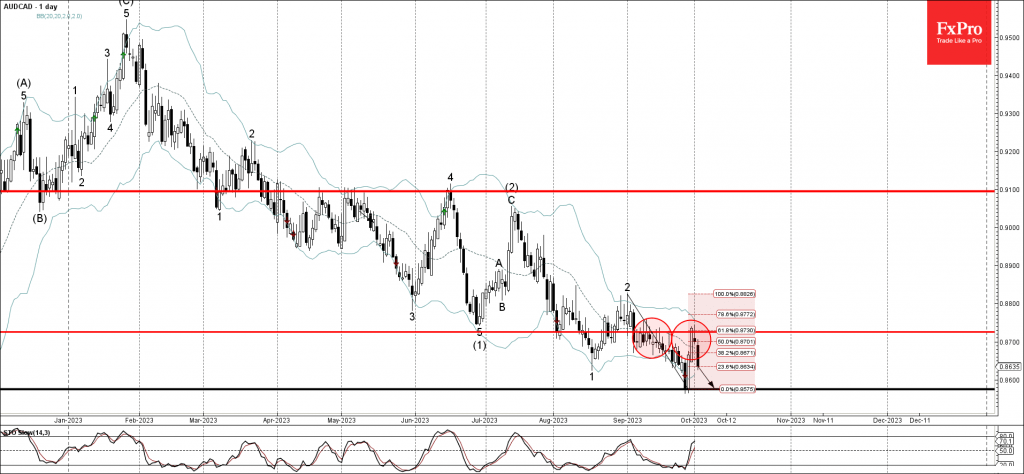
AUDCAD Wave Analysis
- AUDCAD reversed from resistance level 0.8725
- Likely to fall to support level 0.8575
AUDCAD currency pair recently reversed down from the pivotal resistance level 0.8725 (which has been repeatedly reversing the pair from the start of September) intersecting with the upper daily Bollinger Band and the 61.8% Fibonacci correction of the downward impulse from August.
The downward reversal from the resistance level 0.8725 continues the active downward impulse waves 3 and (3).
Given the clear daily downtrend, AUDCAD can be expected to fall further toward the next support level 0.8575 (previous monthly low from September).