

Sample Category Title
USD/JPY: JOLTS dollar pop likely triggered Japanese intervention
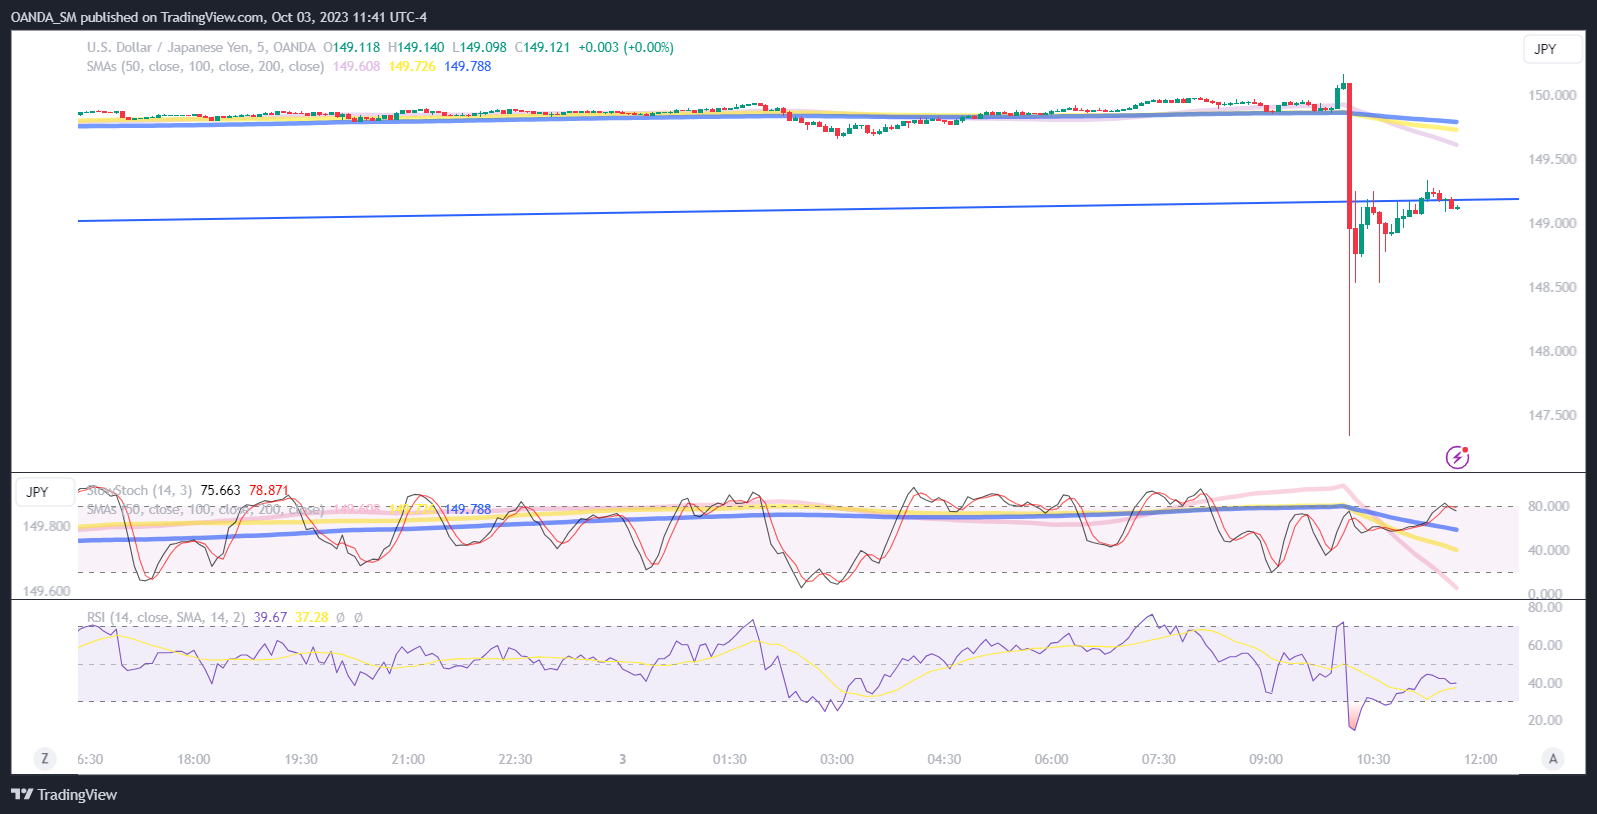
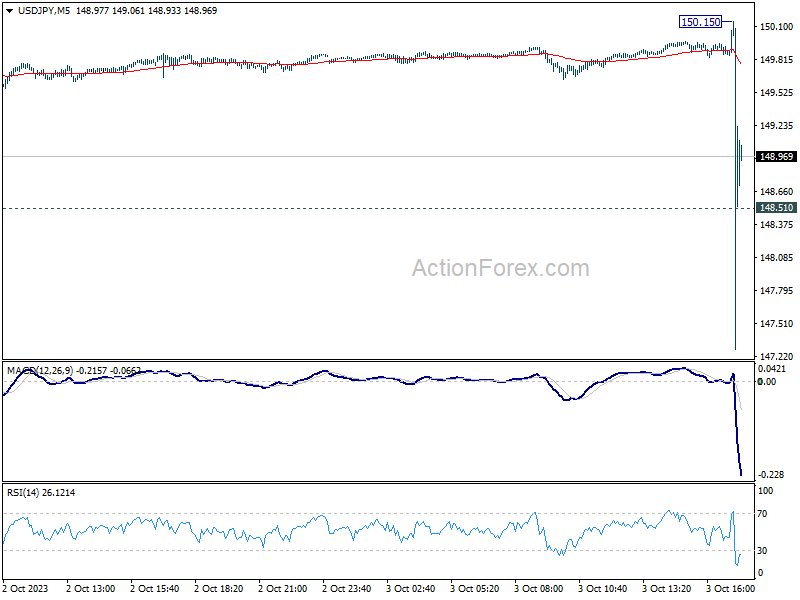
- USD/JPY fell 275 pips immediately after the JOLTS report sent price action above the 150 level
- Japan MOF Official: No comment on in Japan intervened with the yen
- JOLTS: August job openings rose from an upwardly revised 8.920 million to 9.610 million
The FX market was dealt a surprise after Japanese officials likely intervened after a hot JOLTS report sent dollar-yen above the 150 level. The other scenario, albeit unlikely, is that the dollar rally triggered a massive stop.
The two big levels that every FX trader had their eyes on were USD/JPY at 150 and 155. With NFP payrolls around the corner, some traders thought intervention would most likely wait until later in the week. The timing of this intervention will unlikely be confirmed in the NY session as it is very late in Tokyo.
The Ministry of Finance releases official intervention data at the end of the month, but we should not be surprised if they have a press event or if a key official comes out with a comment early in Asia. The Ministry of Finance will want to confirm the action and send a strong signal that they are not done with their intervention efforts.
USD/JPY Five-minute chart
USD/JPY pared losses after a Ministry of Finance official said no comment on whether Japan intervened.
Stocks
US stocks tumbled after Treasury yields surged after a hot JOLTS report signaled the labor market is not breaking. A cooling labor market was expected to emerge, but the August job openings data showed a large pickup with vacancies. Openings were strong in professional and business services, finance, insurance, education, and non-durables goods manufacturing. Unless, the NFP report comes in lower than expected, Wall Street will likely start to fully price in at least one more Fed rate hike before the end of the year.
Oil
Crude prices are lower on global economic fears and as the dollar continues to rally given the surge in Treasury yields. Energy traders are still not ready to buy the dip as the oil market starts to lose some of its tightness. The latest headlines are supporting further softness for oil. Russia’s seaborne crude flows reached a 3-month high. Nigeria’s oil minister said they could produce 2 million barrels per day next quarter, which would be almost twice of what they did in July.
Today’s weakness however is somewhat minimal as press reports are suggesting that OPEC+ won’t change their policy at the committee’s meeting on Wednesday.
A likely Japanese currency intervention may have also put a top in place for the dollar, which is providing oil some support.
Gold
Gold prices have found some support after plunging to a 7-month low. Treasury yields are still rising so gold’s respect of the $1830 level could become major support. The rally in yields could continue but we should see some exhaustion as Wall Street awaits the NFP report and ahead of a long weekend.
NZ Dollar Sliding, RBNZ Expected to Pause
- New Zealand dollar slides for a second successive day
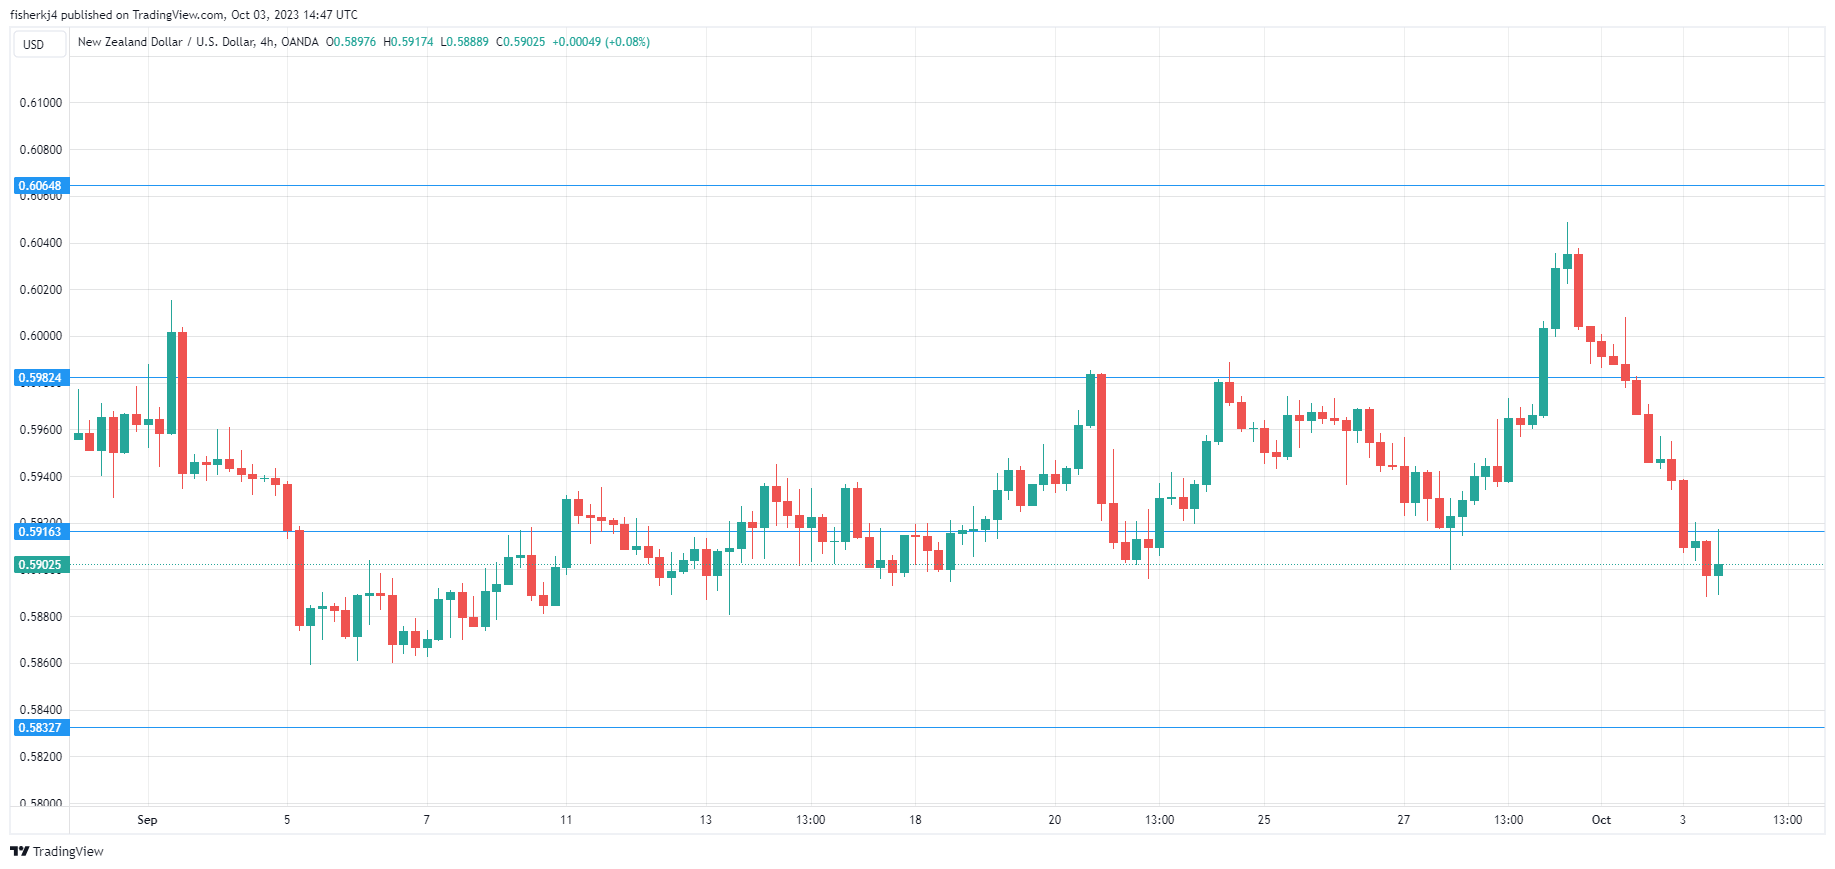
The New Zealand dollar is sharply lower for a second straight day. In the North American session, NZD/USD is trading at 0.5904, down 0.71%.
It has been an awful week so far for the New Zealand dollar, which is down 1.55%. NZD/USD tends to have a positive correlation with AUD/USD, which fell sharply today after the Reserve Bank of Australia held rates for a fourth straight time. That move was widely expected, but the Australian dollar is also getting squeezed by a strong US dollar and higher US Treasury yields and the pause hasn’t made the Aussie any more attractive to investors.
RBNZ expected to pause rates
The Reserve Bank of New Zealand follows with its rate decision on Wednesday and is expected to maintain the cash rate at 5.5%. If the RBNZ does pause, it would be for the third straight time and that could weigh on the New Zealand dollar, as was the case with the Australian currency which has fallen sharply today.
I don’t foresee RBNZ policy makers acknowledging that rates have peaked, but that will likely be the market’s take if the RBNZ does opts for a pause on Wednesday. With interest rates extremely high, households are groaning and the central bank would certainly want to provide a bit of relief by not tightening any further.
The primary problem for the RBNZ is of course inflation. The New Zealand economy is getting squeezed by weak domestic consumption and reduced global demand for exports. The central bank has projected a recession, and an end to tightening would be appropriate if it weren’t for inflation running at a 6% clip in the second quarter, double the upper band of the 1-3% target range. Inflation could decline more quickly as the economy cools, but the key question is how long the central bank is willing to wait for inflation to fall before hiking again.
NZD/USD Technical
- NZD/USD is testing support at 0.5916. The next support line is 0.5833
- There is resistance at 0.5982 and 0.6065
Silver Hopes for Some Recovery After Freefall
- Silver hits multi-month lows but bears look exhausted
- A bounce above 21 could improve sentiment
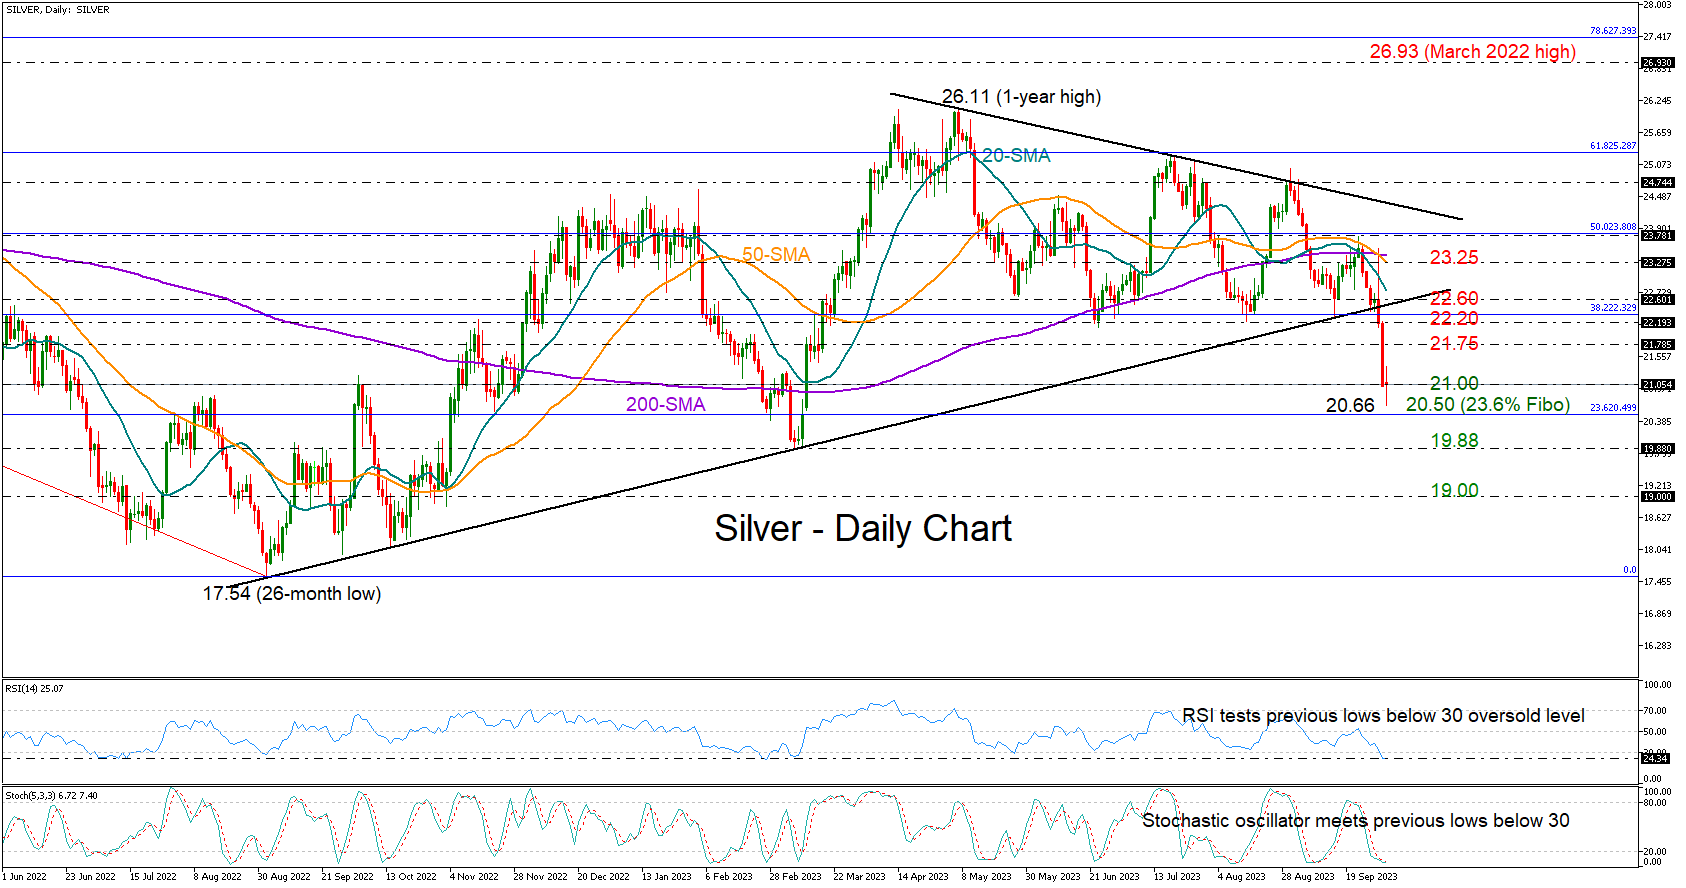
Silver extended Monday’s freefall to a seven-month low of 20.66 on Tuesday before turning slightly positive in the day during the early US trading hours.
The slump in the price preceded the close below the one-year-old support trendline, but the metal seems to be forming a long-legged hammer candlestick today, suggesting that the downfall could take a breather. The Stochastic and the RSI are testing their previous lows some distance below their oversold levels, embracing that scenario too. Yet, the bearish crosses between the simple moving averages (SMAs) are arguing that a bullish rotation could be short-lived.
The 23.6% Fibonacci retracement of the 30.07-17.54 downleg at 20.50 could also favor a pause of the prevailing downtrend in the near term. Should sellers drive lower, the March low of 19.88 could add a footing under the price, delaying any declines towards the 19.00 round level.
In the opposite scenario, where the price closes above the current resistance of 21.00, the bulls could head for the former resistance of 21.75. A continuation above this point could face some congestion within the 22.20-22.60 constraining zone, where the 38.2% Fibonacci mark and the broken support trendline are positioned. The 50- and 200-day SMAs could next block the way higher at 23.25.
All in all, silver seems to be waiting for some positivity after a week of declines. A sustainable bounce above 21.00 could feed buying interest.
Gold – Continues to Struggle Amid Hawkish Central Bank Warnings
- Gold eyeing a seventh consecutive decline?
- JOLTS job openings reinforce the view of a strong labor market
- Major technical support below if sell-off continues
Gold is on course to extend its losing run to seven sessions, with the yellow metal down around half a percent following the US JOLTS report.
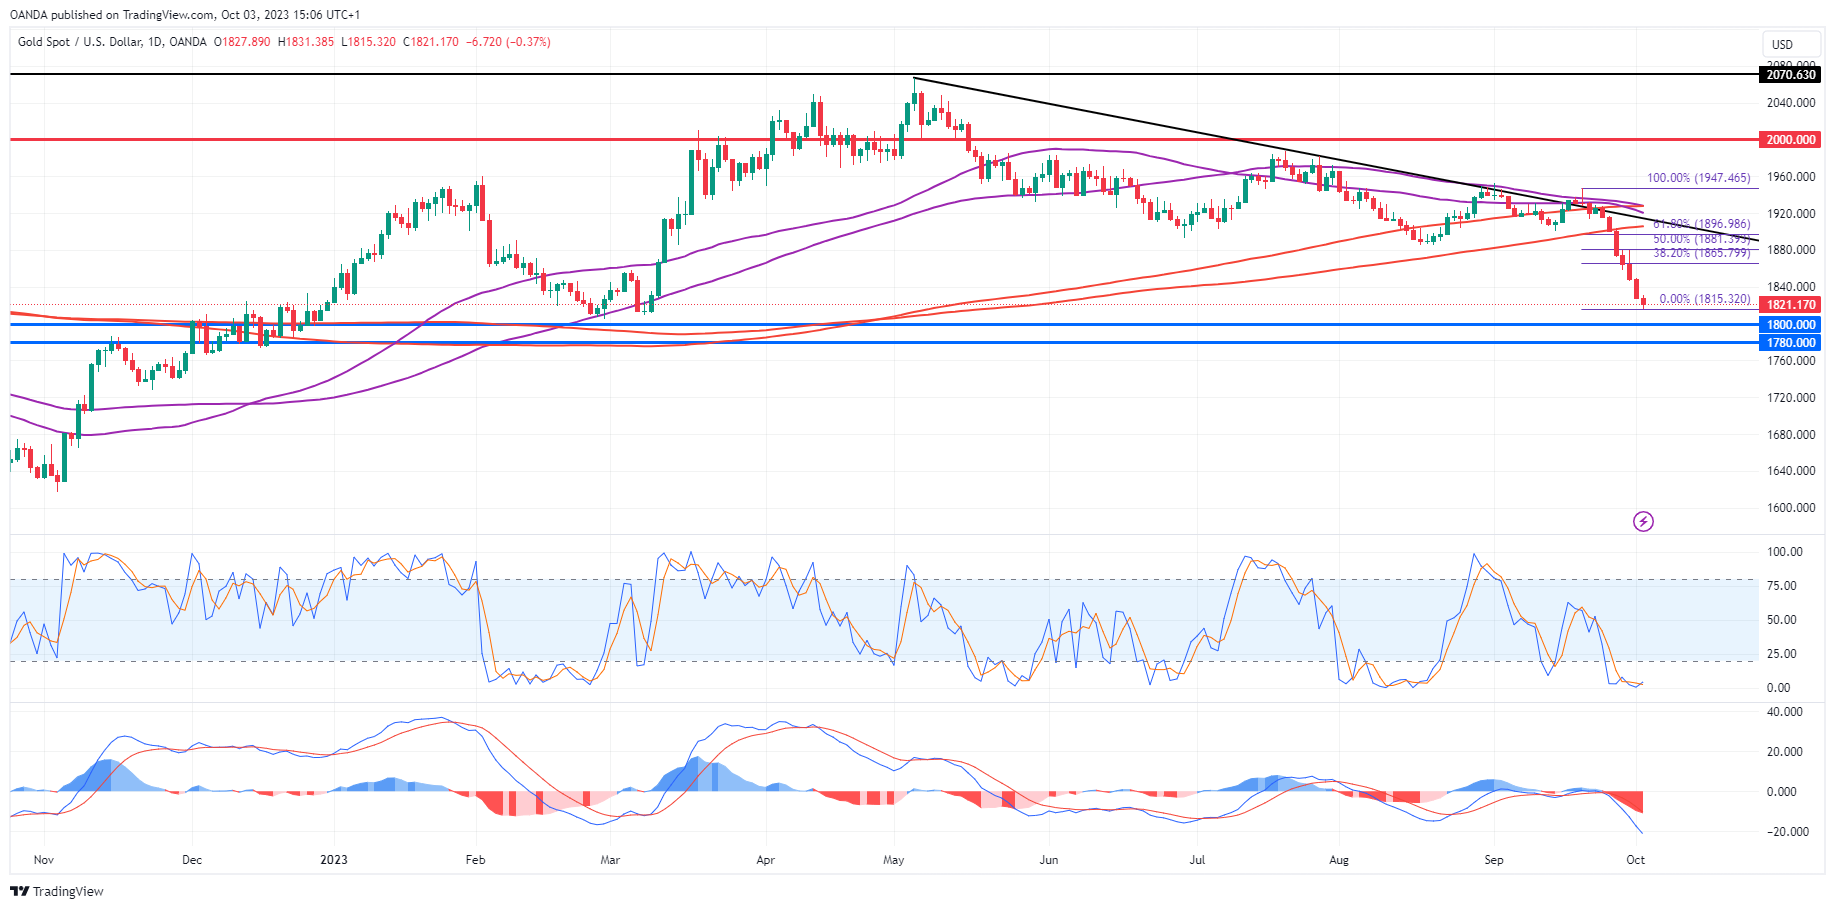
Rising bond yields have hammered gold prices recently which have fallen from $1,900 to near $1,800 remarkably fast. This will be the next test if the sell-off continues, with gold having rebounded strongly off this level back in February and March before rallying back toward record highs.
I’m not sure traders will be that confident of a repeat performance but it will be an interesting test amid some very hawkish central bank commentary. The price had recovered earlier in the day but a JOLTS report put an end to that, with the data further fueling the belief that the labor market remains extremely resilient, reinforcing the case for another Fed rate hike.
Strong momentum with the recent fall in gold
The chart doesn’t look great for gold, not just because of the scale of the recent decline but the momentum indicators look very bearish.
Source – OANDA on Trading View
That’s obviously unsurprising because of the nature of the selling this past week or so. What will be interesting now is, if we are seeing some reprieve, how deep it will be. A shallow recovery could reinforce the bearish view in gold as it nears what looks an important support zone around $1,780-$1,800.
$1,860 and $1,880 stand out as potential areas of resistance if we do see a move higher from here, not least because they fall around key fib levels – 38.2% and 50%.
Japan intervenes as USD/JPY hits 150, but nobody follows so far
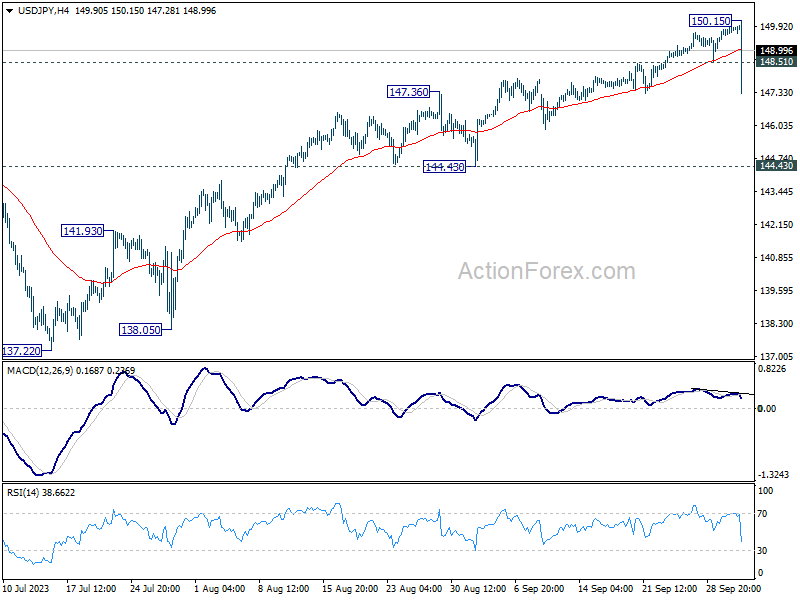
In a significant move, Japan finally took a decisive step to intervene in the currency markets after USD/JPY briefly surged past the 150 mark, reaching 150.15. A rapid dip followed, with the pair plummeting to 147.25 in a mere five minutes.
However, the pair's quick resurgence above 148 indicates a lack of speculative sell-off aligned with Japan's intervention, as well as resilience of Yen bears. Thus, it's premature to forecast a trend reversal.
In the coming days, eyes will be on the prospect of another approach towards the 150 mark, in response to US ISM services and non-farm payrolls. That's a point at which Japan may consider a second intervention. Then we'd know more about the determination of both sides.
The ascendancy of USD/JPY to 150.15 came on the back of robust US Job Openings and Labor Turnover Survey (JOLTS) data. The survey revealed 9.6 million job openings in August, a substantial increase from the revised 8.9 million in July. Furthermore, the rate at which employees quit their jobs, seen as an indicator of workers' confidence in job prospects, remained steady at 2.3%.
Purely from a technical point of view, near term outlook is neutral at worst as long as 144.43 support holds. While there might volatility, and choppy price actions, USD/JPY is just engaging in near term consolidations.
Fed’s Bostic: Slowing is happening, let it happen
Atlanta Fed President Raphael Bostic emphasized a patient approach in his remarks today, "I am not in a hurry to raise, I am not in a hurry to reduce either." His comments suggest a desire for stability and observation, even in the face of an economy that's showing signs of slowing down.
Delving deeper into the potential implications of the present policy rate, Bostic commented, "The current policy rate is starting to slow the economy down. How fast is it going to slow?"
Bostic's perspective revolves around a measured response, allowing economic forces to play out without rapid interventions. He emphasized, "Slowing is happening. Let's let it happen. Let's let the world move and let's be patient."
Sunset Market Commentary
Markets:
The market current is strong. Bearish sentiment on core bond markets is still name of the game with the long end of the curves underperforming as real rates push higher. It’s no different today with US yields adding another 0.5 bps (2-yr) to 6.5 bps (30-yr). Tenors of 5-y and more set fresh cycle tops. Atlanta Fed Bostic said that he’s not in a hurry to raise rates and not in a hurry to cut them. He just wants to hold them steady for a long time with policy automatically turning more restrictive as inflation comes down. Therefore, Bostic thinks that the US central bank can afford patience if inflation expectations remain steady. From a market point of view, it’s not about the finetuning of the Fed’s peak policy rate, but about the total period of time of peak rates. It’s the 5%+ message until end 2024 from the September meeting’s dot plot that ignited the latest sell-off bout with markets embracing the prospect of a higher neutral rate. The long end of the Germany yield curve follows the US with yields increased by 1.4 bps (10-yr) to 4.3 bps (30-yr). Front end yields are slightly lower (2-yr -2.6 bps). We didn’t see an immediate trigger and label early comments by ECB chief economist Lane as rather erring on the hawkish side. His base case is to maintain the current interest rate level for as long as needed while he downplayed the importance of the December 2023 policy meeting. He added a hawkish twist by saying that December isn’t the end of the inflation challenge, with March 2024 and even June 2024 seemingly “live” meetings as well. Lane believes that gas prices will go up from current levels, while oil prices already pose a problem. Energy is going to be a very important element to keep an eye on in coming months. Simultaneously wage increases are still quite high, leading Lane to conclude that there is still work to be done in terms of bringing inflation down. The dollar is the main beneficiary of the current market climate with the trade-weighted greenback setting a new YTD high at 107.22 and EUR/USD touching a fresh YTD low at 1.0460. USD/JPY clings in there at 149.91. Higher real rates pulled stock markets in a sell-on-upticks pattern with key European indices losing again up to and over 1%. Key US benchmarks opened with losses of about 0.5%.
News & Views:
The Turkish Statistical Office today reported September CPI inflation at 4.75% M/M and 61.53 Y/Y (from 9.9% M/M and 58.94% Y/Y in August). The Y/Y figure was the highest of the 2023 calendar year to be compared to a YTD low of 38,21% Y/Y in June. Core inflation (excluding unprocessed food, energy, beverages, tobacco and gold) also rose from 64.85% Y/Y to 68.93% Y/Y, even as the monthly pace of price growth slowed from 9.32% to 5.06%. Headline inflation was as expected, but core was above expectations. A sharp rise in education costs (30.27% M/M) caught the eye. Transportations costs added 4.35% in a monthly perspective. In a Y/Y perspective, food prices increased by 75.14 %, transportation by 76.06%, health by 78.79%, education by 80.96% and hotels, cafes and restaurants by 92.48%. The rather modest monthly price rises give some hope that inflationary dynamics might gradually slow, but the weak lira and higher oil prices pose upside risks. The CBRT its policy rate from 8.5% to 30% over the past months. Additional tightening is expected on October 26. The Turkish lira (USD/TRY 27.50) today touched a new all-time low.
Swiss inflation printed softer than expected in September. Headline inflation declined 0.1% from August causing a smaller than expected raise in the Y/Y measure from 1.6% to 1.7%. Core inflation declined a similar 0.1% M/M with the Y/Y price increase easing from 1.5% to 1.3%. According to the Swiss statistical office (FSO), the monthly decrease amongst others is due to lower prices for hotels and supplementary accommodation. Air fares and prices for domestic and international package holidays also fell. In contrast, prices for leisure-time courses, fuels and heating oil increased, as well as those for clothing and footwear. Services price decreased -0.3% M/M and were only 1.5% higher compared to the same month last year. Goods prices rose 0.2% M/M and 2% Y/Y. The Swiss national Bank left its policy rate unchanged at 1.75% two weeks ago, but kept the door open for some additional tightening as it expected inflation to return to the 2% ‘ceiling’ by the end of this year and to even slightly surpass the level in 2024. The jury is still out, but the September data, if confirmed, give the SNB some additional room to wait and see. The Swiss franc reversed yesterday’s strengthening, with EUR/CHF jumping from the 0.962 area to 0.967.
BoC’s Vincent cautions on new business pricing behavior and persistent inflation
BoC's non-executive Deputy Governor, Nicolas Vincent, provided a closer look into the challenges Canada faces concerning inflationary pressures, specifically highlighting the direct correlation between businesses' price setting patterns and the persistent nature of inflation.
Vincent noted in a speech, despite some progress, "the downward path of inflation over the past year has been slower than anticipated. Inflation has proven to be stickier than many expected."
Explaining the backdrop, Vincent highlighted that firms, during their recovery phase post-pandemic, faced "a rapid increase in their costs as well as high demand for their products and services". This spurred an amplified response from firms in terms of pricing - adjusting their prices more frequently and in larger increments than was the norm. "
He accentuated the potential implications of these new pricing strategies, stating they are "intimately linked to the stronger-than-expected inflation we've seen."
He cautioned, "if recent pricing behaviour settles into a new normal, it could complicate our return to low, stable, and predictable inflation."
Ethereum: Unable to Rally as New Future ETFs Volumes Disappoint
- Cryptos struggle as relentless Treasury selloff continues; 10-year yield rises 5.2bps to 4.731%
- Proshares Ethereum ETF (EETH) traded only 21,000 shares
- VanEck’s Ethereum Strategy ETF (EFUT) traded only 29,000 shares
Over the past several months the focus in the cryptoverse has been on whether the SEC will approve a spot Bitcoin ETF. Hampered by SEC delays, sentiment for cryptos have struggled immensely, especially given the chaos sparked by the bond market.
Sentiment could be improving given the SEC has just approved a handful of Ether futures ETFs. Bitcoin future ETFs already exist, but the SEC decision to give approval to Ethereum is somewhat news considering it has always been thought as a bigger risk to getting the security tag.
Ethereum posted a nice rally to start the week following the ETF launches done by Valkyrie, VanEck, Proshares, and Bitwise. The massive Ethereum ETF launch was to make sure everyone had a fair chance, which is what not happened a couple years ago for Bitcoin when BITO launched alone and dominated the ETF market share.
Ethereum Daily Chart
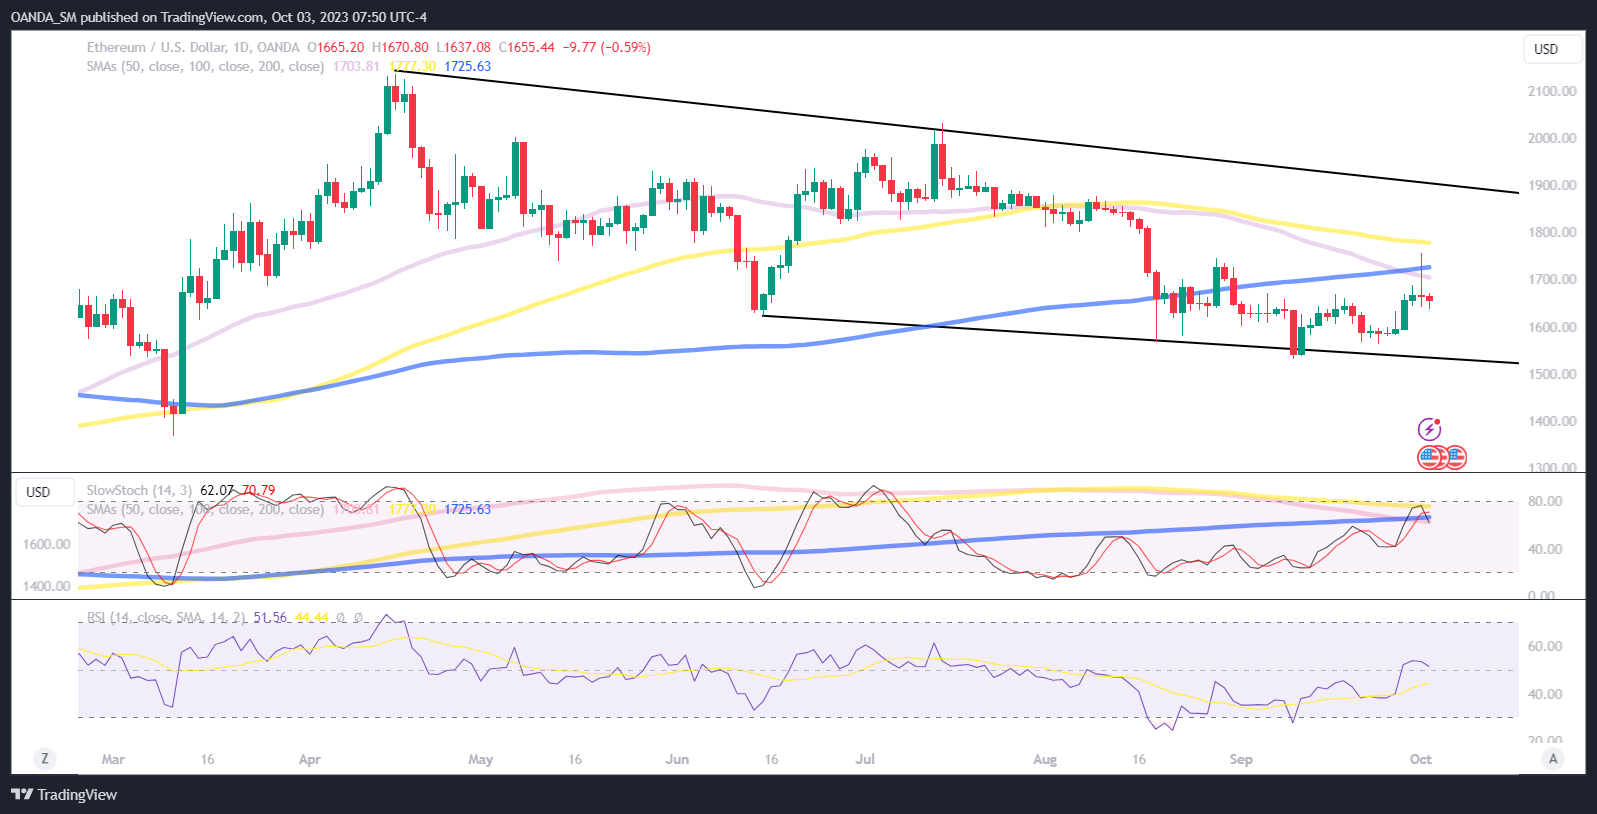
Ethereum’s Monday pump was faded on both disappointing ETF trading volumes and as prices quickly respected a confluence of resistance from the 50- and 200-day SMA. The death cross that formed at the end of August saw bearishness tentatively exhausted after making a low at $1531 on September 11th.
Ethereum could start attracting more interest once price closes above the $1810 level. Ethereum’s more diversified blockchain ecosystem has yet to trigger a gamechanger for the use-case argument for cryptos, but optimism remains that some of its products and offerings are driving the majority of the interest. If bearishness resumes, downside targets include $1510, which is the 50% retracement of the 2022 low to 2023 high move.