Sample Category Title
NZDUSD Gets Rejected, But Bulls Might Try Again
- NZDUSD hovers near 10-month low
- A close above 20-day SMA needed
- Hopes for upside reversal remain
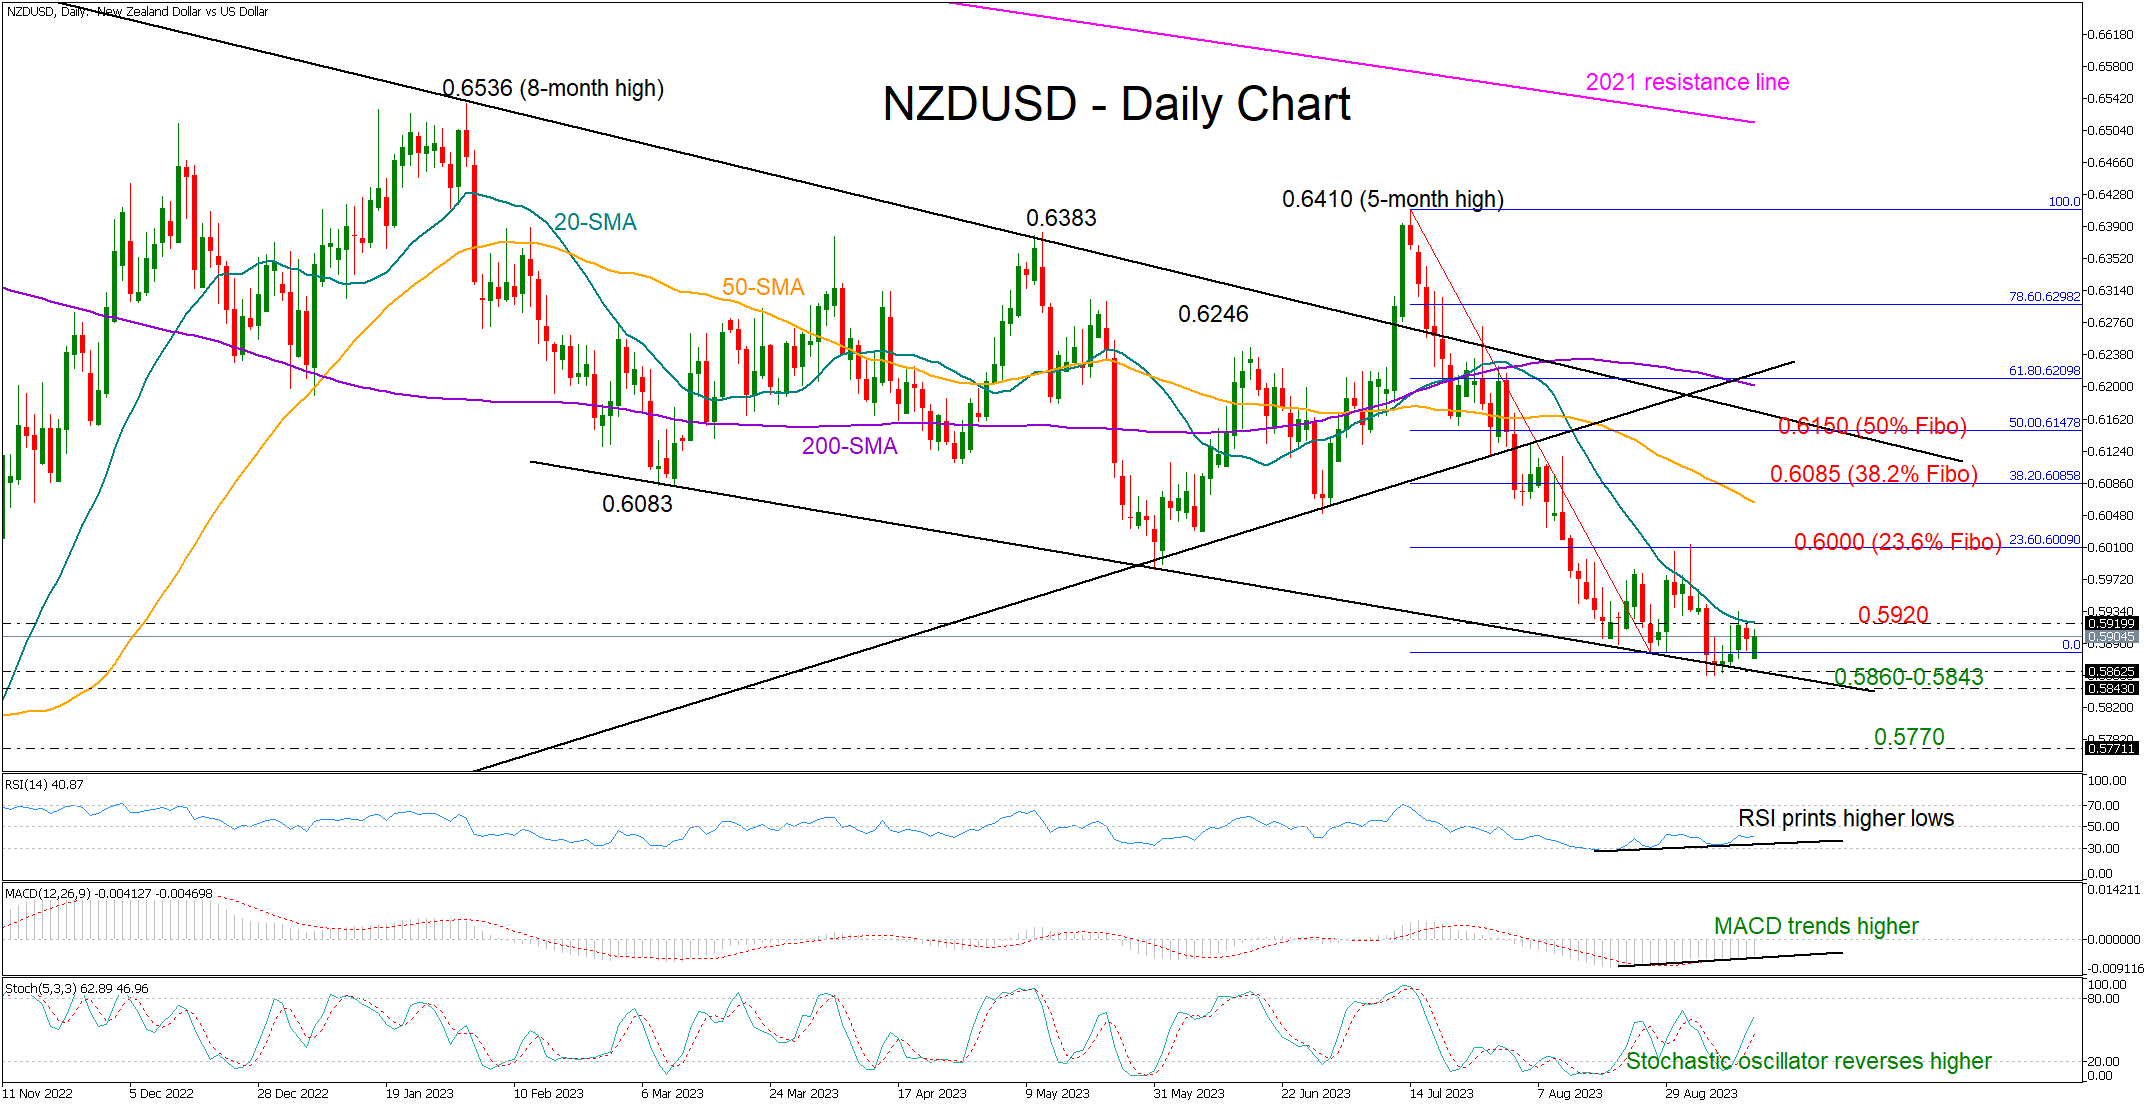
NZDUSD is unable to go beyond its 20-day simple moving average (SMA) even after persistently attempting to rebound around the falling support line from March 2023.
The pair registered a ten-month low of 0.5884 last week, but there is some growing optimism that the bulls may take the lead soon. The RSI seems to be trending against the market, creating higher lows below its 50 neutral mark. Likewise, the stochastic oscillator has changed course to the upside, while the MACD is recovering within the negative zone and above its red signal line.
Nevertheless, buyers would like to see a close above the 20-day SMA at 0.5920 before lifting the price straight up to the 0.6000 psychological mark. This is where the 23.6% Fibonacci retracement of the ongoing downtrend is placed. Hence, a clear move higher could add more fuel to the price, bringing the 50-day SMA next into view at 0.6060. If the 38.2% Fibonacci mark of 0.6085 gives way too, the rally could pick up steam towards the 50% Fibonacci of 0.6150, where the descending trendline stretched from the 2022 top is placed.
If the bears step below the support line and the 0.5860-0.5840 area, the downtrend could gain another leg to 0.5770. A move lower could retest the November 2022 low of 0.5739 ahead of the crucial 2020 base of 0.5670.
All in all, despite its negative trajectory, NZDUSD keeps trading around an important support trendline, maintaining hopes for an upside reversal.
BTCUSD Dodges Selloff Despite Death Cross Completion
- Bitcoin hovers within 25,000-26,000 range in September
- Rebounded after posting fresh low just shy of June bottom
- Death cross points to more losses but momentum indicators diverge
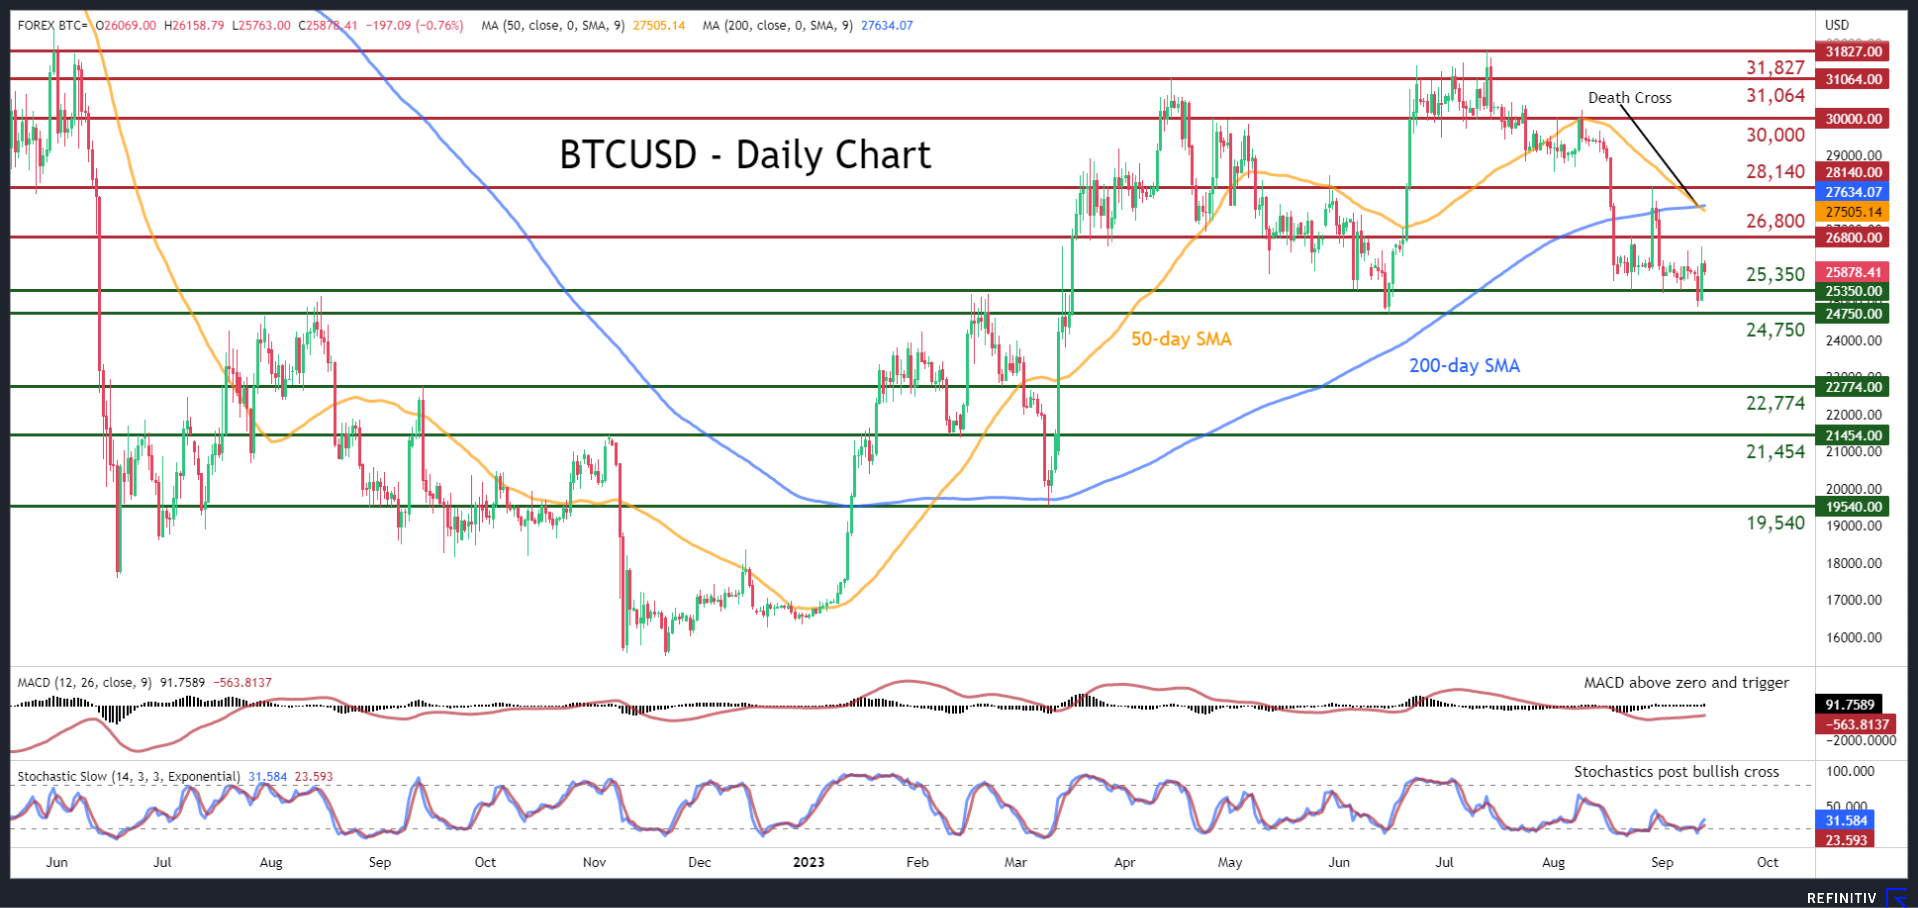
BTCUSD (Bitcoin) has been trading without clear direction in the short term but extended its structure of lower lows. Interestingly, the completion of a death cross between the 50- and 200-day simple moving averages (SMAs) did not trigger a decline, with the short-term oscillators currently tilting to the bullish side.
If buying interest intensifies, the king of cryptos could initially test the August resistance of 26,800, a region that also provided support in March. A jump above that zone may pave the way for the 28,140 hurdle. Even higher, the crucial 30,000 psychological mark could prove to be a tough one for the price to overcome.
On the flipside, bearish actions could send the price to challenge 25,350, which held its ground three times in August and September. Piercing through that wall, the digital coin might then descend towards the June bottom of 24,750. Further retreats could then come to a halt at the 22,774 resistance territory, which could serve as resistance in the future.
Overall, BTCUSD remains stuck in a range amid diverging technical signals. Nevertheless, a break below the June bottom of 24,750 could be the starting point of a fresh downleg.
Swiss Franc Shines Bright, But Will SNB Clip Its Wings?
- Stellar year for Swiss franc, tied for best-performing major currency
- End to negative rates, FX interventions, and safety flows helped
- Next week's SNB decision and risk tone could decide franc's fate
Flying under the radar
Even though it hasn't attracted many headlines, the Swiss franc has gone on a silent winning streak. It is virtually tied with the British pound as the top-performing currency of this year, while it has gained more than 3% against both the US dollar and the euro. Against the bruised Japanese yen, the franc has appreciated by around 15%, pushing the franc/yen cross to new record highs.
Several elements lie behind this impressive performance. First and foremost has been the Swiss National Bank's exit from negative interest rates. With the central bank raising rates back into positive territory, global depositors are no longer penalized for parking their cash in Switzerland.
Direct FX interventions have also played a role. The SNB has been active in the currency market for a long time, but last year it flipped from a net-seller of francs to a net-buyer, in an attempt to strengthen the currency and exert downward pressure on imported inflation.
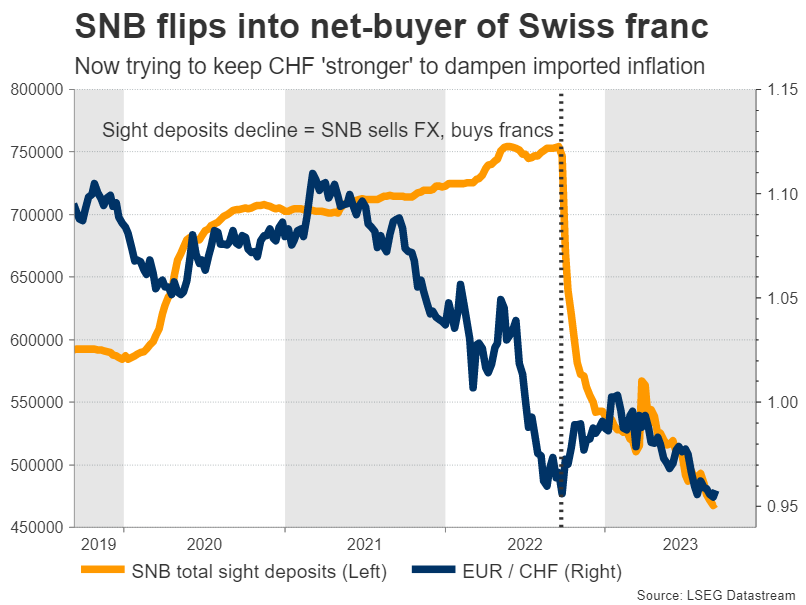
This can be seen through sight deposits at the SNB, which are considered a proxy for foreign currency purchases. Sight deposits have fallen sharply over the past year, revealing that the central bank has been actively selling foreign currencies and buying francs on the open market.
A quiet flight to safety likely helped the franc too. Because of Switzerland's chronic current account surplus, the franc often acts like a safe haven instrument, especially when the Eurozone economy encounters trouble. With business surveys warning the Eurozone is headed for a mild recession, this dynamic probably came into play.
What's next? All eyes on SNB
Looking ahead, there are both positives and negatives on the horizon. Arguing in favor of further franc gains is the worsening economic data pulse in Europe and China, which might continue to fuel safe-haven flows.
Any correction in high-flying US stock markets could have similar effects. That's a real risk considering that equity valuations are stretched, earnings have been stagnant for three quarters now, and bond yields are trading near their highest levels of this cycle.
However, the Swiss economy has also started to lose steam, which in turn might give the SNB cold feet. In the second quarter, GDP growth was running at just 0.5% from a year ago, slowing down sharply as the stronger franc dampened demand for exports and capital investments stalled.
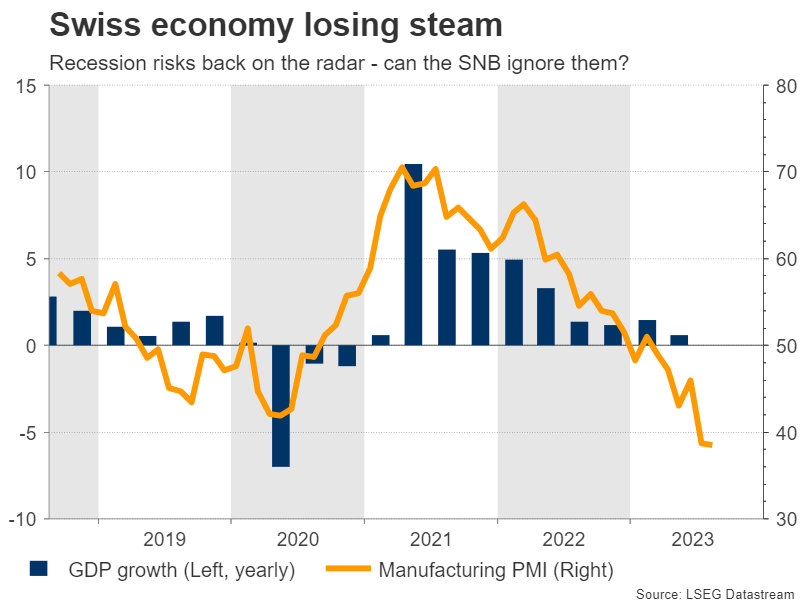
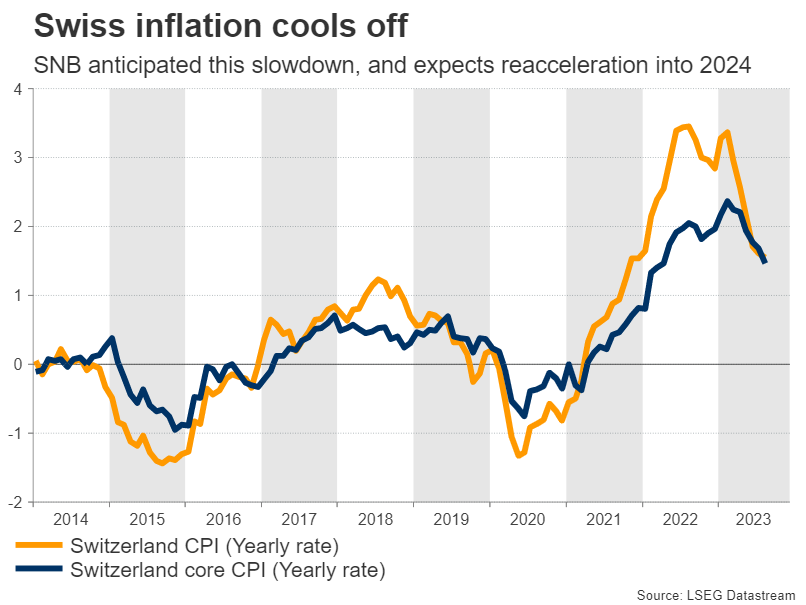
Similarly, inflation has cooled off. The yearly CPI rate clocked in at 1.6% in August, staying below the central bank's 2% target for a third month. That said, the SNB anticipated this cooldown in its latest forecasts and still maintained a tightening bias, warning that inflation would reaccelerate next year because of higher electricity and rent prices.
Therefore, the immediate question facing the franc is whether the SNB will raise rates next week. Growth is losing power and recession risks cannot be ignored based on global trends, but at the same time, the recent spike in energy prices could make the SNB even more concerned about stubborn inflationary pressures.
That leaves the SNB with a difficult choice: keep rates unchanged to safeguard economic growth or raise them to eradicate inflation? Market pricing is currently leaning towards no action, assigning a 60% probability for the SNB to pause next week versus 40% for another rate hike.
Whether the European Central Bank raises rates on Thursday will be a key variable in this decision. The SNB usually follows in the ECB's footsteps, mimicking the moves of its larger neighbor so that interest rate differentials don't widen too much and put pressure on exchange rates.
Speaking of exchange rates, the SNB's stance on FX interventions needs to be monitored closely. For now, the SNB is buying francs to dampen imported inflation, but that could change if inflation doesn't reaccelerate. It's probably too early for such a shift next week, but it's a clear risk moving forward.
Big picture
Blending it all together, the franc's fortunes will be tied mostly to FX interventions and the global economy. With global growth slowing while the SNB continues to boost the franc through interventions, the near-term landscape seems favorable, even if there is a setback next week in case the SNB holds rates steady.
That said, the franc's performance will also depend on the currency it is matched against. For instance, the franc could outperform the growth-starved euro, and might also outshine the yen, which has been decimated by Japan's refusal to abandon negative rates.
The catch is that the franc might struggle to record any further gains against the US dollar, which is backed both by a resilient economy and safe-haven qualities. A period of risk aversion in global markets would benefit both currencies, so the deciding factors might be interest rate and growth differentials, which seem to favor the dollar.
USDJPY Edges Higher, Very Close to its 2023 High
- USDJPY bulls remain in control despite intervention rumours
- Momentum indicators are not supportive of the bulls’ intentions
- Could the bears stage a move towards the 144.99 area?
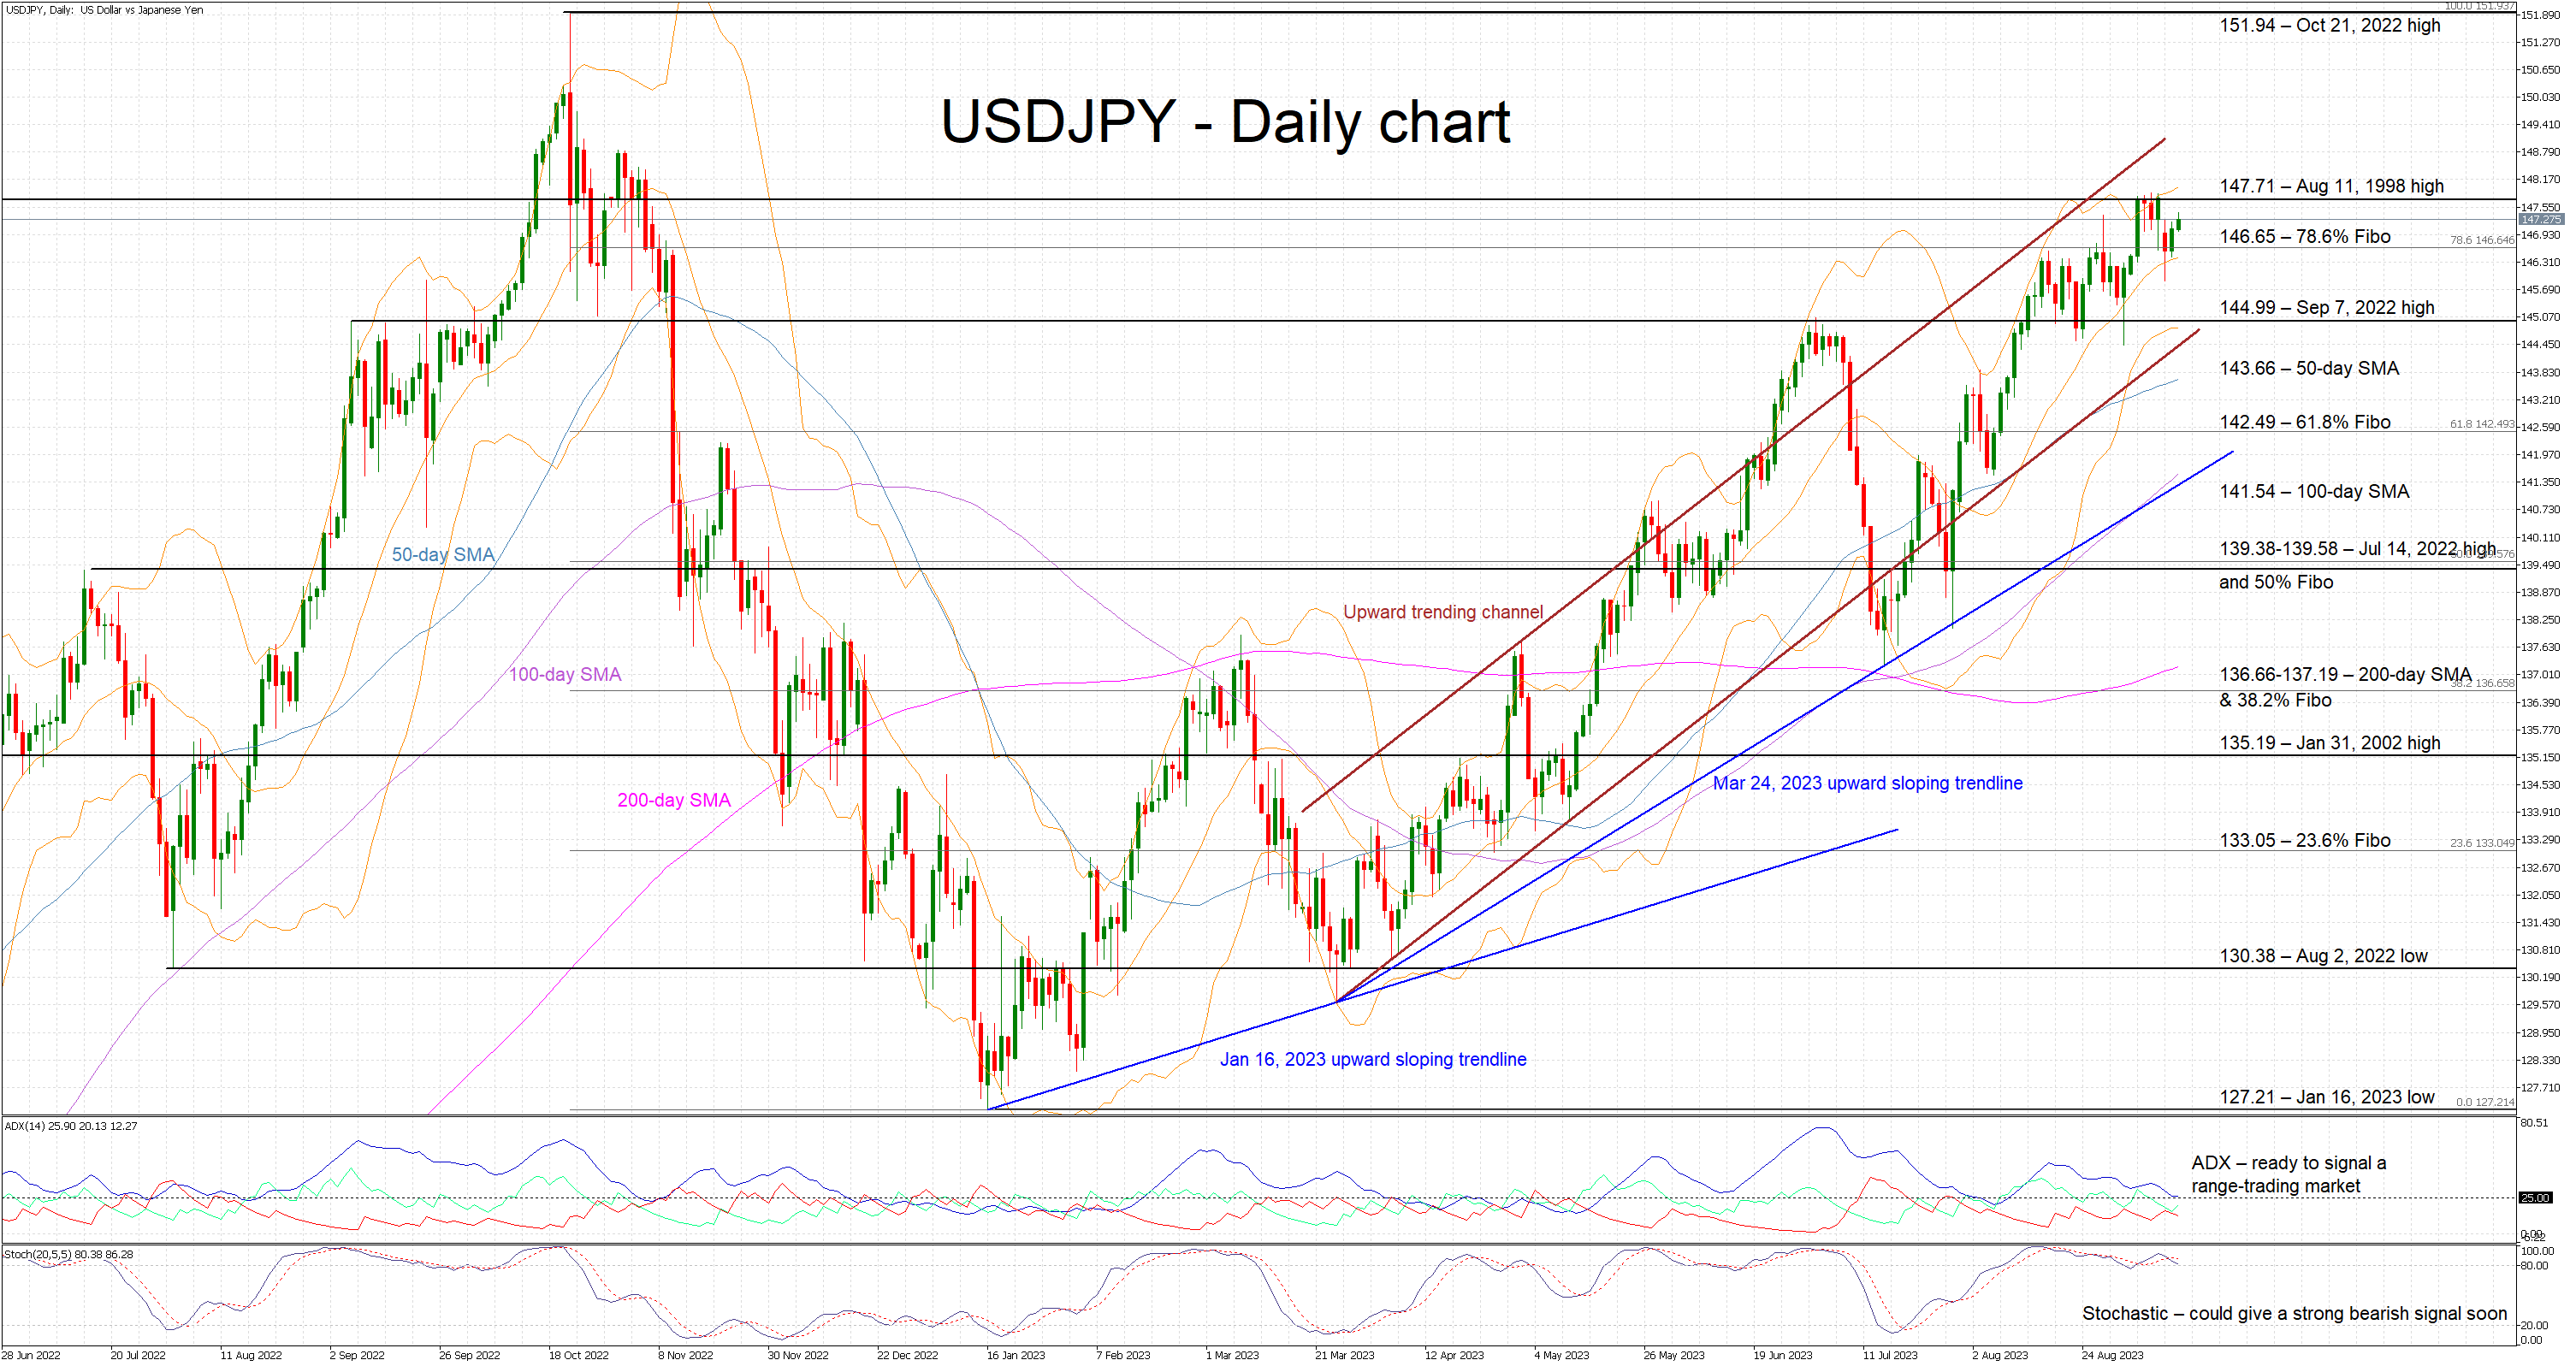
USDJPY remains a tad below its 2023 high as the bullish pressure continues unabated. The market appears to be testing the Japanese Finance Ministry's nerves. In the meantime, the momentum indicators are mixed. Specifically, the Average Directional Movement Index (ADX) is pointing to a very muted and weak bullish trend. More importantly, the stochastic oscillator continues to hover in its overbought (OB) territory but appears ready to move lower.
If the stochastic drops aggressively below its OB level, building a good gap from its moving average, the bears could attempt a pullback. They could try to push USDJPY below the 78.6% Fibonacci retracement of October 21, 2023 - January 16, 2023 downtrend at 146.65, and towards the September 7, 2022 high at 144.99 and the lower boundary of the upward sloping trend channel respectively. Even lower, the 50-day simple moving average (SMA) at 143.66 and the 61.8% Fibonacci retracement at 142.49 could test the real strength of the downleg.
On the flip side, the bulls are probably keen on keeping USDJPY at the current elevated levels, potentially risking a potent reaction from the Japanese authorities. Should they manage to overcome the 147.71 level, the path appears to be unhindered until the October 21, 2022 high at 151.94.
To sum up, the USDJPY bulls remain in control, but the stochastic oscillator could give the bears the necessary excuse to stage a short-term pullback with 144.99 being the main target level.
GBP/USD: Sterling Hit Further by Weak UK GDP Data, But Key Support Still Holds
GBPUSD was down over 40 pips this morning in immediate reaction to weaker than expected UK GDP data.
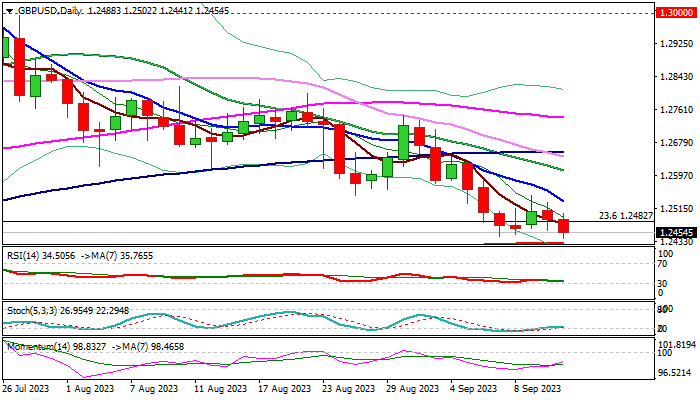
The price fell to the lowest in more than three months, attempting to break out of the recent four-day consolidation and pressuring pivotal 200DMA support.
The data released earlier this morning showed that Britain’s economy contracted at the fastest pace in 2023 (GDP m/m July -0.5% vs 0.5% in June and -0.2% f/c; annualized 0.0% July vs 0.9% in June).
Downbeat GDP numbers further sour the sentiment after labor data on Tuesday also fell below expectations, adding to concerns as Bank of England holds its policy meeting next week.
Weaker than expected numbers from key sectors of the UK economy are blow to hawks who advocate for more rate hikes (BOE is expected to deliver 25 basis points hike next week) though the policymakers could argue their expected decision by strong wage growth which will continue to fuel inflation (currently at 6.8% and the highest in the group of the most developed economies).
Technical picture on daily chart remains negative and fresh bearish signal is developing on 4-hr chart (Ichimoku cloud is above the price and thickening, Tenkan-sen crossed below Kijun-sen and 14-period momentum broke into negative territory).
However, bears continue to face increased headwinds from 200DMA (1.2430), which may continue to limit the downside, as markets probably look for further signals, focusing on US inflation report for August, due later today.
Res: 1.2482; 1.2534; 1.2547; 1.2608.
Sup: 1.2430; 1.2391; 1.2368; 1.2307.
EUR/USD Attempts Recovery, USD/CHF Faces Uphill Task
EUR/USD started a recovery wave above the 1.0715 resistance. USD/CHF is struggling to clear the key 0.8940 resistance zone.
Important Takeaways for EUR/USD and USD/CHF Analysis Today
- The Euro gained pace after it broke the 1.0705 resistance against the US Dollar.
- There is a major bullish trend line forming with support near 1.0715 on the hourly chart of EUR/USD at FXOpen.
- USD/CHF is consolidating gains below the 0.8940 resistance.
- There is a connecting bearish trend line forming with resistance near 0.8930 on the hourly chart at FXOpen.
EUR/USD Technical Analysis
On the hourly chart of EUR/USD at FXOpen, the pair started a recovery wave from the 1.0685 level. The Euro even cleared the 1.0715 barrier to move into a short-term bullish zone against the US Dollar.
The bulls pushed the pair above the 50-hour simple moving average and 1.0735. Finally, the pair tested the 1.0760 resistance. It is now consolidating gains below the 23.6% Fib retracement level of the upward wave from the 1.0705 swing low to the 1.0764 high.
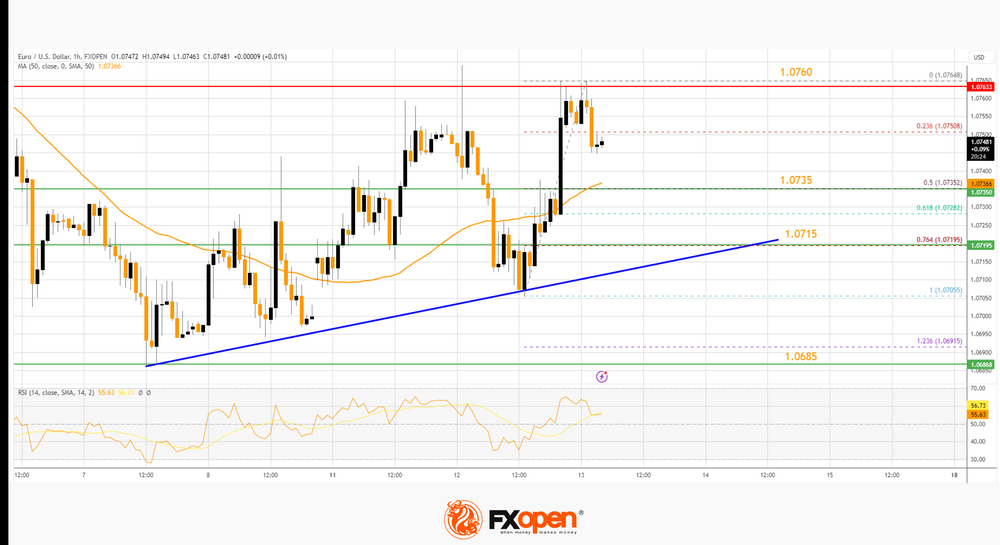
Immediate support on the downside is near the 50-hour simple moving average at 1.0735. The next major support is near a bullish trend line at 1.0715.
The trend line is close to the 76.4% Fib retracement level of the upward wave from the 1.0705 swing low to the 1.0764 high. A downside break below the 1.0715 support could send the pair toward the 1.0685 level.
Immediate resistance on the EUR/USD chart is near the 1.0760 zone. The first major resistance is near the 1.0780 level. An upside break above the 1.0780 level might send the pair toward the 1.0850 resistance.
The next major resistance is near the 1.0920 level. Any more gains might open the doors for a move toward the 1.1000 level.
USD/CHF Technical Analysis
On the hourly chart of USD/CHF at FXOpen, the pair started a fresh increase from the 0.8830 zone. The US Dollar climbed higher steadily above the 0.8888 and 0.8900 resistance levels against the Swiss Franc.
There was even a move above 0.8900 but the bears remained active near the 0.8940 level. The pair made a couple of attempts to clear 0.8940 but failed. A high was formed near 0.8944 and the pair is now consolidating gains.
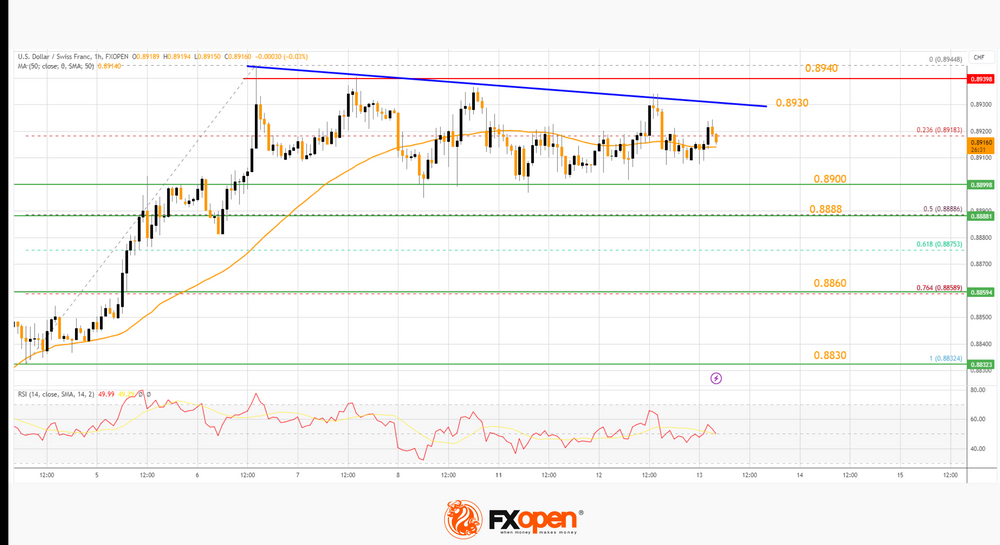
There was a move below the 23.6% Fib retracement level of the upward wave from the 0.8832 swing low to the 0.8944 high.
On the downside, immediate support on the USD/CHF chart is near the 50-hour simple moving average at 0.8915. The first major support is near the 0.8900 level. The next major support is near the 50% Fib retracement level of the upward wave from the 0.8832 swing low to the 0.8944 high at 0.8888.
Any more losses may possibly open the doors for a move toward the 0.8830 level in the coming days. On the upside, the pair could face resistance near a connecting bearish trend line at 0.8930.
The next major resistance is near the 0.8940 level. If there is a clear break above the 0.8940 resistance zone, the pair could start another increase. In the stated case, it could even surpass 0.9000.
This article represents the opinion of the Companies operating under the FXOpen brand only. It is not to be construed as an offer, solicitation, or recommendation with respect to products and services provided by the Companies operating under the FXOpen brand, nor is it to be considered financial advice.
Sterling Slides After GDP Data as Odds of BoE Hold Next Week Slightly Improve
The UK economy contracted faster than expected in July which is weighing on the pound this morning.
GDP fell 0.5%, much faster than the 0.2% contraction that was expected, but as has been the case throughout this year, one-off factors played a big role. Strikes and the weather were largely blamed for the steep decline although some are clearly worried that overall momentum in the economy remains weak.
I'm not sure the data will really sway the Bank of England at all next week. Not against the backdrop of such strong wage growth, as was reported yesterday. Markets are now pricing in a rate hike at around 75% which seems overly cautious to me but then, perhaps Bailey's words last week are continuing to ring in the ears of traders.
The Governor and his colleagues indicated the discussion will be more balanced than people seem to think which suggested a hold is very much on the table this month. That seems a little far-fetched at this stage and I think the words are probably intended for a little further down the line in November but then it wouldn't be the first time the BoE has surprised us. That said, it also wouldn't be the first time they've hinted at something and not followed through.
GBP/JPY Daily Outlook
Daily Pivots: (S1) 183.15; (P) 183.54; (R1) 184.14; More...
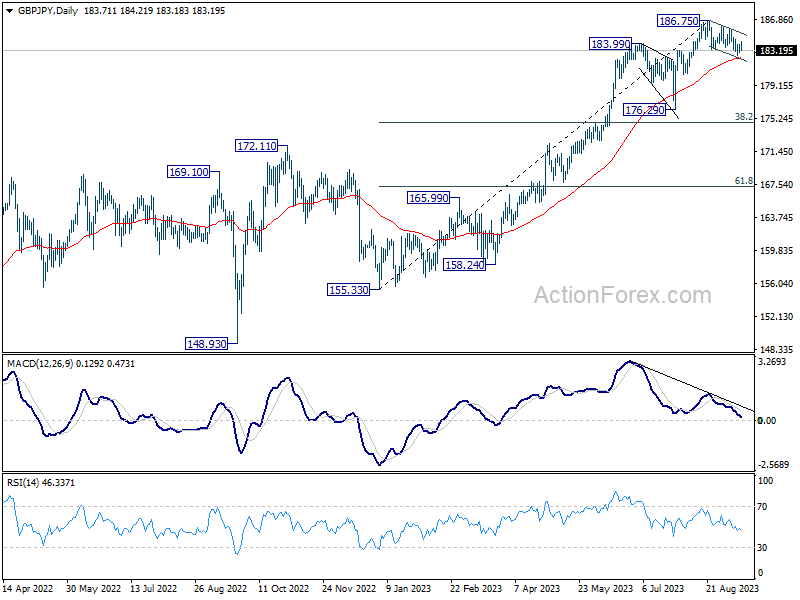
Despite loss of downside momentum, further decline is expected in GBP/JPY as long as 185.67 resistance holds. Next target is 55 D EMA (now at 182.31). Sustained break there will argue that it's already in a larger scale correction and target 176.29 support next. On the upside, break of 185.67 resistance will indicate that the pull back from 186.75 has completed. Further rise should then be seen through 186.75 to resume larger up trend.
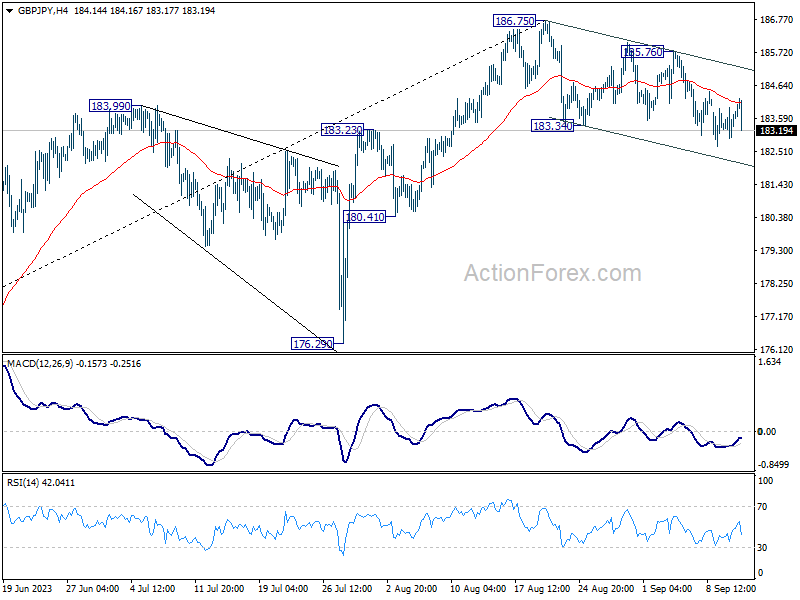
In the bigger picture, up trend from 123.94 (2020 low) is in progress. Next target is 195.86 (2015 high). This will remain the favored case as long as 176.29 support holds, even in case of deeper pull back.
EUR/JPY Daily Outlook
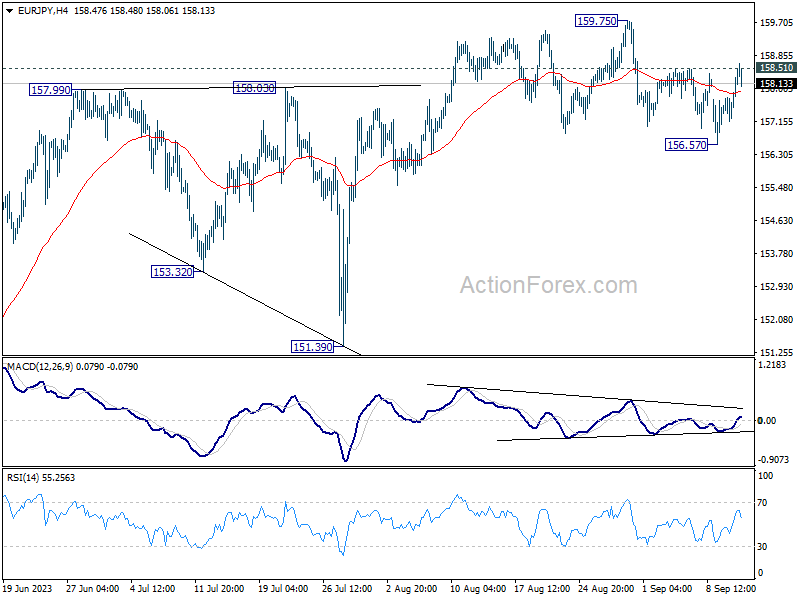
Daily Pivots: (S1) 157.48; (P) 157.89; (R1) 158.58; More....
Intraday bias in EUR/JPY is turned neutral with current recovery. On the upside, firm break of 158.51 will argue that larger up trend is ready to resume through 159.75, to 163.06 projection target. On the downside, sustained trading below 55 D EMA (now at 156.68) will argue that fall from 159.75 is a larger scale correction. Deeper fall would be seen back towards 151.39 support.
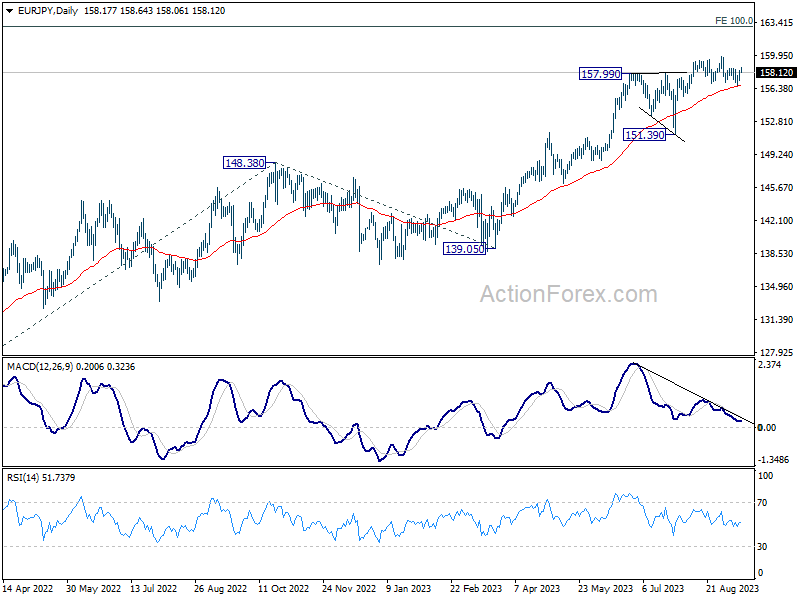
In the bigger picture, rise from 114.42 (2020 low) is in progress. Next target is 100% projection of 124.37 to 148.38 from 139.05 at 163.06. Sustained break there will pave the way to retest long term resistance at 169.96. This will remain the favored case as long as 151.39 support holds, even in case of deep pull back.
EUR/GBP Daily Outlook
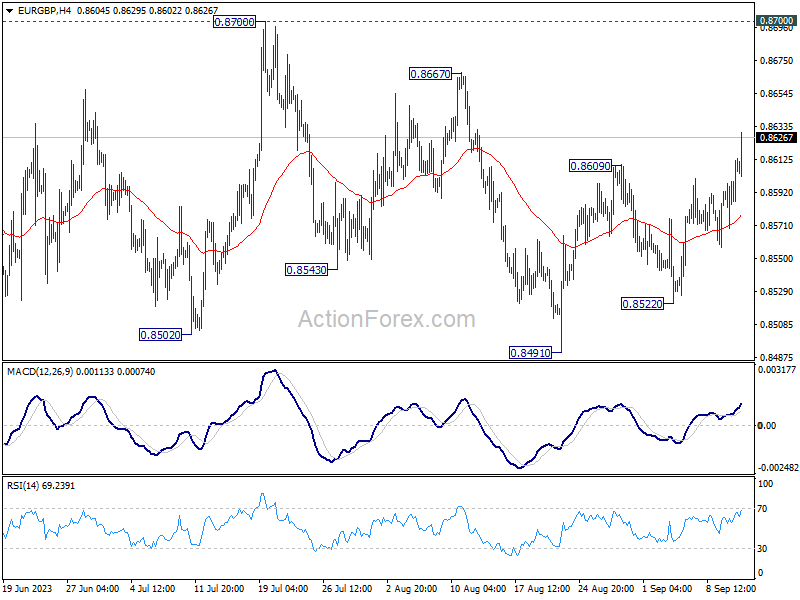
Daily Pivots: (S1) 0.8582; (P) 0.8598; (R1) 0.8624; More...
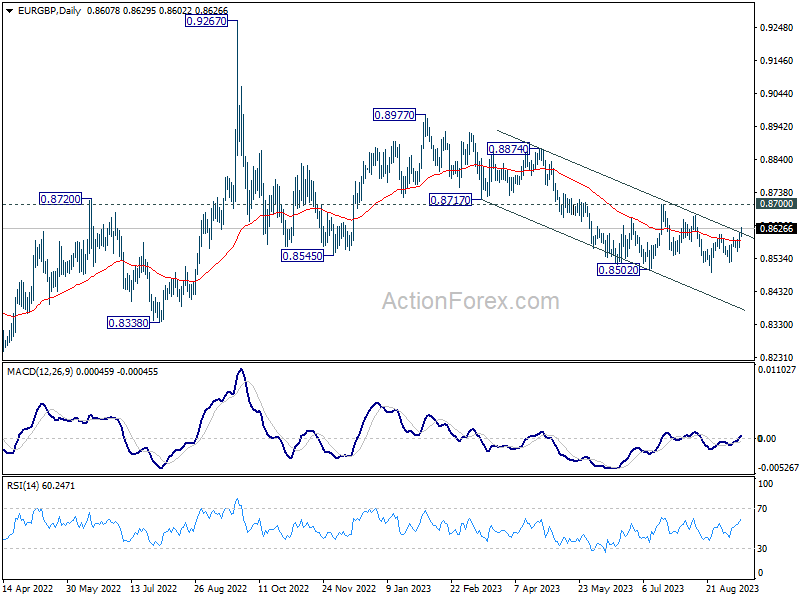
EUR/GBP's rebound from 0.8491 resumed by breaking through 0.8609 resistance. Intraday bias is back on the upside for further rise to 0.8667/8700 resistance zone. Price actions from 0.8502 are seen as a consolidation pattern, with current rise as the third leg. Upside should be limited by 0.8700 to bring larger decline resumption.
In the bigger picture, the down trend from 0.9267 (2022 high) is seen as part of the long term range pattern from 0.9499 (2020 high). Fall from 0.8977 is seen as the third leg. As long as 0.8700 resistance holds, further decline is still expected. Break of 0.8491 will resume the fall towards 0.8201 (2022 low). Nevertheless, firm break of 0.8700 will now be a sign of bullish reversal.