Sample Category Title
ECB Day Ahead
Market movers today
The ECB meeting is the main event today, with the rate decision at 14.15 CET followed by Lagarde's press conference at 14.45 CET. We expect a 25bp hike, which will be mirrored 1-to-1 by Danmarks Nationalbank.
On the data front, August inflation data will be released for Sweden. We expect headline CPIF inflation to cool clearly in y/y terms to 4.9% (from 6.4%) and CPIF excluding energy to 7.3% (from 8.0%).
From the US, August PPI and retail sales data are due for release. While headline retail sales have been supported by higher gasoline prices, early spending data suggests that control group sales growth have weakened sharply from July.
Overnight, data on China's August retail sales, industrial production and fixed investments growth will be released, consensus is looking for modest improvement after weak summer prints.
The 60 second overview
We expect the ECB to hike by 25bp at today's meeting. The market pricing is 16bp (up 3bp since yesterday) following the Reuters story on an upward revision to the 2024 inflation forecast in today's staff projections. In our opinion, this is a natural (and expected) consequence of rising energy prices since the latest projection round in June. The key factor for today's decision will be the projected core inflation path until 2025. We expect the forecast to reflect strong underlying inflation dynamics driven by tight labour market conditions. Combined with the latest (strong) inflation data, this should justify hiking a final 25bp. We also expect an advancement of the end to full reinvestment process of PEPP currently guided for December 2024 to be on the cards. Regardless of whether the ECB decides to hike or not, we expect Danmarks Nationalbank to follow the rate decision 1-to-1.
The US August Core CPI surprised to the upside at +0.3% m/m (forecast +0.2%, July +0.2%), while headline CPI was lifted by higher oil prices largely as expected (+0.6%; July +0.2%). The uptick was driven by faster services inflation, where especially airfares' contribution rose sharply. But even so, underlying price pressures seem to have remained slightly higher than anticipated in early Q3. Reflecting this, Atlanta Fed's Sticky CPI growth picked up to 4.7% m/m AR, up from June low of 2.9% yet still clearly below September peak of 8.2%. Core goods prices were largely unchanged, while shelter contribution continued to moderate reflecting delayed pass-through of past easing in rent growth. While the Fed is not happy to see a pick-up in the key core services components, markets were not spooked by the release, as short-dated UST yields declined after the release. The Fed is still very likely to stay on hold next week, but focus remains on the November/December meetings, where markets see the probability of another rate hike essentially as a coin-flip. Read more about our latest inflation views from our monthly Global Inflation Watch - Underlying price pressures remain sticky, 13 September.
Euro area industrial production declined 1.1% m/m in July (cons: -0.9%). The decline was driven by Germany, Italy and Spain while French production rose in July. The euro area industry has suffered the entire year and the recent business surveys suggest that this should continue in the coming months. Especially the outlook for Germany looks weak given the large decline in factory orders we saw in July. This is especially evident in the auto sector, where new orders are down by 20% since the turn of the year. Apart from declining demand in general, the increasing competition from Chinese producers is a headache for the European car producers. Yesterday, the European Commission launched an investigation into Chinese electric vehicles, which according to President von der Leyen is 'distorting our market' due to 'huge state subsidies'.
Equities: Back and forth leads no way for equities. That's how is has felt this week where equities have mostly been reversing the moves from the day prior. Hence, yesterday it was equities higher driven by cyclical growth while energy was lower. However, we got a much bigger common top-down driver yesterday with the US CPI number. After thinking twice, or getting through the sub-components, investors decided this was a good CPI report with signs of further slowing in core inflation. As expected, this resulted in the relief risk-on move benefiting the tech and growth universe the most while inflation winner, materials and energy lagged. In the US yesterday Dow -0.2%, S&P 500 +0.1%, Nasdaq +0.3% and Russell 2000 -0.8%. The risk-on tone is continuing in Asia this morning lead by Japanese stocks. US and European futures are higher as well while keys for the equity market have been handed over to ECB.
FI: European government bond yields rose significantly yesterday morning on the back of the Reuters story claiming that the ECB will revise up its inflation forecast for 2024 in the new staff projections. Money markets are pricing in 16bp ahead of today's ECB meeting, up 6bp since Monday. 2Y Bund yields rose by 5bp, while the long end was little changed. The 10Y Italian yield spread to Germany widened by 4bp throughout the session. In the US, Treasury yields fell 4-5bp across the curve despite the strong US core CPI print.
FX: EUR/USD declined below 1.0750 on strong US CPI and risk-off sentiment. USD/JPY climbed slightly higher to around the 147.5 mark. EUR/GBP fell below 0.86 after initially moving higher on weaker-than-expected UK GDP. EUR/SEK edged a bit higher to around 11.95, while EUR/NOK is around 11.50.
Credit: Yesterday, credit markets were positive following the US CPI announcement with iTraxx Main going 1.1bp tighter to 70.3bp while Xover tightened by 5.4bp to 393.7bp. In addition, primary market activity is still going, however a slower pace is observed.
Nordic macro
August inflation for Sweden is expected to show a significant drop in general, CPIF slowing by 1.5 p.p. to 4.9 % y/y while CPIF excl. Energy slows by 0.7 p.p to 7.3 % y/y. The latter is still 0.4 p.p. above Riksbank's forecast, however. As for detail, we expect clothing, car fuel, hotel/restaurants and "other goods and services" to add 0.4 p.p. to the monthly CPIF rate while transportation services and recreation is likely to subtract the same amount. Looking at details from Norway and Denmark earlier this week, risks are seemingly tilted to the downside vs our Swedish forecast.
In Norway, economic growth levelled off in H1, and we expect Norges Bank's regional survey (out this morning) to show this trend continuing into H2. We expect aggregate output growth to come out around 0.1-0.2% for the next quarter. Given the strong pressures in the economy and on wages and prices, it will perhaps be equally important to see whether capacity utilisation continues to decline and whether labour shortages are becoming less precarious.
ECB Decides, ARM Goes Public
Yesterday’s US CPI report was mixed, worse-than-expected and far from soothing. The headline inflation ticked from 3.2% to 3.7%, higher than the 3.6% expected by analysts, and core inflation came in at 4.3%, in line with expectations. But on a monthly basis, both headline and core inflation numbers were slightly higher than expected. The spike in energy prices was to blame for the rise in the headline figure. In fact, gasoline prices rose by more than 11% in August, and that accounted for more than half of the overall monthly rise in inflation. The only good news was that core inflation in the past three months ran at a 2.4% annual rate, the lowest since March 2021, and just at a spitting distance from the Federal Reserve’s (Fed) 2% inflation target. That’s maybe why the market reaction to a higher-than-expected set of monthly and yearly CPI metrics didn’t see a bad market reaction? The US 2-year yield was shortly above the 5% level yesterday but fell after the data, activity on Fed funds futures now gives 97% chance for a pause at next week’s FOMC meeting, but the probability of a pause in November is slightly less than before the data, at 56%. In summary, yesterday’s CPI data tilted the expectation for a November hike slightly higher, without however changing the consensus of a no rate hike for the moment.
ECB expectations tilt toward rate hike
Not earlier than the beginning of this week, the expectation for today’s European Central Bank (ECB) meeting was a no rate hike. Today, just a few hours before the meeting, the pricing is pointing at a 25bp hike as the most likely scenario; money markets are pricing in a 68% chance for a 25bp hike.
But the data remains morose. Released yesterday, the euro area industrial production figures were looking rather bad, with a more than 1% slump on a monthly basis, and a 2% slump on a yearly basis. That’s also why the higher ECB rate hike expectations couldn’t really boost appetite in the EURUSD, the pair sees resistance at the 1.0765/1.070 range. If the ECB raises the rates today, the EURUSD could make a move toward the 200-DMA, 1.0825, and the Stoxx 600 could slip below the 445, a double bottom.
While there is a decent downside potential in European stocks, the upside potential in the EURUSD is limited by the weakness of the economic data. In fact, the gap between the US and German 10-year yield has been narrowing since about 3 weeks, but the EURUSD barely benefited from it, on the contrary, the EURUSD weakened more than 1% during the same period. Apparently, the morose economic outlook brings investors to think that, even if the ECB hikes today, it will certainly be the last one, and that in less than a year from now, we will be talking about the first rate cut in Europe due to economic weakness.
Across the Channel, the picture is not sunnier, obviously. The latest data revealed that the British economy shrank at the fastest speed in seven months in July. Strikes and the lack of sun were responsible for the gloomy data. You would think that slower economy could at least mean a softer UK inflation – a silver lining?. But no. Because data released earlier this week showed that the UJ unemployment rose, yet wages grew at a record high, the record starting from 2001. The Brits earned 8.5% more on the year, which is good news for their struggle to keep up with the cost of living crisis, but clearly bad news for the Bank of England (BoE), which is trying so hard to abate inflation, but in vain. They abate economic growth instead. Cable is testing the 200-DMA to the downside this week, for similar reasons to the euro. BoE rate hike expectations are strongly here, but growth outlook looks so gloomy that not many traders are willing to try a long sterling position.
Now, for all central bankers, those who want to raise rates and those who don’t want, the headache is the same. Oil prices are rising, and that’s muddying the future inflation expectations. The US is in a better position than the rest of world because, at least, they don’t have to worry about currency depreciation to make things worse. But the barrel of US crude came close to the $90pb level yesterday. Happily, the latest EIA data showed a 4-mio build in the US inventories last week, which certainly helped not boost the bull’s run further. US crude is now at the overbought market territory. The $90pb level is a psychological resistance and global economic data hints at slow activity ahead of us. The mix calls for at least a minor correction at the current levels.
In equities, all eyes are on ARM that will go public today. The company set its IPO price to $51 a share. It’s at the top end of the proposed price range, but still lower than the valuation of $64bn when Softbank bought out a stake from Vision Fund.
Russell 2000 Technical: The Weakest Among the Major US Stock Indices
- The small-cap Russell 2000 which is considered as a better proxy of the US economy has just broken below its key 200-day moving average.
- It is the worst-performing major US benchmark stock index since August 2023.
- Its recent major downtrend phase from 5 November 2021 to 16 June 2022 started ahead of the other indices; S&P 500, Nasdaq 100, and Dow Jones Industrial Average.
- Given such a leading element, a further down move in the Russell 2000 may trigger a similar negative feedback loop into the other US benchmark stock indices.
- Watch its key short-term resistance at 1,865.
Since the US regional banking crisis that imploded in early March this year, the performance of the small-cap Russell 2000 has not made any headway as it failed to break above its major “Symmetrical Triangle” range resistance at 2,009 in place since 16 August 2022.
Also, in the past two months, it has been the worst-performing major US benchmark stock indices where it ended August with a loss of -5.17%, way below the S&P 500 (-1.77%), Nasdaq 100 (-1.62%), Dow Jones Industrial Average (-2.36%).
For the current month-to-date performance as of 13 September, the Russell 2000 has remained in the doldrums with a loss of -3.10% and underperformed against the S&P 500 (-0.89%), Nasdaq 100 (-0.98%), Dow Jones Industrial Average (-0.42%) over the same period.
Broke below key 200-day moving average
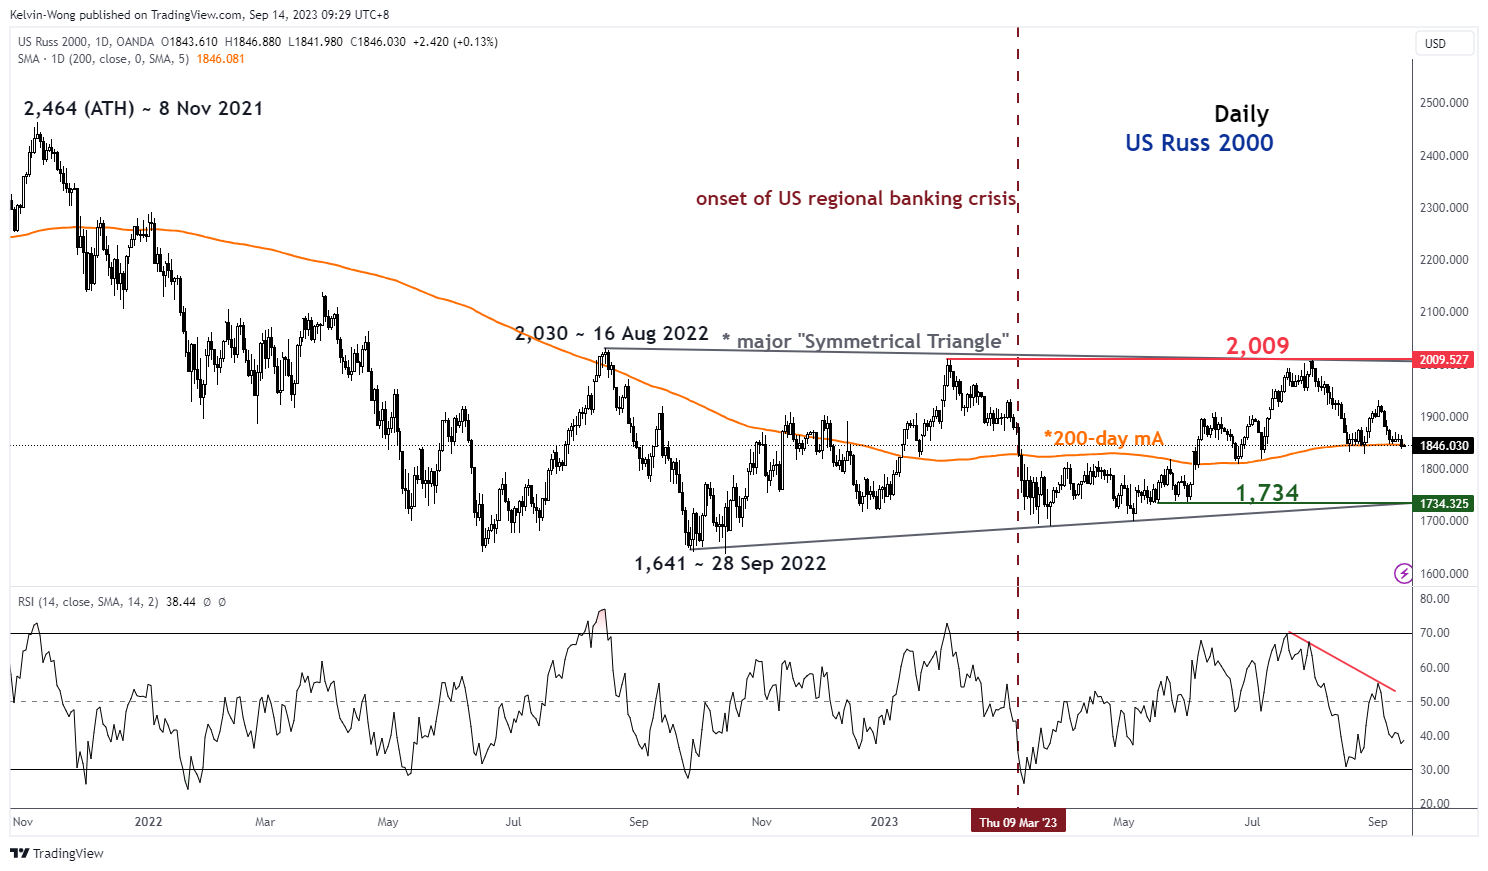
Fig 1: US Russ 2000 major and medium-term trends as of 14 Sep 2023 (Source: TradingView, click to enlarge chart)
The current price actions of the US Russ 2000 Index (a proxy for the Russell 2000 futures) have inched lower since the 1 August 2023 high of 2,009 and it is now almost at a similar price level during the onset of the US regional banking liquidity crisis that erupted on 9 March 2023.
Technical analysis and momentum factor are now flashing signs of potential medium-term weakness as yesterday’s daily price action at the close has broken below its key 200-day moving average slightly at the end of yesterday, 13 September US session. Also, the US Russ 2000 Index is the sole US benchmark index that has breached below the key 200-day moving average ahead of the others (S&P 500, Nasdaq 100 & Dow Jones Industrial Average).
Interestingly, in the prior major downtrend phase, the US Russ 2000 Index kickstarted the bearish movement ahead of the rest where its all-time high of 2,464 peaked on 8 November 2021 before the respective peak periods of all-time highs of the S&P 500 (4 January 2022), Nasdaq 100 (22 November 2021), Dow Jones Industrial Average (5 January 2022).
Therefore, if the US Russ 2000 starts to exhibit another bout of multi-week down move sequence thereafter and breaks below the major “Symmetrical Triangle” range support at 1,734, it may signal the start of another major downtrend phase for the US benchmark stock indices.
Oscillating within a short-term minor downtrend
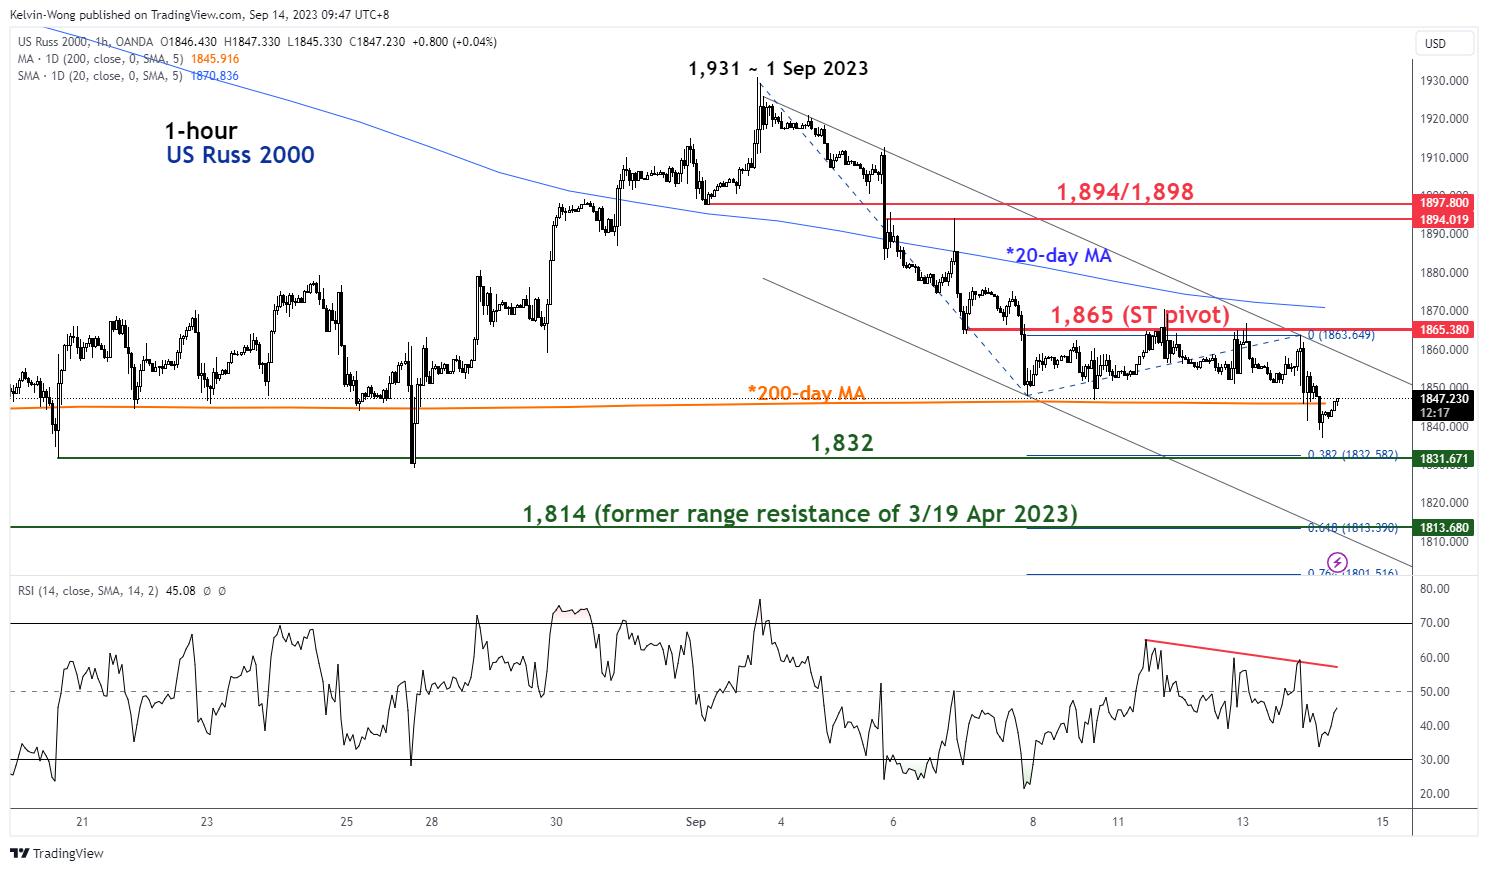
Fig 2: US Russ 2000 short-term minor trend as of 14 Sep 2023 (Source: TradingView, click to enlarge chart)
Since its 1 September 2023 high of 1,931, the price actions of the US Russ 2000 Index have evolved within a minor descending channel and traded below a downward-slopping 20-day moving average which indicates a short-term minor downtrend is in motion.
Watch the 1,865 key short-term pivotal resistance to maintain the short-term bearish scenario to see the intermediate supports coming in at 1,832 and 1,814 (Fibonacci extension from 1 September 2023 high, lower boundary of the minor descending channel & 3 April/19 April 2023 swing lows).
On the flip side, a clearance above 1,865 negates the bullish tone for a squeeze up towards the 1,894/1,898 resistance zone (congestion area of 1 September/6 September 2023 & 61.8% Fibonacci retracement of the current minor down move from 1 September 2023 high to 13 September 2023, US session low).
EUR/CHF Daily Outlook
Daily Pivots: (S1) 0.9576; (P) 0.9585; (R1) 0.9599; More...
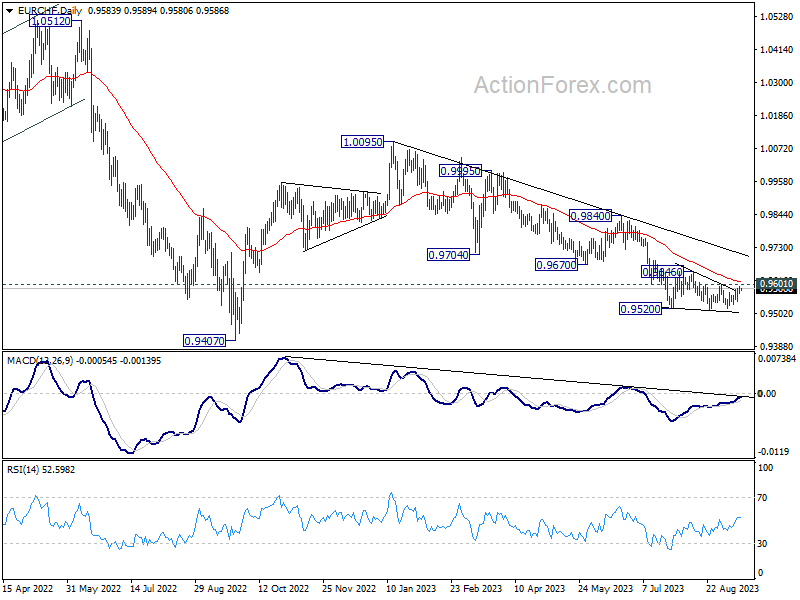
EUR/CHF is still bounded in range below 0.9601 resistance and intraday bias stays neutral for the moment. Outlook stays bearish with 0.9601 resistance intact. On the downside, decisive break of 0.9513 will resume the decline from 1.0095, towards 0.9407 low. However, break of 0.9601 resistance will turn bias back to the upside for stronger rebound to 0.9646 resistance and above.
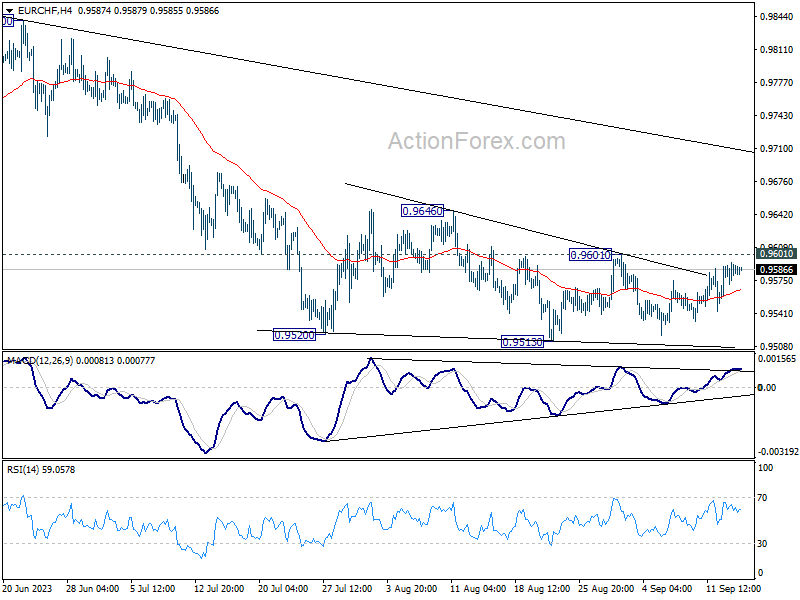
In the bigger picture, medium term outlook is staying bearish as the cross is capped well below falling 55 W EMA (now at 0.9818). Down trend from 1.2004 (2018 high) is in favor to continue. Sustained break of 0.9407 will target 61.8% projection of 1.1149 to 0.9407 from 1.0095 at 0.9018. For now, this will remain the favored case as long as 0.9670 support turned resistance holds, in case of strong rebound.
Markets Juggle Mixed Signals as AUD Rises and ECB Decision Looms
Australian Dollar rises broadly today, as lifted by stronger than expected headline employment data. But the details are less impressive, as the vast majority of job growth were part-time, while hours worked decline. That's nonetheless welcome news for RBA, as the job markets while starting to cool, appeared to have absorb prior rate hikes well. Meanwhile, it's still too early to judge if RBA would deliver one more final hike in the cycle, until getting more Q3 data as a whole.
Euro is currently mixed as trader eagerly await ECB rate decisions. Opinions are still split of whether the central bank would hike or pause. At the same time, any guidance on rates, together with new growth and inflation projections are able to send Euro for a wide ride.
As for the week, Dollar is currently the worst performer, but held above last week's lows against all but Canadian. Swiss Franc and Sterling are the next weakest. Australian Dollar is the strongest one, followed by Canadian and New Zealand Dollar. Euro and Yen are mixed in the middle.
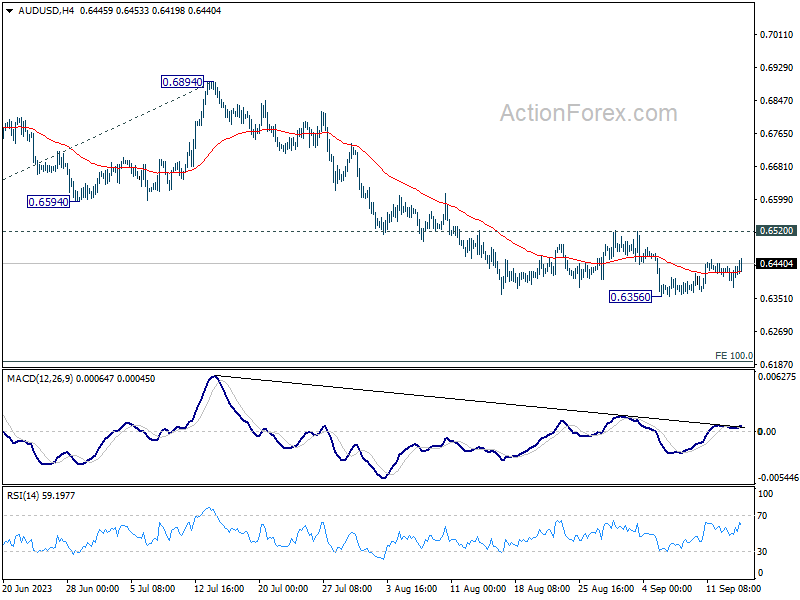
On the technical front, AUD/USD's recovery today is rather weak and doesn't alter the corrective structure of the rise from 0.6356. Also, even though further upside cannot be ruled out, outlook will stay bearish as long a s0.6520 resistance holds. Break of 0.6356 support will signal resumption of the fall from 0.6894, towards 100% projection of 0.7156 to 0.6457 from 0.6894 at 0.6195.
In Asia, at the time of writing, Nikkei is up 1.40%. Hong Kong HSI is down -0.22%. China Shanghai SSE is up 0.04%. Singapore Strait Times is up 0.52%. Japan 10-year JGB yield is down -0.0024 at 0.708. Overnight, DOW dropped -0.20%. S&P 500 rose 0.12%. NASDAQ rose 0.29%. 10-year yield dropped -0.015 to 4.249.
Markets in suspense ahead of ECB; Could EUR/USD bounce from here?
As the global financial market eagerly anticipates today's pivotal ECB rate decision, the pendulum of market expectations has been swinging vigorously, making it the most uncertain ECB meeting in recent times. Initial market sentiment leaned towards a pause; however, a recent Reuters report ignited speculation about a potential rate hike.
The mentioned report suggested that ECB could revise its 2024 inflation forecast upwards, well pass the 3% mark, thereby strengthening the case for a rate increase. Consequently, odds for a 25bps hike escalated to nearly 70%, a significant rise from around 40% noted on Monday. If this materializes, we could see the main refinancing rate and deposit rate shift to 4.50% and 4.00% respectively.
Adding a layer of complexity to the anticipations is Vice President Luis de Guindos' earlier assertion, dating back to August 31, where he said that the impending inflation forecasts are "similar to what we had in June", steering away from the prospect of an excessive upward revision. Moreover, European Commission had marginally adjusted Eurozone inflation rate from 5.8% to 5.6% for 2023 and increased the 2024 forecast from 2.8% to 2.9%. That casts further doubts on the aggressive inflation predictions noted in the Reuters report.
The market is not just hinging on the rate verdict. A myriad of factors stand as potential catalysts in steering the financial markets post the announcement. The ECB is expected to maintain its stance of basing future verdicts on evolving data dynamics. However, there might be subtle indications given on whether interest rates have reached its peak, whether it hikes or not today.
Furthermore, growth projections are on the verge of being revised to possibly match European Commission's grim outlook. The Commission had notably scaled down the growth forecasts for 2023 and 2024 to 0.8% and 1.3% respectively, a decrement from the previous estimates of 1.1% and 1.6%.
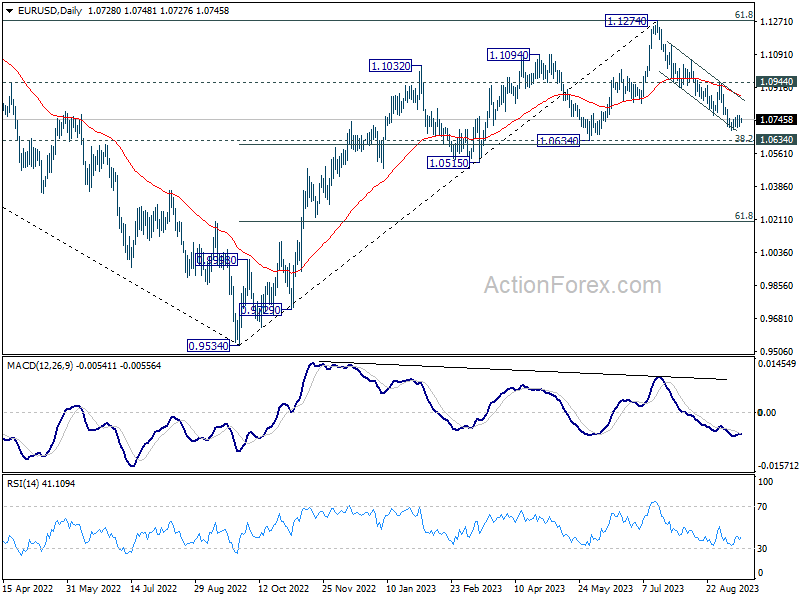
As for EUR/USD it's now standing close to an important cluster support zone at 1.0634, (38.2% retracement of 0.9534 to 1.1274 at 1.0609). There is prospect of a near term bullish reversal from current level, to finish off the whole decline from 1.1274. But decisive break of 1.0944 resistance is needed to confirm this case, or risk will stay on the downside. On the other hand, sustained break of 1.0609/0634 will raise the chance of medium term term bearish trend reversal, and target 61.8% retracement at 1.0199.
UK RICS house price balance fell to 14-year low, deepening slump
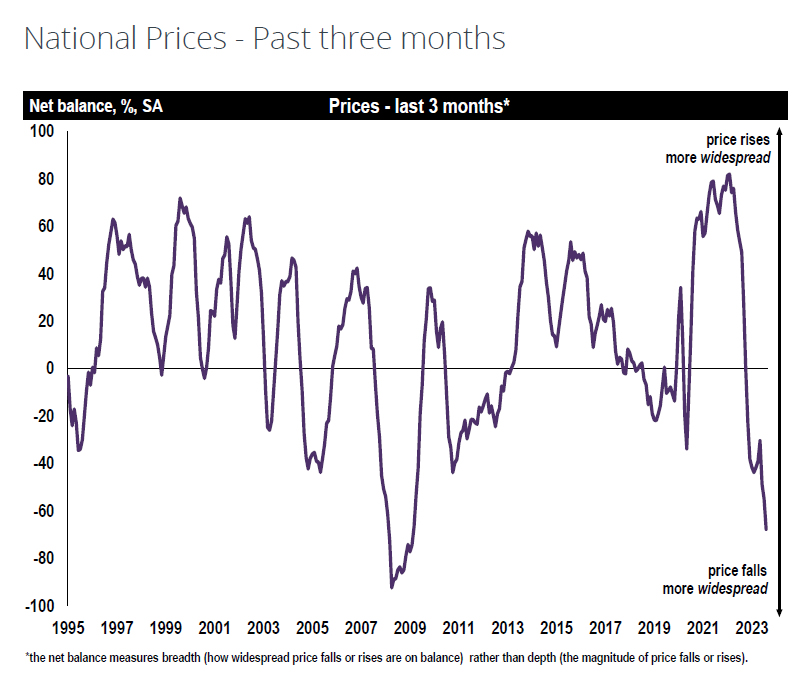
In the latest sign of mounting pressures in the UK property market, RICS house price balance deteriorated notably, plummeting to -68 in August, down from -55 in the previous month. This development has surpassed the grim expectation set at -56 and marks the most unfavorable reading since February 2009.
Dissecting the UK reveals that almost every region is grappling with "relatively steep fall in house prices," as noted by RICS.
Looking ahead, surveyors anticipate that the upcoming months will not bring any reprieve. Short-term projections illustrate a more pronounced dip, with net balance drifting deeper into negative terrain at -67%, a decline from prior figure of -60%.
Furthermore, long-term outlook remains relatively unchanged but still under a cloud, with expectations cementing around a net balance of -48%, mirroring the sentiment recorded in both June and July.
Elsewhere
Swiss PPI will be released in European session. US will publish retail sales, PPI and jobless claims later in the day.
EUR/CHF Daily Outlook
Daily Pivots: (S1) 0.9576; (P) 0.9585; (R1) 0.9599; More...
EUR/CHF is still bounded in range below 0.9601 resistance and intraday bias stays neutral for the moment. Outlook stays bearish with 0.9601 resistance intact. On the downside, decisive break of 0.9513 will resume the decline from 1.0095, towards 0.9407 low. However, break of 0.9601 resistance will turn bias back to the upside for stronger rebound to 0.9646 resistance and above.
In the bigger picture, medium term outlook is staying bearish as the cross is capped well below falling 55 W EMA (now at 0.9818). Down trend from 1.2004 (2018 high) is in favor to continue. Sustained break of 0.9407 will target 61.8% projection of 1.1149 to 0.9407 from 1.0095 at 0.9018. For now, this will remain the favored case as long as 0.9670 support turned resistance holds, in case of strong rebound.
Economic Indicators Update
| GMT | Ccy | Events | Actual | Forecast | Previous | Revised |
|---|---|---|---|---|---|---|
| 23:50 | JPY | Machinery Orders M/M Jul | -1.10% | -0.70% | 2.70% | |
| 01:00 | AUD | Consumer Inflation Expectations Sep | 4.60% | 4.90% | ||
| 01:30 | AUD | Employment Change Aug | 64.9K | 24.3K | -14.6K | |
| 01:30 | AUD | Unemployment Rate Aug | 3.70% | 3.70% | 3.70% | |
| 04:30 | JPY | Industrial Production M/M Jul F | -1.80% | -2.00% | -2.00% | |
| 06:30 | CHF | Producer and Import Prices M/M Aug | 0.10% | -0.10% | ||
| 06:30 | CHF | Producer and Import Prices Y/Y Aug | -0.60% | |||
| 12:15 | EUR | ECB Main Refinancing Rate | 4.25% | 4.25% | ||
| 12:30 | CAD | Wholesale Sales M/M Jul | -2.00% | -2.80% | ||
| 12:30 | USD | Retail Sales M/M Aug | 0.20% | 0.70% | ||
| 12:30 | USD | Retail Sales ex Autos M/M Aug | 0.40% | 1.00% | ||
| 12:30 | USD | PPI M/M Aug | 0.40% | 0.30% | ||
| 12:30 | USD | PPI Y/Y Aug | 1.20% | 0.80% | ||
| 12:30 | USD | PPI Core M/M Aug | 0.20% | 0.30% | ||
| 12:30 | USD | PPI Core Y/Y Aug | 2.20% | 2.40% | ||
| 12:30 | USD | Initial Jobless Claims (Sep 8) | 229K | 216K | ||
| 12:45 | EUR | ECB Press Conference | ||||
| 14:00 | USD | Business Inventories Jul | 0.10% | 0.00% | ||
| 14:30 | USD | Natural Gas Storage | 51B | 33B |
Markets in suspense ahead of ECB; Could EUR/USD bounce from here?
As the global financial market eagerly anticipates today's pivotal ECB rate decision, the pendulum of market expectations has been swinging vigorously, making it the most uncertain ECB meeting in recent times. Initial market sentiment leaned towards a pause; however, a recent Reuters report ignited speculation about a potential rate hike.
The mentioned report suggested that ECB could revise its 2024 inflation forecast upwards, well pass the 3% mark, thereby strengthening the case for a rate increase. Consequently, odds for a 25bps hike escalated to nearly 70%, a significant rise from around 40% noted on Monday. If this materializes, we could see the main refinancing rate and deposit rate shift to 4.50% and 4.00% respectively.
Adding a layer of complexity to the anticipations is Vice President Luis de Guindos' earlier assertion, dating back to August 31, where he said that the impending inflation forecasts are "similar to what we had in June", steering away from the prospect of an excessive upward revision. Moreover, European Commission had marginally adjusted Eurozone inflation rate from 5.8% to 5.6% for 2023 and increased the 2024 forecast from 2.8% to 2.9%. That casts further doubts on the aggressive inflation predictions noted in the Reuters report.
The market is not just hinging on the rate verdict. A myriad of factors stand as potential catalysts in steering the financial markets post the announcement. The ECB is expected to maintain its stance of basing future verdicts on evolving data dynamics. However, there might be subtle indications given on whether interest rates have reached its peak, whether it hikes or not today.
Furthermore, growth projections are on the verge of being revised to possibly match European Commission's grim outlook. The Commission had notably scaled down the growth forecasts for 2023 and 2024 to 0.8% and 1.3% respectively, a decrement from the previous estimates of 1.1% and 1.6%.
As for EUR/USD it's now standing close to an important cluster support zone at 1.0634, (38.2% retracement of 0.9534 to 1.1274 at 1.0609). There is prospect of a near term bullish reversal from current level, to finish off the whole decline from 1.1274. But decisive break of 1.0944 resistance is needed to confirm this case, or risk will stay on the downside. On the other hand, sustained break of 1.0609/0634 will raise the chance of medium term term bearish trend reversal, and target 61.8% retracement at 1.0199.
Technical Outlook and Review
DXY:
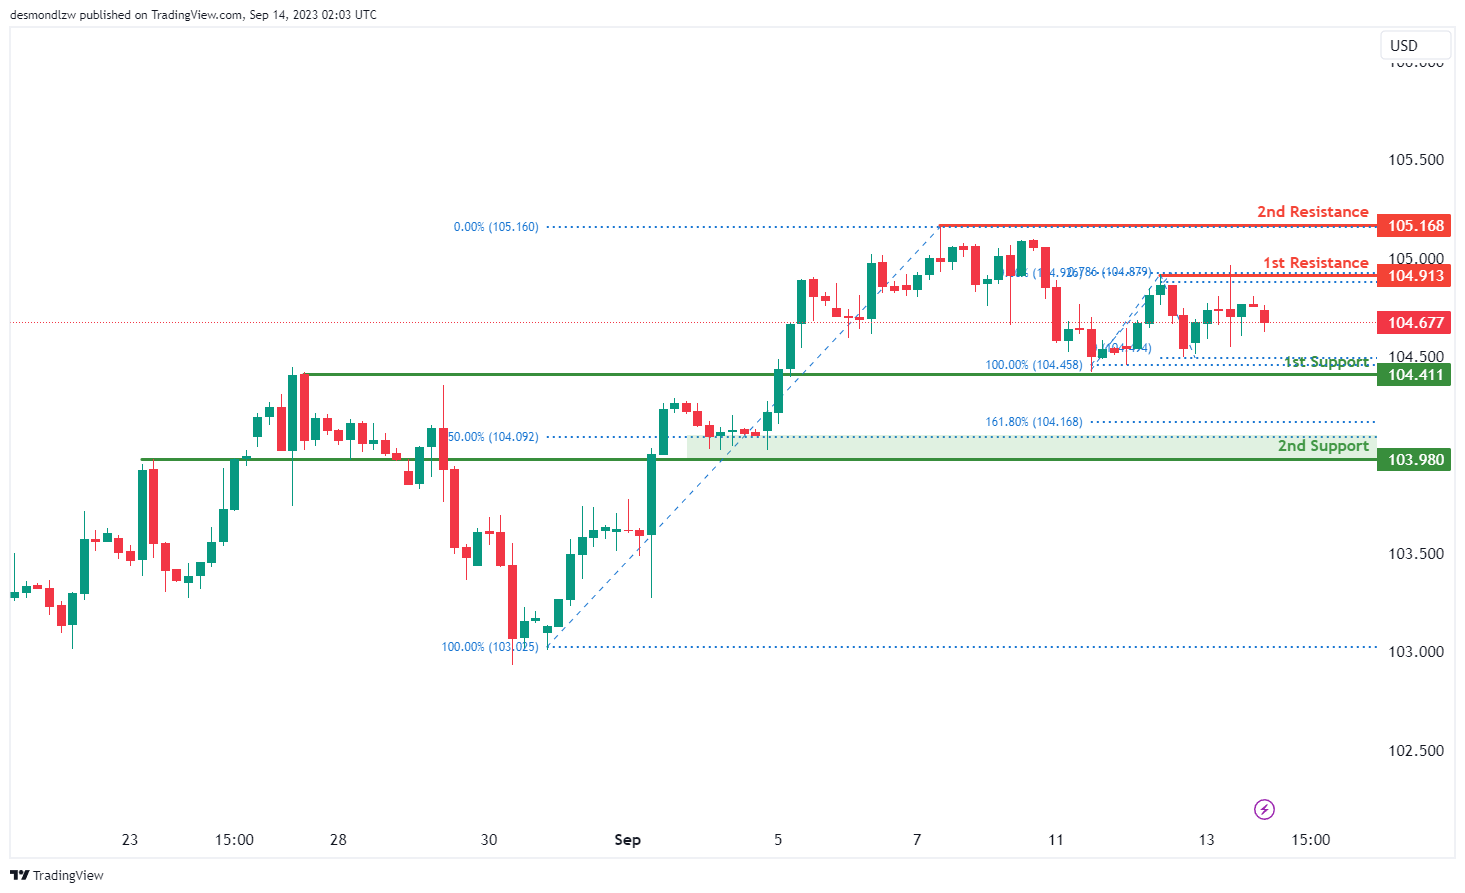
The DXY (US Dollar Index) chart currently reflects a neutral overall momentum, indicating a lack of a clear bullish or bearish bias.
There’s a potential scenario where the price may oscillate within a range, fluctuating between the 1st support and 1st resistance levels.
The 1st support level at 104.41 is considered significant as it represents an overlap support. Additionally, the 2nd support at 103.94 aligns with the 50% Fibonacci Retracement and the 161.80% Fibonacci Extension levels, indicating potential confluence and strength as a support area.
On the resistance side, the 1st resistance at 104.91 is characterized as a swing high resistance, potentially acting as a barrier to any bullish movements. Similarly, the 2nd resistance at 105.16 is identified as a swing high resistance.
EUR/USD:
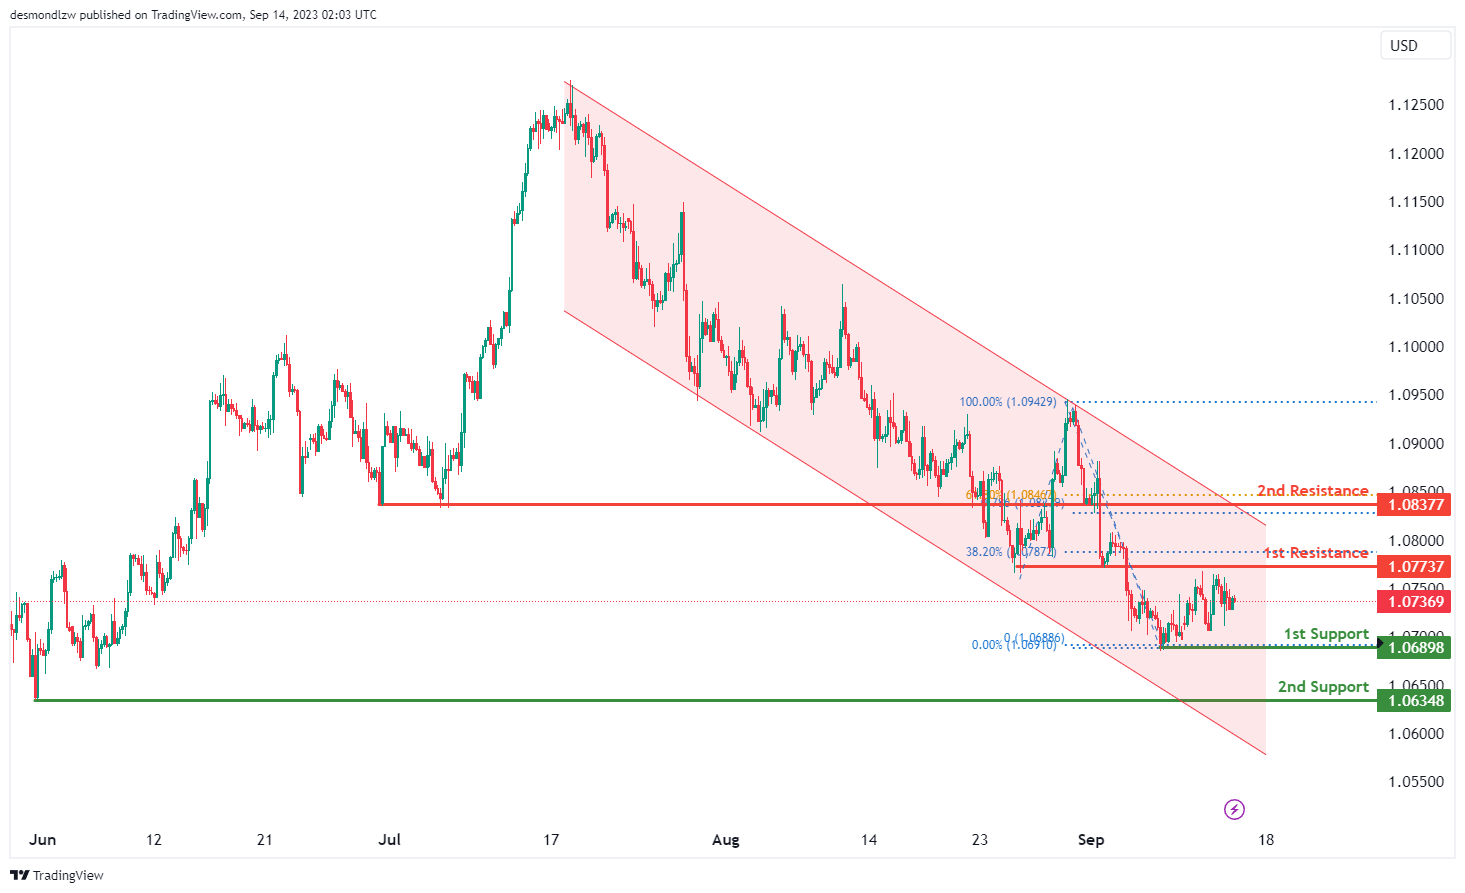
The EUR/USD chart exhibits a bearish overall momentum, driven by its position within a descending channel.
There’s a potential scenario for a bearish continuation towards the 1st support level at 1.0689, which is considered strong due to its alignment with a swing low support. Additionally, the 2nd support at 1.0634 provides further reinforcement as a swing low support.
On the resistance side, the 1st resistance at 1.0773 is marked as an overlap resistance, potentially acting as a barrier to any bullish movements. The 2nd resistance level at 1.0837 is also identified as an overlap resistance, further suggesting resistance in this area.
EUR/JPY:
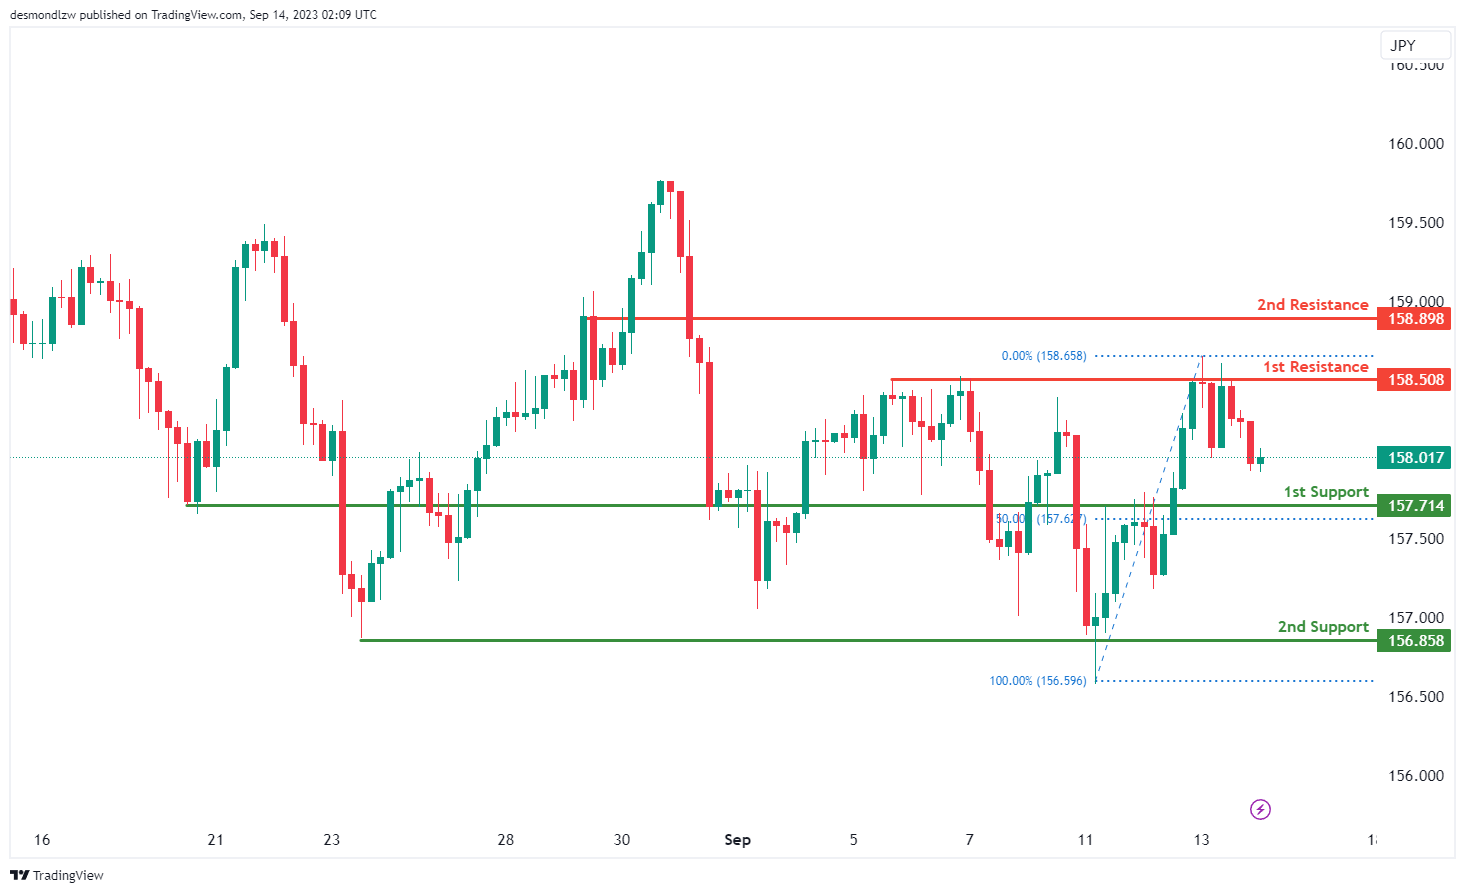
The EUR/JPY chart currently shows a neutral overall momentum, suggesting a lack of a clear trend. Price could potentially fluctuate between the 1st support level and the 1st resistance level.
The 1st support level at 157.71 is identified as an overlap support that aligns with the 50.00% Fibonacci retracement level. Additionally, the 2nd support level at 156.86 is marked as a multi-swing low support, further reinforcing its potential role as a support level.
To the upside, the 1st resistance level at 158.51 is identified as a multi-swing high resistance. Furthermore, the 2nd resistance level at 158.89 is marked as a pullback resistance, suggesting potential resistance in this area.
EUR/GBP:
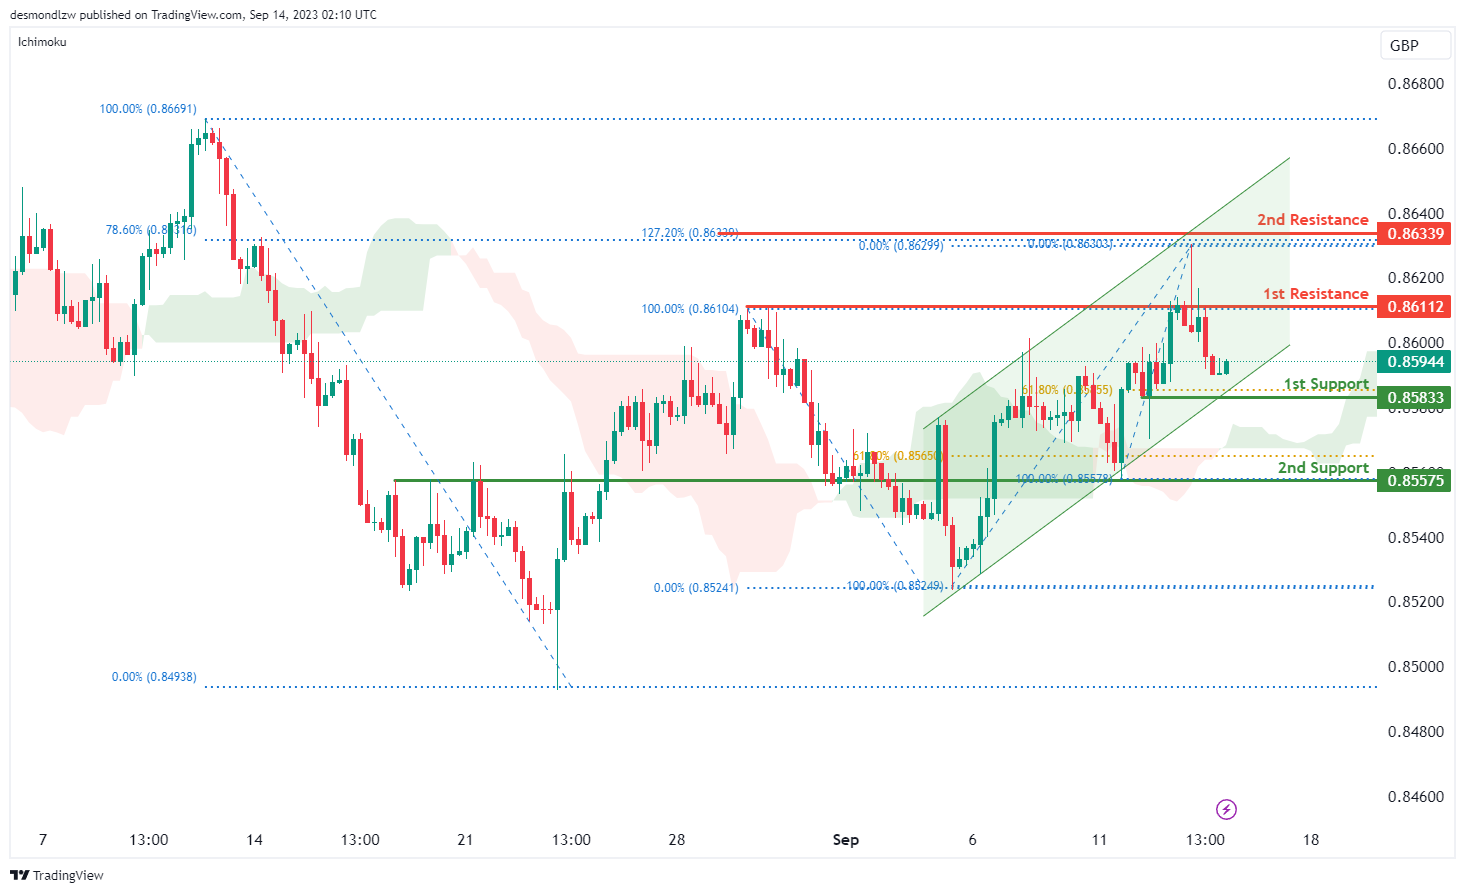
The EUR/GBP chart is currently characterized by a bullish overall momentum due to several contributing factors. These factors include the presence of a bullish ascending channel and the fact that the price is trading above the bullish Ichimoku cloud. These conditions collectively suggest that the price is likely to continue its upward trajectory. In this context, the price is expected to make a bullish move towards the 1st resistance level at 0.8611.
Additionally, several key support and resistance levels have been identified. The 1st support at 0.8593 is considered a strong pullback support, further supported by the presence of the 61.80% Fibonacci Retracement. The 2nd support at 0.8557 is marked as an overlap support, signifying its significance as a potential support zone.
On the resistance side, the 1st resistance at 0.8611 is characterized as a multi-swing high resistance, potentially acting as a barrier to any potential downward movements. The 2nd resistance at 0.8636 is notable as it aligns with both the 127.20% Fibonacci Extension and the 78.60% Fibonacci Retracement, indicating a strong zone of potential resistance.
GBP/USD:
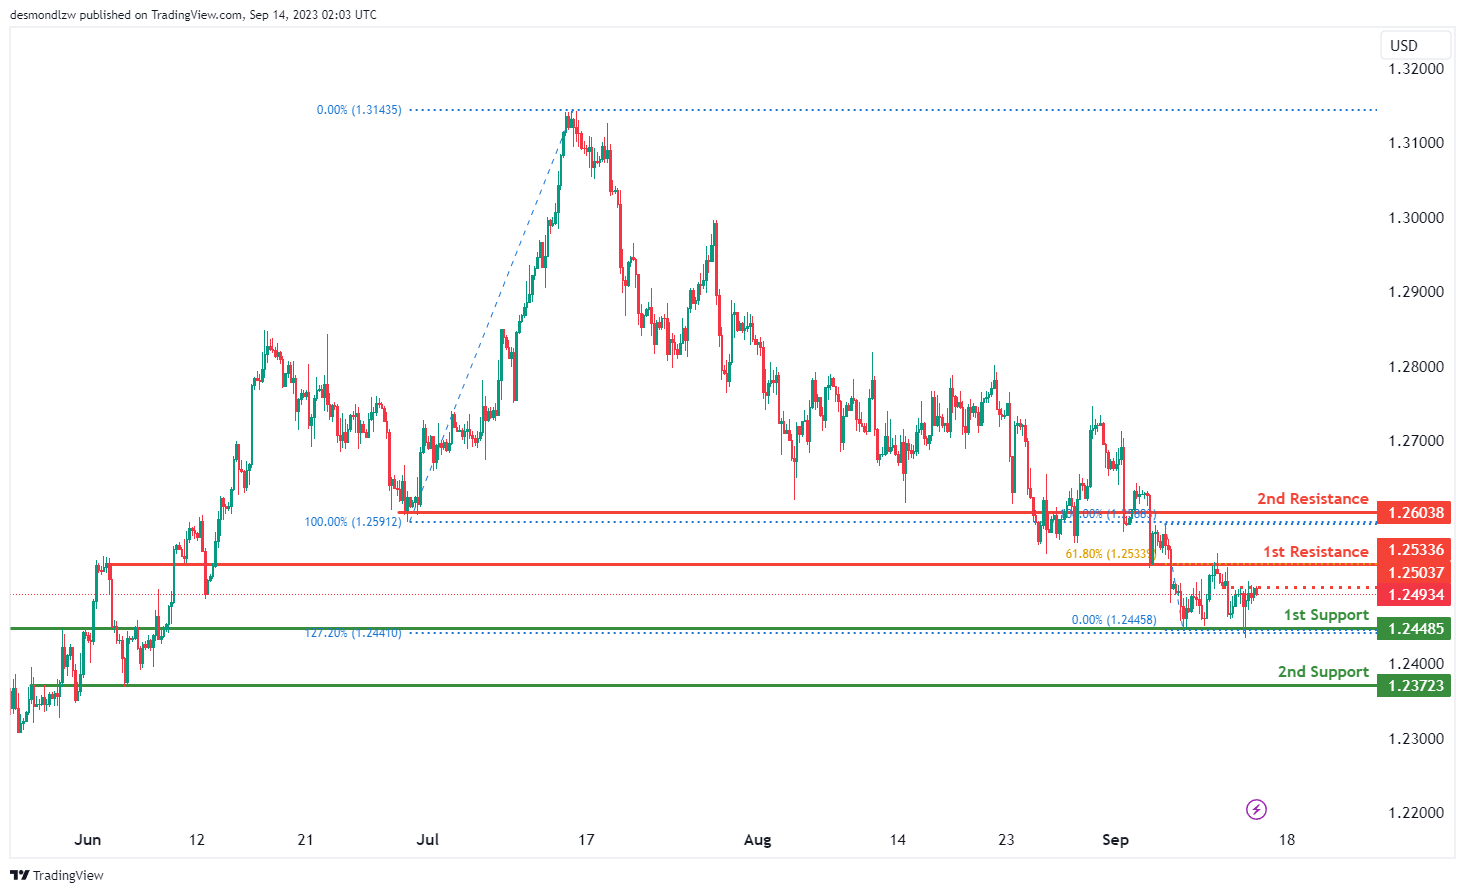
The GBP/USD chart currently exhibits a neutral overall momentum, indicating a lack of a clear bullish or bearish trend.
In this neutral scenario, there is a potential for price to fluctuate within a range between the 1st support at 1.2448 and the 1st resistance at 1.2533.
The 1st support at 1.2448 and the 2nd support at 1.2372 are both identified as overlap supports, which suggests that these levels have historical significance and could act as strong areas of price support.
On the resistance side, the 1st resistance at 1.2533 is considered significant as it aligns with the 61.80% Fibonacci Retracement level, potentially serving as a barrier to any bullish movements.
Furthermore, the 2nd resistance at 1.2603 is also marked as an overlap resistance, reinforcing its potential role as a resistance level.
GBP/JPY:
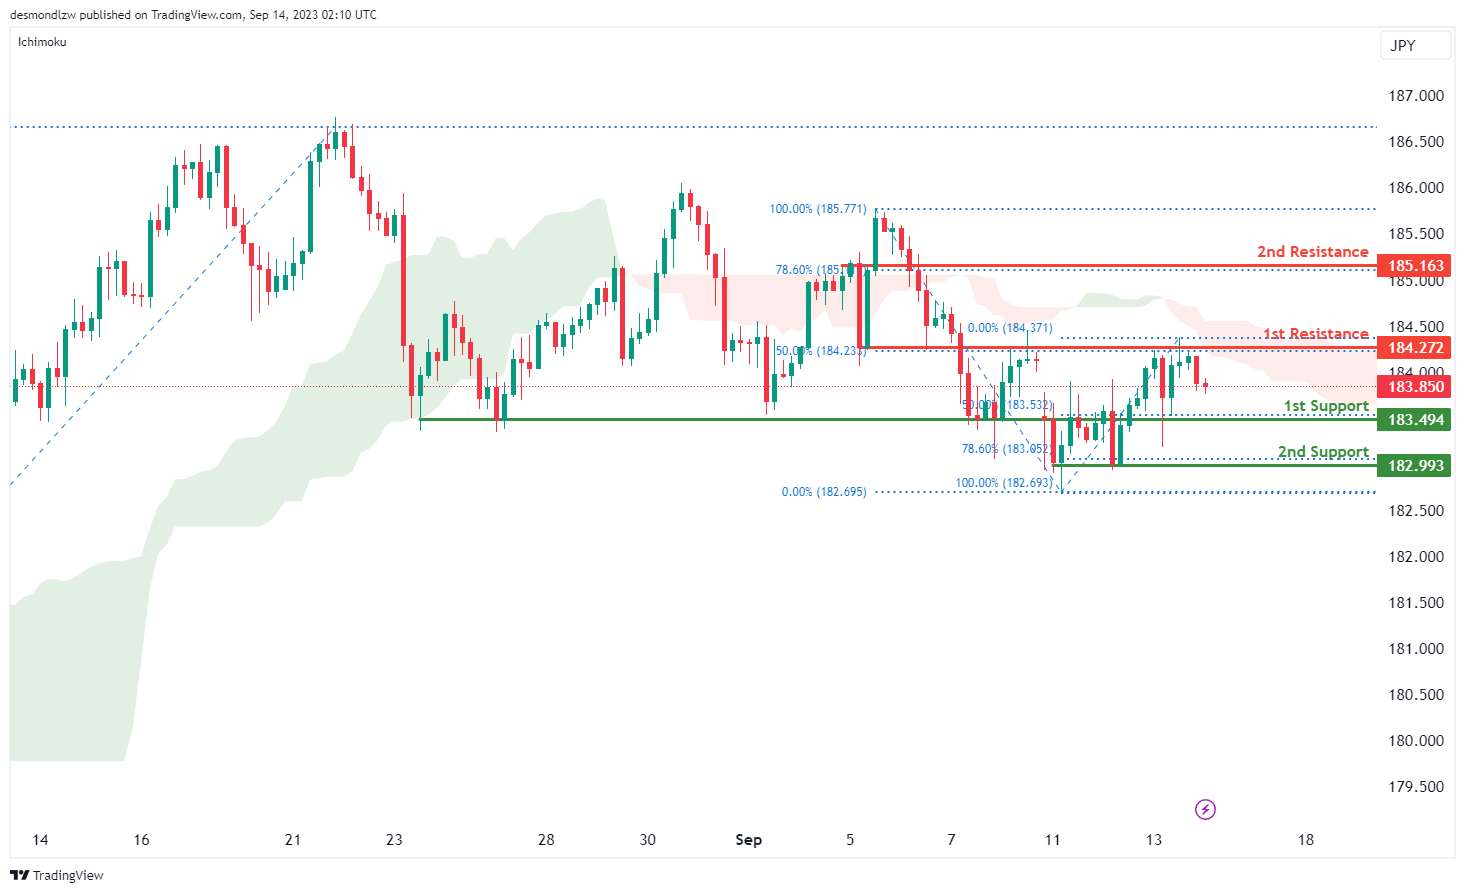
The GBP/JPY chart currently exhibits a bearish overall momentum, suggesting a downward trend in price movement. This bearish momentum is supported by the fact that the price is below the bearish Ichimoku cloud, indicating a continuation of the bearish sentiment.
Price is expected to potentially continue its bearish movement towards the 1st support level at 183.49. This support level is significant as it represents an overlap support and aligns with the 50% Fibonacci Retracement level, indicating a strong potential support zone.
Furthermore, the 2nd support at 182.79 is marked as an overlap support and aligns with the 78.60% Fibonacci Retracement, further reinforcing its potential role as a support level.
On the resistance side, the 1st resistance at 184.27 is identified as an overlap resistance, potentially acting as a barrier to any bullish movements.
Additionally, the 2nd resistance level at 185.16 is noted as a pullback resistance and aligns with the 78.60% Fibonacci Retracement, indicating potential resistance in this area.
USD/CHF:
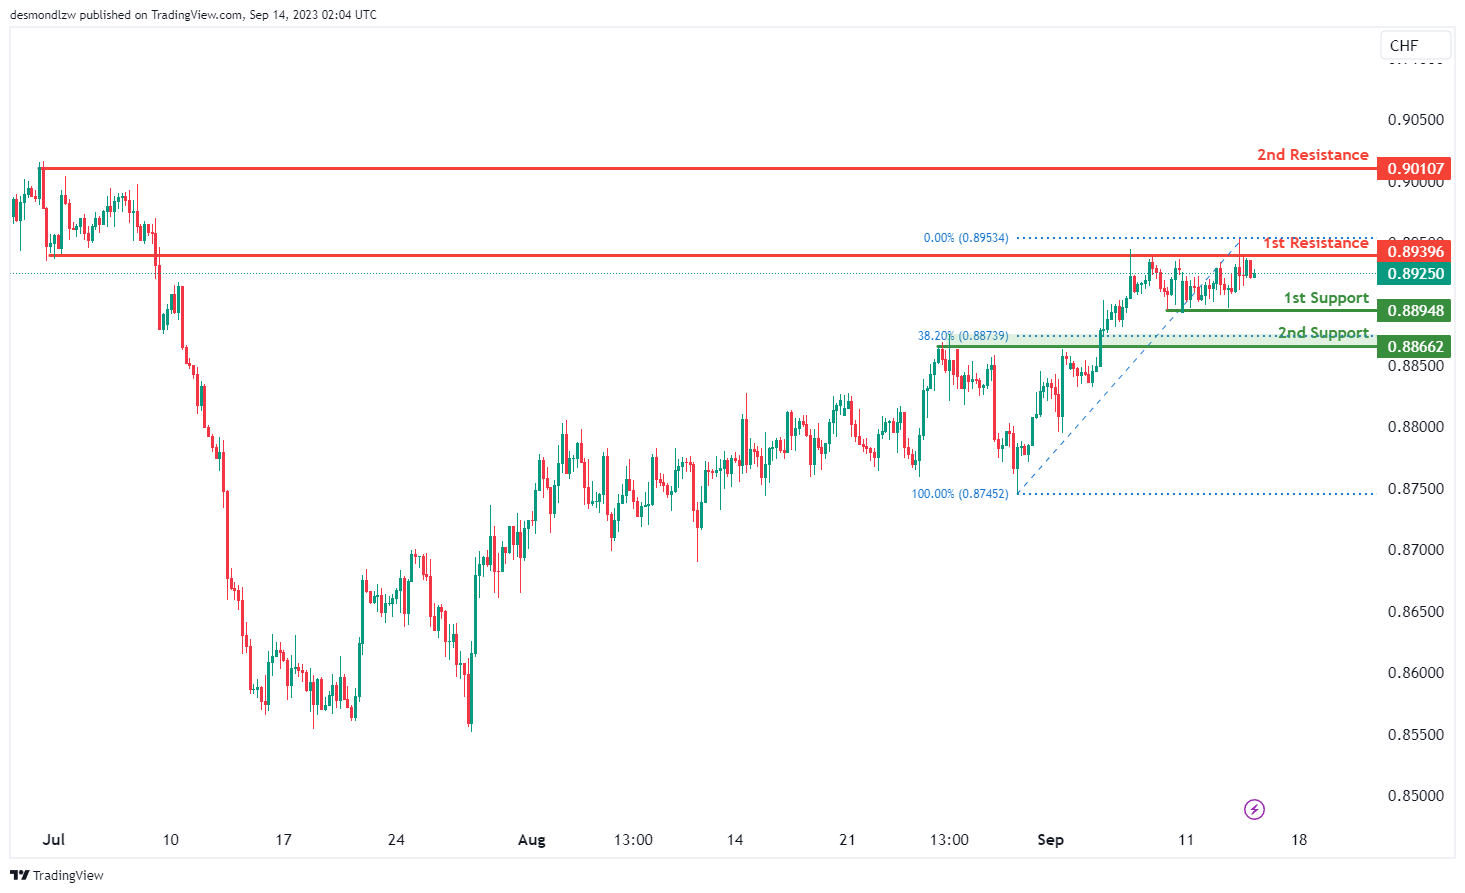
The USD/CHF chart currently demonstrates a neutral overall momentum, indicating a lack of a clear bullish or bearish trend.
In this neutral scenario, there is a potential for price to fluctuate within a range between the 1st support at 0.8866 and the 1st resistance at 0.8939.
The 1st support at 0.8866 is identified as a pullback support and aligns with the 38.20% Fibonacci Retracement level, enhancing its significance as a potential area of price support.
On the resistance side, the 1st resistance at 0.8939 is considered significant as it represents an overlap resistance.
Additionally, the 2nd resistance at 0.9010 is noted as a swing high resistance, further reinforcing its potential as a resistance level.
USD/JPY:
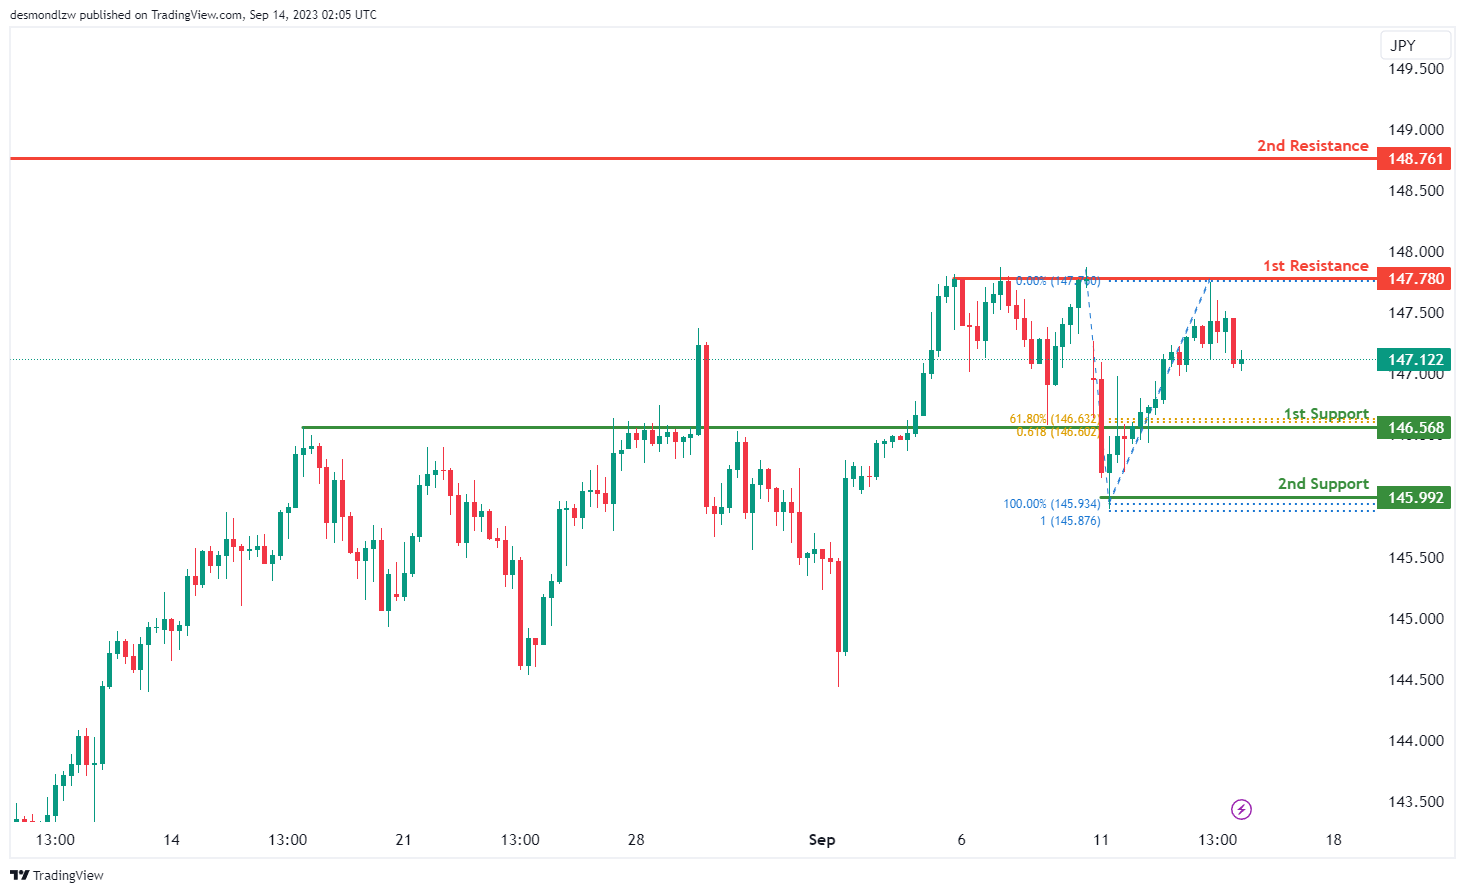
The USD/JPY chart currently exhibits a bearish overall momentum, suggesting a potential downward trend in price.
There is a possibility that price may continue its bearish movement towards the 1st support level at 146.56. This support level is considered significant as it aligns with a swing low support and coincides with both the 61.80% Fibonacci Projection and the 61.80% Fibonacci Retracement, indicating a strong potential support zone.
Additionally, the 2nd support level at 145.99 is marked as a multi-swing low support and aligns with the 100% Fibonacci Projection, further reinforcing its potential role as a support level.
On the resistance side, the 1st resistance at 147.78 is considered significant as it represents a multi-swing high resistance.
Furthermore, the 2nd resistance level at 148.76 is identified as a swing high resistance.
USD/CAD:
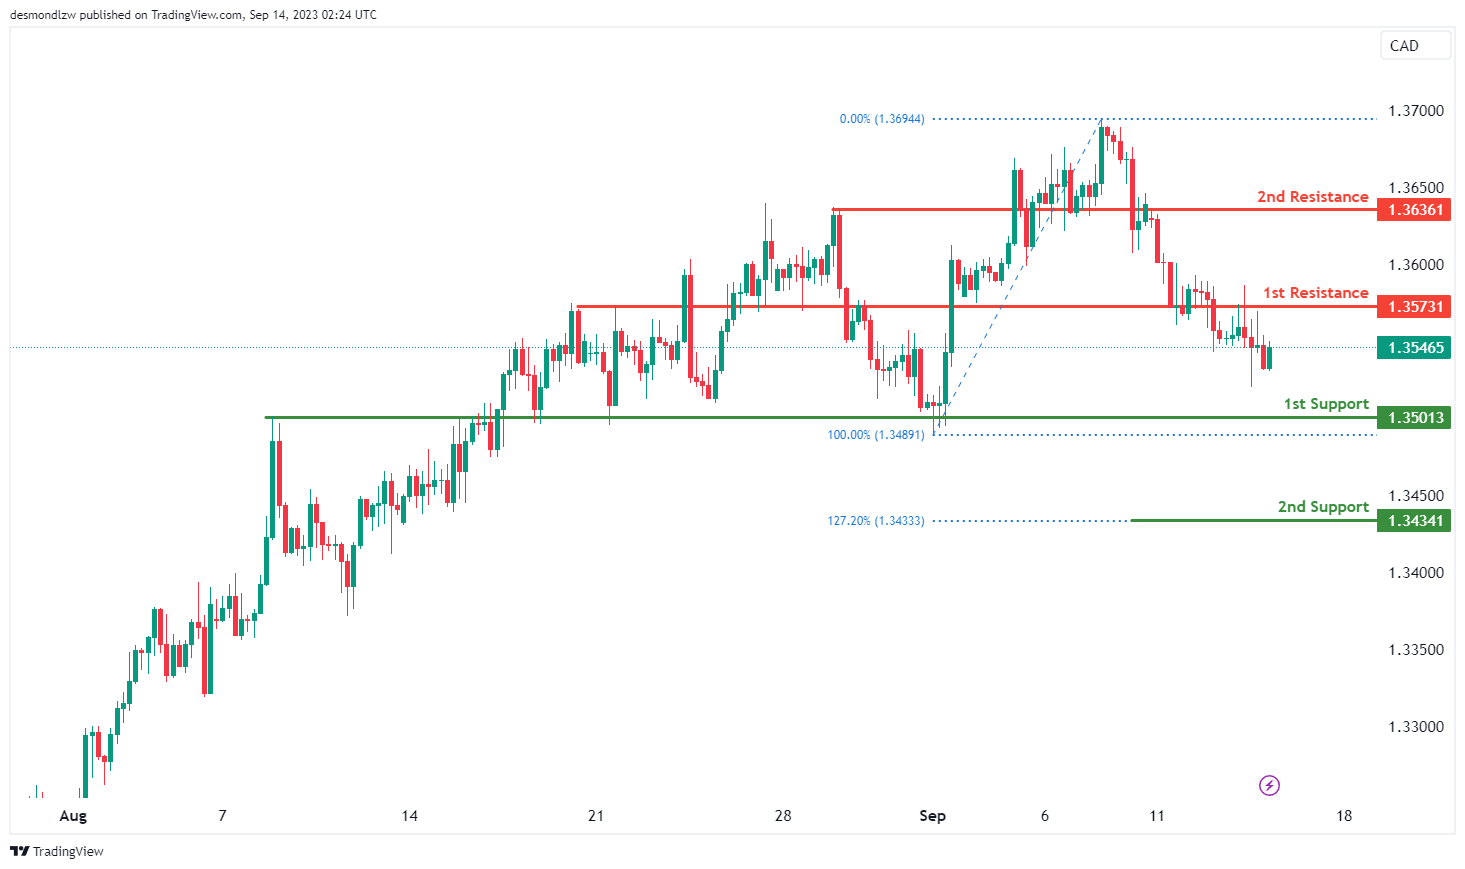
The USD/CAD chart currently displays an overall bullish momentum, indicating the potential for an upward price trend. There is a possibility of a bullish continuation towards the 1st resistance level.
The 1st resistance level at 1.3573 is identified as an overlap resistance while the 2nd resistance level at 1.3636 is also noted as another overlap resistance, indicating potential resistance in this area.
To the downside, the 1st support level at 1.3501 is identified as an overlap support while the 2nd support level at 1.3434 is marked as a pullback support, further reinforcing its role as a potential support zone.
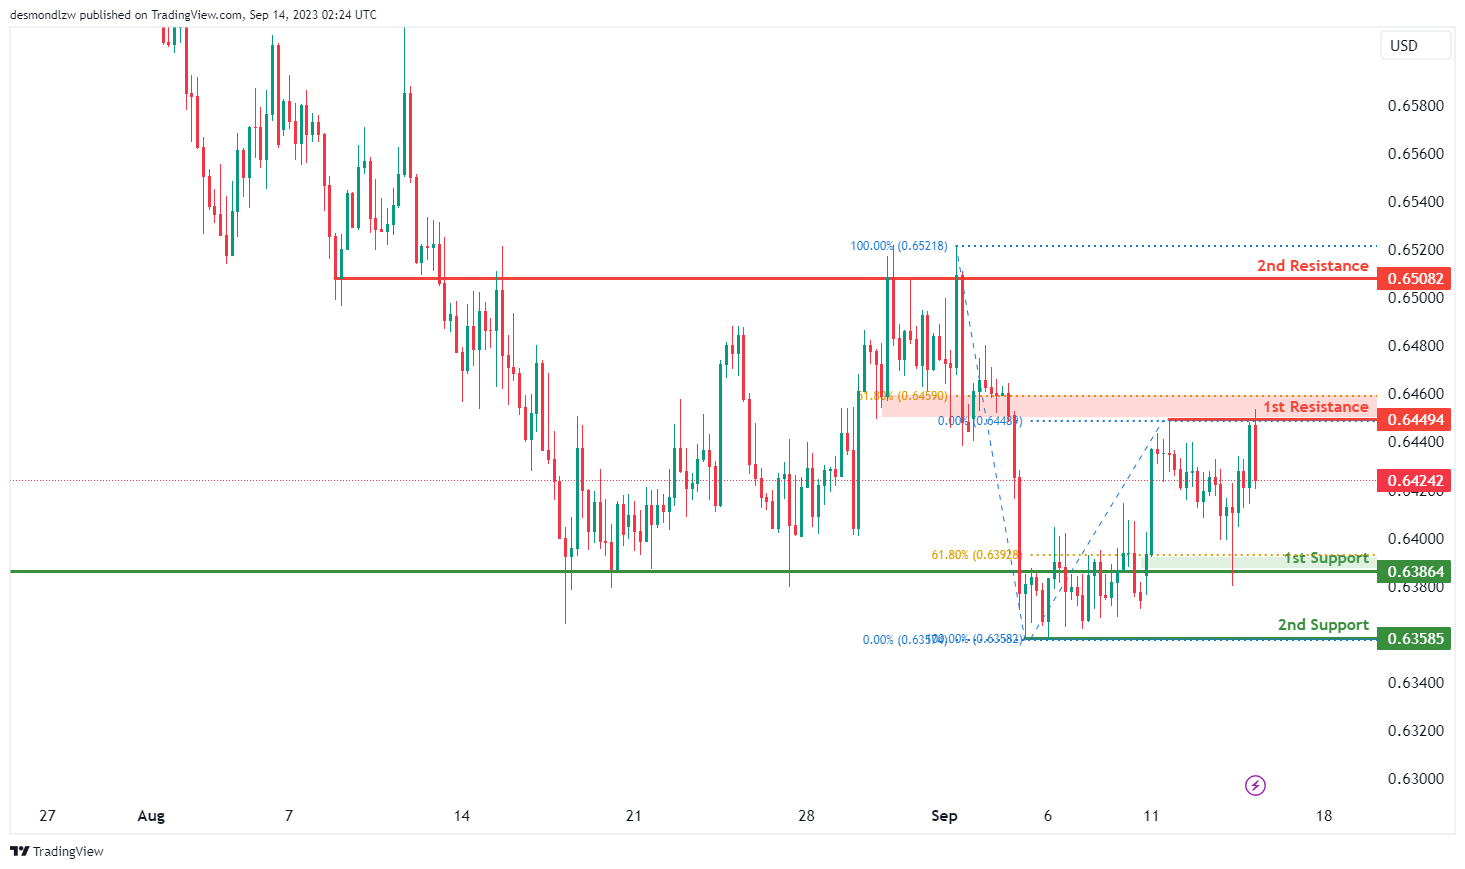
AUD/USD:
The AUD/USD chart currently exhibits an overall bearish momentum, suggesting a potential downward trend in price movement. There is a possibility of a bearish continuation towards the 1st support level.
The 1st support level at 0.6386 is identified as an overlap support that aligns with the 61.80% Fibonacci retracement level. Additionally, the 2nd support level at 0.6359 is marked as a pullback support, further reinforcing its potential role as a support level.
To the upside, the 1st resistance level at 0.6449 is identified as a multiple swing-high resistance that aligns with the 61.80% Fibonacci retracement level. Furthermore, the 2nd resistance level at 0.6508 is marked as an overlap resistance, suggesting potential resistance in this area.
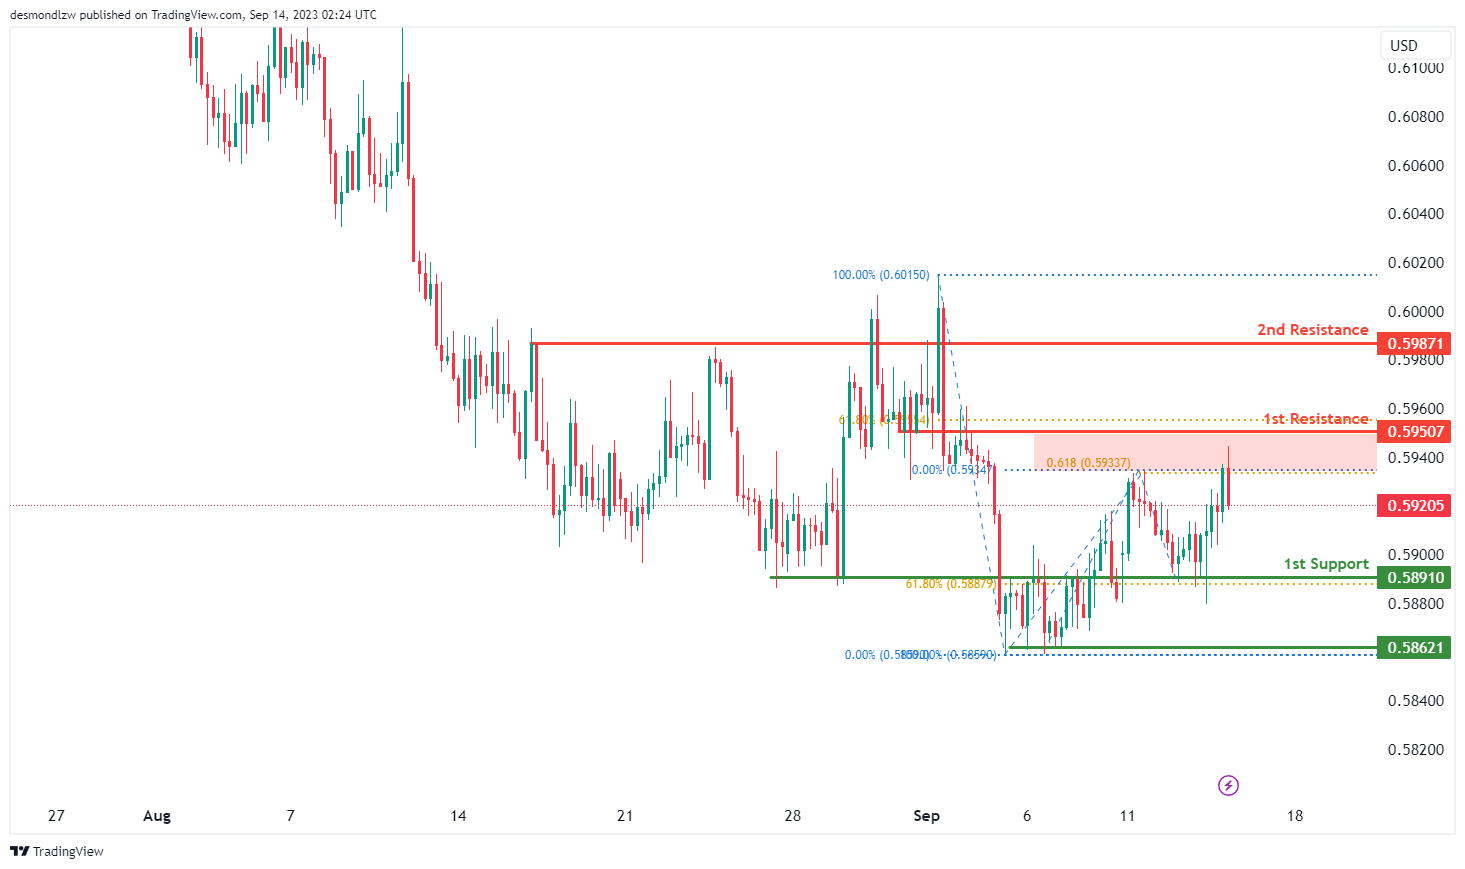
NZD/USD
The NZD/USD chart currently indicates an overall bearish momentum, indicating a potential downward trend in price movement. There is a possibility of a bearish continuation towards the 1st support level.
The 1st support level at 0.5891 is identified as an overlap support that aligns with the 61.80% Fibonacci retracement level. Additionally, the 2nd support level at 0.5862 is marked as a pullback support, further reinforcing its potential role as a support level.
To the upside, the 1st resistance level at 0.5951 is identified as an overlap resistance that aligns with a confluence of Fibonacci levels i.e. the 61.80% retracement and the 61.80% projection levels, indicating a strong potential resistance zone. Furthermore, the 2nd resistance level at 0.5987 is noted as a pullback resistance.
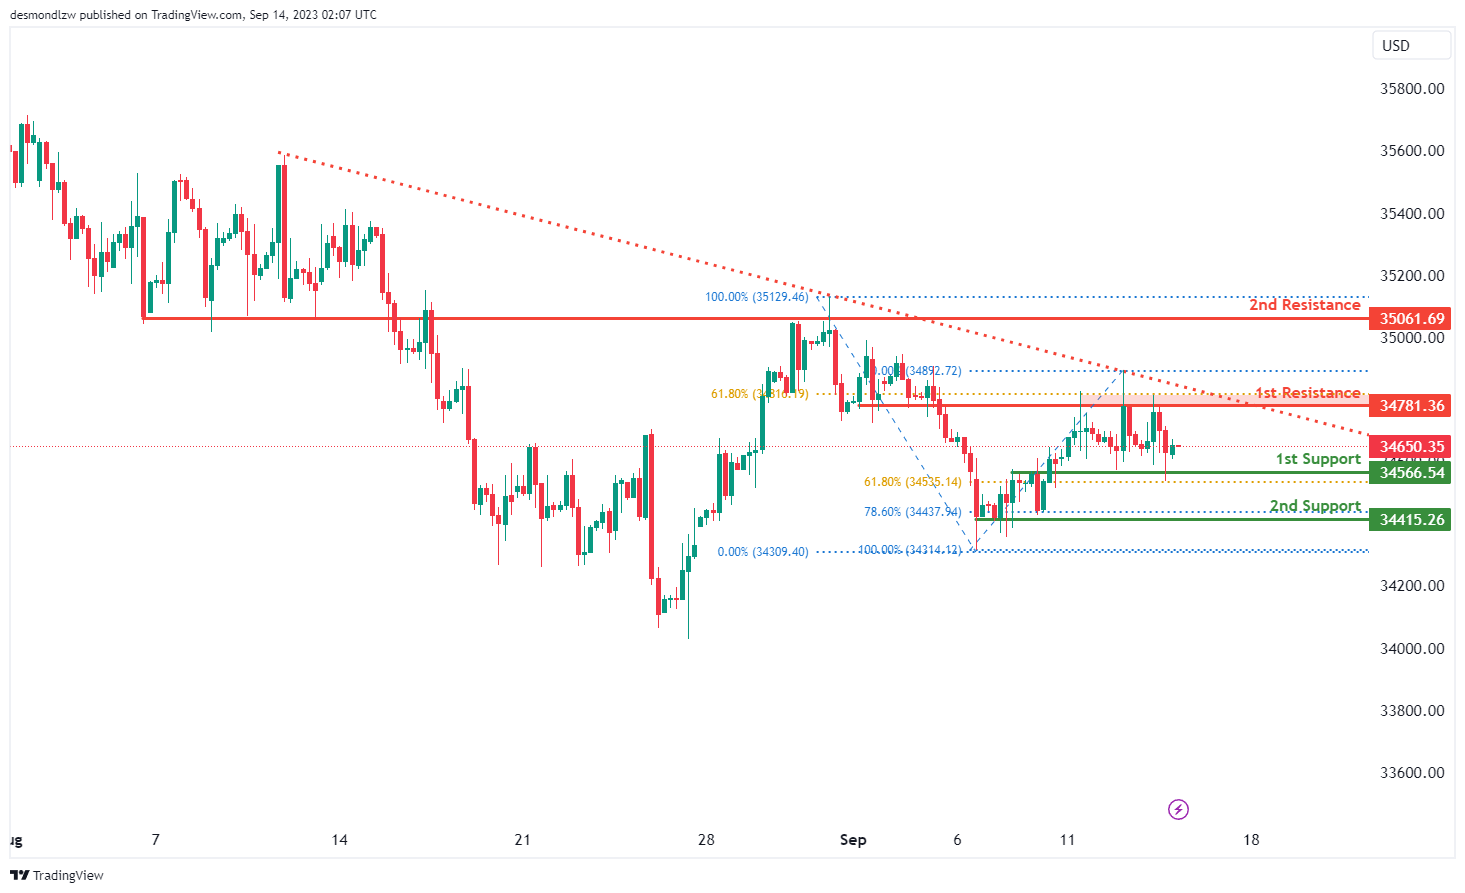
DJ30:
The DJ30 (Dow Jones Industrial Average) chart currently exhibits a bearish overall momentum, primarily attributed to the fact that the price is trading below a major descending trend line. This suggests a predisposition towards further bearish price movements.
There is a potential scenario in which the bearish momentum continues, leading the price to decline towards the 1st support level at 34,635.75. This support level is significant as it represents an overlap support and coincides with the 61.80% Fibonacci Retracement level, indicating a strong potential support zone.
Furthermore, the 2nd support level at 34,415.26 is identified as a multi-swing low support and aligns with the 78.60% Fibonacci Retracement level, reinforcing its role as a potential support area.
On the resistance side, the 1st resistance at 34,781.36 is considered an overlap resistance and aligns with the 61.80% Fibonacci Retracement level, signifying a significant potential barrier to any bullish movements. Additionally, the 2nd resistance at 35,061.69 is characterized as an overlap resistance.
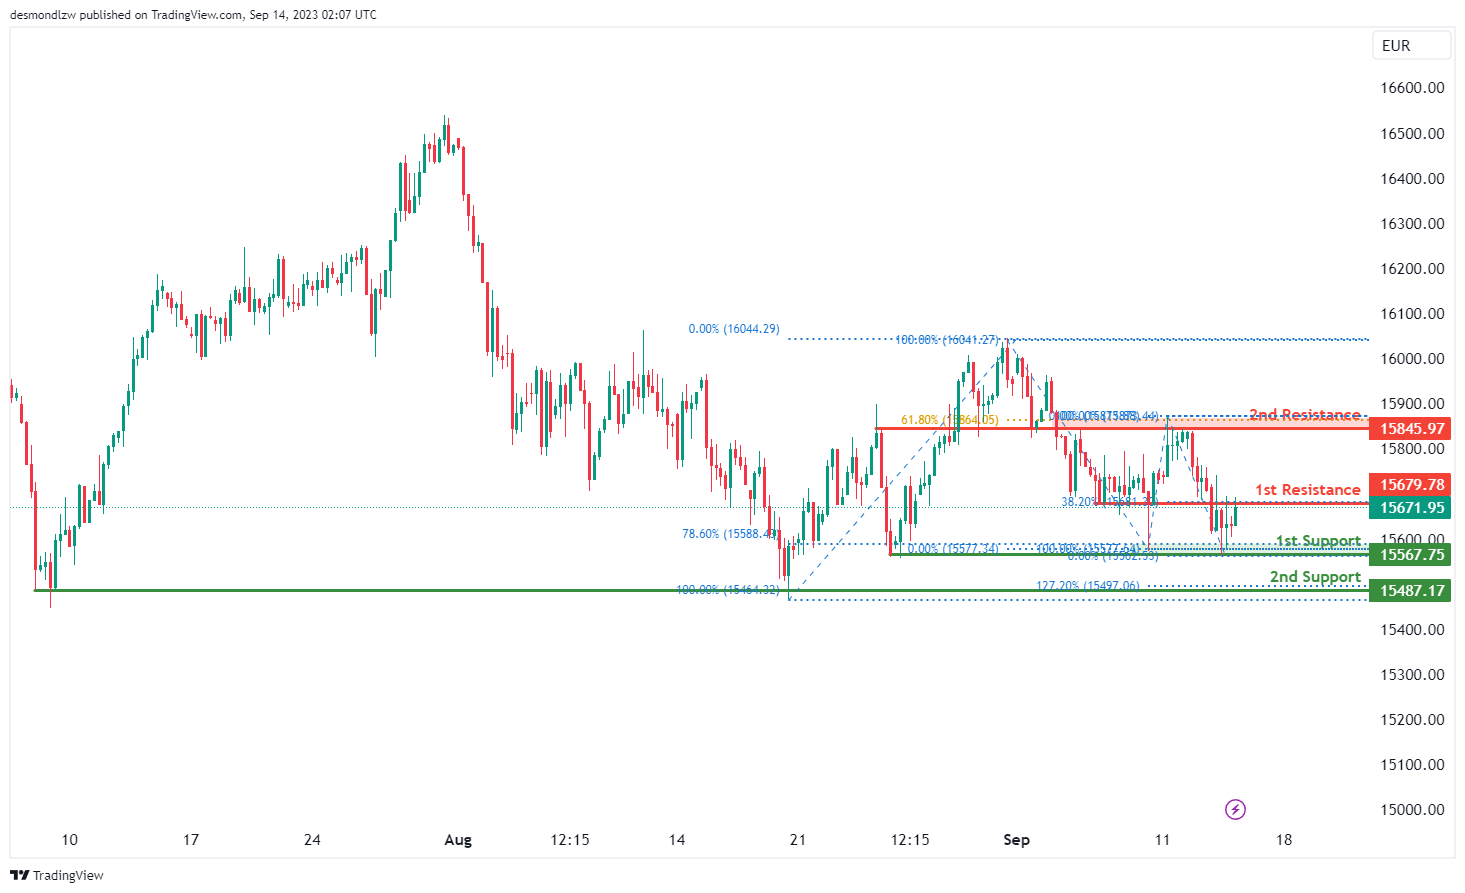
GER30:
The GER30 chart is currently displaying a neutral overall momentum, indicating a lack of a clear directional bias. Given this neutral outlook, it is anticipated that the price could move within a range, fluctuating between the 1st resistance and 1st support levels.
The 1st support level at 15567.75 is considered significant due to its alignment with a multi-swing low support, potentially serving as a strong level of price support. Additionally, the 2nd support at 15487.17 is marked as a swing low support and further reinforces its potential as a support zone.
On the resistance side, the 1st resistance level at 15679.78 is characterized as an overlap resistance, which may act as a barrier to any potential upward movements. The 2nd resistance at 15845.97 aligns with the 61.80% Fibonacci Retracement and is also noted as an overlap resistance, indicating a significant zone of potential resistance.
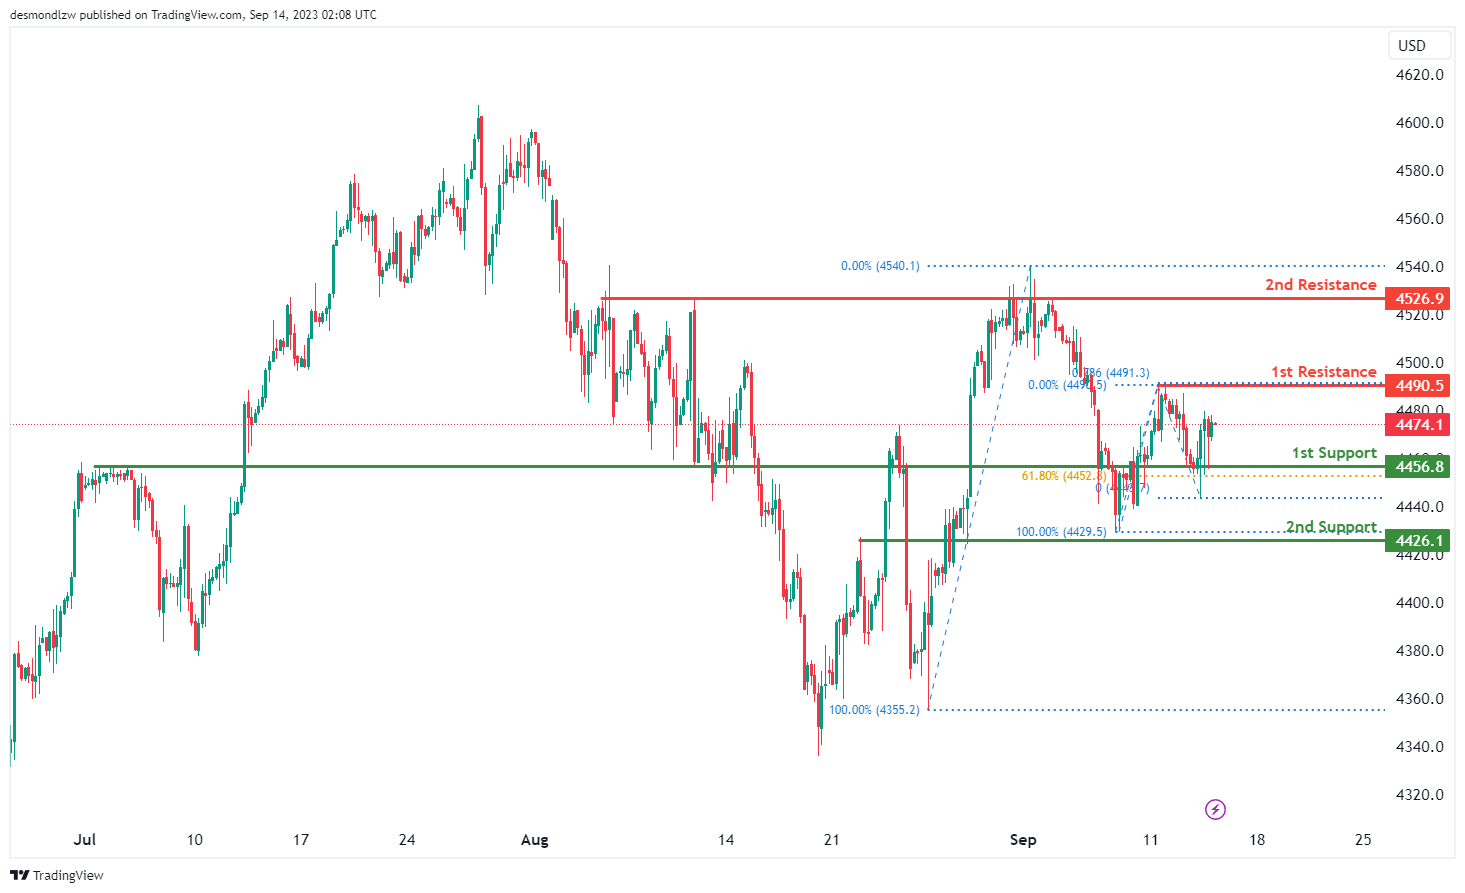
US500
The US500 chart currently exhibits a bullish overall momentum, indicating a potential upward trend in price movement. Given this bullish outlook, it is anticipated that the price could continue its bullish trajectory towards the 1st resistance.
The 1st support level at 4456.8 is marked as an overlap support and aligns with the 61.80% Fibonacci Retracement level, signifying a robust potential support zone. Additionally, the 2nd support at 4426.1 is identified as an overlap support, further reinforcing its role as a potential support level.
On the resistance side, the 1st resistance level at 4490.5 is characterized as a swing high resistance, which could pose a challenge to further bullish movements. The 2nd resistance at 4526.9 aligns with multi-swing high resistance, indicating a significant area of potential resistance.
BTC/USD:
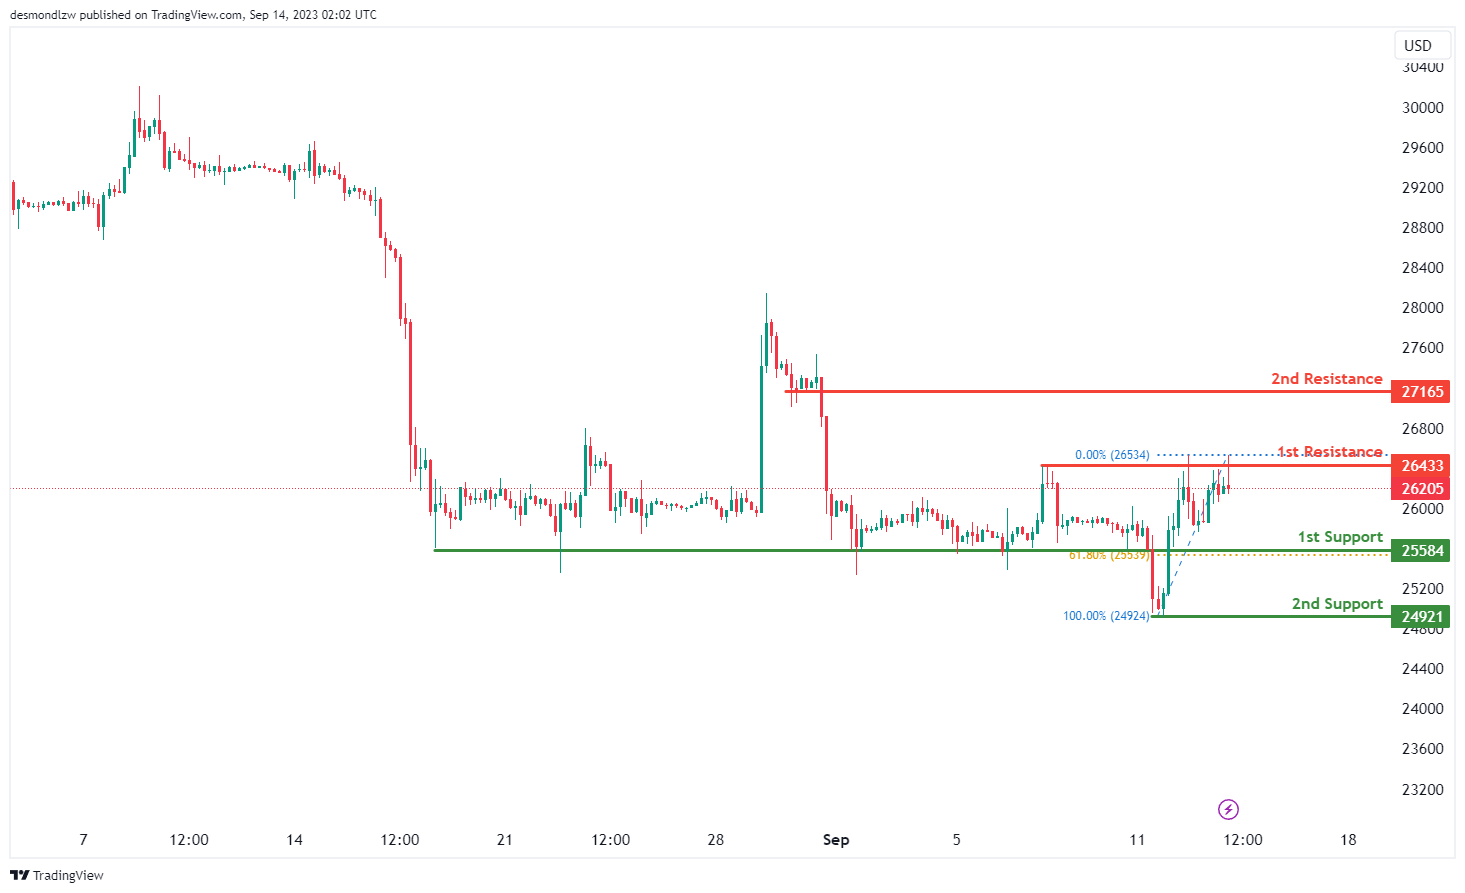
The BTC/USD chart currently displays a bearish overall momentum, indicating the potential for a continued downward trend in price movement. It is anticipated that the price could sustain this bearish trajectory towards the 1st support.
The 1st support level at 25,584 is marked as a pullback support and coincides with the 61.80% Fibonacci Retracement level, signifying a robust potential support area. Additionally, the 2nd support at 24,921 is identified as a swing low support, further reinforcing its role as a potential support level.
On the resistance side, the 1st resistance level at 26,453 is characterized as a multi-swing high resistance, which may act as a barrier to further bearish movements. The 2nd resistance at 27,165 aligns with pullback resistance, indicating a significant area of potential resistance.
ETH/USD:
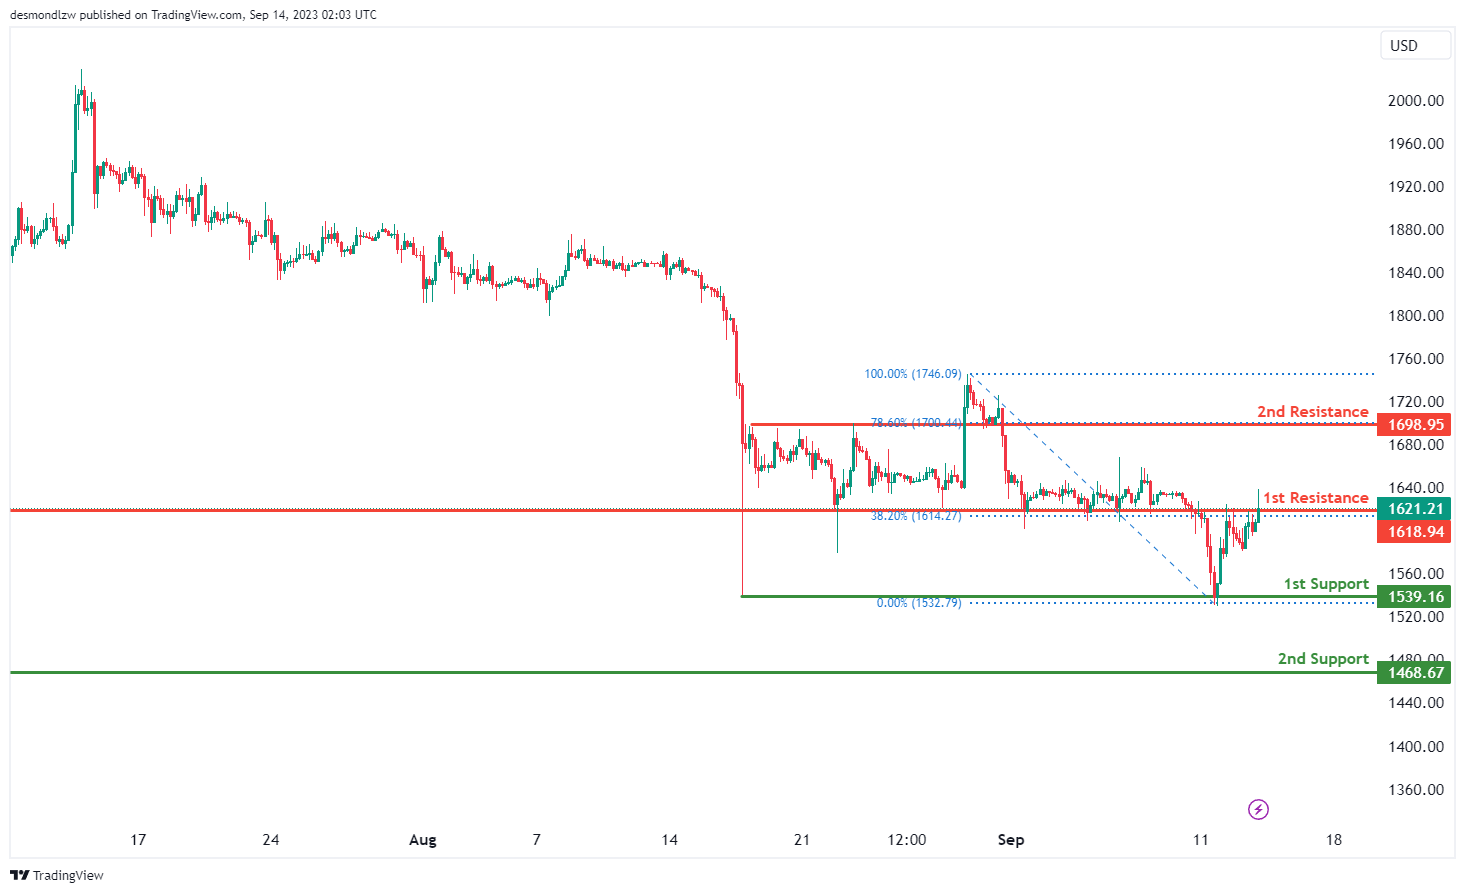
The ETH/USD chart is currently characterized by a bearish overall momentum, indicating the potential for a continued downward trend in price. There is a possibility that the price might react bearishly when it approaches the 1st resistance and subsequently drop towards the 1st support.
The 1st support level at 1,539.16 is identified as a multi-swing low support, signifying its significance as a potential support zone. Additionally, the 2nd support at 1,468.67 is a swing low support, further strengthening its role as a potential support level.
On the resistance side, the 1st resistance at 1,618.94 is marked as an overlap resistance, and it aligns with the 38.20% Fibonacci Retracement level, suggesting a significant area of potential resistance. Furthermore, the 2nd resistance at 1,698.95 is characterized as pullback resistance, indicating another key level of potential resistance.
WTI/USD:
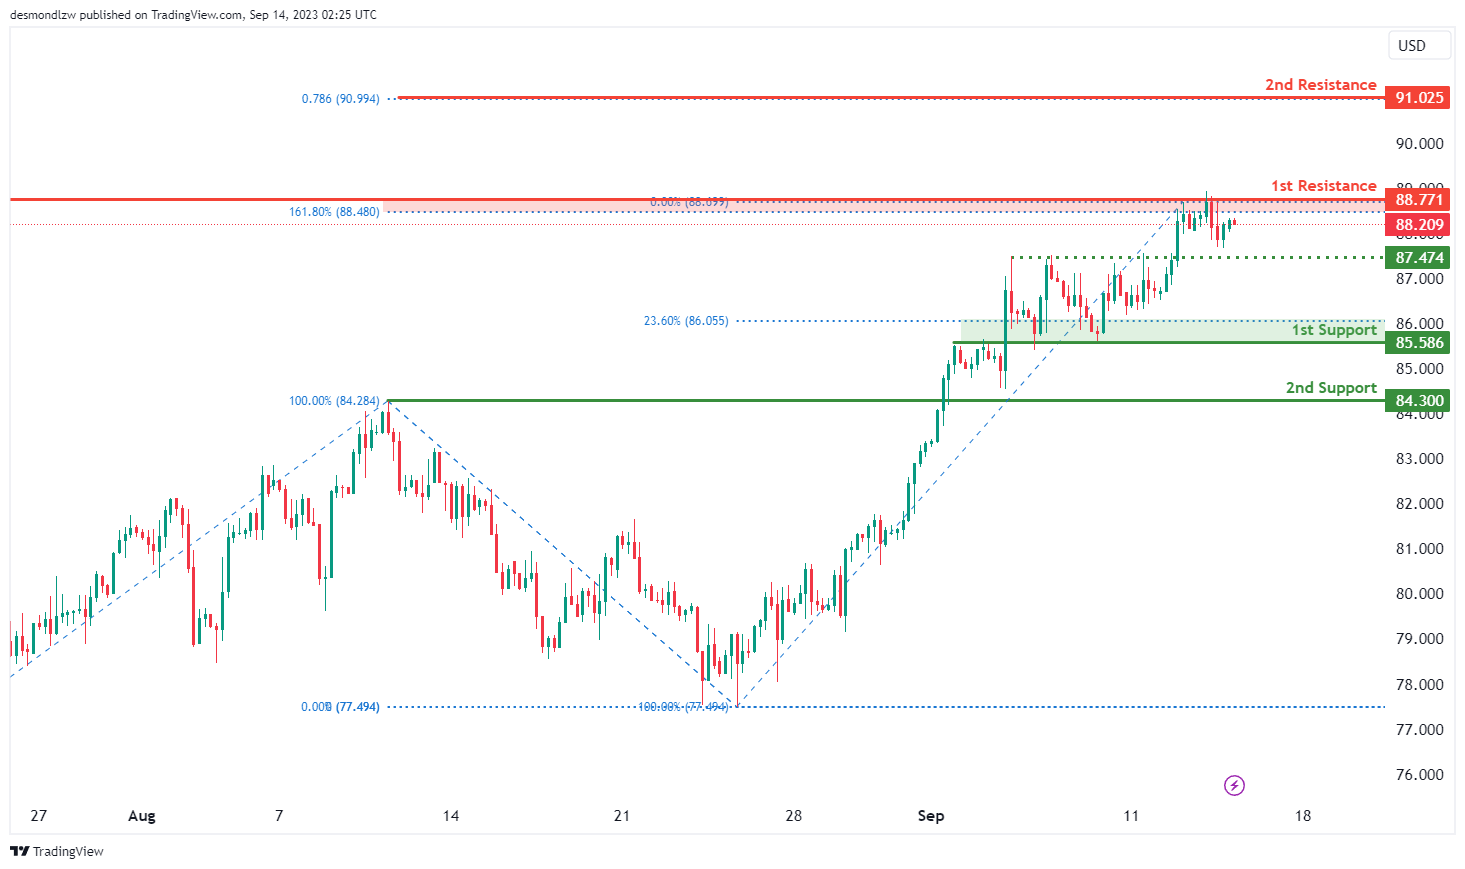
The WTI chart currently indicates a weak bullish momentum with low confidence, suggesting a tentative upward trend in price movement. There is a possibility of a bullish continuation towards the 1st resistance level.
The 1st resistance level at 88.77 is identified as an overlap resistance that aligns with the 161.80% Fibonacci extension level. Furthermore, the 2nd resistance level at 91.03 is marked as a resistance level that aligns with the 78.6% Fibonacci projection level, suggesting potential resistance in this area.
To the downside, there is an intermediate support level at 87.47, which is identified as a pullback support.
The 1st support at 85.59 is identified as an overlap support that aligns with the 23.60% Fibonacci retracement level. Additionally, the 2nd support level at 84.30 is marked as a pullback support, further reinforcing its potential role as a support level.
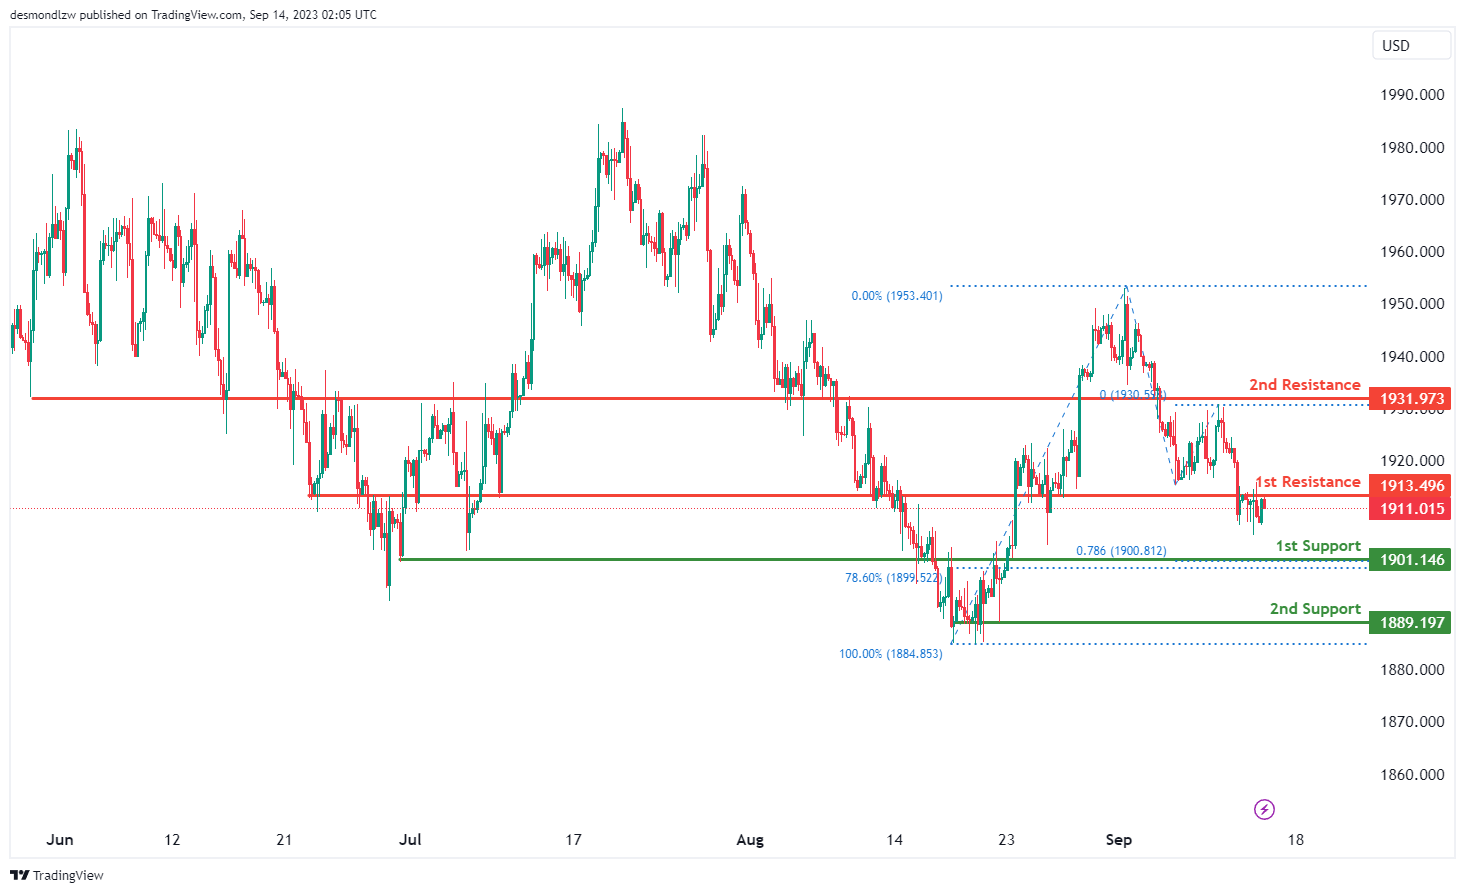
XAU/USD (GOLD):
The XAU/USD chart currently displays a bearish overall momentum, indicating a potential downward trend in price.
There’s a possibility that price may continue its bearish movement towards the 1st support level at 1901.14. This support level is considered significant as it aligns with an overlap support and coincides with both the 78.60% Fibonacci Retracement and the 78.60% Fibonacci Projection, indicating a strong potential support zone.
Additionally, the 2nd support level at 1889.19 is marked as a multi-swing low support, further reinforcing its potential role as a support level.
On the resistance side, the 1st resistance at 1913.49 is identified as an overlap resistance, and the 2nd resistance level at 1931.97 is also noted as an overlap resistance.
Bitcoin Price Aims Fresh Increase To $28K But Faces Hurdles
Key Highlights
- Bitcoin price is eyeing a steady increase toward $28,000.
- BTC broke a key bearish trend line with resistance at $25,820 on the 4-hour chart.
- EUR/USD is struggling to recover above the 1.0800 resistance.
- Crude oil prices rallied further toward the $90 level.
Bitcoin Price Technical Analysis
Bitcoin price extended downsides and traded below the $26,000 level. However, losses were limited, and BTC/USD found support near $24,850.
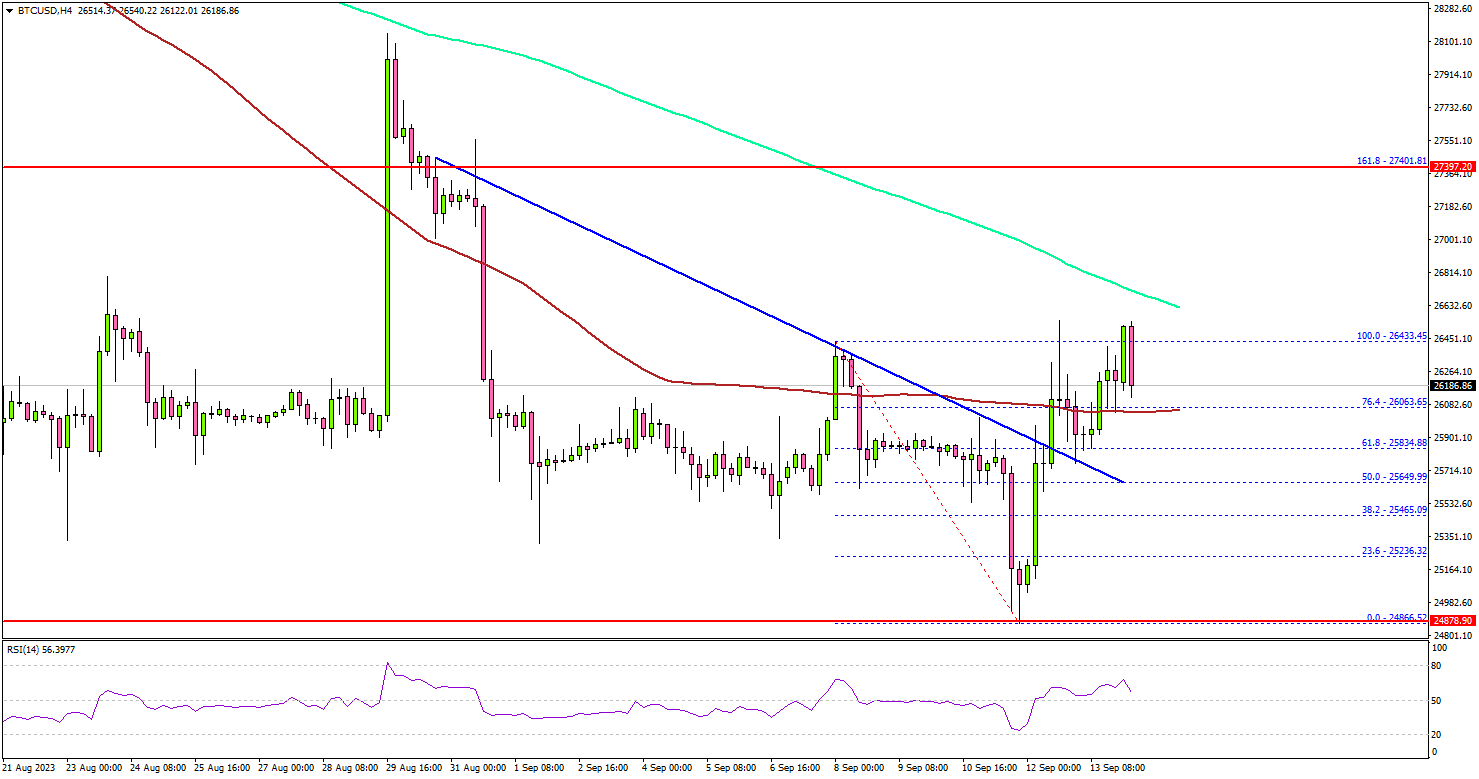
Looking at the 4-hour chart, the price started a fresh increase above the $25,200 and $25,500 levels. It broke a key bearish trend line with resistance at $25,820. There was a move above the 61.8% Fib retracement level of the downward move from the $26,433 swing high to the $24,866 low.
On the upside, the price is facing resistance near the $26,650 level and the 200 simple moving average (green, 4 hours). A successful close above the $26,650 level might spark a decent increase.
In the stated case, the price may perhaps rise toward the $27,500 level. The next stop for Bitcoin bulls may perhaps be near the $28,000 level.
If not, Bitcoin might start another decline below the $25,800 support. The next major support is near the $25,450 level. If there is a downside break and a close below $25,450, Bitcoin might revisit the $24,850 zone.
Economic Releases
- US Initial Jobless Claims - Forecast 225K, versus 216K previous.
- US Retail Sales for August 2023 (MoM) – Forecast +0.2%, versus +0.7% previous.
Australia’s employment grew 64.9k in Aug, eclipses expectation
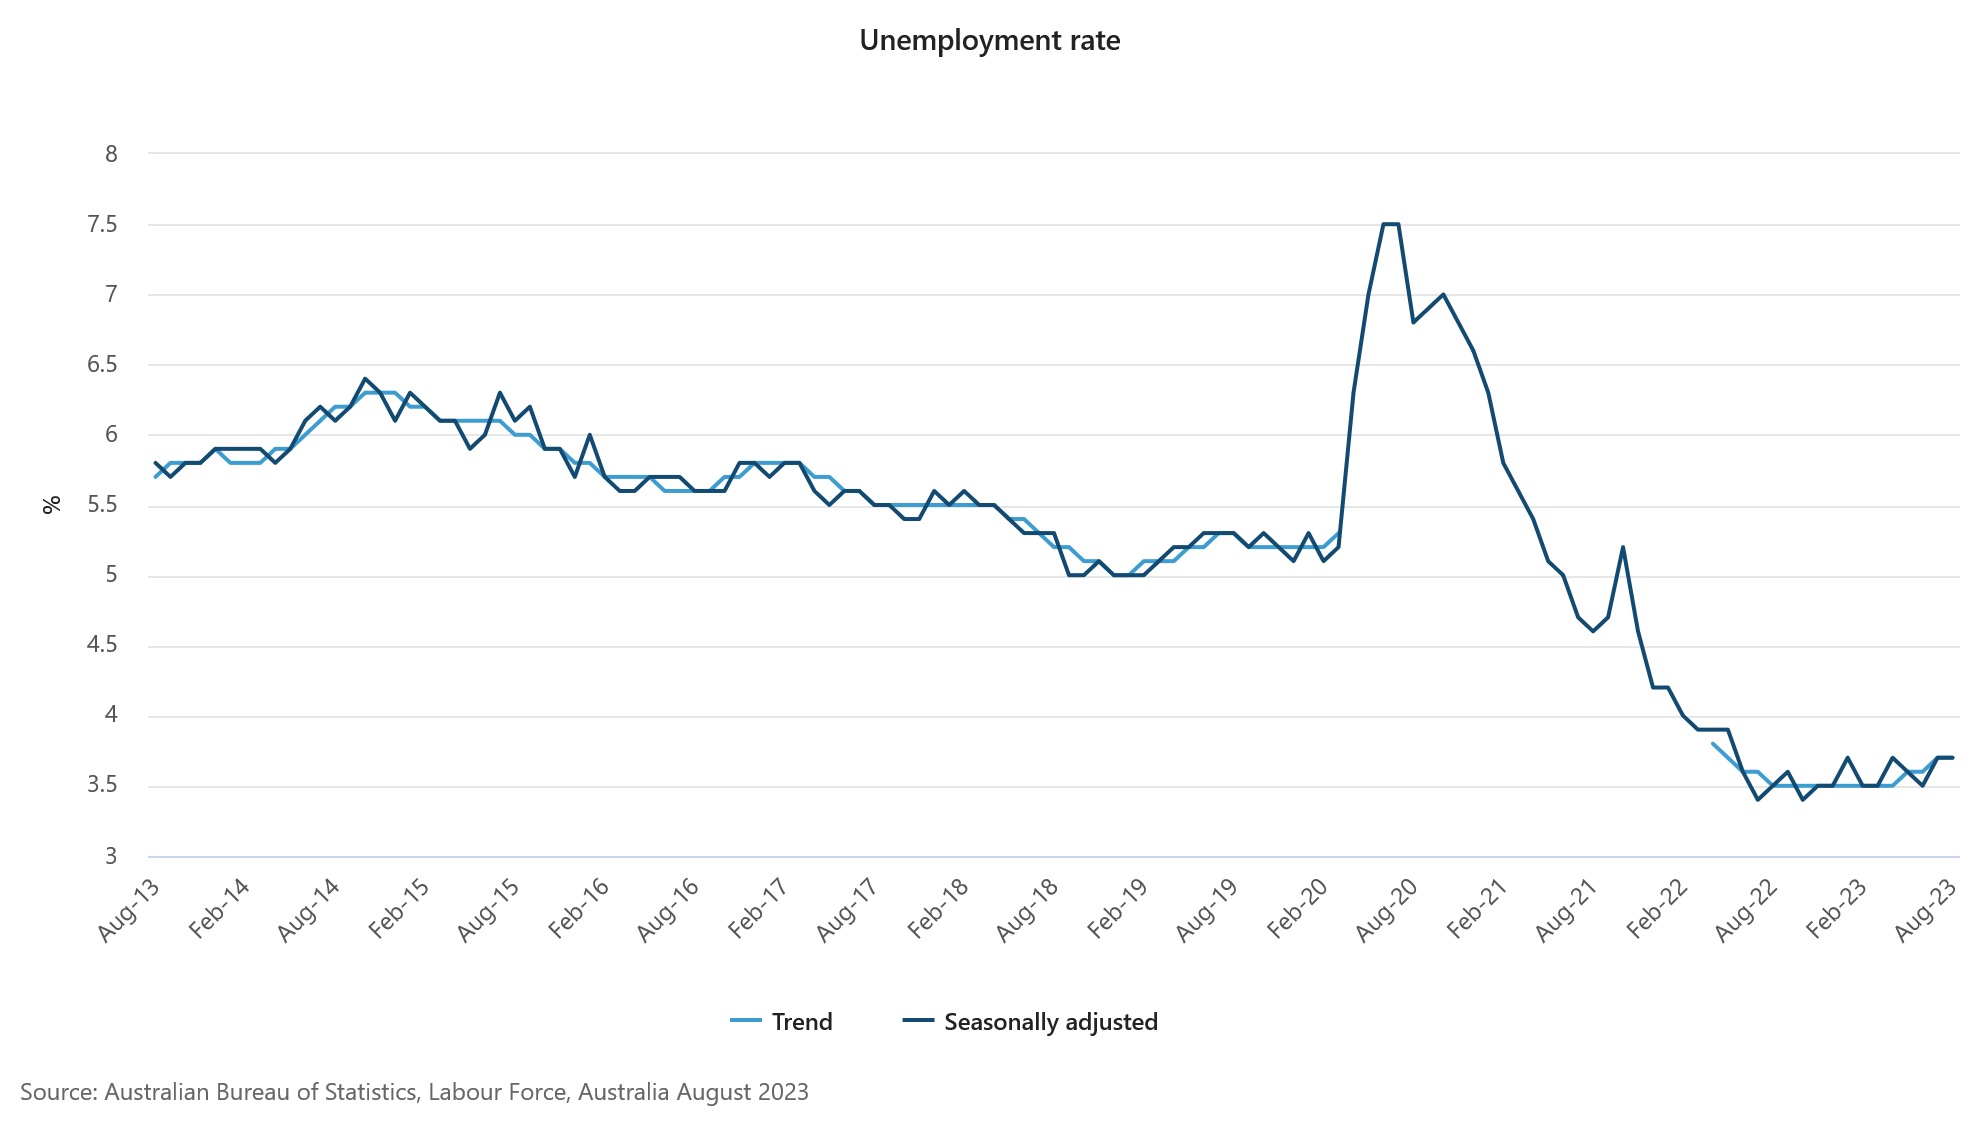
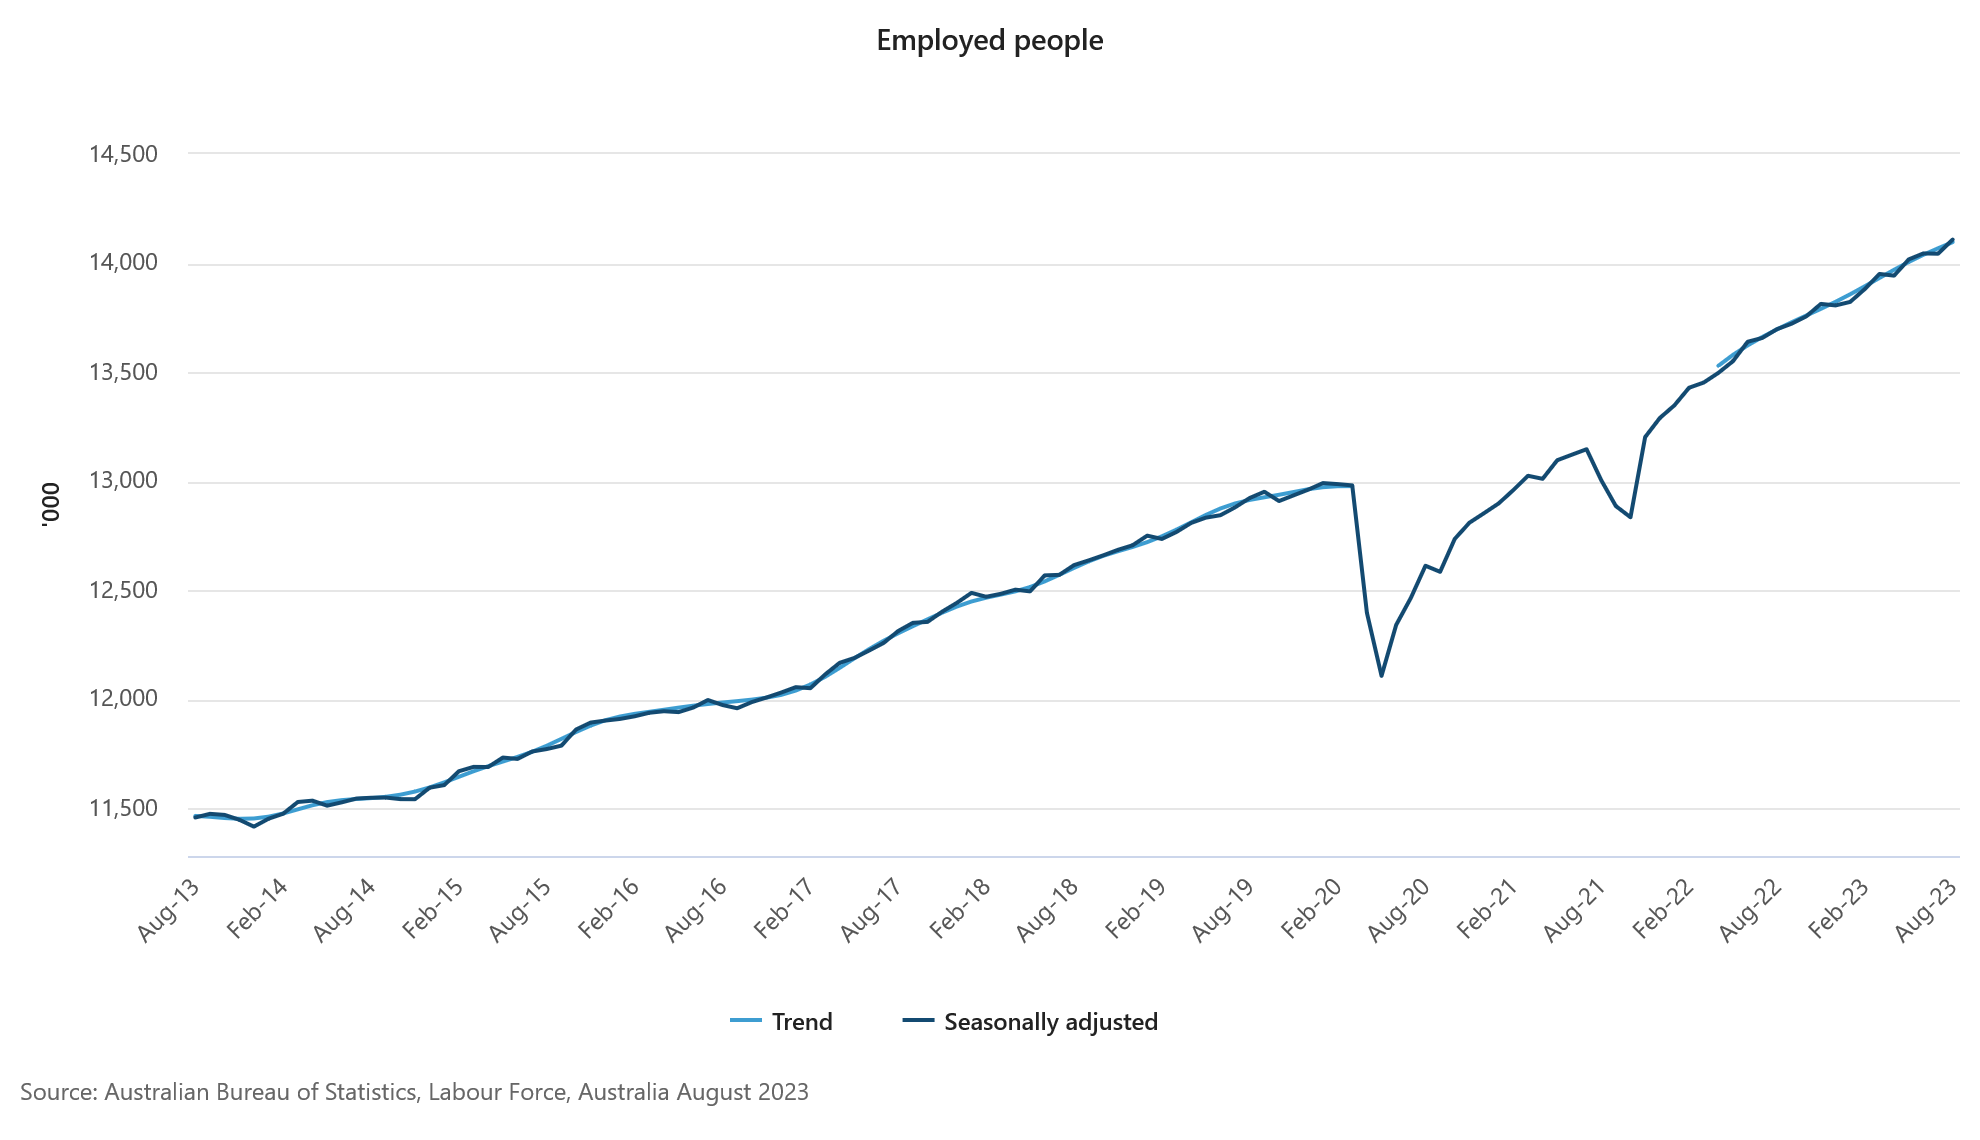
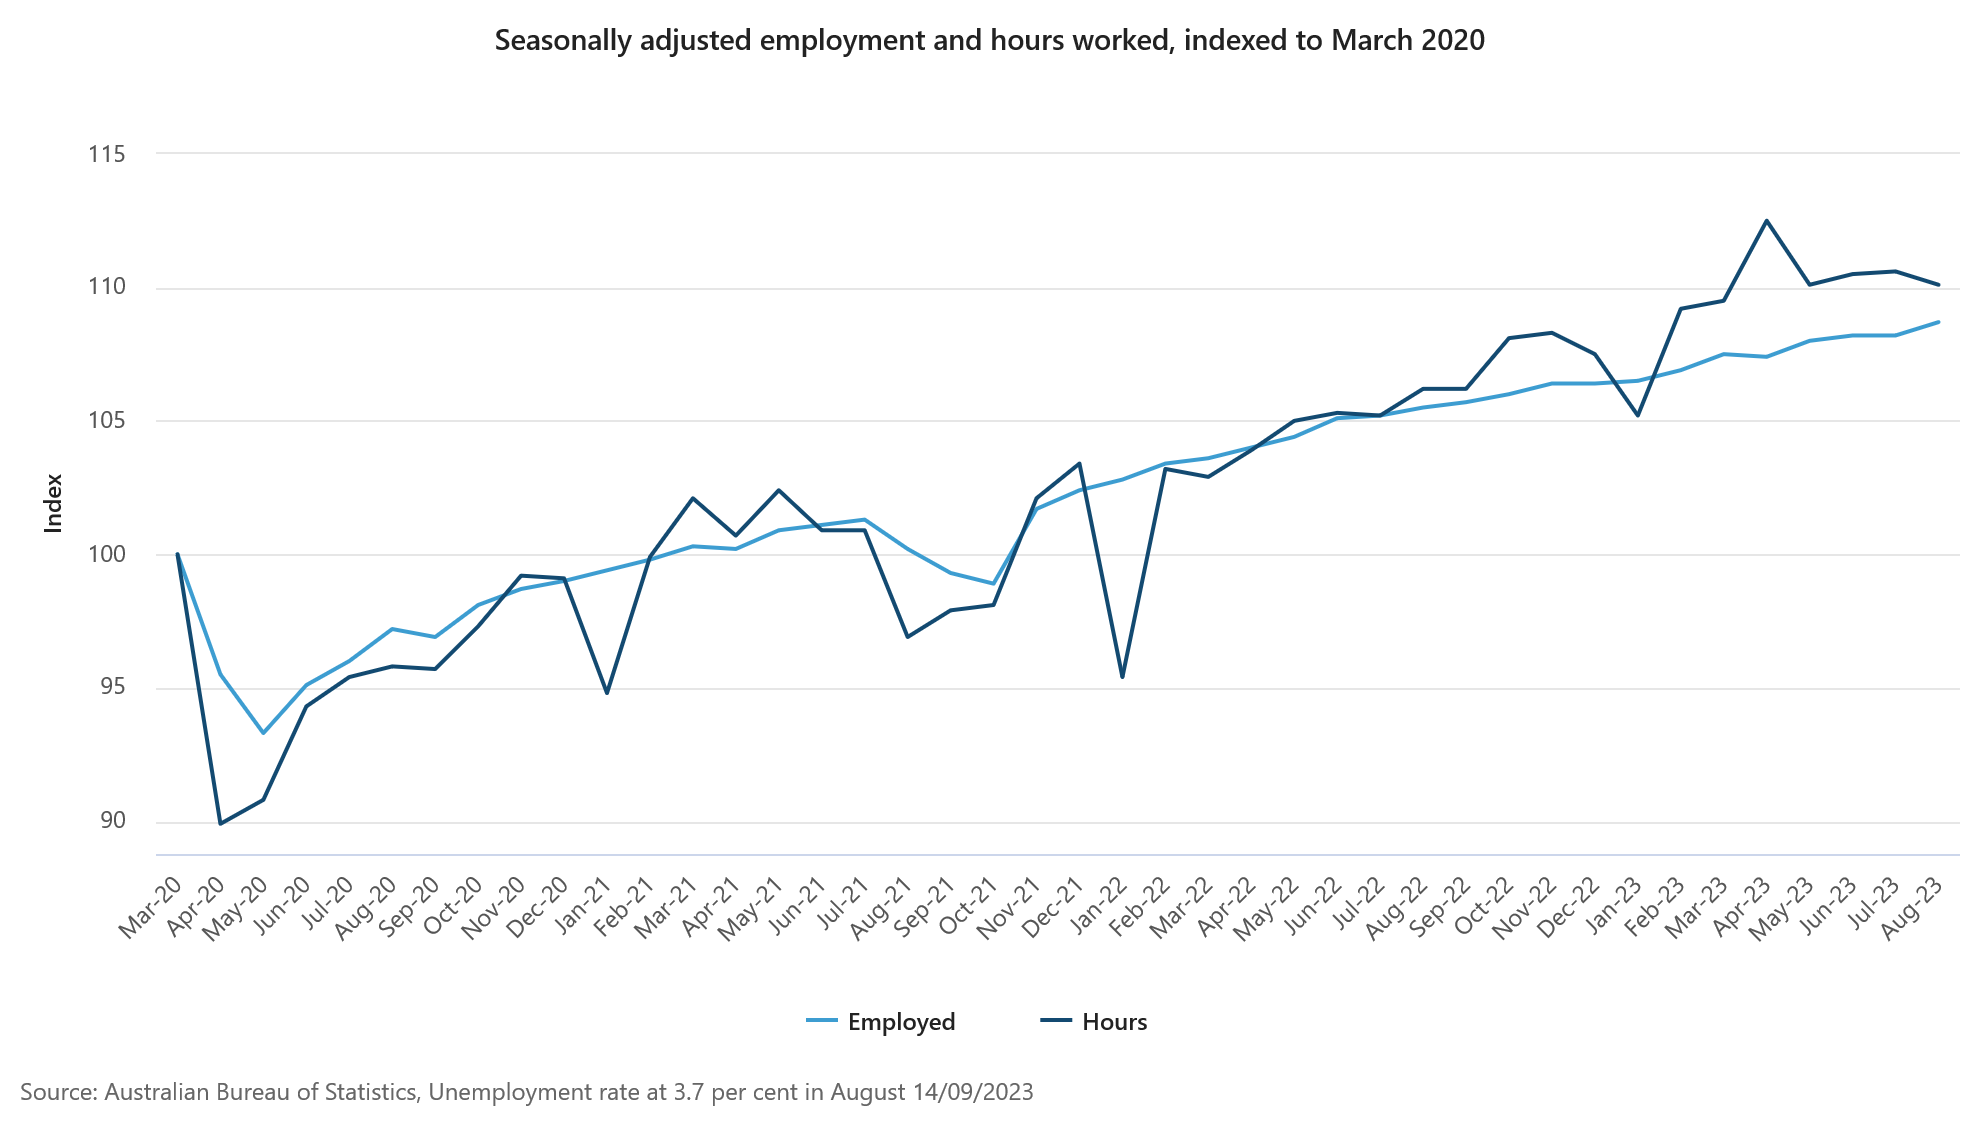
Australia's job market demonstrated strength in August as employment numbers surged by 64.9k, a 0.5% mom increase, substantially eclipsing expectation of 24.3k. Dissecting this growth reveals a modest increment in full-time jobs, which saw rise of 2.8k, whereas part-time positions surged, accounting for 62.1k rise.
Unemployment rate remained steady at 3.7%, aligning with market anticipations. Concurrently, there was a slight uptick in participation rate, which climbed by 0.1% to reach 67.0%. Monthly hours worked dropped -0.5% mom or -9m hours.
Bjorn Jarvis, head of labour statistics at ABS, contextualized this development, linking the pronounced growth in August to a minor slump experienced in July, a period coinciding with school holidays. The two-month average employment increment was roughly around 32k monthly, mirroring the mean growth observed over the past year.
"The strength in hours worked over the past year, relative to employment growth, shows the demand for labour is continuing to be met by people working more hours, to some extent," Jarvis noted.
UK RICS house price balance fell to 14-year low, deepening slump
In the latest sign of mounting pressures in the UK property market, RICS house price balance deteriorated notably, plummeting to -68 in August, down from -55 in the previous month. This development has surpassed the grim expectation set at -56 and marks the most unfavorable reading since February 2009.
Dissecting the UK reveals that almost every region is grappling with "relatively steep fall in house prices," as noted by RICS.
Looking ahead, surveyors anticipate that the upcoming months will not bring any reprieve. Short-term projections illustrate a more pronounced dip, with net balance drifting deeper into negative terrain at -67%, a decline from prior figure of -60%.
Furthermore, long-term outlook remains relatively unchanged but still under a cloud, with expectations cementing around a net balance of -48%, mirroring the sentiment recorded in both June and July.