Sample Category Title
GBP/USD Mid-Day Outlook
Daily Pivots: (S1) 1.2459; (P) 1.2494; (R1) 1.2529; More...
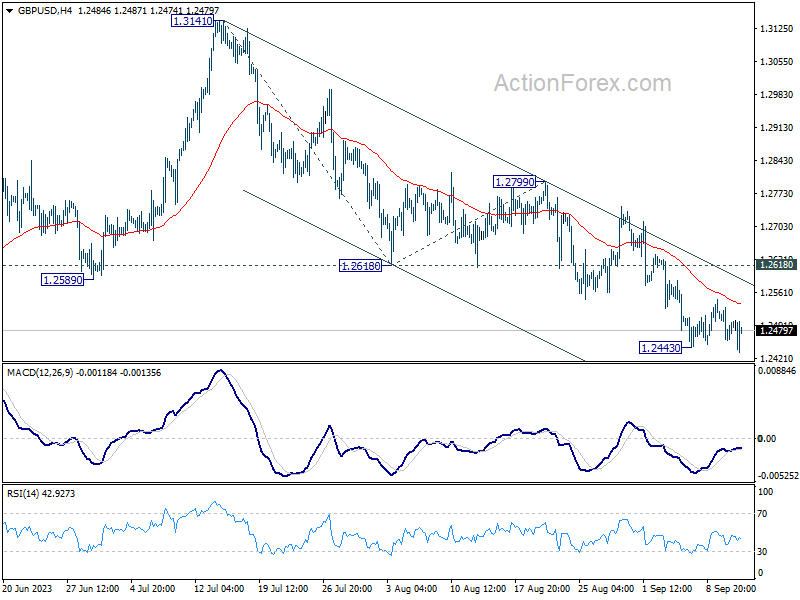
GBP/USD breached 1.2443 support briefly but quickly recovered. Intraday bias stays neutral first. More consolidation could be seen, but upside should be limited by 1.2618 support turned resistance to bring another fall. Firm break of 1.2443 will resume the decline from 1.3141 and target 100% projection of 1.3141 to 1.2618 from 1.2799 at 1.2276.
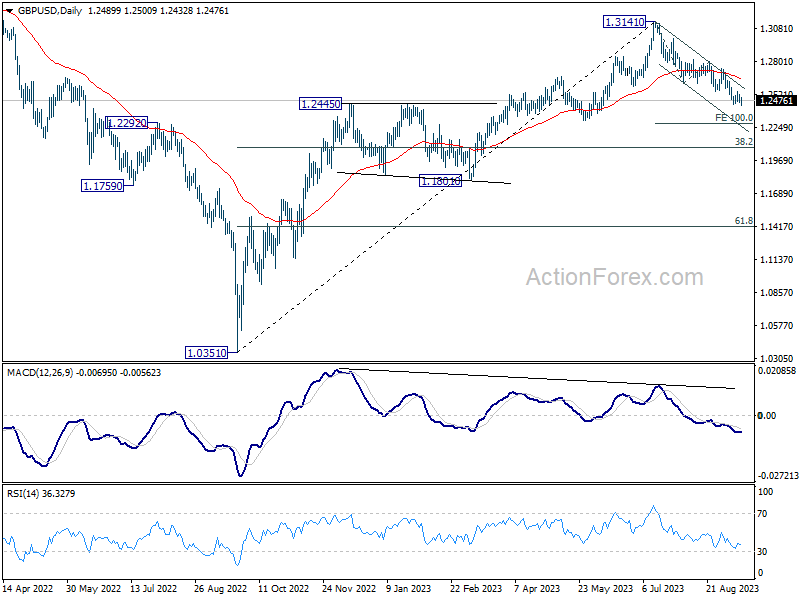
In the bigger picture, fall from 1.3141 medium term top is seen as a correction to up trend from 1.0351 (2022 low). Deeper decline would be seen to 38.2% retracement of 1.0351 to 1.3141 at 1.2075. Strong support would be seen there to bring rebound on first attempt. But outlook will be neutral at best as long as 1.3141 resistance holds, and consolidation from there is set to extend, until further development.
USD/CHF Mid-Day Outlook
Daily Pivots: (S1) 0.8899; (P) 0.8917; (R1) 0.8931; More....
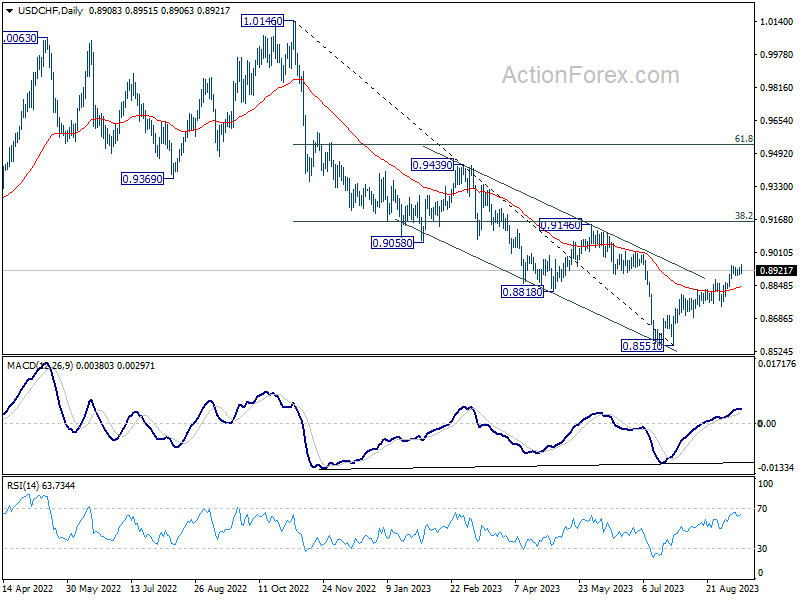
USD/CHF breached 0.8943 briefly but quickly settle back in established range. Intraday bias remains neutral first. More consolidations could be seen. But downside should be contained above 0.8743 support to bring another rally. Decisive of 0.8943 will extend the rise from 0.8551 to 0.9146 cluster resistance.
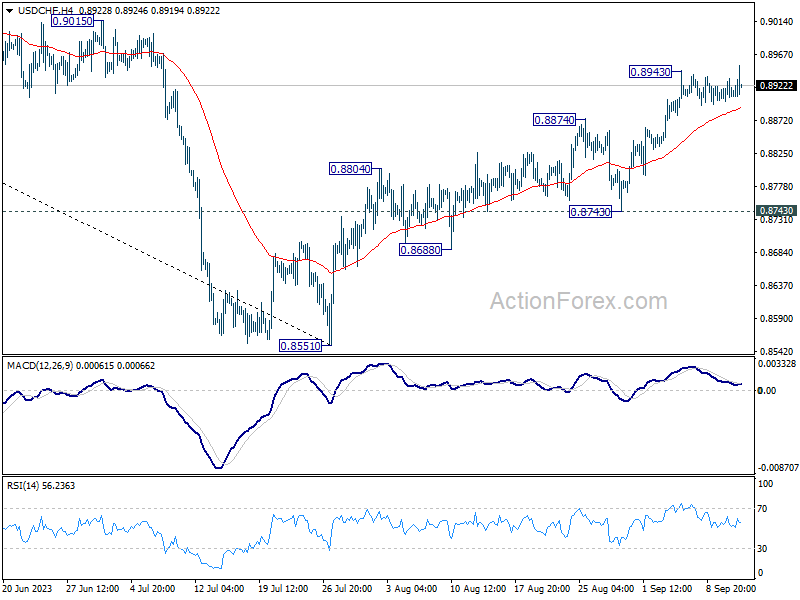
In the bigger picture, rebound from 0.8551 medium term bottom is currently seen as a correction to the downtrend from 1.0146 (2022 high). Further rally would be seen to 0.9146 cluster resistance (38.2% retracement of 1.0146 to 0.8551 at 0.9160). Strong resistance could be seen there to limit upside, at least on first attempt.
USD/JPY Mid-Day Outlook
Daily Pivots: (S1) 146.61; (P) 146.92; (R1) 147.40; More...
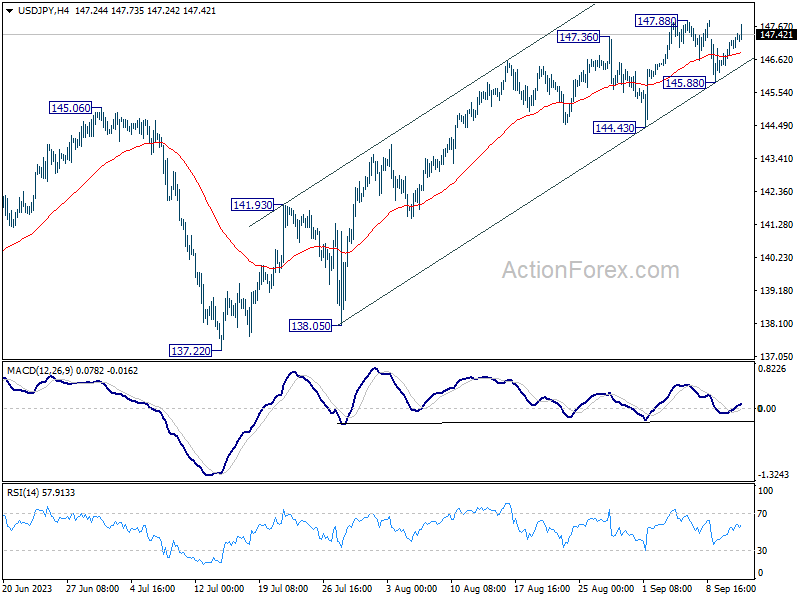
USD/JPY's rebound from 145.88 extends higher today, but upside is still capped by 147.88 resistance. Intraday bias remains neutral at this point and more consolidations could be seen. But even in case of another pull back, near term outlook will remain bullish as long as 144.43 support holds. On the upside, firm break of 147.88 will resume larger rise from 127.20, to retest 151.93 high.
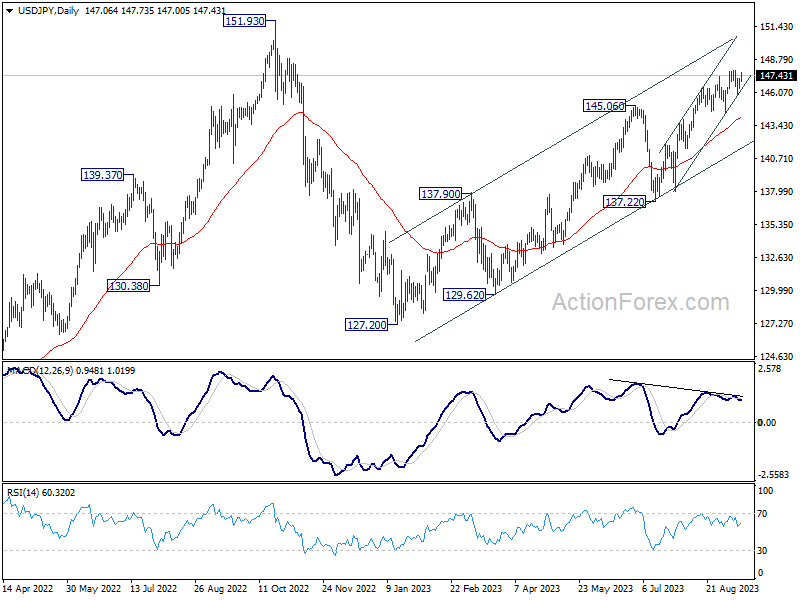
In the bigger picture, while rise from 127.20 is strong, it could still be seen as the second leg of the corrective pattern from 151.93 (2022 high). Rejection by 151.93, followed by break of 137.22 support will indicate that the third leg of the pattern has started. However, sustained break of 151.93 will confirm resumption of long term up trend.
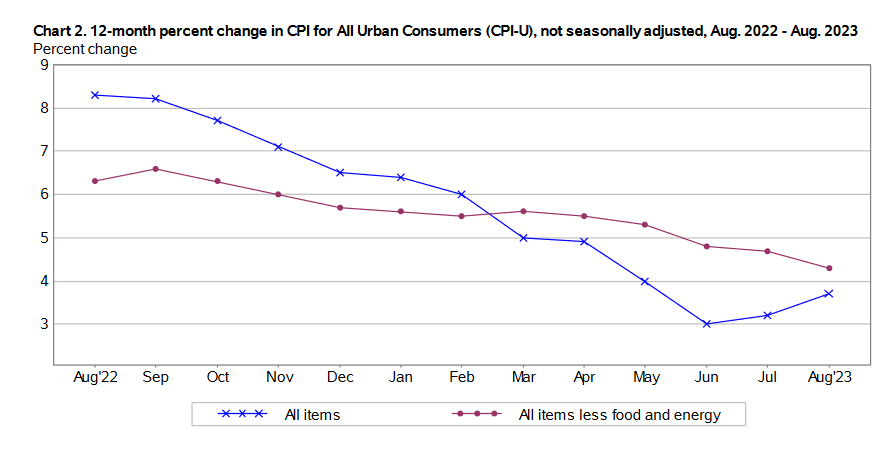
US CPI at 0.6% mom, 3.7% yoy; CPI core at 0.3% mom, 4.3% yoy
US CPI rose 0.6% mom in August, matched expectations. CPI core (ex food and energy) rose 0.3% mom, above expectation of 0.2% mom. Energy index was up 5.6% mom. Food index was up 0.2% mom. Gasoline was the largest contributor to monthly CPI rise, accounting for over half of the increase. Another contributor was shelter index, which rose for the 40th consecutive month.
For the 12 months period, headline CPI rose from 3.2% yoy to 3.7% yoy above expectation of 3.6% yoy. CPI core slowed from 4.7% yoy to 4.3% yoy, matched expectations. Energy index decreased -3.6% yoy. Food index rose 4.3% yoy.
AUD/USD Eyes US inflation, Aussie Jobs Report
- US inflation expected to rise
- Australia releases employment data on Thursday
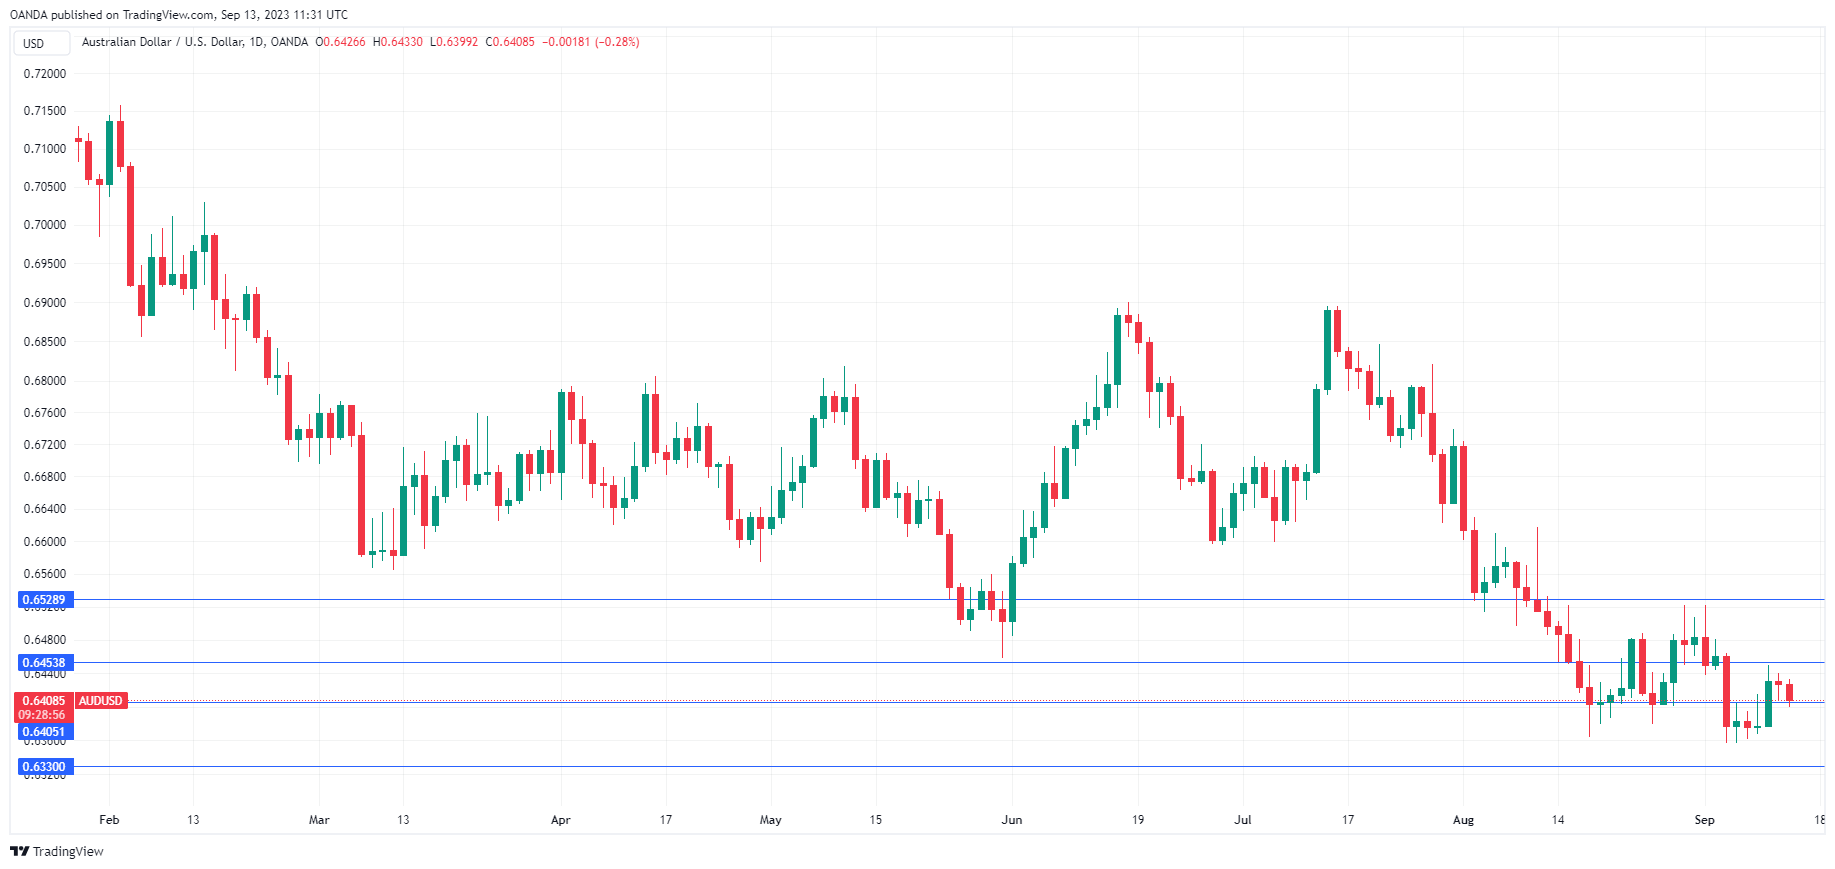
The Australian dollar is lower on Wednesday. In the European session, AUD/USD is trading at 0.6408, down 0.28%.
US consumer inflation expected to increase
The US releases the August inflation report later today. CPI is projected to increase in August to 3.6% y/y, following a 3.2% gain in July. On a monthly basis, the consensus estimate stands at 0.6%, higher than the 0.2% gain in July. Core CPI is expected to fall from 4.7% to 4.3% and remain unchanged at 0.2% m/m. The Federal Reserve puts more emphasis on core inflation readings which are considered more reliable indicators of underlying inflation. A drop in the core rate would be welcomed by the Fed and would cement expectations for a pause at next week’s rate meeting. If however, inflation is stronger than expected, the Fed could respond with additional rate hikes in the coming months and that could mean stronger volatility for the US dollar.
The markets have widely priced in a rate pause, with a probability of 93% according to the FedWatch tool. After that, the Fed’s rate path is unclear, with the odds of a pause standing at 59%. The US labour market remains resilient, despite some cracks, and economic growth for the fourth quarter is expected to be strong. That could mean higher inflation for longer, which could complicate the Fed’s efforts to finish the battle against inflation and bring it back to the 2% target.
Thursday should be a busy day for the Aussie, with Australia releasing employment data and the US publishing retail sales numbers. Australia’s job growth is expected to rebound with a gain of 23,000 in August, after a decline of 14,600 in July. US retail sales are expected to fall in August by 0.2% m/m, down sharply from 0.7% a month earlier.
AUD/USD Technical
- AUD/USD is testing support at 0.6405. Below, there is support at 0.6330
- There is resistance at 0.6453 and 0.6528
Can CPI Release Reverse USD?
The upcoming August inflation data may send mixed signals. The 12-month headline inflation rate is expected to rise to 3.6%, causing concerns for the Biden administration. However, core inflation, which excludes food and energy prices, is projected to decrease to 4.3%, aligning with the Federal Reserve's goals. Past price trends influence both figures, so looking at recent data for a more accurate picture is crucial. In this context, the headline number may show a significant 0.6% increase, driven by higher energy prices. Meanwhile, core inflation is expected to grow steadily by 0.2%, indicating a gradual moderation of inflation.
US Dollar - H4 Timeframe
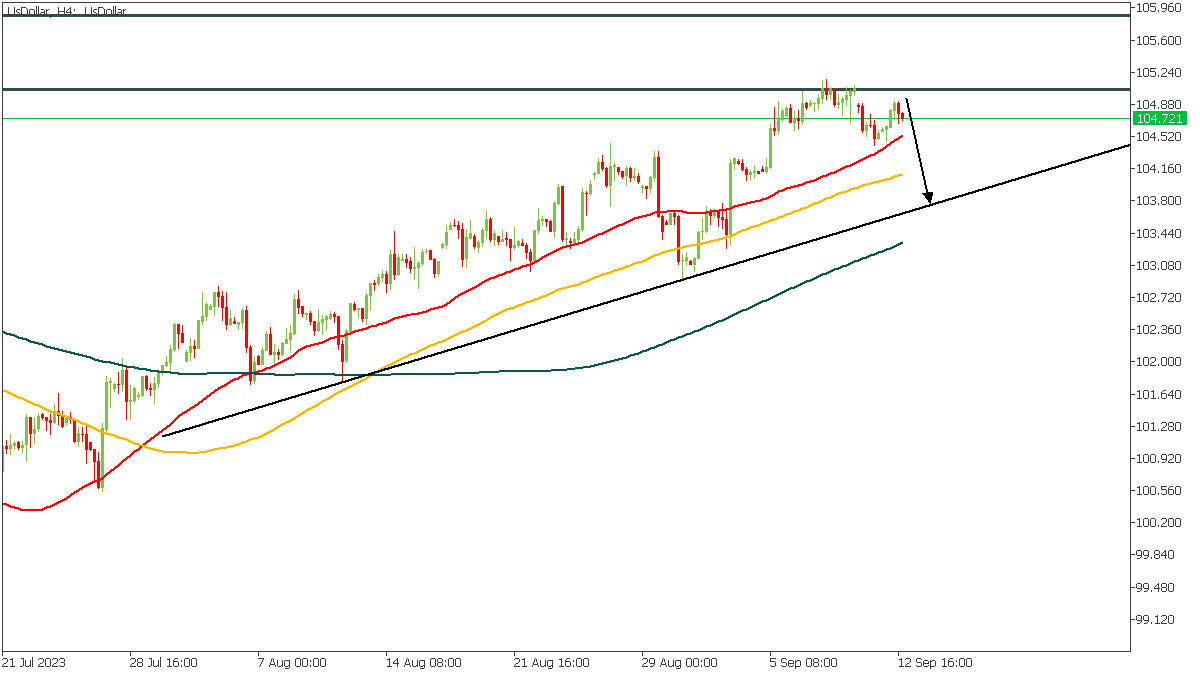
Currently, the 4-hour timeframe of the US dollar index shows the price reacting away from a pivot zone on the Daily timeframe. Considering that the US Dollar's momentum seems to have slowed down considerably over the past few days, it seems quite clear that the price intends to reverse and go bearish for a while from the current area.
Analyst’s Expectations:
- Direction: Bearish
- Target: 103.751
- Invalidation: 105.142
EURUSD - H4 Timeframe
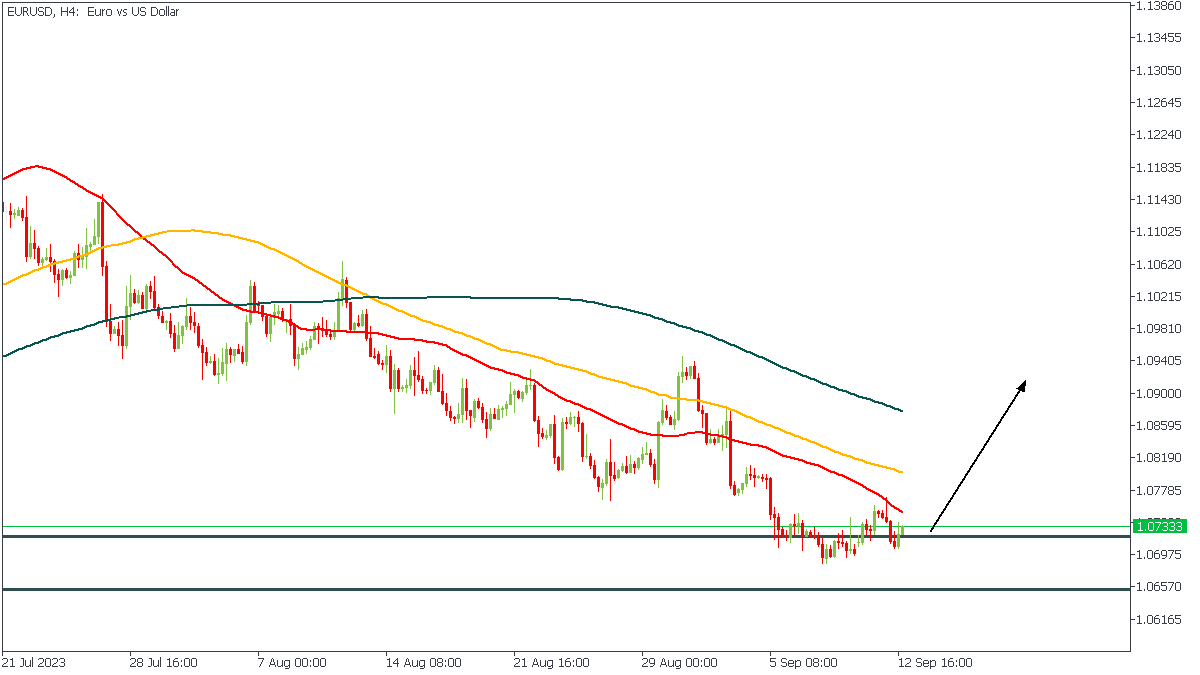
EURUSD, at the moment, may be heading bullish. The current price action is a rejection from a demand zone on the daily timeframe, which has already given off a change-of-character on the 4-hour timeframe. On this basis, my sentiment is bullish unless the price trails below the current lower prior to the release of the CPI data.
Analyst’s Expectations:
- Direction: Bullish
- Target: 1.07808
- Invalidation: 1.06835
GBPUSD - D1 Timeframe
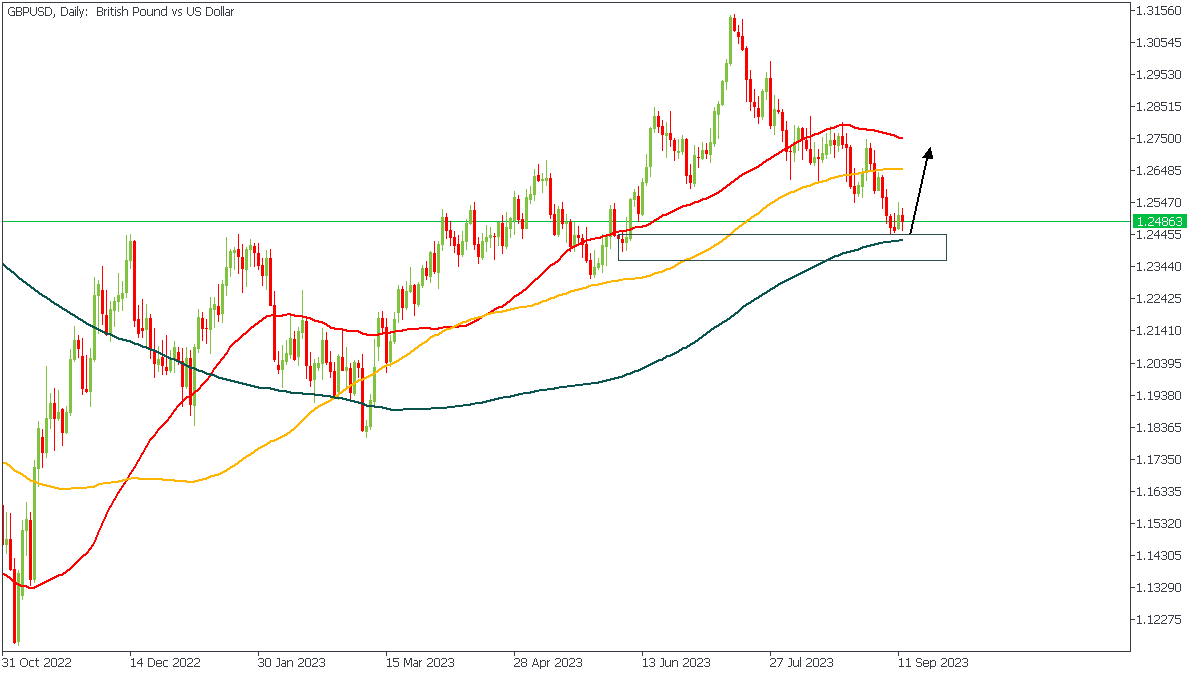
The Daily timeframe of GBPUSD presents the clearest argument for a bullish move I’ve seen so far. Here, we see the 200-period moving average support, the drop-base-rally demand order block, as well as a bullish array of the moving averages, pointing clearly to the likelihood of a bullish impulse from the demand zone. As always, before taking any trades, I will wait for an entry trigger from the lower timeframes.
Analyst’s Expectations:
- Direction: Bullish
- Target: 1.26097
- Invalidation: 1.24417
CONCLUSION
The trading of CFDs comes at a risk. Thus, to succeed, you have to manage risks properly. To avoid costly mistakes while you look to trade these opportunities, be sure to do your due diligence and manage your risk appropriately.
Dollar Index: Bulls Return to Play After Shallow Correction; All Eyes on US Inflation Data
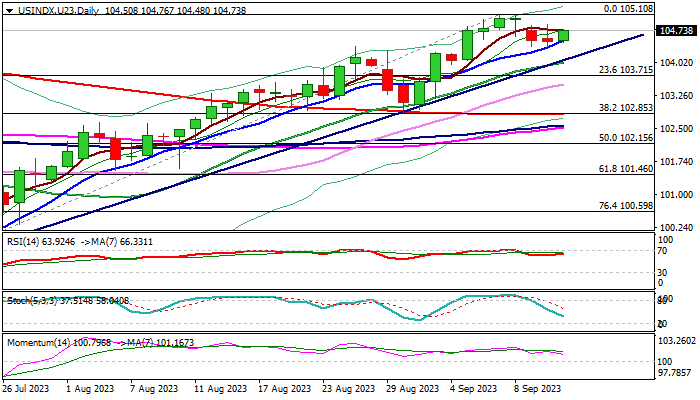
The dollar index gained traction on Wednesday, signaling that a shallow correction from new multi-month high at 105.10 (Sep 7) might be over.
Larger bulls took a breather after facing headwinds on approach to key barriers at 105.13/47 (Fibo 38.2% of 114.72/99.20 / weekly Ichimoku cloud base), with three-day pullback being contained by rising 10DMA at 104.35, keeping bullish structure intact.
Technical studies on daily chart are bullish and continue to underpin the action, however markets look for strong direction signal from US Aug inflation data (due later today), which will define Fed’s rate trajectory in the near future.
According to the forecasts, US inflation increased by 0.6% (the largest gain in more than one year), in August after rising 0.2% in July while core inflation, stripped for the most volatile components and closely watched by the Fed, is expected to remain unchanged at 0.2% in August.
The Fed should remain highly alerted in such environment and probably still not at the end of a tightening cycle.
The US central bank meets next week, with wide expectations to keep rates on hold in September, though inflation figures will play a key role and possibly be a game changer.
The US policymakers remain cautious as recent weaker than expected economic growth and labor data sent an initial warning that high interest rates started to bite (after the economy was quite resilient until now) and making the task for next rate decision more complicated.
Generally, the Fed will feel less pressure and likely stay on hold next week if August CPI come within the framework of expectations or slightly below, that would add to signals that hiking cycle is likely near the end.
On the other hand, higher than expected consumer prices would signal that the battle with inflation is not over yet and open way for possible further rate hikes.
Initial support lays at 104.51 (10DMA) followed by trendline support / 20DMA at 104.00 zone and 103.71 (Fibo 23.6% of 99.20/105.10 rally), guarding lower pivots at 102.85 (200DMA / Fibo 38.2% / Aug 30 higher low) loss of which will be bearish.
Conversely, sustained break of upper pivots at 105.13/47 would generate initial signal of bullish continuation.
Res: 105.13; 105.47; 105.85; 106.22.
Sup: 104.51; 104.00; 103.71; 103.34.
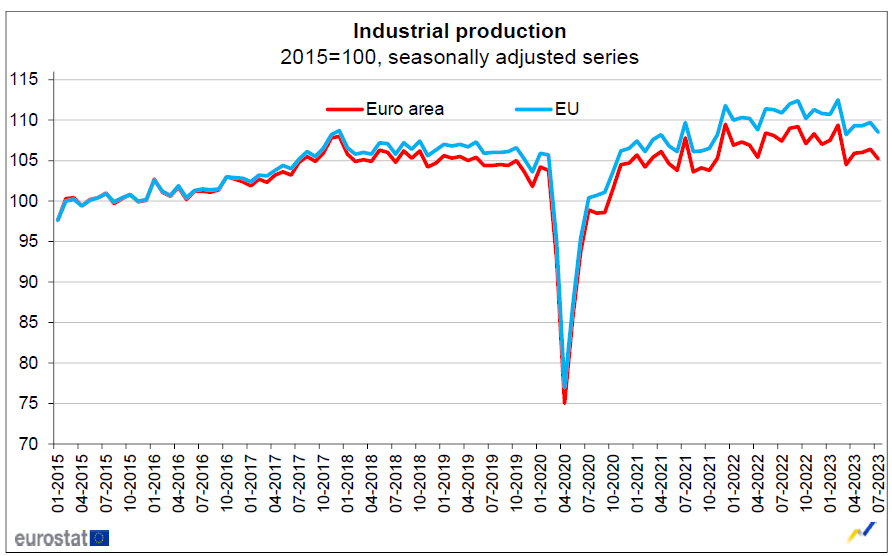
Eurozone industrial production down -1.1% mom in Jul
Eurozone industrial production fell -1.1% mom in July, worse than expectation of -0.7% mom. Production of capital goods fell by -2.7% mom and durable consumer goods by -2.2% mom, while production of intermediate goods grew by 0.2% mom, non-durable consumer goods by 0.4% mom and energy by 1.6% mom.
EU industrial production was down -1.1% mom. Among Member States for which data are available, the largest monthly decreases were registered in Denmark (-9.1%), Ireland (-6.6%) and Lithuania (-4.4%). The highest increases were observed in Sweden (+5.1%), Malta (+3.4%) and Hungary (+2.9%).
British Pound Pares Losses After Soft GDP
- UK GDP falls by 0.5%
- GBP/USD dips slightly lower
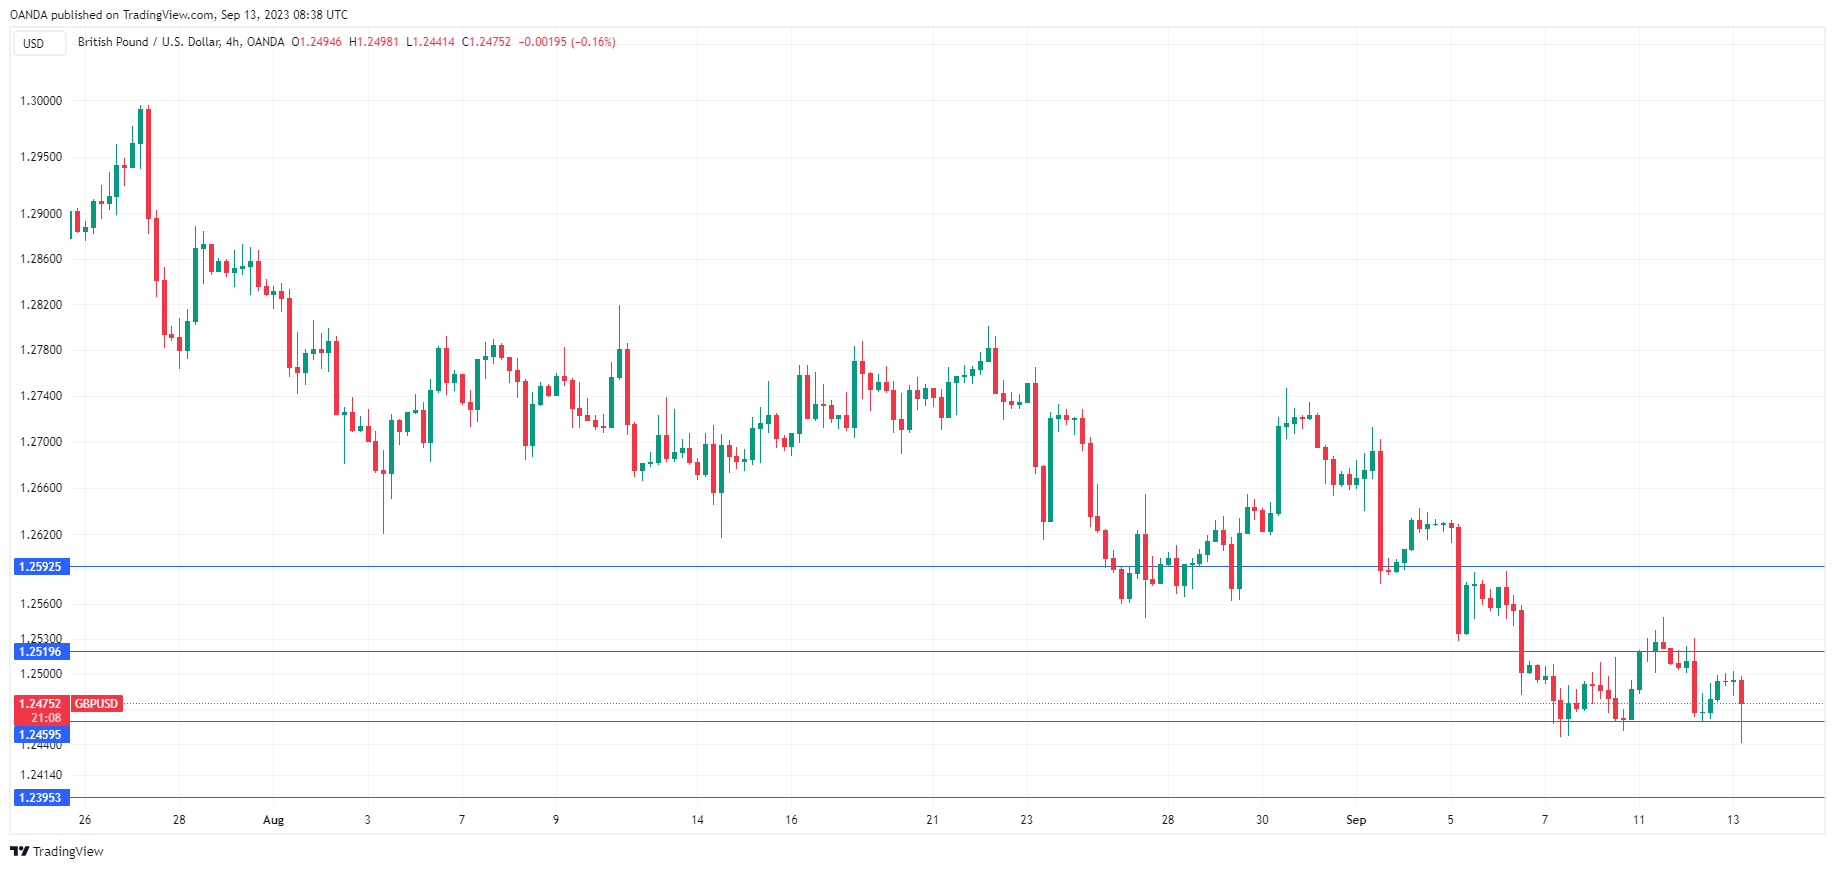
The British pound has edged lower on Wednesday. In the European session, GBP/USD is trading at 1.2472, down 0.17%. The pound fell as low as 1.2441 earlier today but has recovered some of those losses.
UK economy contracts by 0.5%
The UK economy contracted by 0.5% in July, the largest decline this year. The reading reversed the 0.5% gain in June and missed the consensus estimate of 0.5%. The GDP report pointed to weakness across the economy, with declines in services, manufacturing and construction.
There’s no question that the sharp increase in borrowing rates has cooled the economy, but there’s uncertainty as to what action the Bank of England will take at the meeting on September 21st. The markets have priced in a quarter-point rate hike at 75%, which means there is a possibility of a pause in rate increases. The UK economy may already be in recession and another hike will put a further strain on the economy. On the other hand, the battle against inflation is far from over, and with inflation running at a 6.8% clip, the BoE will need to do more to bring inflation closer to the 2% target.
The UK jobs report on Tuesday was a reminder that inflation is alive and kicking. The economy shed a massive 207,000 in the three months to July, as the labour market is showing larger cracks. However, wage growth including bonuses hit 7.8%, unchanged from a month earlier and the highest on record. Wages are now rising faster than consumer inflation, which is one more headache for the Bank of England, which had a rough time in its attempts to bring down inflation.
GBP/USD Technical
- GBP/USD is testing support at 1.2459. Next, there is support at 1.2395
- There is resistance at 1.2519 and 1.2592
EURGBP Turns Bullish in the Short Term
- EURGBP posts a higher high to climb to a one-month peak
- Short-term bias increasingly bullish according to technical indicators
- But long-term descending trendline could curb advances
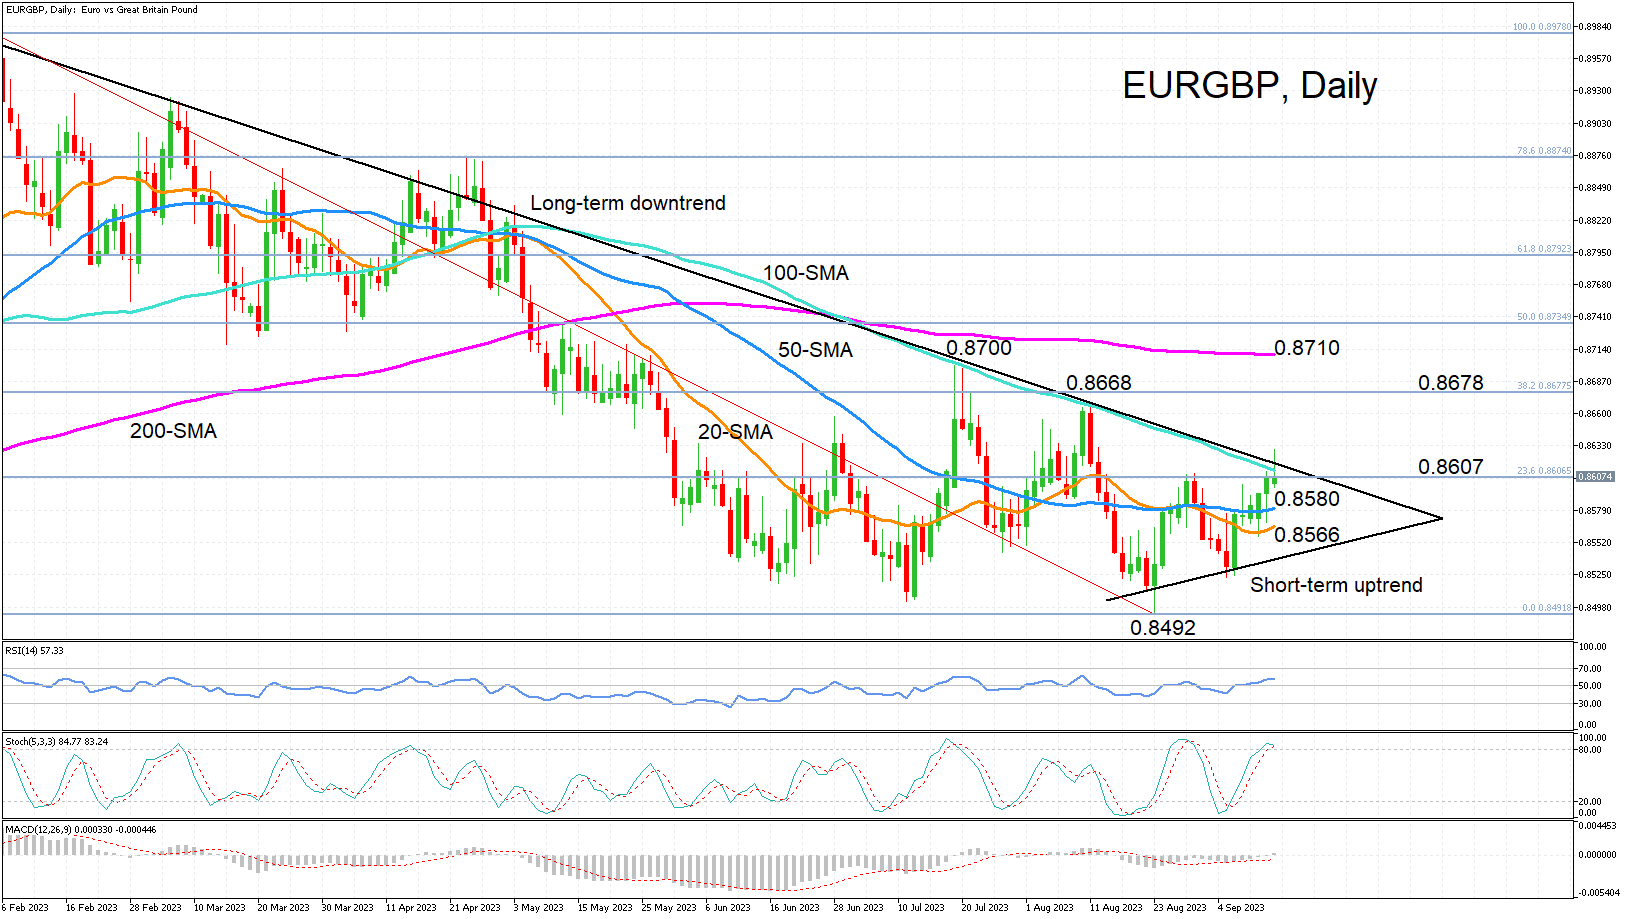
EURGBP is scaling a higher high on Wednesday, climbing above the 100-day simple moving average (SMA), having already reclaimed the 20- and 50-day SMAs. The momentum indicators point to further gains in the near term.
The MACD just turned positive and is increasing its distance above its red signal line. The RSI is edging higher above 50. The stochastic oscillator is rising too but it has now entered the overbought territory, suggesting some danger that the upside momentum runs out of steam.
The price is facing immediate resistance at the long-term descending trendline as well as the 100-day SMA in the 0.8615 region. A break higher would shift the focus to the August peak of 0.8668, while not much higher are the 38.2% Fibonacci retracement of February – August downtrend at 0.8678 and the July top of 0.8700. However, the real test for a more sustainable rebound is likely to be found slightly higher at the 200-day SMA at 0.8710.
If the rebound falters, the focus would quickly shift to the 50- and 20-day SMA at 0.8580 and 0.8566, respectively. Breaching these, the pair could revisit August’s one-year low of 0.8492, after which, the next stop would be the previously proven support area around 0.8385.
To sum up, EURGBP needs to tackle the immediate resistance hurdle of the descending trendline to be able to stretch the rebound that is underway. Failing to do so could spark a pullback, weakening the short-term positive picture.