Sample Category Title
Technical Outlook and Review
DXY:
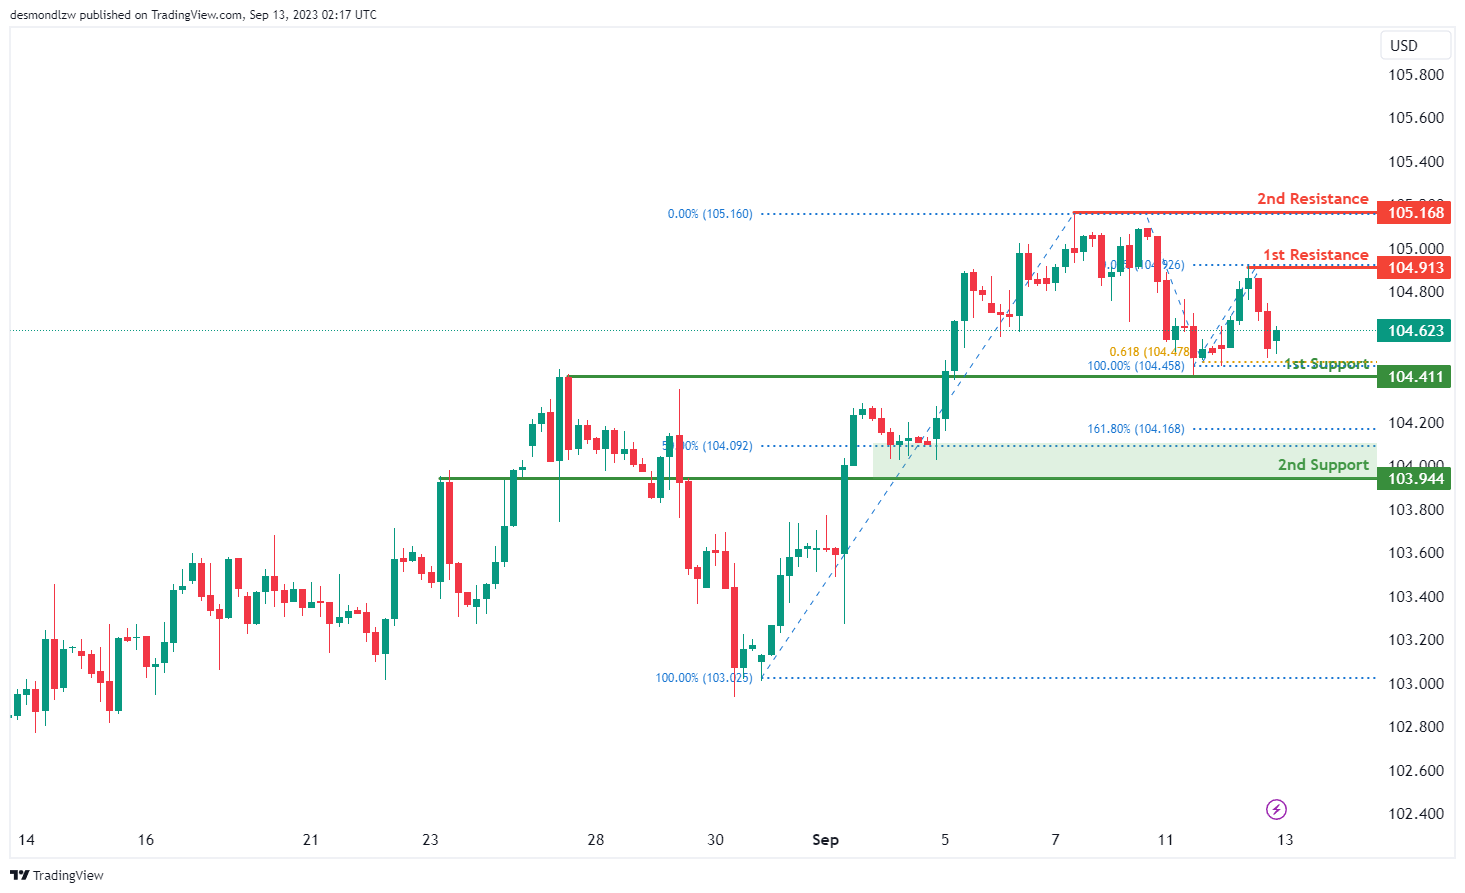
The DXY (US Dollar Index) chart currently demonstrates a bullish momentum, indicating a potential upward trend in price movement. There’s a possibility of a bullish rebound from the 1st support level at 104.41, which is an overlap support. The 2nd support at 103.94 also reinforces the support zone as it aligns with a 50% Fibonacci Retracement level.
On the upside, the 1st resistance at 105.09 represents a multi-swing high resistance, indicating a level where price might face hurdles. Additionally, the 2nd resistance at 105.61, marked as the 161.80% Fibonacci Retracement level, further adds to the potential resistance.
EUR/USD:
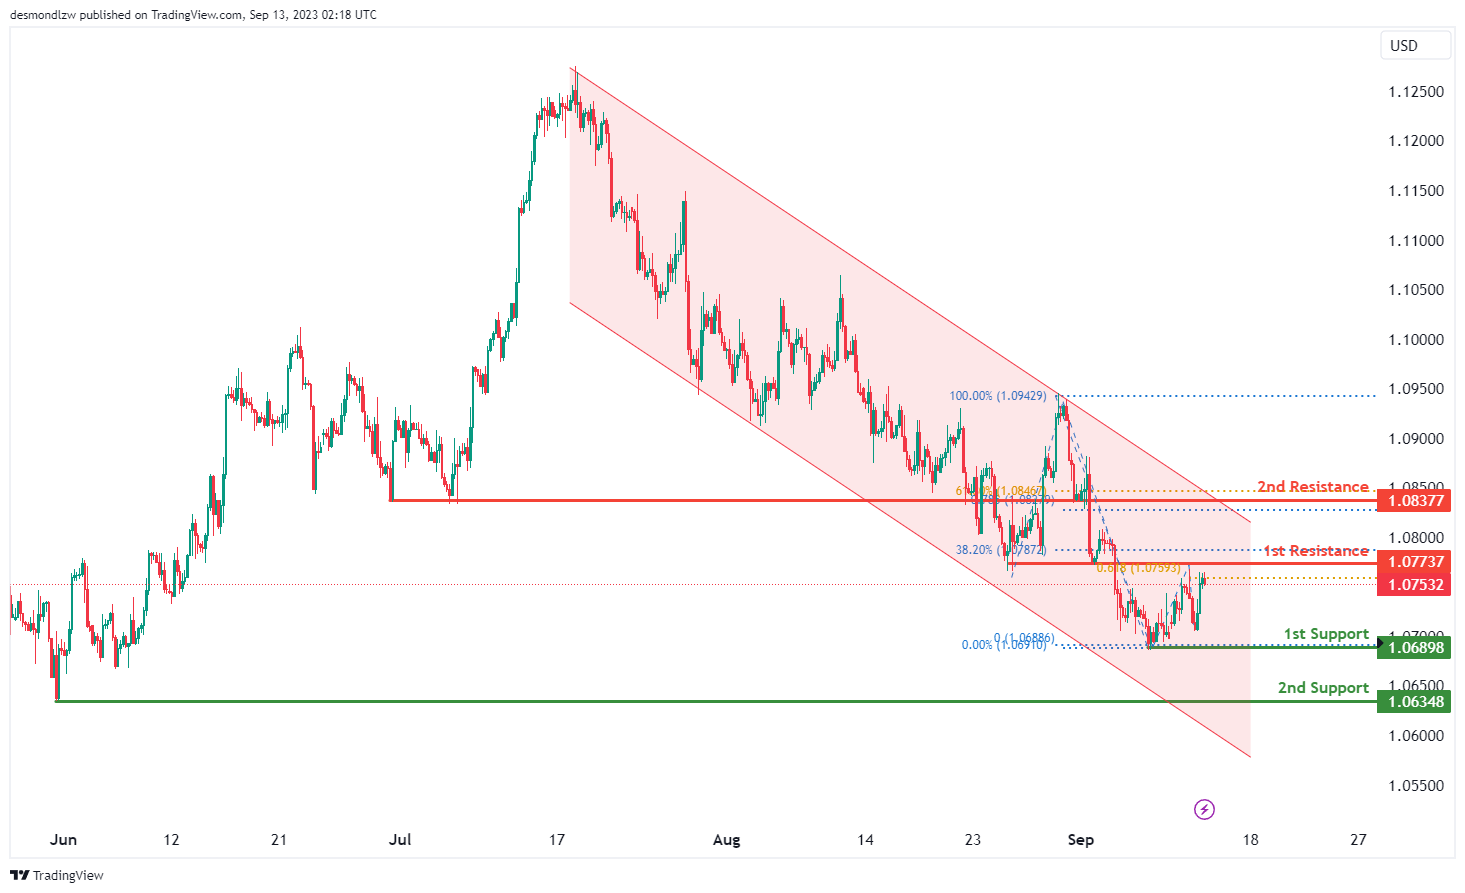
The EUR/USD chart currently maintains a bearish momentum, primarily driven by its movement within a bearish descending channel. This sets the stage for a potential bearish reaction at the 1st resistance level of 1.0773, which holds significance as an overlap resistance. This level aligns with both the 38.20% Fibonacci Retracement and the 61.80% Fibonacci Projection, signifying Fibonacci confluence.
On the downside, the 1st support at 1.0689 serves as a critical level for potential price rebounds, being a swing low support. Additionally, the 2nd support at 1.0634, also corresponding to a swing low support, reinforces its potential as a support zone.
EUR/JPY:
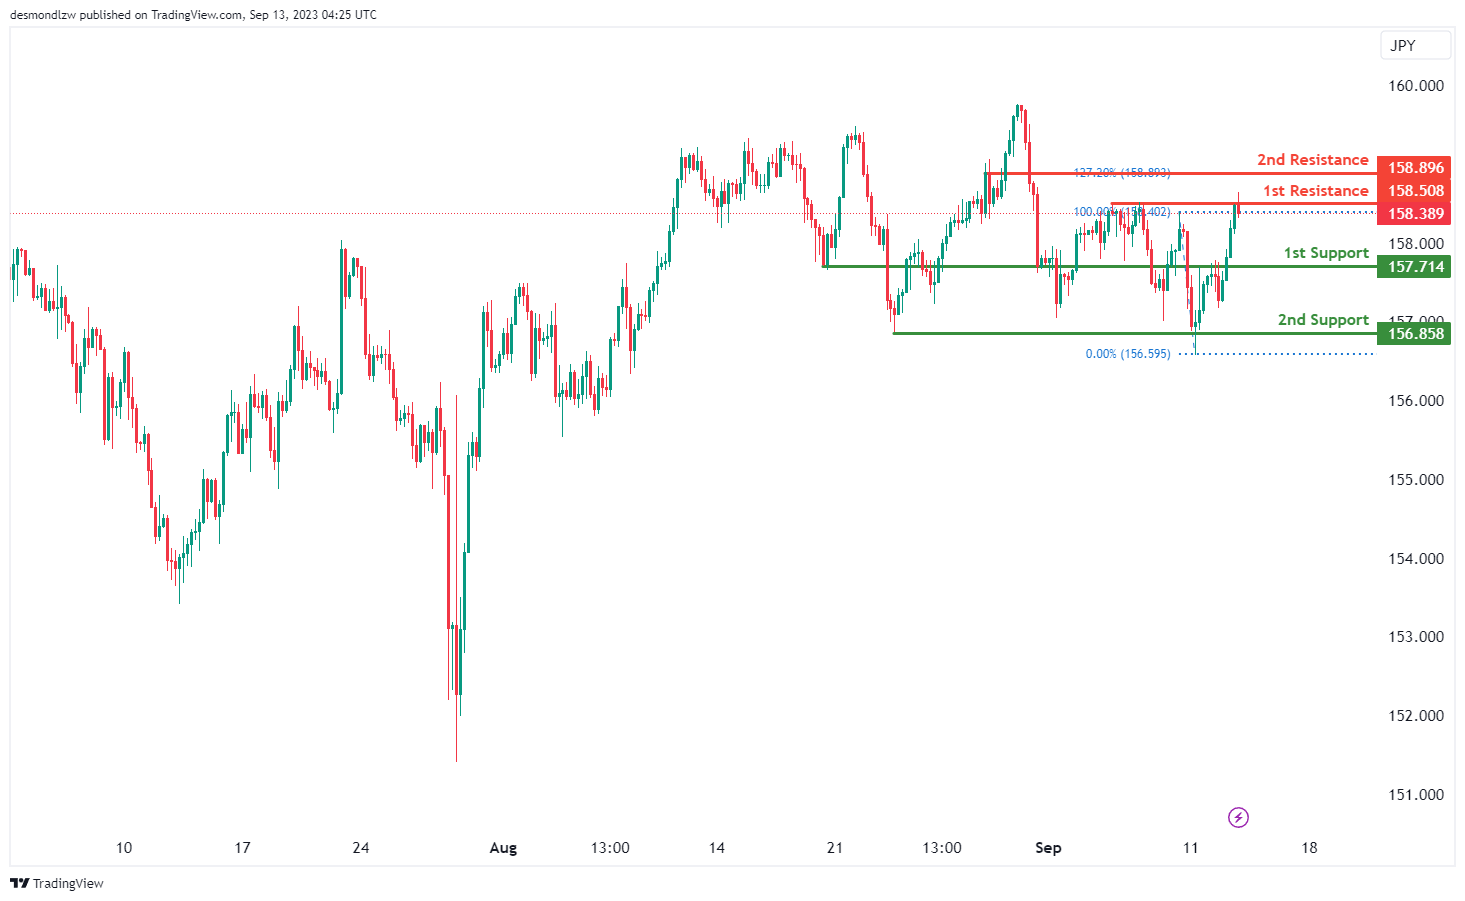
For EUR/JPY, the overall momentum of the chart is currently bearish, indicating a downward trend.
There is potential for the price to have a bearish reaction off the 1st resistance level at 158.50 and drop to the 1st support at 157.71.
The 1st support at 157.71 is considered significant because it represents a pullback support, suggesting potential stability and support at this level.
In case of a more substantial decline, the 2nd support level at 156.85 is also noteworthy, representing multi-swing low support, offering additional reinforcement for the price.
On the upper side, the 1st resistance at 158.50 is considered important due to its characteristics as multi-swing high resistance.
Further upward movement could face resistance at the 2nd resistance level of 158.89, characterized as pullback resistance and aligned with the 127.20% Fibonacci Extension, potentially posing a significant barrier to the bullish momentum within the observed range.
EUR/GBP:
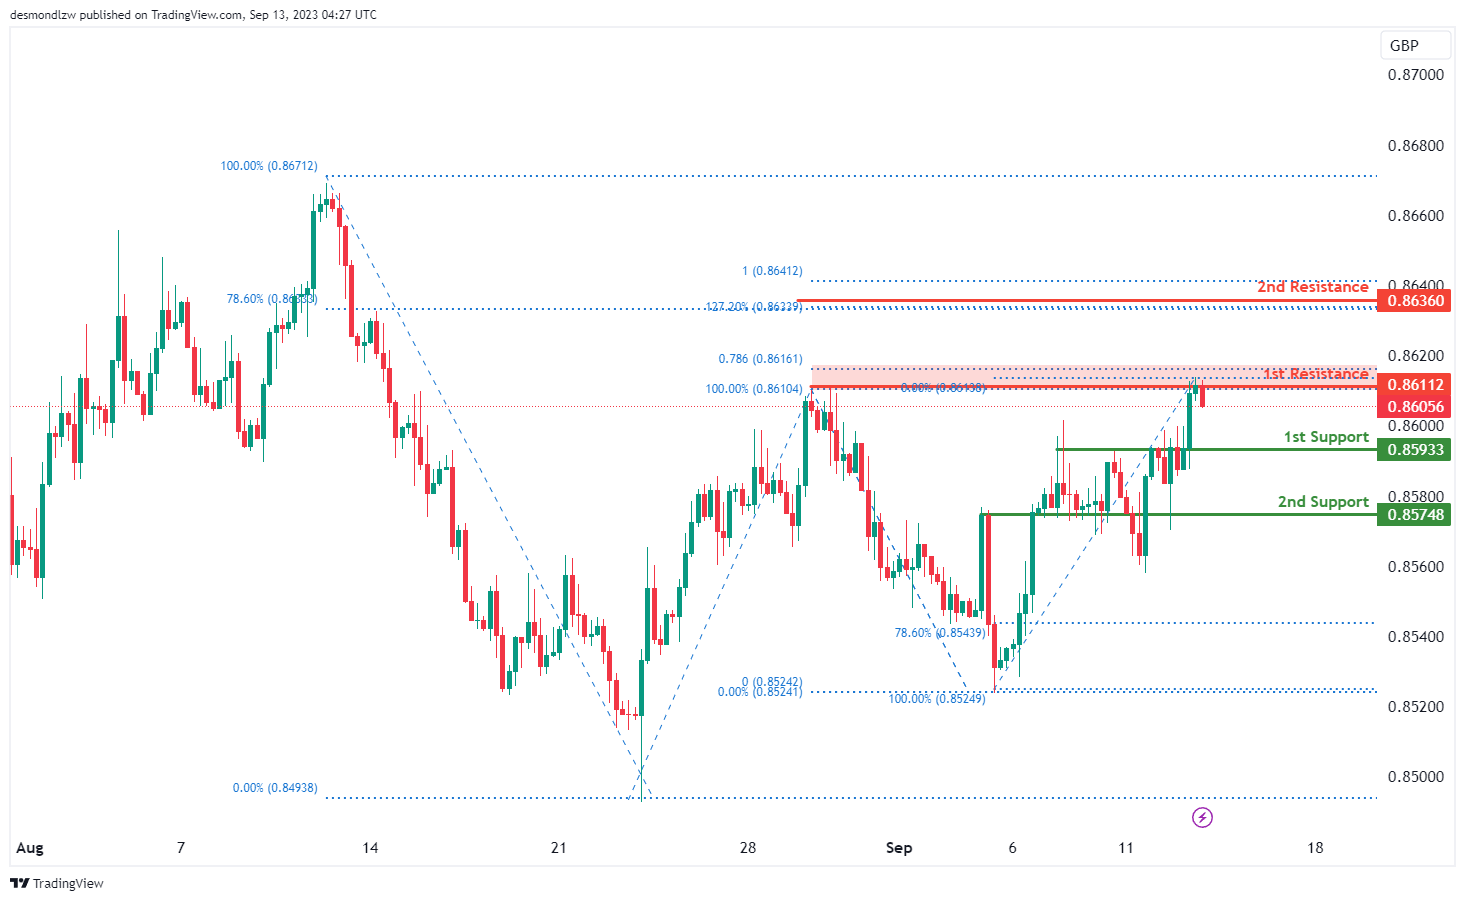
For EUR/GBP, the overall momentum of the chart is currently bearish, indicating a downward trend.
There is potential for the price to continue its bearish movement towards the 1st support level at 0.8593. This 1st support is considered significant because it represents pullback support and aligns with the 23.60% Fibonacci Retracement, indicating potential stability and support at this level.
In case of a more substantial decline, the 2nd support level at 0.8574 is also noteworthy, as it represents an overlap support.
On the upper side, if there’s a reversal in the price, it may face resistance at the 1st resistance level of 0.8611, which is characterized as multi-swing high resistance and is supported by the 78.60% Fibonacci Projection.
Further upward movement could encounter resistance at the 2nd resistance level of 0.8636. This level is notable because it aligns with both the 127.20% Fibonacci Extension and the 78.60% Fibonacci Retracement, indicating strong potential resistance due to Fibonacci confluence.
GBP/USD:
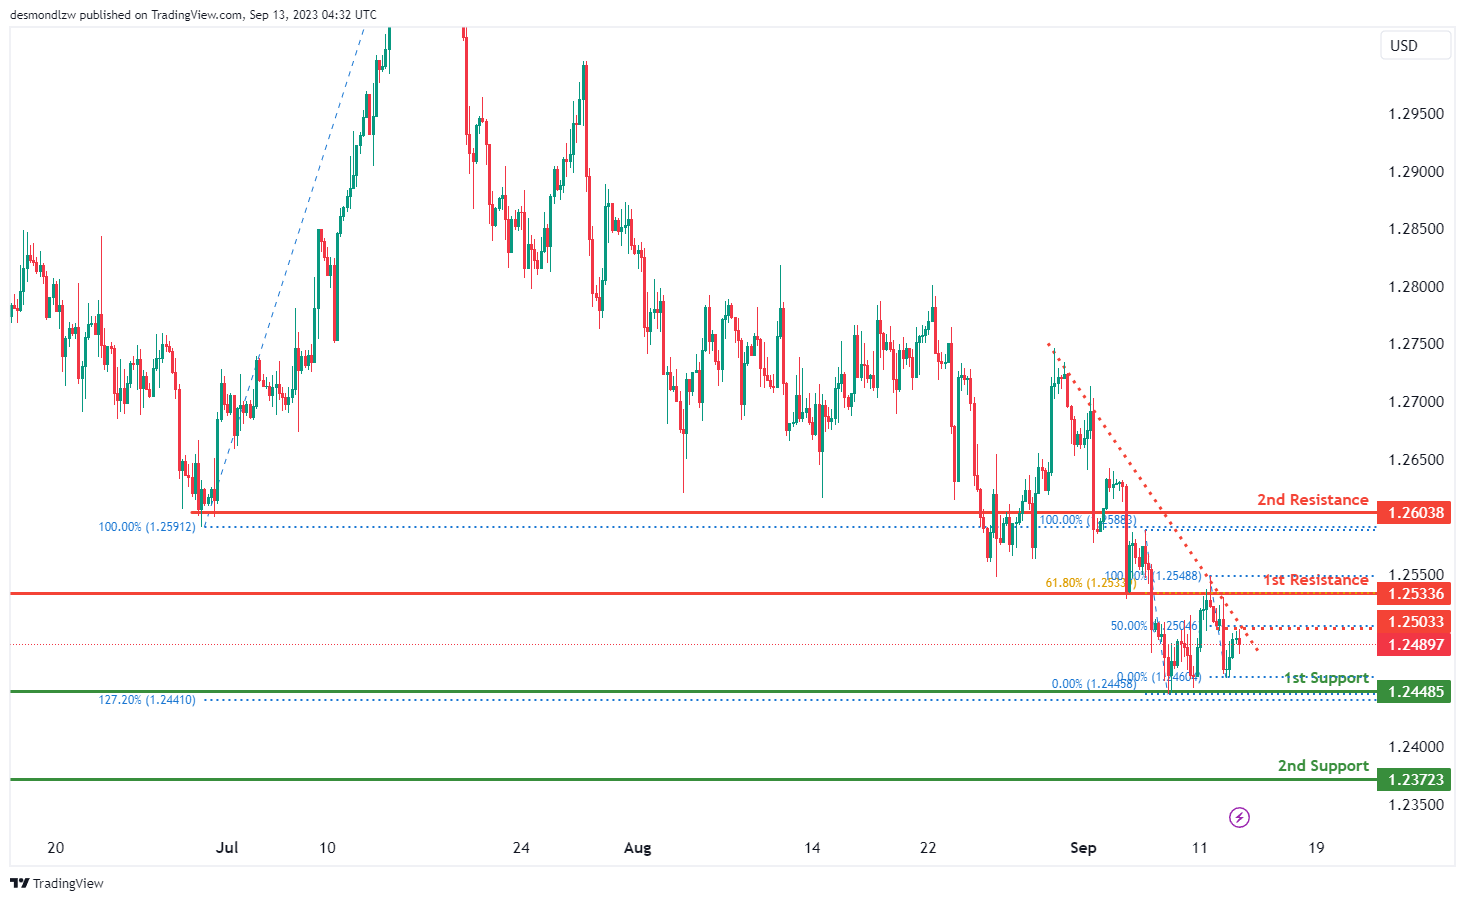
The GBP/USD chart currently displays a bearish overall momentum, with one significant contributing factor being its position below a major descending trendline, which suggests the potential for further bearish movement. In this scenario, there’s the likelihood of a bearish continuation towards the 1st support level at 1.2448, which is marked as an overlap support and is associated with the 127.20% Fibonacci Expansion. Additionally, the 2nd support at 1.2372 is also identified as an overlap support.
On the resistance side, the 1st resistance at 1.2533 serves as an overlap resistance, coinciding with the 61.80% Fibonacci Retracement, which adds to its significance. Similarly, the 2nd resistance at 1.2603 is characterized as an overlap resistance.
GBP/JPY:
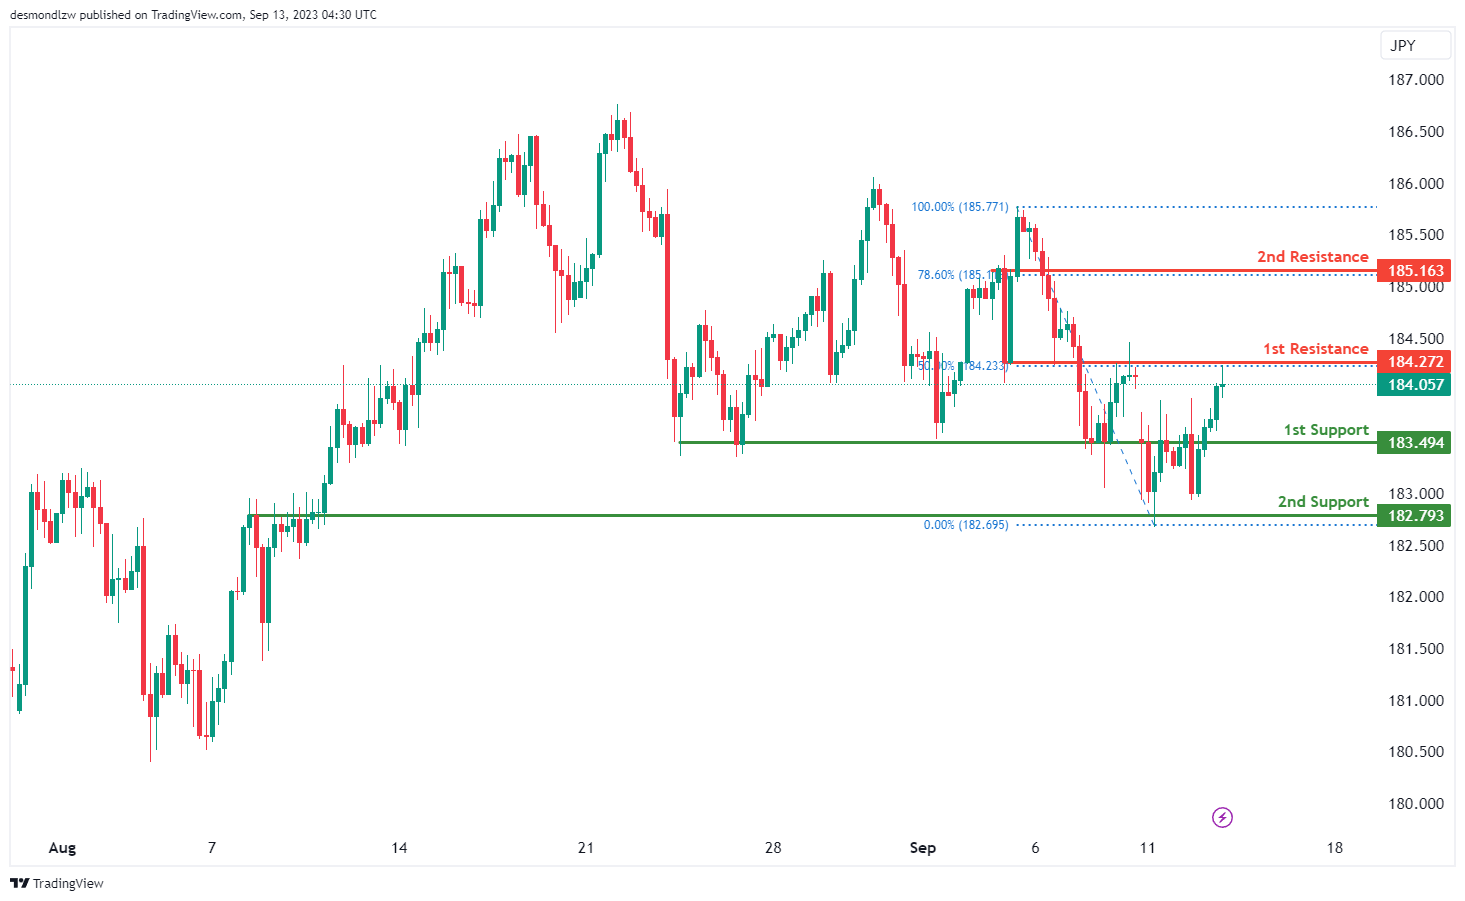
For GBP/JPY, the overall momentum of the chart is currently bearish, indicating a downward trend.
There is potential for the price to have a bearish reaction off the 1st resistance level at 184.27 and drop to the 1st support at 183.49.
The 1st support at 183.49 is considered significant because it represents a pullback support.
In case of a more substantial decline, the 2nd support level at 182.79 is also noteworthy, representing an overlap support.
On the upper side, the 1st resistance at 184.27 is considered important due to its characteristics as an overlap resistance and its alignment with the 50% Fibonacci Retracement level.
Further upward movement could face resistance at the 2nd resistance level of 185.16, characterized as pullback resistance and aligned with the 78.60% Fibonacci Retracement, potentially posing a significant barrier to the bullish momentum within the observed range.
USD/CHF:
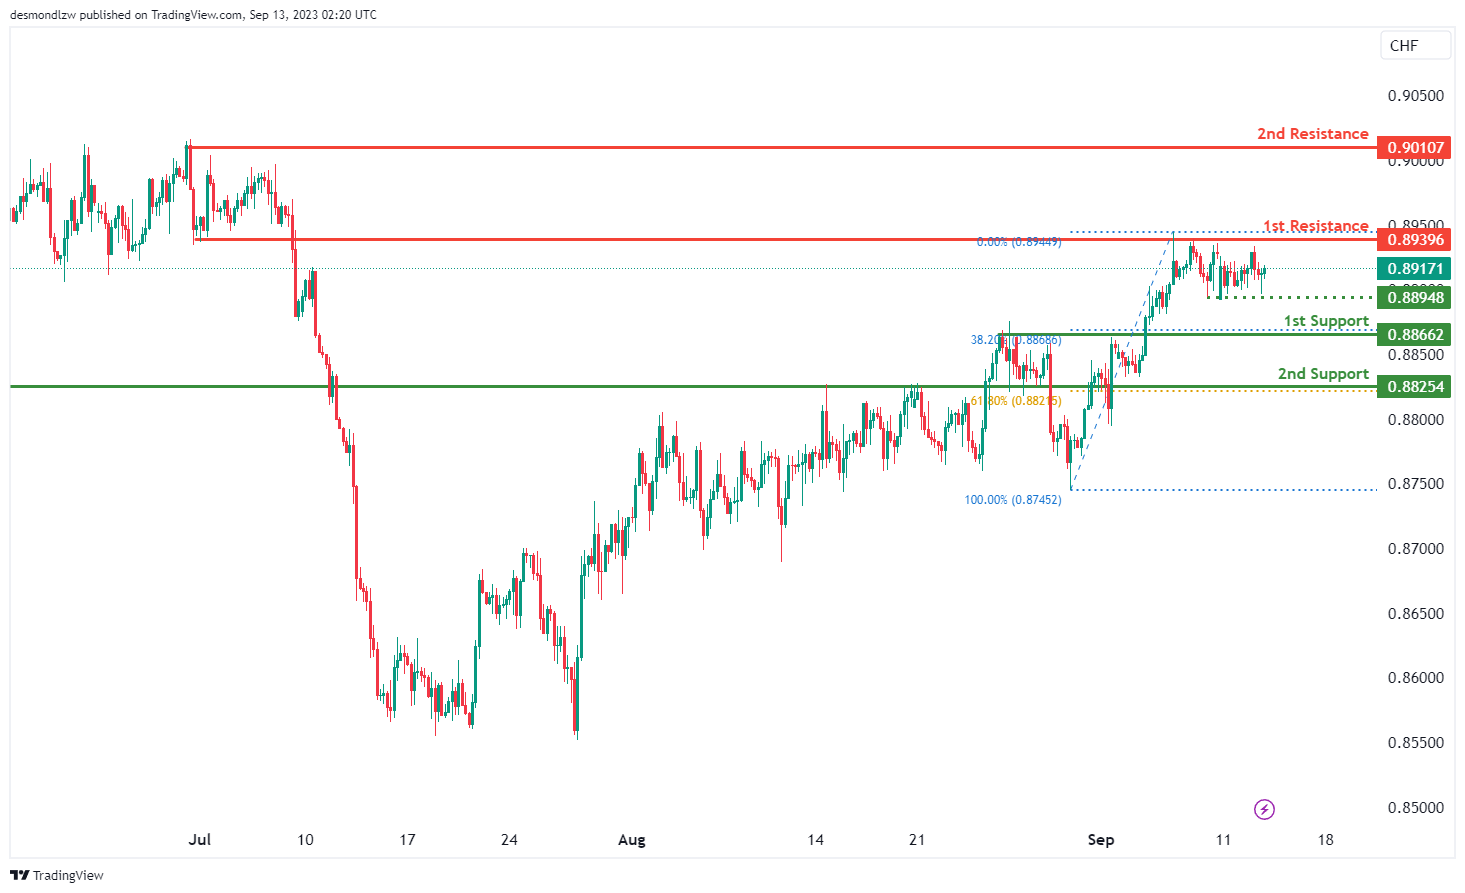
The USD/CHF chart currently exhibits a neutral overall momentum, indicating a lack of a clear bullish or bearish trend. In this context, there’s potential for price to fluctuate between the 1st support and 1st resistance levels.
The 1st support at 0.8866 is identified as a pullback support, while the 2nd support at 0.8825 also serves as a pullback support.
On the upside, the 1st resistance at 0.8939 is noted as an overlap resistance, and the 2nd resistance at 0.9010 is characterized as a swing high resistance.
Furthermore, there’s an intermediate support level at 0.8866, which is considered a multi-swing low support.
USD/JPY:
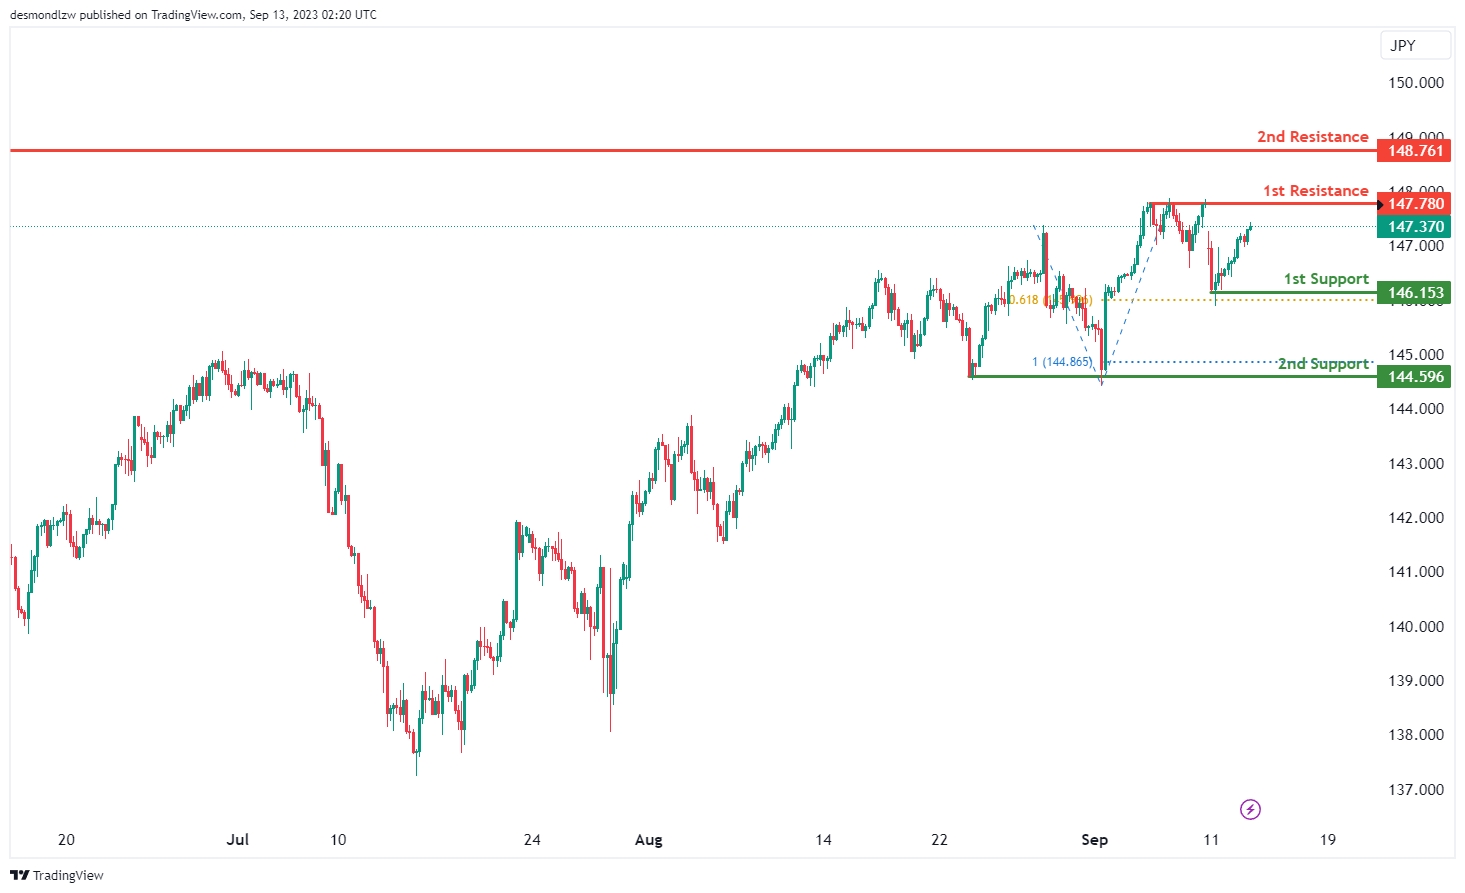
The USD/JPY chart currently demonstrates a neutral overall momentum, indicating a lack of a clear bullish or bearish trend. In this context, there’s potential for price to fluctuate between the 1st support and 1st resistance levels.
The 1st support at 146.15 is identified as a swing low support and aligns with the 61.80% Fibonacci Projection. Additionally, the 2nd support at 144.59 is characterized as a multi-swing low support, coinciding with the 100% Fibonacci Projection.
On the upside, the 1st resistance at 147.78 represents a multi-swing high resistance, while the 2nd resistance at 148.76 is marked as a swing high resistance.
USD/CAD:
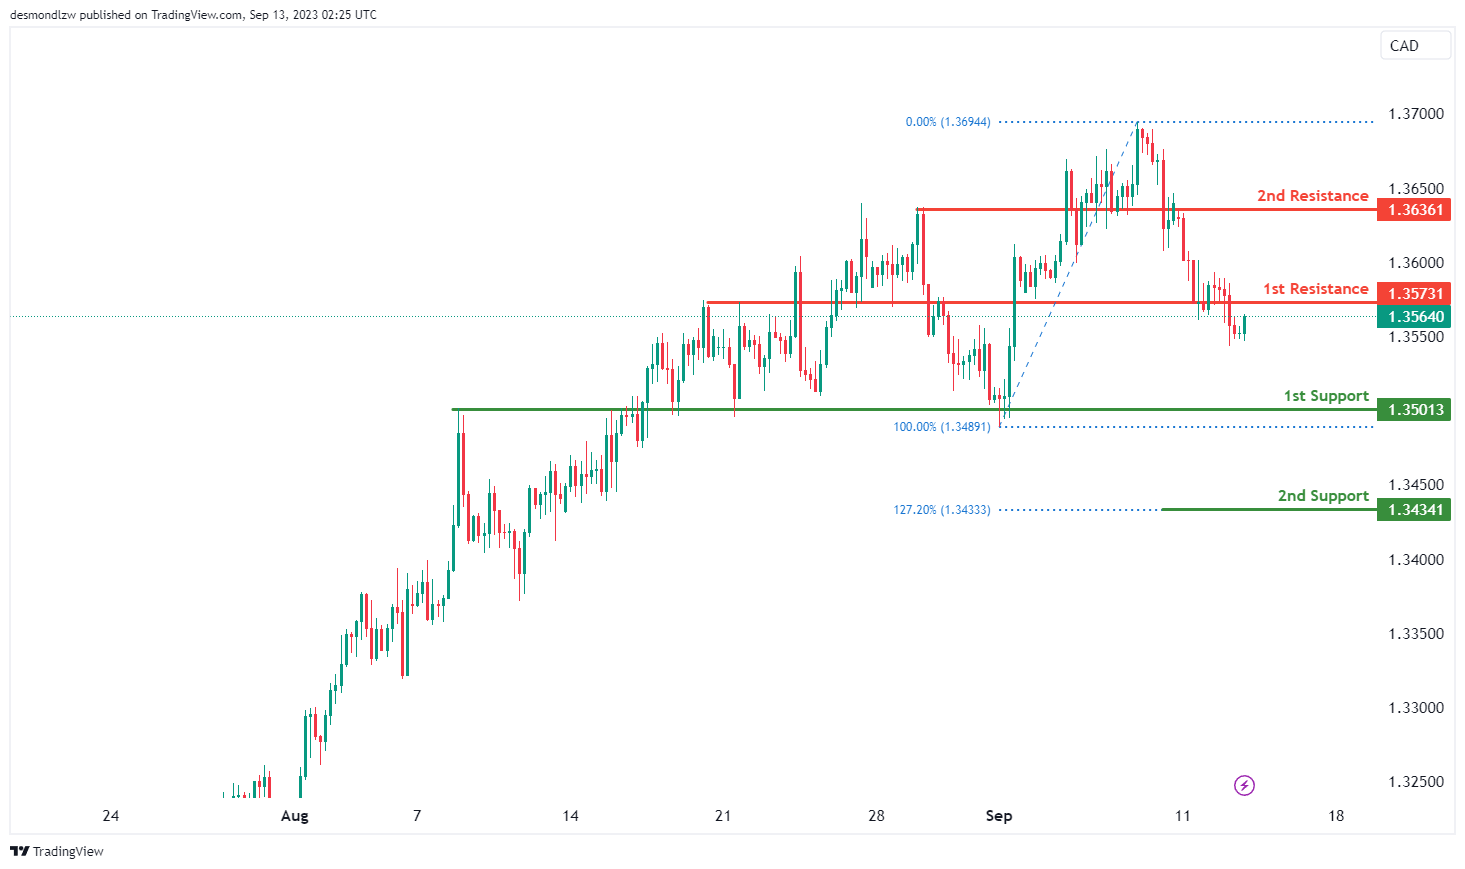
The USD/CAD chart currently displays an overall bullish momentum, suggesting a potential upward trend in price movement towards the 1st resistance.
The 1st resistance level at 1.3573 is identified as an overlap resistance while the 2nd resistance level at 1.3636 is also identified as an overlap resistance, indicating its significance as a potential barrier to further bullish movements.
To the downside, the 1st support level at 1.3501 is identified as an overlap support. Additionally, the 2nd support level at 1.3434 is marked as a pullback support that aligns with the 127.20% Fibonacci extension level, reinforcing its potential role as a support level.
AUD/USD:
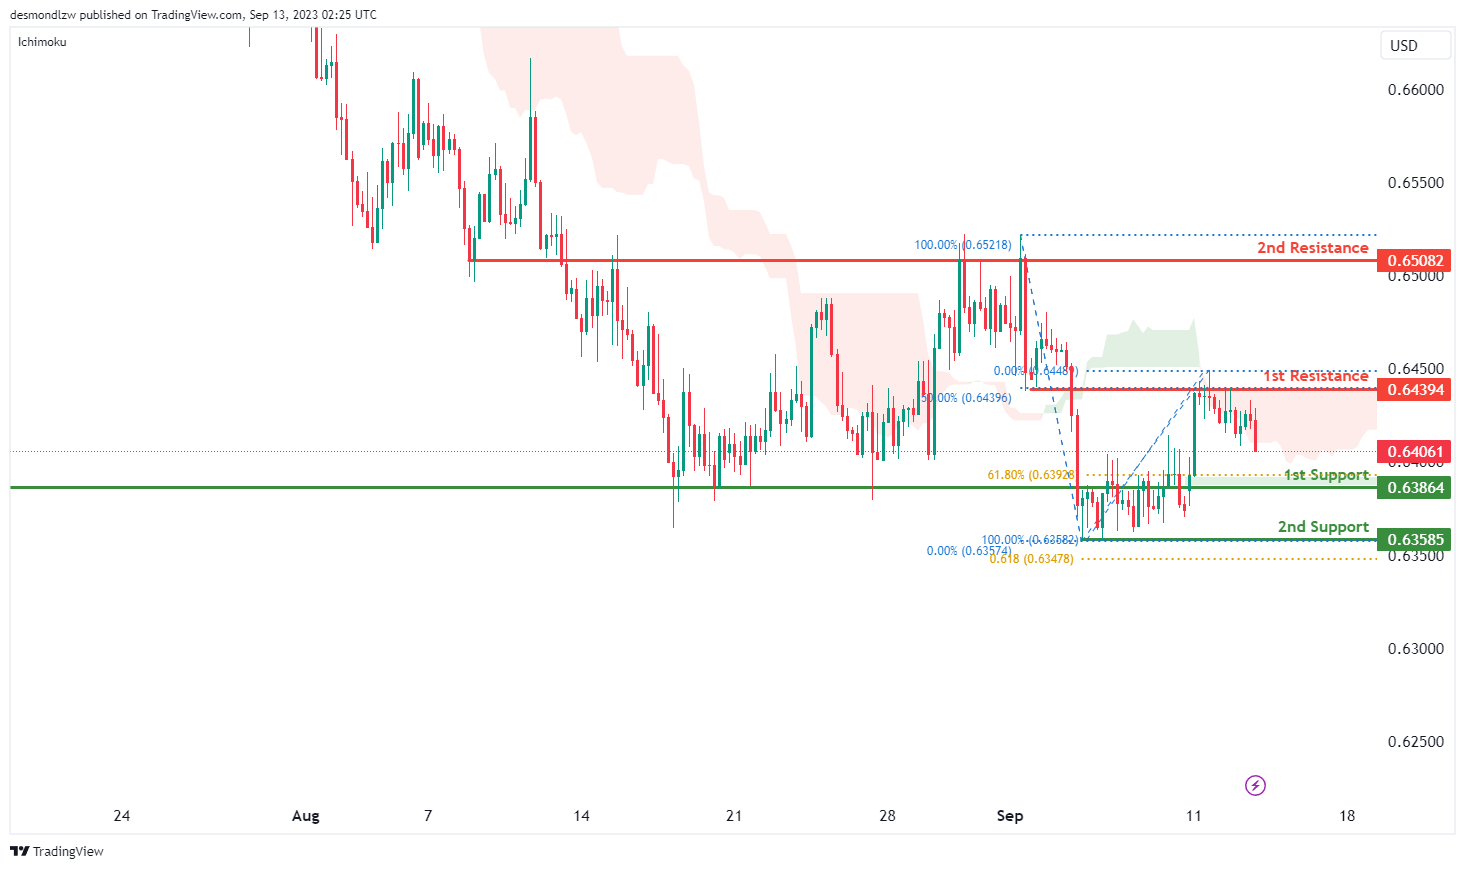
The AUD/USD chart currently exhibits an overall bearish momentum, driven by its position below the bearish Ichimoku cloud. There is a potential for a bearish continuation towards the 1st support level.
The 1st support level at 0.6386 is identified as an overlap support that aligns with the 61.80% Fibonacci retracement level. Furthermore, the 2nd support level at 0.6359 is marked as a pullback support that aligns with the 61.80% Fibonacci projection level, reinforcing its potential as a support level.
To the upside, the 1st resistance level at 0.6439 is identified as an overlap resistance that aligns with the 50.00% Fibonacci retracement level. Additionally, the 2nd resistance level at 0.6508 is also marked as an overlap resistance, indicating its significance as a potential barrier to further bullish movements.
NZD/USD
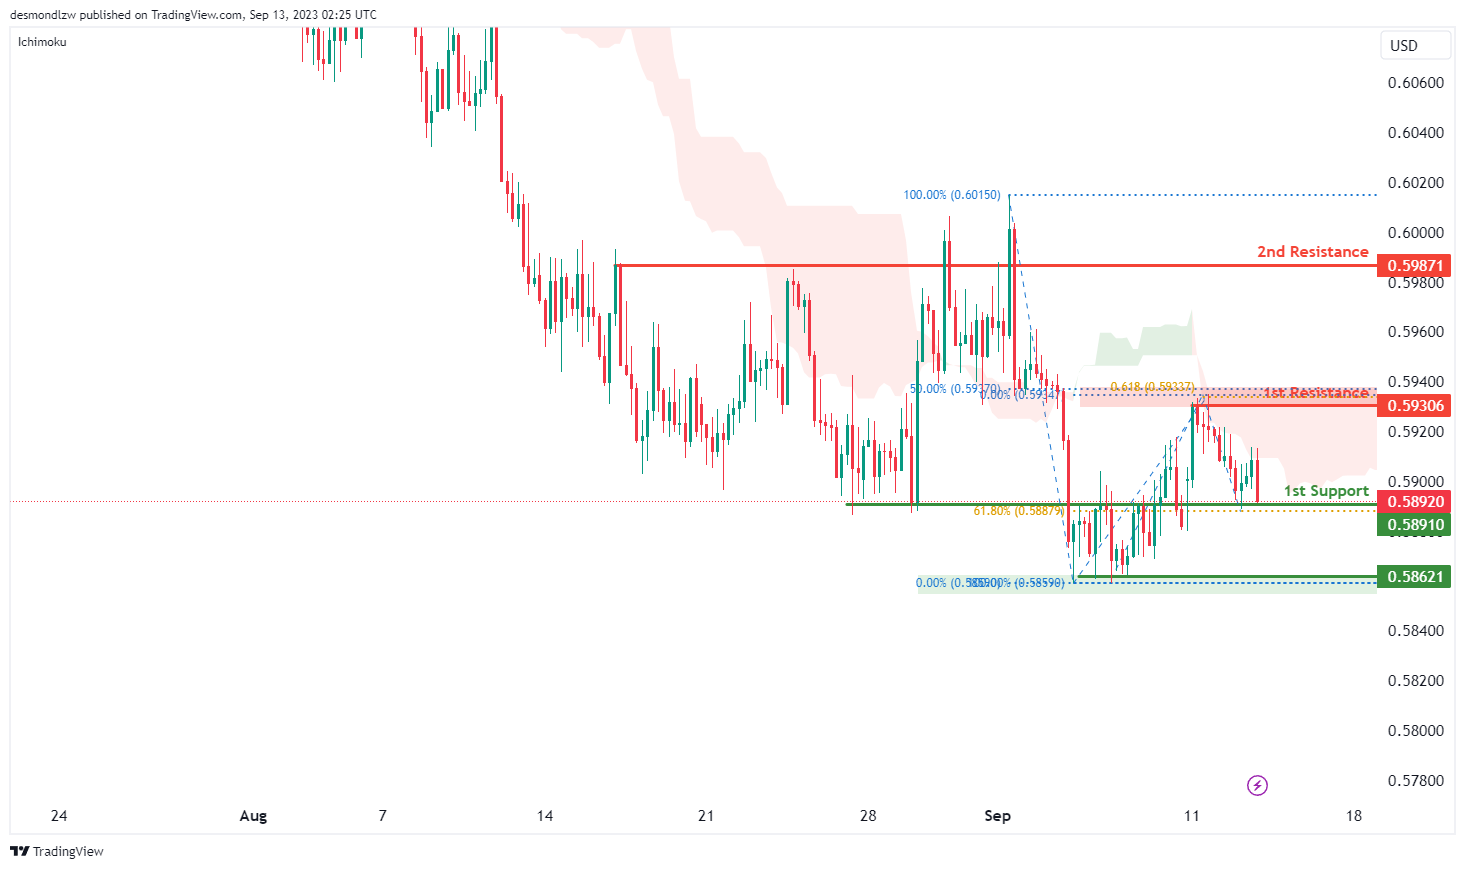
The NZD/USD chart currently indicates an overall bearish momentum, supported by its position below the bearish Ichimoku cloud. There is a potential for price to experience a bearish breakout through the 1st support level to drop towards the 2nd support level.
The 1st support level at 0.5891 is identified as an overlap support that coincides with the 61.80% Fibonacci retracement level while the 2nd support level at 0.5862 is marked as a pullback support.
To the upside, the 1st resistance level at 0.5931 is identified as an overlap resistance that aligns with a confluence of Fibonacci levels i.e. the 50.00% retracement and the 50% projection levels, indicating a potential area of resistance. Additionally, the 2nd resistance level at 0.5987 is noted as an overlap resistance.
DJ30:
For DJ30, the overall momentum of the chart is currently bullish, indicating an upward trend.
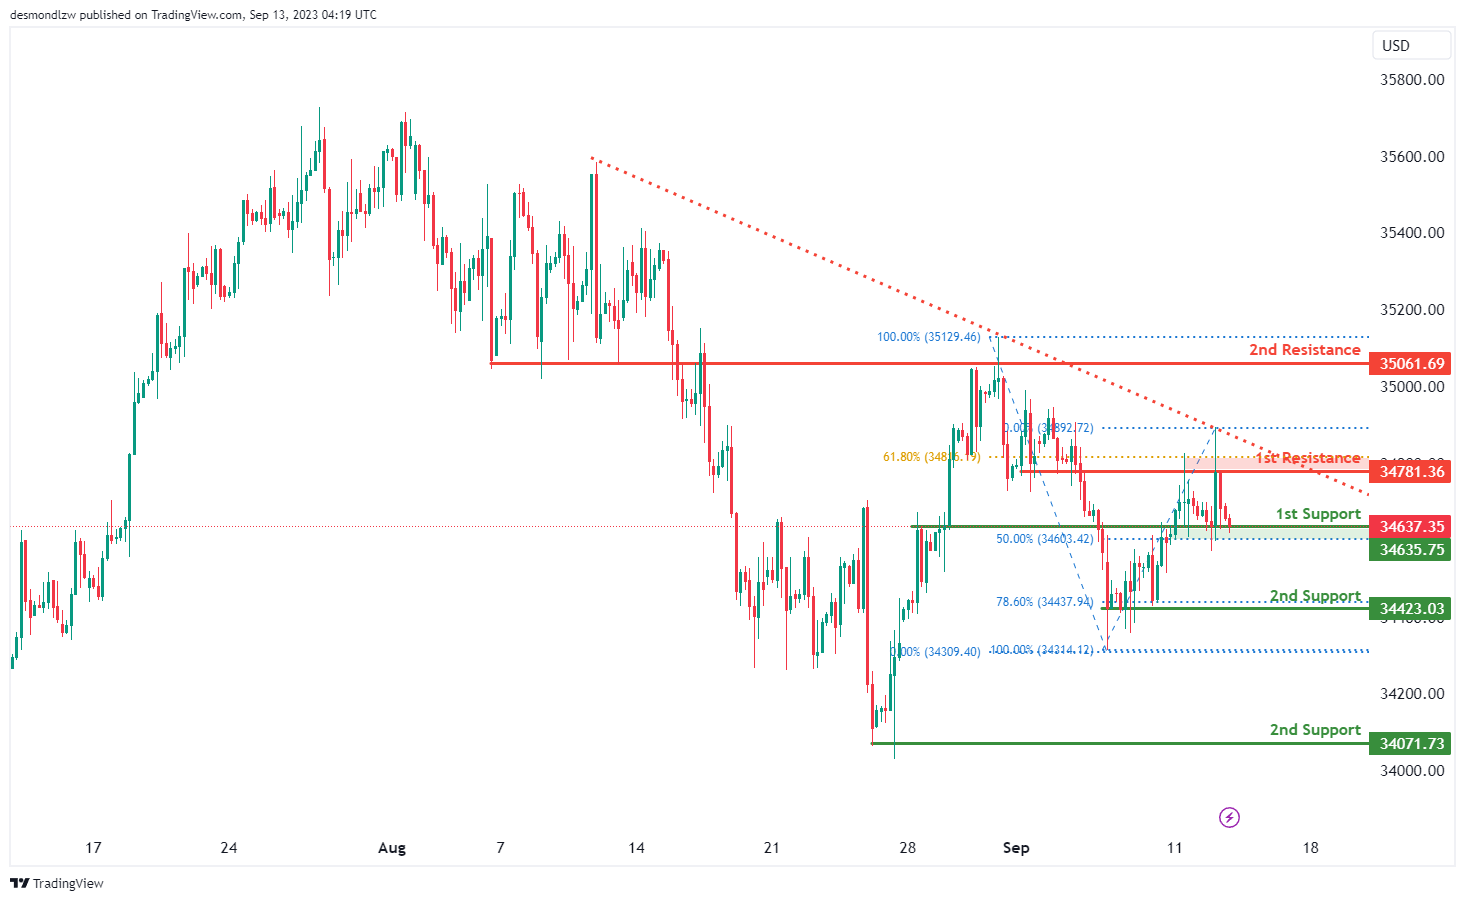
There is potential for the price to make a bullish move by bouncing off the 1st support level at 34635.75 and heading towards the 1st resistance at 34781.36.
The 1st support at 34635.75 is considered significant because it represents an overlap support and aligns with the 50% Fibonacci Retracement level, suggesting potential stability and support at this level.
In case of a more substantial retracement, the 2nd support level at 34423.03 is also noteworthy, as it represents multi-swing low support and aligns with the 78.60% Fibonacci Retracement, offering additional reinforcement for the price.
On the upper side, the 1st resistance at 34781.36 is considered important due to its characteristics as an overlap resistance and its alignment with the 61.80% Fibonacci Retracement level. This level may act as a barrier to downward movement.
Further upward movement could face resistance at the 2nd resistance level of 35061.69, characterized as an overlap resistance, which could pose a significant challenge to the bearish momentum within the observed range.
GER30:
For GER30, the overall momentum of the chart is currently bearish, indicating a downward trend.
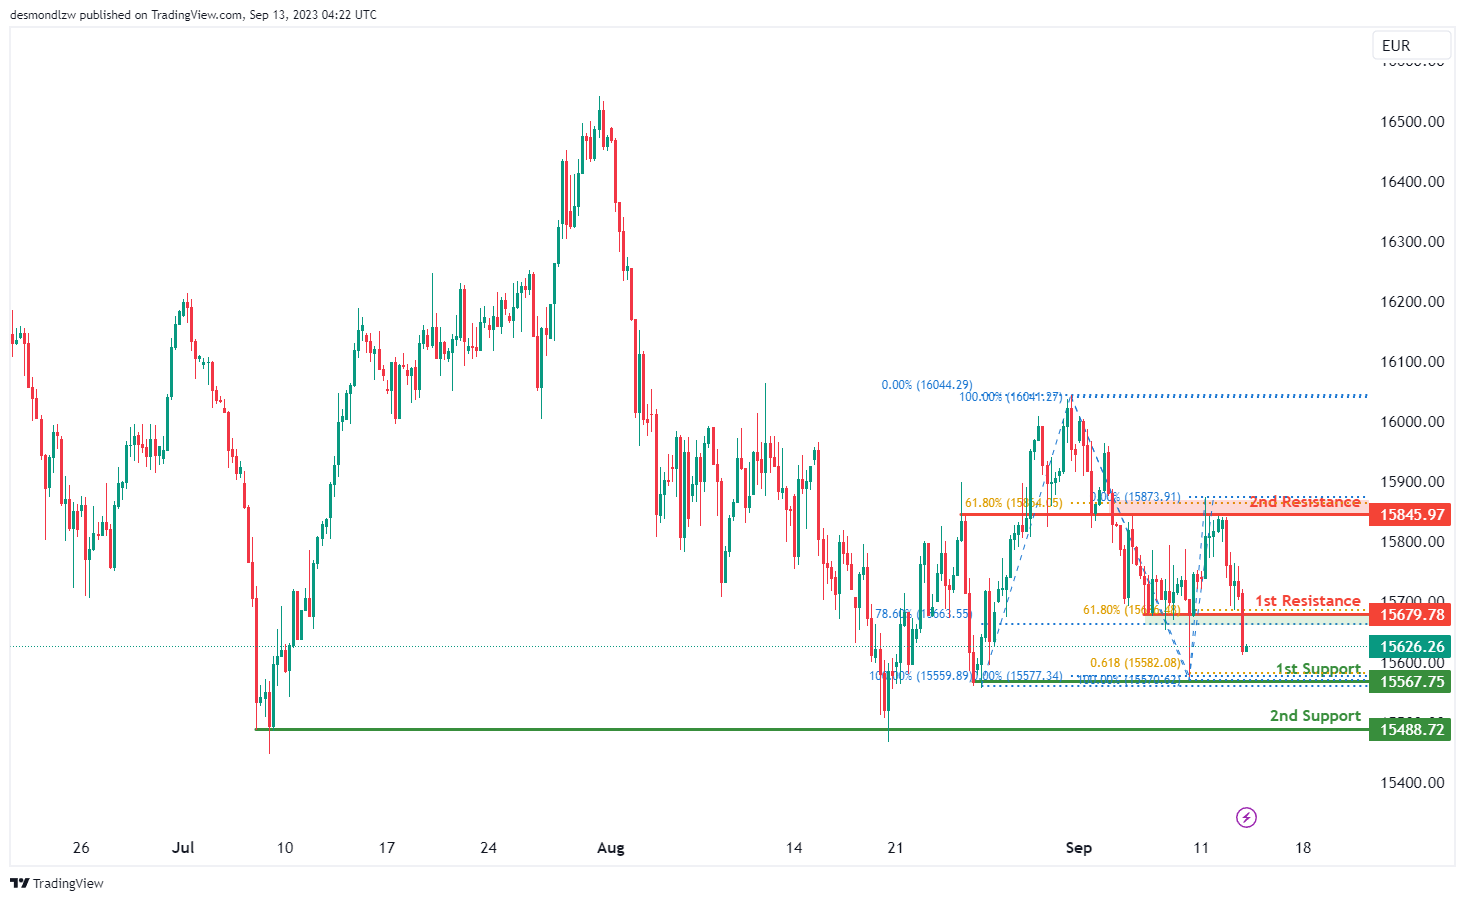
There is potential for the price to continue its bearish movement towards the 1st support level at 15567.75. This 1st support is considered significant because it represents multi-swing low support and aligns with the 61.80% Fibonacci Projection, indicating potential stability and support at this level.
In case of a more substantial decline, the 2nd support level at 15488.72 is also noteworthy as it represents a swing low support, offering additional reinforcement for the price.
On the upper side, if there’s a reversal in the price, it may face resistance at the 1st resistance level of 15679.78. This 1st resistance is considered important because it represents pullback resistance and aligns with the 61.80% Fibonacci Retracement.
Further upward movement may encounter resistance at the 2nd resistance level of 15845.97, characterized as multi-swing high resistance and aligned with the 61.80% Fibonacci Retracement, potentially posing a significant obstacle to the bullish momentum.
US500
For US500, the overall momentum of the chart is currently bearish, indicating a downward trend.
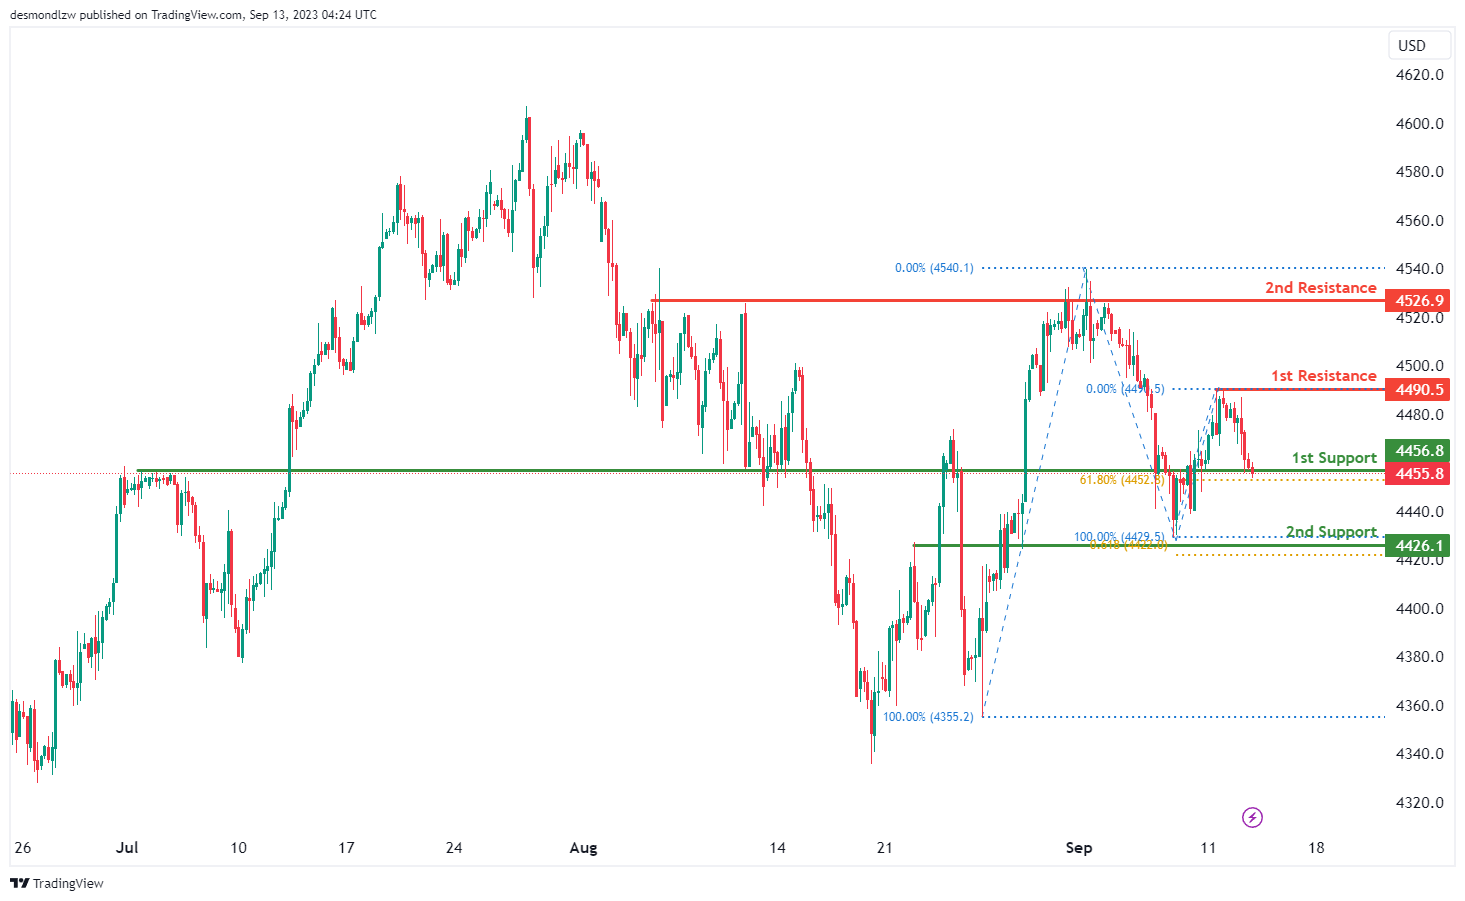
There is potential for the price to make a bearish move by breaking below the 1st support level at 4456.8 and dropping towards the 2nd support level at 4426.1.
The 1st support at 4456.8 is considered significant because it represents an overlap support and aligns with the 61.80% Fibonacci Retracement level, suggesting potential stability and support at this level.
In case of a more substantial decline, the 2nd support level at 4426.1 is also noteworthy, representing an overlap support and aligning with the 61.80% Fibonacci Projection, providing additional reinforcement for this level.
On the upper side, if there’s a reversal in the price, it may face resistance at the 1st resistance level of 4490.5, which is identified as a swing high resistance.
Further upward movement could encounter resistance at the 2nd resistance level of 4526.9, characterized as multi-swing high resistance, potentially acting as a barrier to the bullish momentum within the observed range.
BTC/USD:
For BTC/USD, the overall momentum of the chart is currently bearish, indicating a downward trend.
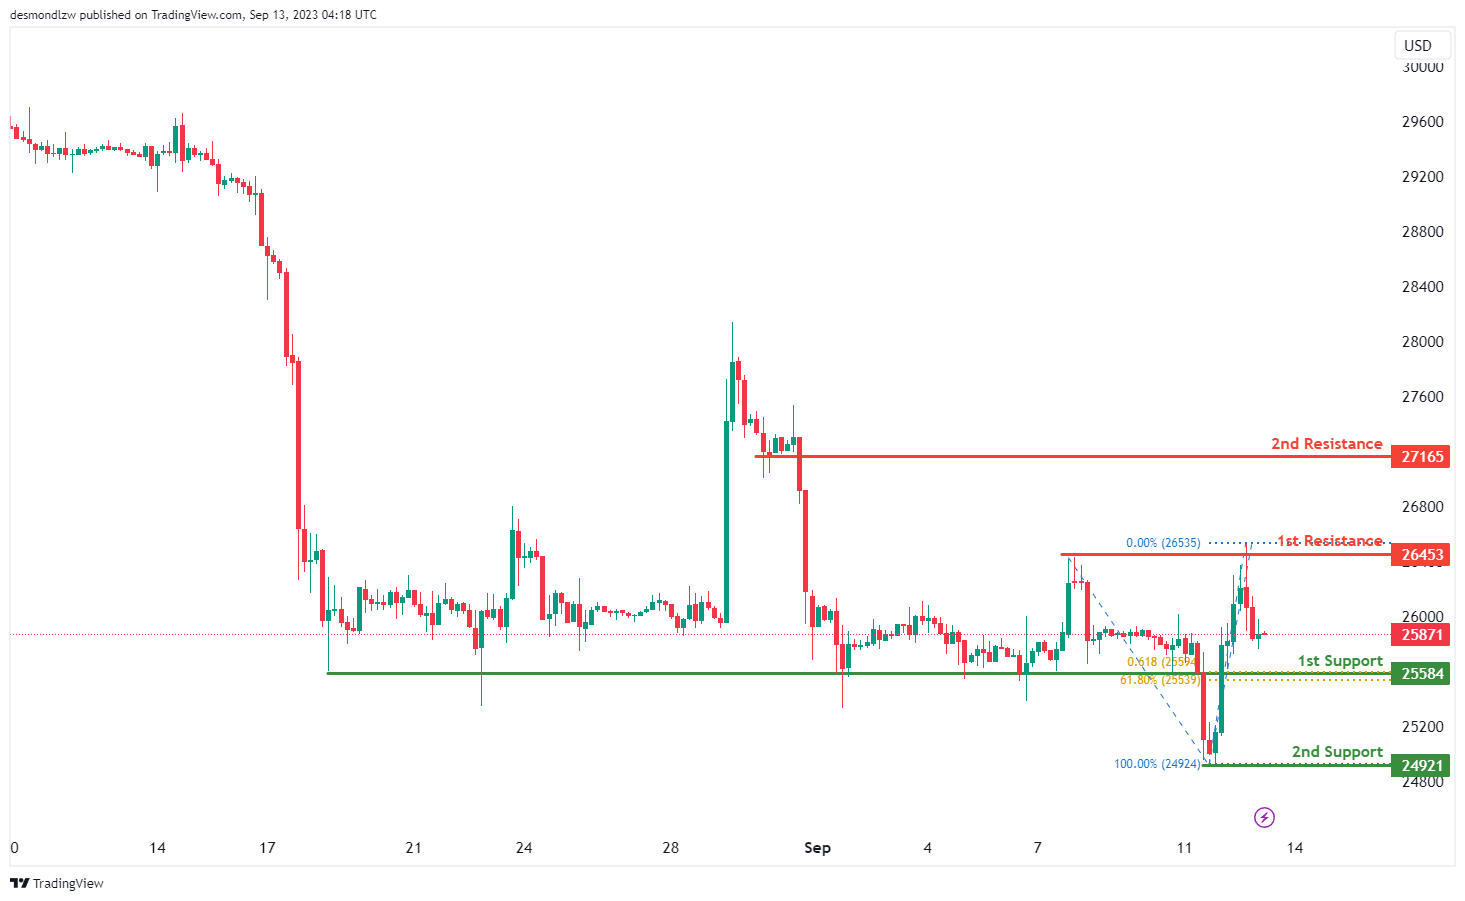
There is potential for the price to continue its bearish movement towards the 1st support level at 25584. This 1st support is considered significant because it represents a pullback support and aligns with both the 61.80% Fibonacci Retracement and the 61.80% Fibonacci Projection, indicating strong potential support due to Fibonacci confluence.
In case of a more substantial decline, the 2nd support level at 24921 is also noteworthy, representing a swing low support, which may provide additional reinforcement for the price.
On the upper side, if there’s a reversal in the price, it may face resistance at the 1st resistance level of 26453, which is characterized as multi-swing high resistance.
Further upward movement could encounter resistance at the 2nd resistance level of 27165, identified as pullback resistance, which may act as a barrier to the bullish momentum within the observed range.
ETH/USD:
For ETH/USD, the overall momentum of the chart is currently bearish, indicating a downward trend.
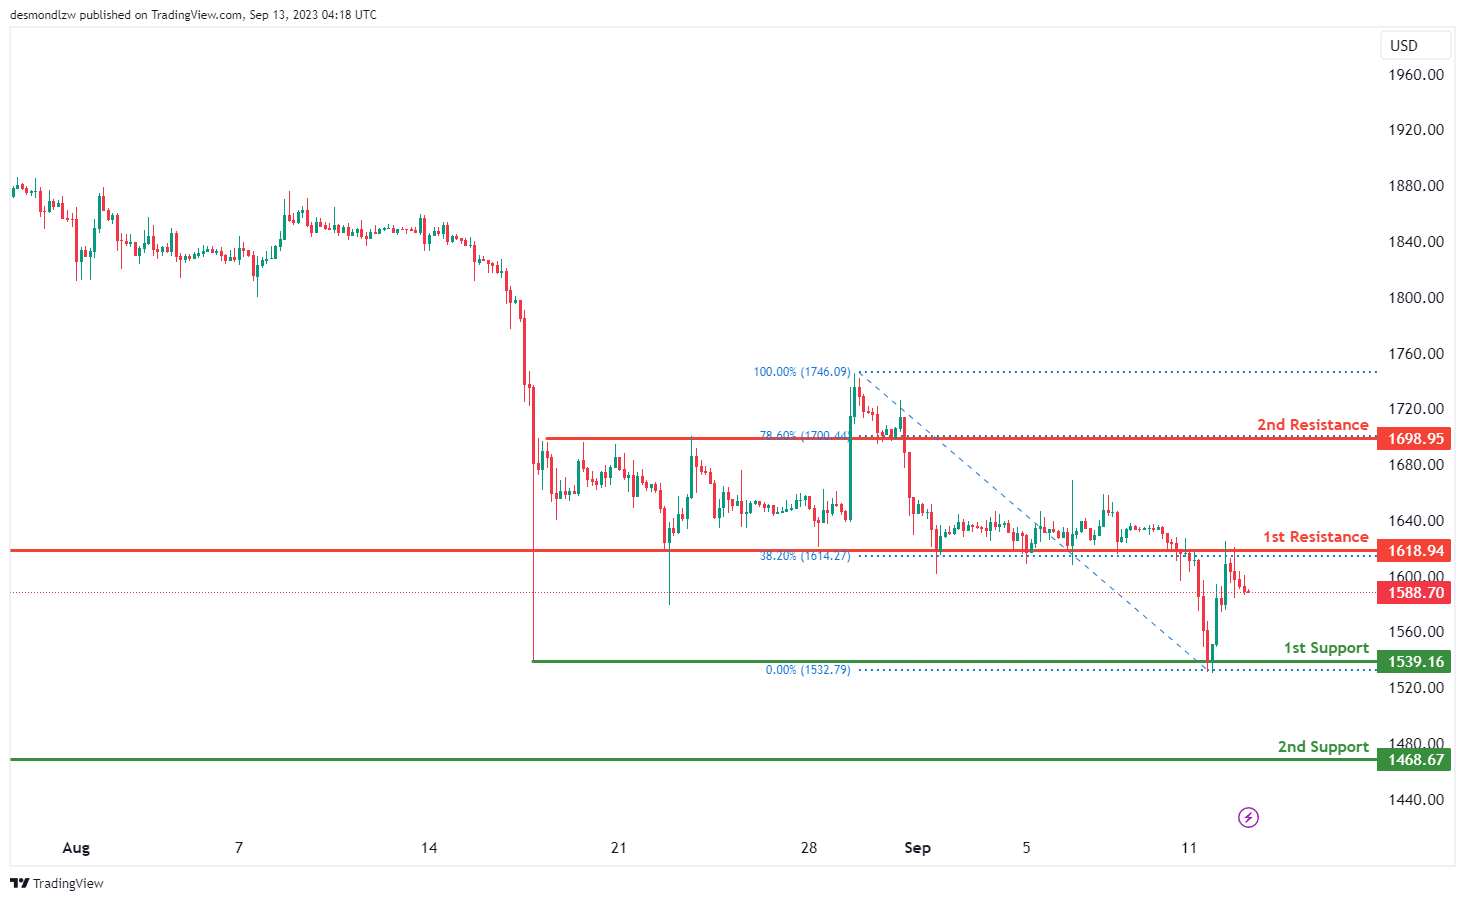
There is potential for the price to continue its bearish movement towards the 1st support level at 1539.16. This 1st support is considered significant because it represents multi-swing low support, indicating potential stability at this level.
In case of a more substantial decline, the 2nd support level at 1468.67 is also noteworthy, as it represents a swing low support, offering additional reinforcement for the price.
On the upper side, the 1st resistance at 1618.94 is considered important due to its characteristics as pullback resistance, supported by the 38.20% Fibonacci Retracement level. This level may act as a barrier to upward movement.
Further upward movement could face resistance at the 2nd resistance level of 1698.95, characterized as pullback resistance and aligned with the 78.60% Fibonacci Retracement level, potentially posing a significant obstacle to the bullish momentum.
WTI/USD:
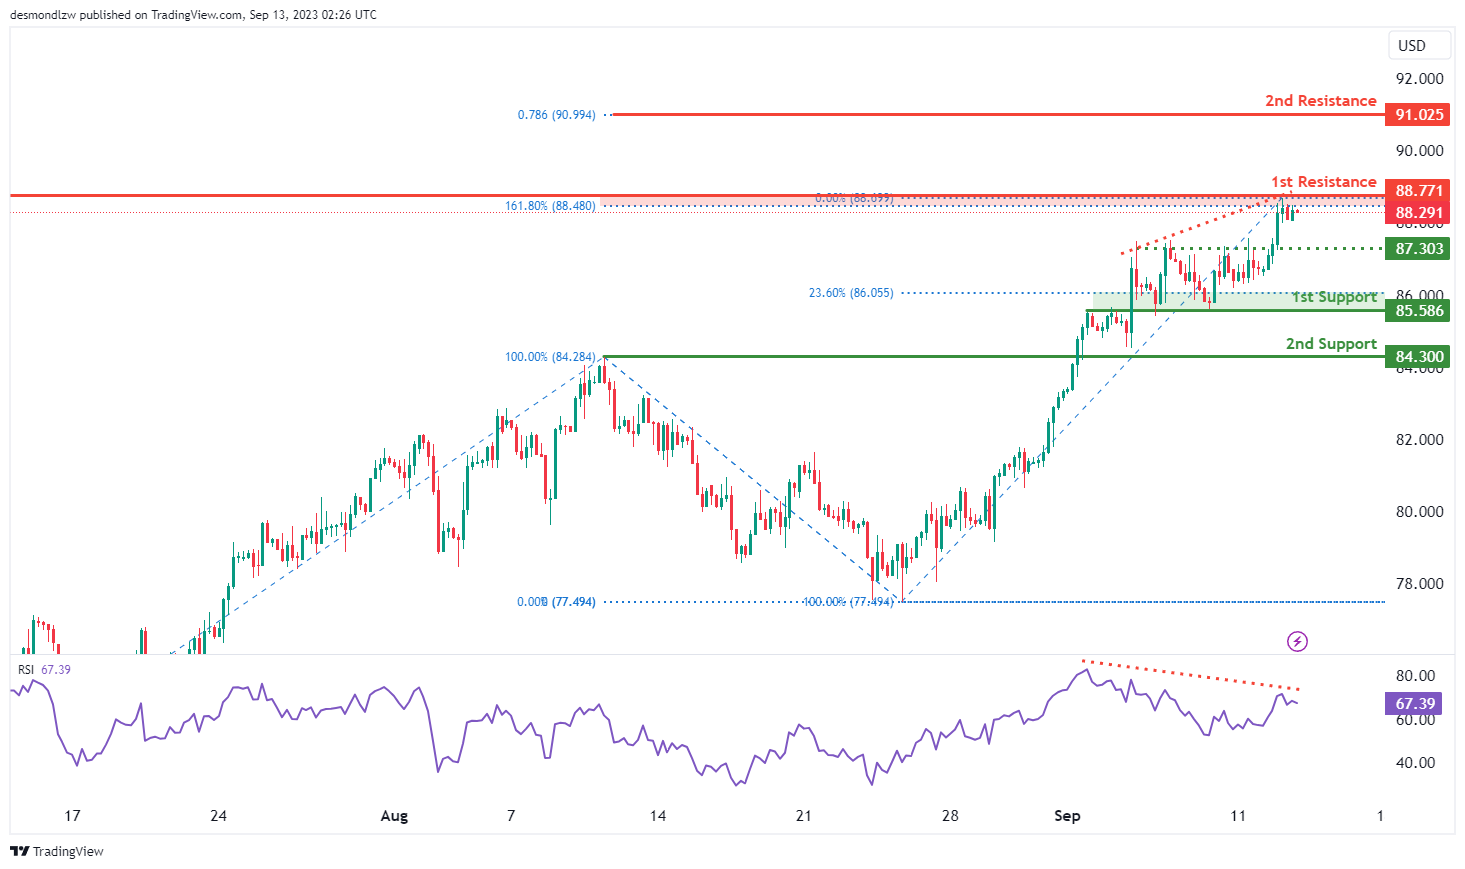
The WTI chart currently indicates a weak bearish momentum with low confidence as the RSI is displaying a bearish divergence versus the price, suggesting the possibility of a reversal in the near future. There is a potential scenario where price could experience a bearish reaction close to or upon reaching the 1st resistance level and subsequently drop towards the 1st support level.
The 1st resistance level at 88.77 is identified as an overlap resistance that coincides with the 161.80% Fibonacci extension level. Furthermore, the 2nd resistance level at 91.03 is noted as a resistance level that aligns with the 78.60% Fibonacci projection level.
To the downside, the intermediate support level at 87.30 is marked as pullback support while the 1st support level at 85.59 is identified as an overlap support that aligns with the 23.60% Fibonacci retracement level. Additionally, the 2nd support level at 84.30 is marked as a pullback support.
XAU/USD (GOLD):
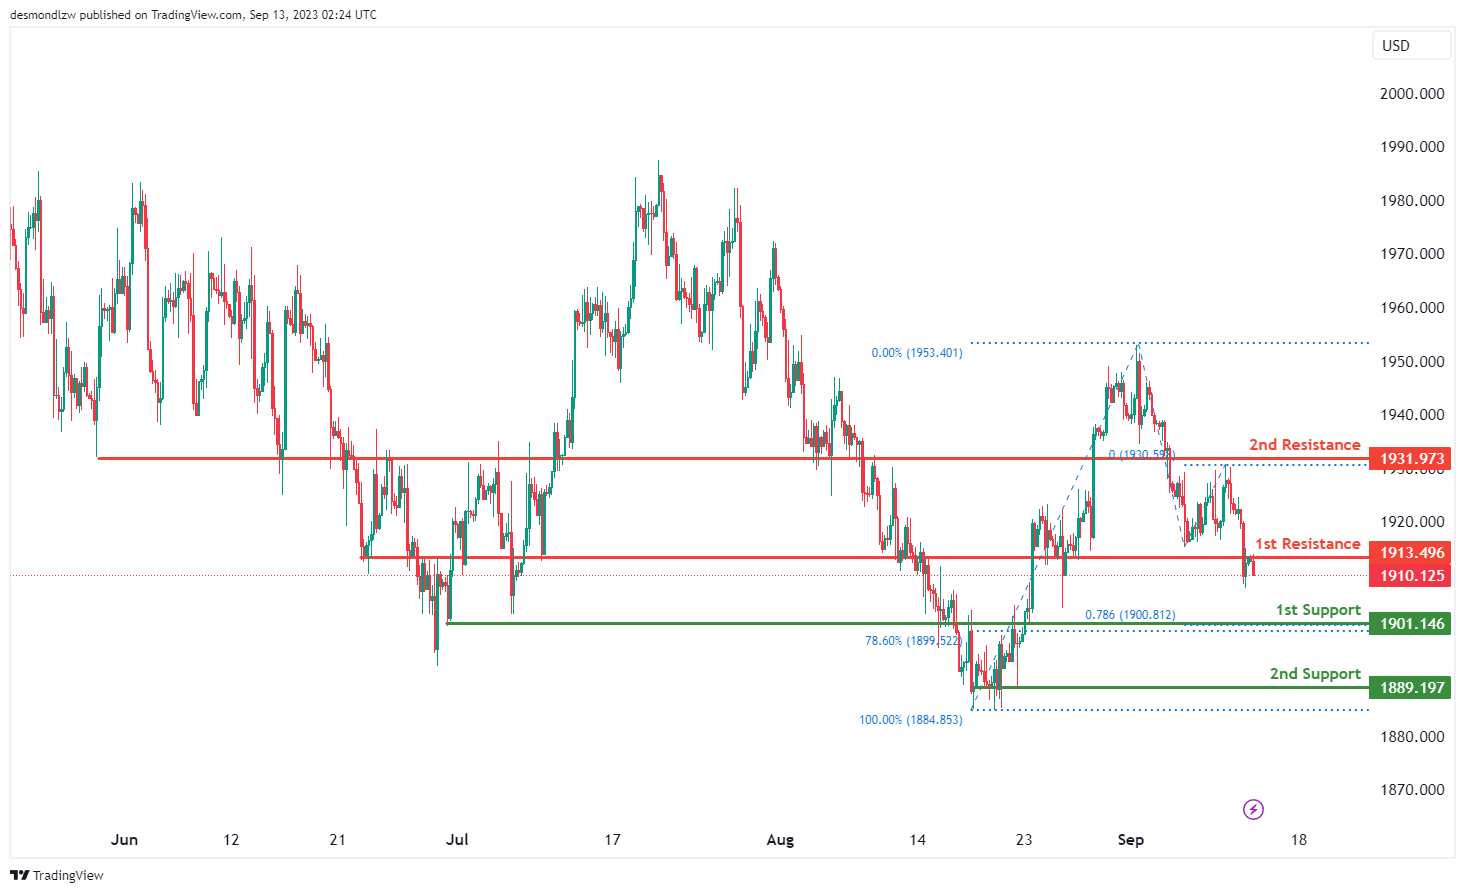
The XAU/USD (Gold/US Dollar) chart currently exhibits a bearish overall momentum, signaling a potential downward trend in price movement. There’s a likelihood of a bearish continuation towards the 1st support level.
The 1st support at 1901.14 is considered a strong support zone, as it aligns with an overlap support, the 78.60% Fibonacci Retracement, and the 78.60% Fibonacci Projection, indicating Fibonacci confluence. Additionally, the 2nd support at 1889.19 is characterized as a multi-swing low support.
On the resistance side, the 1st resistance at 1913.49 represents an overlap resistance, while the 2nd resistance at 1931.97 is also marked as an overlap resistance.
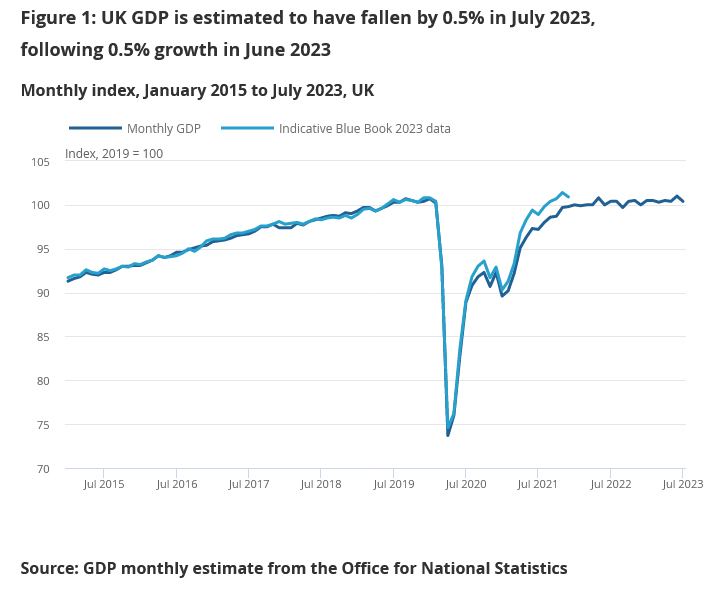
UK GDP down -0.5% mom in Jul, dragged by services contraction
UK GDP contracted -0.5% mom in July, much worse than expectation of -0.2% mom. Services was down -0.5% mom, the main contributor to the fall in GDP. Production fell by -0.7% mom. Construction fell by -0.5% mom.
In the three months to July compared with the prior three-month period, GDP increased by 0.2%. Production rose 0.6%, and was the main contributing sector. Services and construction both rose by 0.1%.
Also released, industrial production came in at -0.7% mom, 0.4% yoy in July, versus expectation of -0.5% mom, 0.5% yoy. Manufacturing was at -0.8% mom, 3.0% yoy, versus expectation of -0.9% mom, 2.7% yoy. Goods trade deficit narrowed to GBP -14.1B, versus expectation of GBP -15.9B.
EUR/USD Daily Outlook
Daily Pivots: (S1) 1.0718; (P) 1.0743; (R1) 1.0781; More...
EUR/USD is still extending the consolidation pattern from 1.0685 and intraday bias remains neutral. While stronger recovery might be seen, outlook will stay bearish as long as 1.0944 resistance holds. On the downside, below 1.0685 will resume the fall from 1.1274 to 1.0609/34 cluster support zone next.
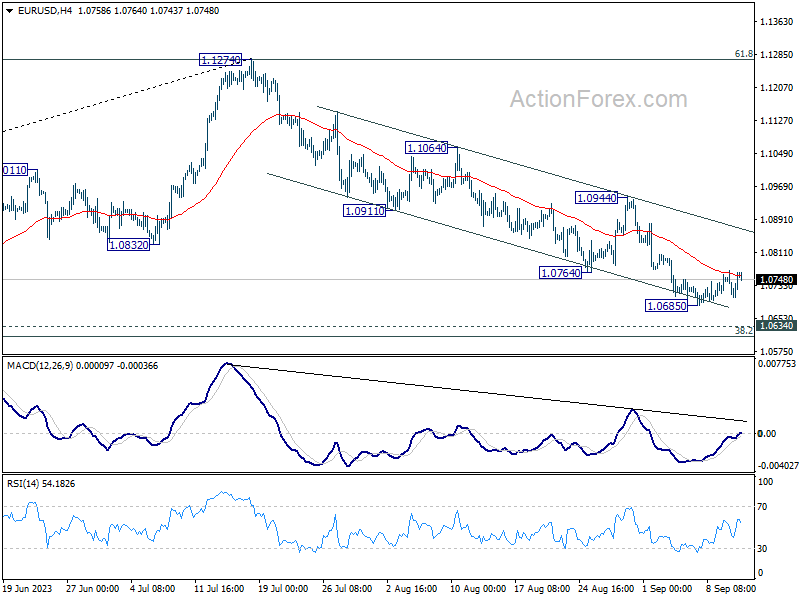
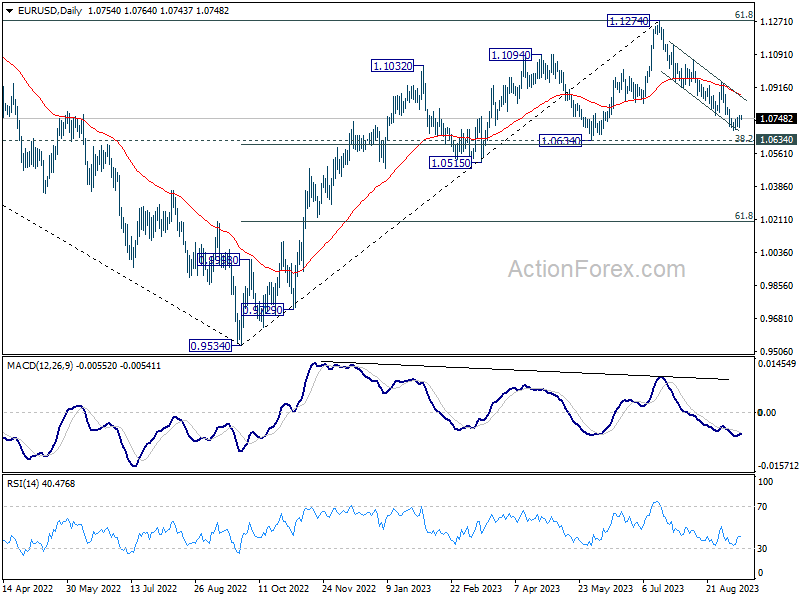
In the bigger picture, fall from 1.1274 medium term top is seen as a correction to up trend from 0.9534 (2022 low). Strong support could be seen from 1.0634 cluster support (38.2% retracement of 0.9534 to 1.1274 at 1.0609) to bring rebound, at least on first attempt. Break of 1.0944 will indicate the start of the second leg, and target retest of 1.1274. However, sustained break of 1.0609/0634 will raise the chance of bearish trend reversal, and target 61.8% retracement at 1.0199.
Euro Resonates on ECB Whispers; Markets Await US and UK Key Releases
Euro experienced a bounce amidst whispers that ECB forthcoming inflation projections might support an imminent rate hike on Thursday. Nevertheless, this uptick was moderate, as the revelations originated from an anonymous source. Simultaneously, investors worldwide are gearing up for pivotal US CPI data and UK GDP figures set to drop later today, both of which have the potential to create ripples in the market.
According to a Reuters report, insider information suggests that the quarterly economic projections to be handed in to ECB Governing Council today could reveal an inflation rate well surpassing 3% in 2024. This prediction defies anticipations of a marginal downward revision. Notably, the speculated 2024 figure overshadows the bank's 2% target, showing a leap from the 3% projection made in June. However, uncertainty remains as the source mentioned that this week's rate decision hangs in the balance, with formal proposals for the meeting yet to be tabled.
Diving into other currency movements, Australian Dollar took a hit, emerging as the day's poorest performer. Yen trails, with any uplift from BoJ Governor Kazuo Ueda's influence dissipated swiftly. On the other side, Dollar is holding its ground as the day's top performer, but that's part of sideway trading inside familiar ranges against other major currencies. Sterling is claiming the second spot, followed closely by Swiss Franc.
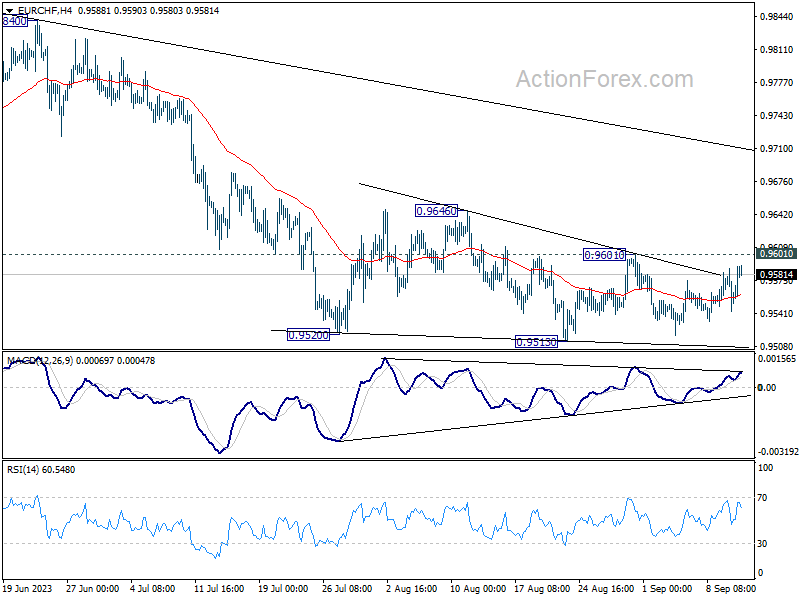
On a technical note, EUR/CHF is making some progress with the break of a near term falling trend line resistance. But risks will stay on the downside as long as 0.9601 resistance holds. That is, larger down trend from 1.0095 (Jan high) is still in favor to resume through 0.9513. However, decisive break of 0.9601 will be the first signal of a more sustainable near term rally, which could push EUR/CHF through 0.9646 resistance. The burning question remains: Will Euro enthusiasts make a premature move ahead of the crucial ECB rate decision?
In Asia, at the time of writing, Nikkei is down -0.39%. Hong Kong HSI is down -0.21%. China Shanghai SSE is down -0.87%. Singapore Strait Times is down -0.06%. Japan 10-year JGB yield is down -0.0021 at 0.708. Overnight, DOW dropped -0.05%. S&P 500 dropped -0.57%. NASDAQ dropped -1.04%. 10-year yield dropped -0.024 to 4.264.
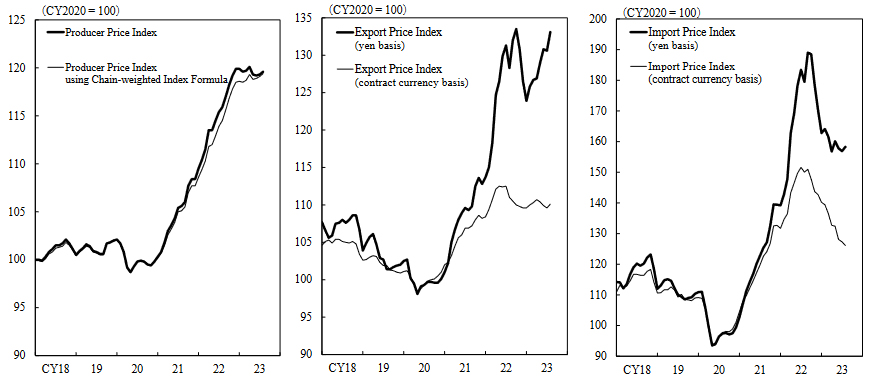
Japan's CGPI records eighth consecutive month of slowdown in August
Japan's annual wholesale inflation, as measured by Corporate Goods Price Index, registered a slowdown for the eighth consecutive month in August. CGPI eased to 3.2% yoy, aligning with market expectations and continuing its downward trend from the peak of 10.6% yoy recorded in December.
Export price index recorded a lesser contraction of -0.8% yoy compared to -2.6% yoy in July. Meanwhile, import price index also demonstrated a slight moderation in its decline, posting a -15.9% yoy compared to -16.0% yoy observed in the preceding month.
On a month-on-month basis, PPI saw an uptick of 0.3% mom. Delving into the specifics, export price index witnessed a recovery, improving by 0.5% mom. In contrast, the import price index reported a decline of 0.9% mom. within the same period.
US CPI to bounce to 3.6%, Fed seen firmly on hold next week
Today, all eyes are on US August CPI data, with anticipation of a flare-up in inflation, primarily fueled by escalating oil prices. While broader CPI is expected to witness a surge, core CPI, which excludes volatile food and energy costs, is projected to experience moderated rise annually.
Specifically, CPI is projected to rise by 0.6% mom, a significant jump from July's 0.2% mom. It would mark an annual inflation rate of 3.6% yoy, up from the previous 3.2% yoy. On the other hand, Core CPI is anticipated to grow by 0.2% mom, translating to year-on-year rate of 4.3% yoy, deceleration from prior 4.7% yoy.
Fed fund futures are decidedly leaning towards a Fed hold next Thursday, with 93% probability of federal funds rate being unchanged at 5.25-5.50%. There's just over a 50% chance that interest rates will remain at this level by the year-end. Predictions for the initial rate cut before next June stay under the 50% mark.
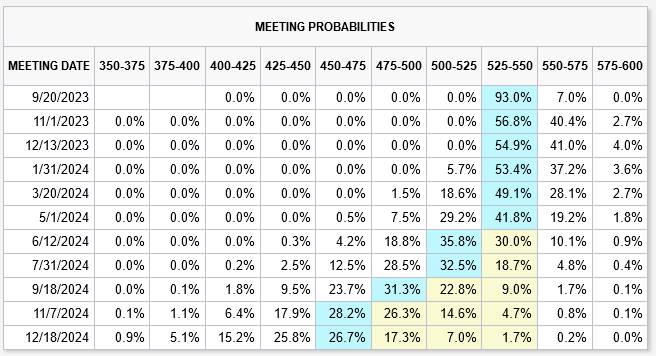
Further, a recent Reuters poll showcases the dominant stance among economists, with a whopping 95% (or 94 out of 97 economists) foreseeing a hold by Fed in the forthcoming week. Only one-fifth of the economists (17 out of 97) foresee at least one additional rate hike by the close of this year. Out of 87 economists who projected till mid-2024, 28 anticipate the first rate cut to materialize in Q1, while 33 expect it in the following quarter.
Elsewhere
UK GDP, production and goods trade balance, as well as Eurozone industrial production will be featured in European session.
EUR/USD Daily Outlook
Daily Pivots: (S1) 1.0718; (P) 1.0743; (R1) 1.0781; More...
EUR/USD is still extending the consolidation pattern from 1.0685 and intraday bias remains neutral. While stronger recovery might be seen, outlook will stay bearish as long as 1.0944 resistance holds. On the downside, below 1.0685 will resume the fall from 1.1274 to 1.0609/34 cluster support zone next.
In the bigger picture, fall from 1.1274 medium term top is seen as a correction to up trend from 0.9534 (2022 low). Strong support could be seen from 1.0634 cluster support (38.2% retracement of 0.9534 to 1.1274 at 1.0609) to bring rebound, at least on first attempt. Break of 1.0944 will indicate the start of the second leg, and target retest of 1.1274. However, sustained break of 1.0609/0634 will raise the chance of bearish trend reversal, and target 61.8% retracement at 1.0199.
Economic Indicators Update
| GMT | Ccy | Events | Actual | Forecast | Previous | Revised |
|---|---|---|---|---|---|---|
| 23:50 | JPY | PPI Y/Y Aug | 3.20% | 3.20% | 3.60% | 3.40% |
| 23:50 | JPY | BSI Large Manufacturing Conditions Q3 | 5.4 | 0.2 | -0.4 | |
| 06:00 | GBP | GDP M/M Jul | -0.20% | 0.50% | ||
| 06:00 | GBP | Industrial Production M/M Jul | -0.50% | 1.80% | ||
| 06:00 | GBP | Industrial Production Y/Y Jul | 0.50% | 0.70% | ||
| 06:00 | GBP | Manufacturing Production M/M Jul | -0.90% | 2.40% | ||
| 06:00 | GBP | Manufacturing Production Y/Y Jul | 2.70% | 3.10% | ||
| 06:00 | GBP | Goods Trade Balance (GBP) Jul | -15.9B | -15.5B | ||
| 09:00 | EUR | Eurozone Industrial Production M/M Jul | -0.70% | 0.50% | ||
| 11:00 | GBP | NIESR GDP Estimate Aug | 0.30% | |||
| 12:30 | USD | CPI M/M Aug | 0.60% | 0.20% | ||
| 12:30 | USD | CPI Y/Y Aug | 3.60% | 3.20% | ||
| 12:30 | USD | CPI Core M/M Aug | 0.20% | 0.20% | ||
| 12:30 | USD | CPI Core Y/Y Aug | 4.30% | 4.70% | ||
| 14:30 | USD | Crude Oil Inventories | -2.2M | -6.3M |
US CPI to bounce to 3.6%, Fed seen firmly on hold next week
Today, all eyes are on US August CPI data, with anticipation of a flare-up in inflation, primarily fueled by escalating oil prices. While broader CPI is expected to witness a surge, core CPI, which excludes volatile food and energy costs, is projected to experience moderated rise annually.
Specifically, CPI is projected to rise by 0.6% mom, a significant jump from July's 0.2% mom. It would mark an annual inflation rate of 3.6% yoy, up from the previous 3.2% yoy. On the other hand, Core CPI is anticipated to grow by 0.2% mom, translating to year-on-year rate of 4.3% yoy, deceleration from prior 4.7% yoy.
Fed fund futures are decidedly leaning towards a Fed hold next Thursday, with 93% probability of federal funds rate being unchanged at 5.25-5.50%. There's just over a 50% chance that interest rates will remain at this level by the year-end. Predictions for the initial rate cut before next June stay under the 50% mark.
Further, a recent Reuters poll showcases the dominant stance among economists, with a whopping 95% (or 94 out of 97 economists) foreseeing a hold by Fed in the forthcoming week. Only one-fifth of the economists (17 out of 97) foresee at least one additional rate hike by the close of this year. Out of 87 economists who projected till mid-2024, 28 anticipate the first rate cut to materialize in Q1, while 33 expect it in the following quarter.
Japan’s CGPI records eighth consecutive month of slowdown in August
Japan's annual wholesale inflation, as measured by Corporate Goods Price Index, registered a slowdown for the eighth consecutive month in August. CGPI eased to 3.2% yoy, aligning with market expectations and continuing its downward trend from the peak of 10.6% yoy recorded in December.
Export price index recorded a lesser contraction of -0.8% yoy compared to -2.6% yoy in July. Meanwhile, import price index also demonstrated a slight moderation in its decline, posting a -15.9% yoy compared to -16.0% yoy observed in the preceding month.
On a month-on-month basis, PPI saw an uptick of 0.3% mom. Delving into the specifics, export price index witnessed a recovery, improving by 0.5% mom. In contrast, the import price index reported a decline of 0.9% mom. within the same period.
AUD/USD Holds Key Support, US CPI Report Next
Key Highlights
- AUD/USD managed to stay above the 0.6360 support.
- It is facing many hurdles near 0.6440 and 0.6480 on the 4-hour chart.
- EUR/USD is still at risk of more downsides below 1.0700.
- GBP/USD could resume its downtrend below the 1.2440 level.
AUD/USD Technical Analysis
The Aussie Dollar found support near the key 0.6360 zone against the US Dollar. AUD/USD traded as low as 0.6357 and recently started an upside correction.
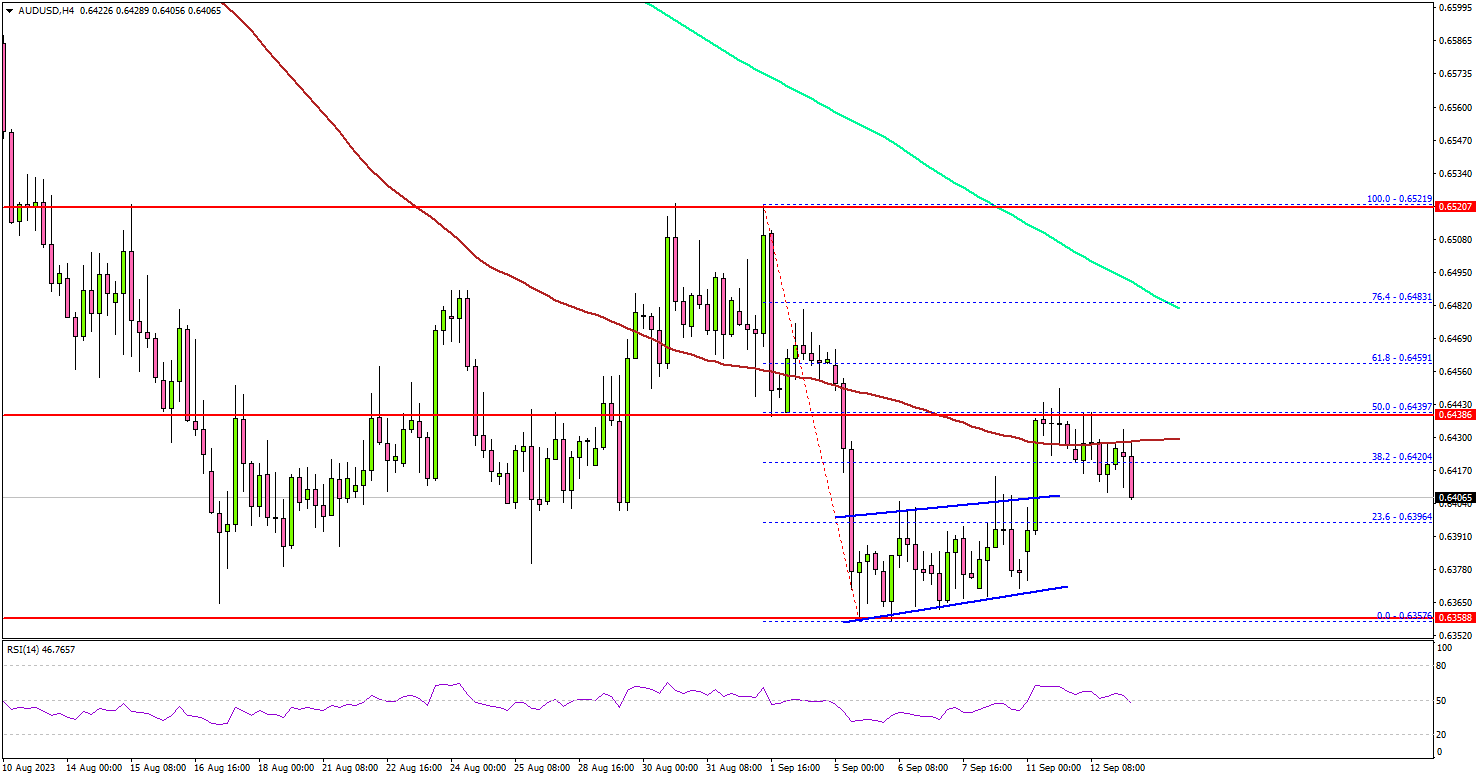
Looking at the 4-hour chart, the pair was able to clear the 0.6400 resistance. There was a move above the 23.6% Fib retracement level of the downward move from the 0.6521 swing high to the 0.6357 low.
However, the bears were active near the 0.6440 resistance and the 100 simple moving average (red, 4 hours). The next major resistance is near the 0.6480 level and the 200 simple moving average (green, 4 hours).
A close above 0.6480 could start another decent increase. In the stated case, the pair could rise toward the 0.6520 level. Any more gains might send AUD/USD toward 0.6580.
On the downside, immediate support is near 0.6395. The next key support is seen near the 0.6360 level. If there is a move below 0.6360, the pair could dive toward 0.6320. Any more losses might send the pair toward the 0.6250 level.
Looking at EUR/USD, the pair is still in a bearish zone and the bears could aim more downsides toward the 1.0620 level.
Economic Releases
- US Consumer Price Index for August 2023 (MoM) – Forecast +0.6%, versus +0.2% previous.
- US Consumer Price Index for August 2023 (YoY) – Forecast +3.6%, versus +3.2% previous.
- US Consumer Price Index Ex Food & Energy for August 2023 (YoY) – Forecast +4.3%, versus +4.7% previous.
Nasdaq (NQ) 5 Swing Sequence Favors More Upside
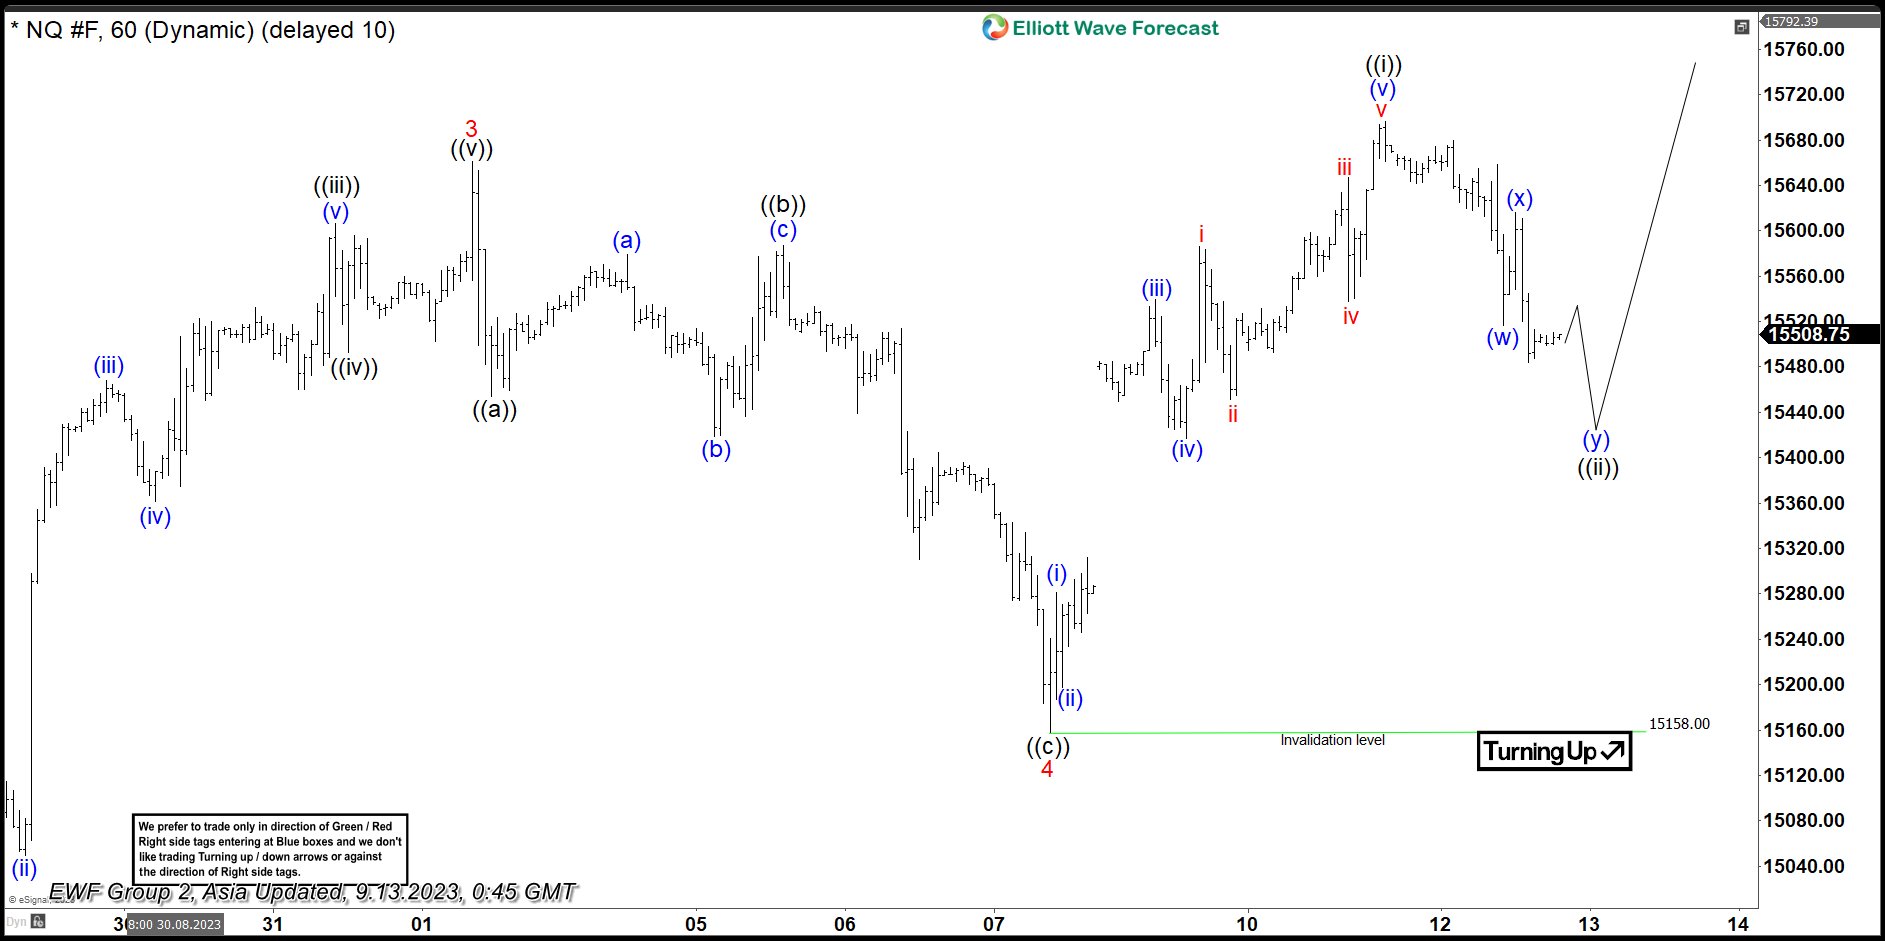
Nasdaq (NQ) shows a 5 swing sequence from August 18, 2023 low favoring further upside. 5 swing is a motive sequence and the Index therefore likely extends higher. The rally from August 18 low is unfolding as a diagonal Elliott Wave structure. Up from August 18, wave 1 ended at 15418 and pullback in wave 2 ended at 14751.7. The Index extended higher again in wave 3 towards 15661.25 and wave 4 pullback ended at 15158. Internal subdivision of wave 4 took the form of a zigzag. Down from wave 3, wave ((a)) ended at 15454 and wave ((b)) rally ended at 15586. Wave ((c)) lower ended at 15158 which completed wave 4.
The Index turned higher and broke above wave 3, confirming wave 5 higher is in progress. Up from wave 4, wave (i) ended at 15281 and wave (ii) ended at 15200. The Index rallied further in wave (iii) towards 15539 and pullback in wave (iv) ended at 15417. Final leg wave (v) ended at 15696 which completed wave ((i)). Wave ((ii)) pullback is in progress to correct cycle from 9.7.2023 low before it resumes the rally higher. Near term, as far as pivot at 15158 low stays intact, expect pullback to find support in 3, 7, or 11 swing for further upside.
Nasdaq (NQ) 60 Minutes Elliott Wave Chart
NQ Elliott Wave Video
https://www.youtube.com/watch?v=c9Hiq2g7Dj4
FTSE 100 Wave Analysis
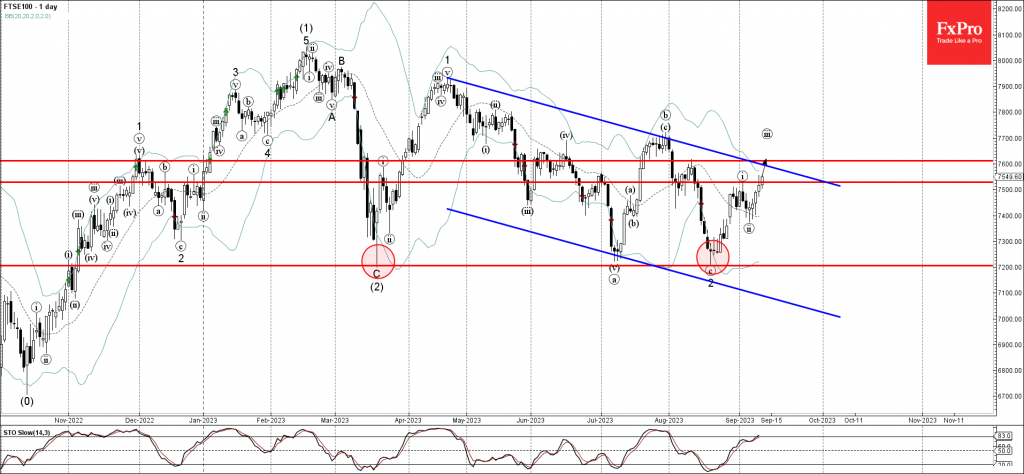
- FTSE 100 reversed from resistance level 7528.00
- Likely to rise to resistance level 7600.00
FTSE 100 index recently broke the resistance level 7528.00 (top of the pervious impulse wave i), intersecting with the resistance trendline of the daily down channel from April.
The breakout of the resistance level 7528.00 accelerated the active short-term impulse wave iii.
FTSE 100 index can be expected to rise further toward the next resistance level 7600.00 (which coincides with the daily down channel from April).
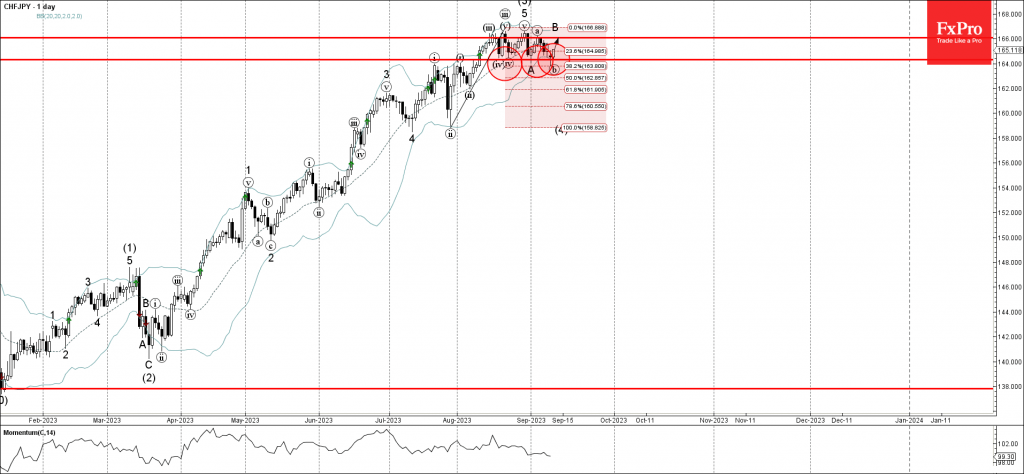
CHFJPY Wave Analysis
- CHFJPY reversed from support level 164.30
- Likely to rise to resistance level 166.00
CHFJPY currency pair recently reversed up from the pivotal support level 164.30 (which has been reversing the pair from the middle of August), intersecting with the lower daily Bollinger Band and the 38.2% Fibonacci correction of the upward impulse from July.
The upward reversal from the support level 164.30 stopped the earlier short-term wave b, which belongs to wave B from the end of August.
Given the clear daily uptrend and the continuation of the yen sales, CHFJPY can be expected to rise further toward the next resistance level 166.00 (which has been reversing the price from the middle of August).