Sample Category Title
Gold (XAUUSD) Is at Area Where It Can Pullback
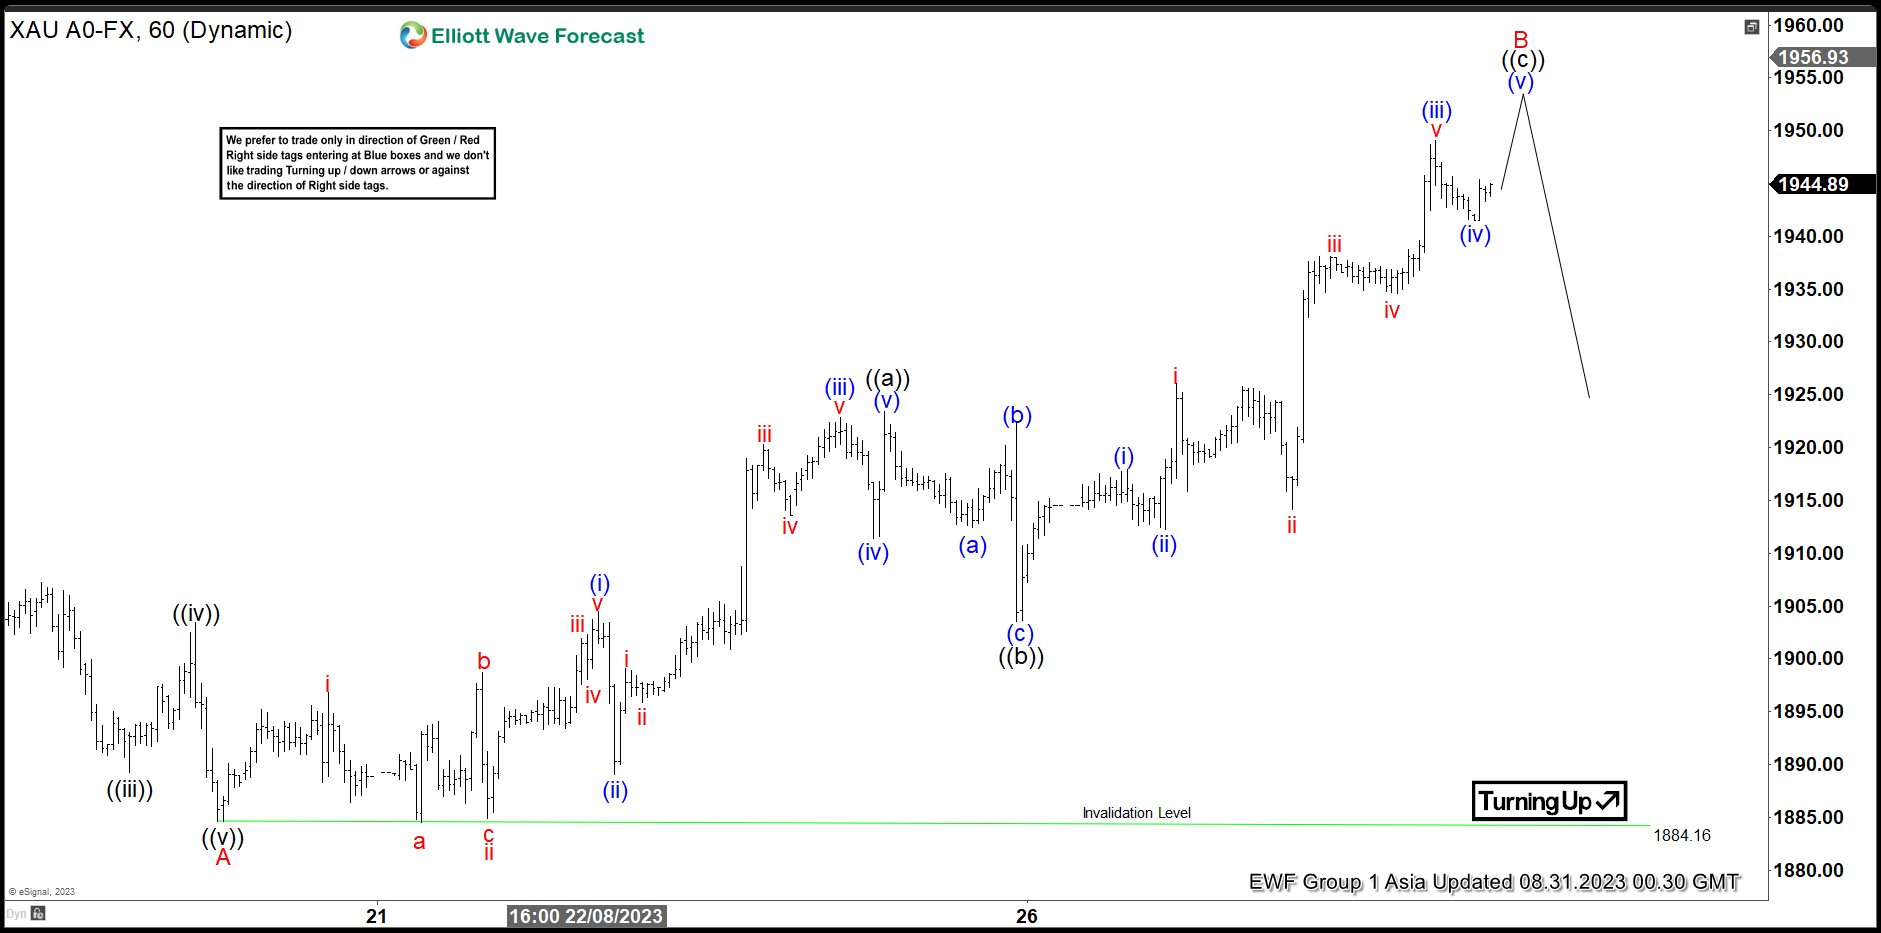
Short Term Elliott Wave structure in Gold (XAUUSD) suggests the drop in Gold on August ended wave A at 1884.16 low. The metal now is extending higher in 3 swings to end a wave B correction. Up from 8.17.2023 low, wave (i) ended at 1904.50 and wave (ii) pullback ended at 1889.02. Rally from wave (ii), wave (iii) ended at 1922.89 and wave (iv) correction ended at 1911.40. Last push to complete wave (v) and the first leg of wave B as wave ((a)) ended at 1923.37. From here, the metal extended lower in 3 swing towards 1903.50 which ended wave ((b)) of B as a zigzag corrective structure. The metal then rallied again in wave ((c)).
Up from 1903.50 low, wave (i) finish at 1914.90 and wave (ii) retracement completed at 1912.20. Then, gold had a nice rally to end wave (iii) at 1949.05 and wave (iv) correction ended at 1941.45 . Currently, XAUUSD is expecting to trade to the upside to break wave (iii) high and end the last leg as wave (v) of ((c)) of B. Once the wave B is completed, we expect a reaction to continue to the downside or see 3 swings lower at least.
Gold 60 Minutes Elliott Wave Chart
Gold Elliott Wave Video
https://www.youtube.com/watch?v=28dq50jx5DA
USDCAD Wave Analysis
- USDCAD reversed from key resistance level 1.3645
- Likely to fall to support level 1.3500
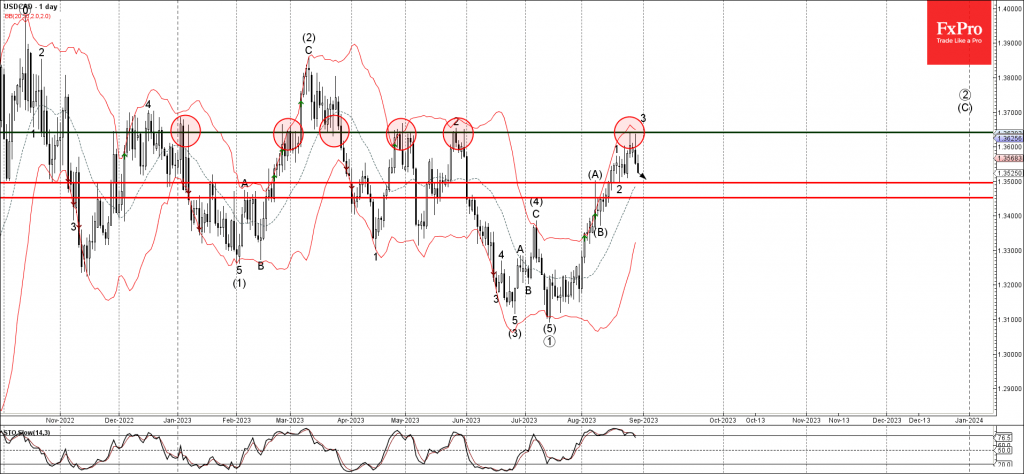
USDCAD currency pair previously reversed down from the key resistance level 1.3645 (which has been repeatedly reversing the pair from January, as can be seen below).
The downward reversal from the resistance level 1.3645 stopped the previous minor impulse wave 3 of the intermediate impulse wave (C) from the start of August.
Given the strength of the resistance level 1.3645, EURUSD currency pair can be expected to fall further toward the next support level 1.3500 (low of the previous correction 2).
EURUSD Wave Analysis
- EURUSD broke daily down channel
- Likely to rise to resistance level 1.1045
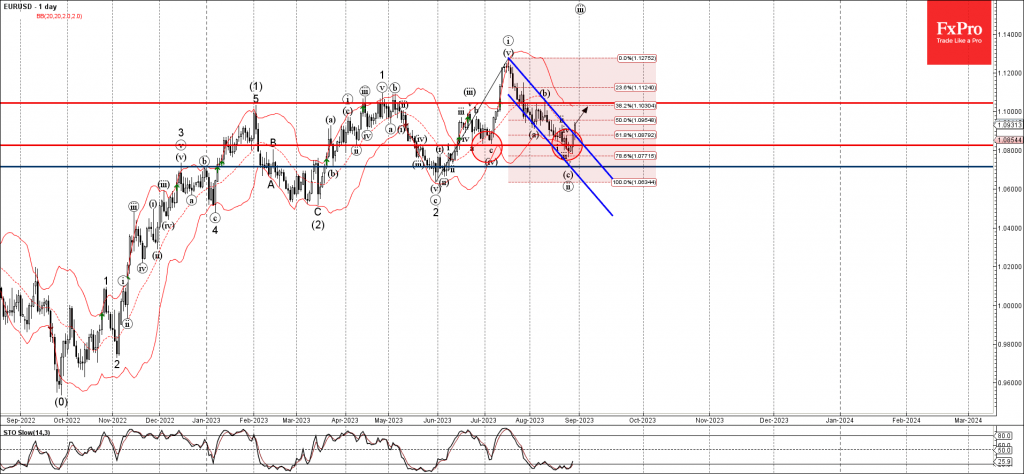
EURUSD currency pair recently broke the resistance trendline of the daily down channel from the middle of July (which enclosed the previous short-term ABC correction ii).
The breakout of this down channel should accelerate the active short-term impulse wave iii of the higher impulse waves 3 and (3).
Given the clear daily uptrend, EURUSD currency pair can be expected to rise further toward the next resistance level 1.1045 (top of the previous correction b).
Sunset Market Commentary
Markets
Sub-par US JOLTS job openings and consumer confidence yesterday triggered a sharp rally in US Treasuries, with markets only discounting a limited chance of a Fed September rate hike. However, the spill-over the EMU markets was modest after all. Today’s first national EMU CPI series at least illustrated that there was good reason for European bond investors to take a more guarded approach. German August HICP inflation slowed less than hoped for to 0.4% M/M and 6.4% (from 6.5%). Spanish HICP inflation reaccelerated after a very low July reading to 0.5% M/M and 2.4% (from -0.1% M/M and 2.1% Y/Y). The release was as expected, but core inflation also slowed less than expected from 6.2% to 6.1%. Inflation in Belgium in August printed in line with July at 0.76% M/M and 4.09 Y/Y. In line with the PMI’s, economic confidence from the European Commission declined further to 93.3 from 94.5, further complicating the ECB’s decision making process. Short-term European yields opened up to 7 bps higher after the first German regional CPI, but momentum ebbed later, especially after the US date releases. German yields currently only maintain limited gains between 1.5. bps (2-y) and 3.0 bps (10-y). Money markets still see an near 50/50 chance for a new 25 bps rate hike at the ECB at the 14 September meeting. In the US, ADP private job growth slowed lightly more than expected to 177k. Last month’s impressive 324k growth was revised even higher to 371k, suggesting a still healthy US job market this summer. US Q2 GDP growth (QoQa) was slightly downwardly revised to 2.1% from 2.4% as was the core PCE deflator (3.7% from 3.8%). While old news, US Treasuries a bit strangely gained traction after the report. In a continuation of yesterday’s steepening the US 2-y yield eases 5 bps. The 30-y trades little changed. Stubbornly high EMU inflation annex the risk of (EMU) interest rates to stay high for even longer than currently expected, probably was one of the reasons for this week’s rebound of EMU equities to run into resistance (Eurostoxx 50 -0.1%). US equities open with limited gains after a three-day rebound (S&P +0.2%).
In FX markets, the euro initially hardly gained on the EMU inflation data. A bit strangely, finally it was the dollar that succumbed after the US Q2 GDP revision. EUR/USD regained the 1.09 big figure (1.092) and is breaking out of the downtrend channel since mid-July. DXY extends its correction (103.1 from 103.53 open). The yen still only profits from the correction especially in US yields trading at USD/JPY 145.65 after touching a YTD top of 147.37 yesterday. In the, UK money supply and lending data were on the softer side of expectations. UK Gilts slightly outperform Bunds. However, for now this is causing no further harm for sterling. EUR/GBP yesterday and this morning tested the 0.861 area, but move stalled (currently 0.859).
News & Views
Belgian inflation rose by 0.76% M/M in August with the annual figure virtually stabilizing at 4.09% Y/Y (from 4.14%). Core inflation stood at 7.7% Y/Y from 7.88% in July. Inflation for services was almost flat at 7.26%. Inflation for rents has increased to 6.14% from 6.07%. Food inflation (including alcoholic beverages) now stands at 12.73%. The most significant price increases in August were registered for motor fuels (6.8% M/M), liquid fuels (12.5% Y/Y), hotel rooms (9.4% M/M), confectionery (6.1% M/M), bread and cereals (1.6% M/M), alcoholic beverages (3.1% M/M), non-alcoholic beverages (2.3% M/M), organized vacations in Belgium (10.9% M/M) and personal care (1.5%M/M). However, electricity (-2.5% M/M), fruit (-4.2% M/M) and plane tickets (-7.1% M/M) have had a decreasing effect on the index.
The Swiss KOF Economic Barometer decreased in August from 92.1 to 91.1 and that way remains at a below-average level. Details showed a general deterioration except for construction and domestic consumption. By contrast, sentiment has particularly worsened in services, followed by export-oriented business and hotels and restaurants. In the producing sector (manufacturing and construction), in particular the indicators on the employment situation developed negatively. The Swiss franc loses out against an overall stronger euro today with EUR/CHF rising to 0.9575 from 0.9550.
How Will China’s Regulation Affect Oil?
China has issued new oil product export quotas to allow oil companies to send surplus barrels overseas, particularly Sinopec, which has the highest volume among quota holders. While the exact quota volume remains undisclosed, oil companies are forecasted to export approximately 3.5 million metric tons of clean oil products in September, a 10% increase from August. This move is seen as a strategy to support industrial activities, boost the country's economy, and sustain crude oil imports. The government controls China's clean oil product exports through quota allocations, focusing on meeting domestic demands. China exported 23.99 million metric tons of gasoline, jet fuel, and gasoil in the first seven months of the year, up 76.1% compared to the same period in 2022.
US Dollar - D1 Timeframe
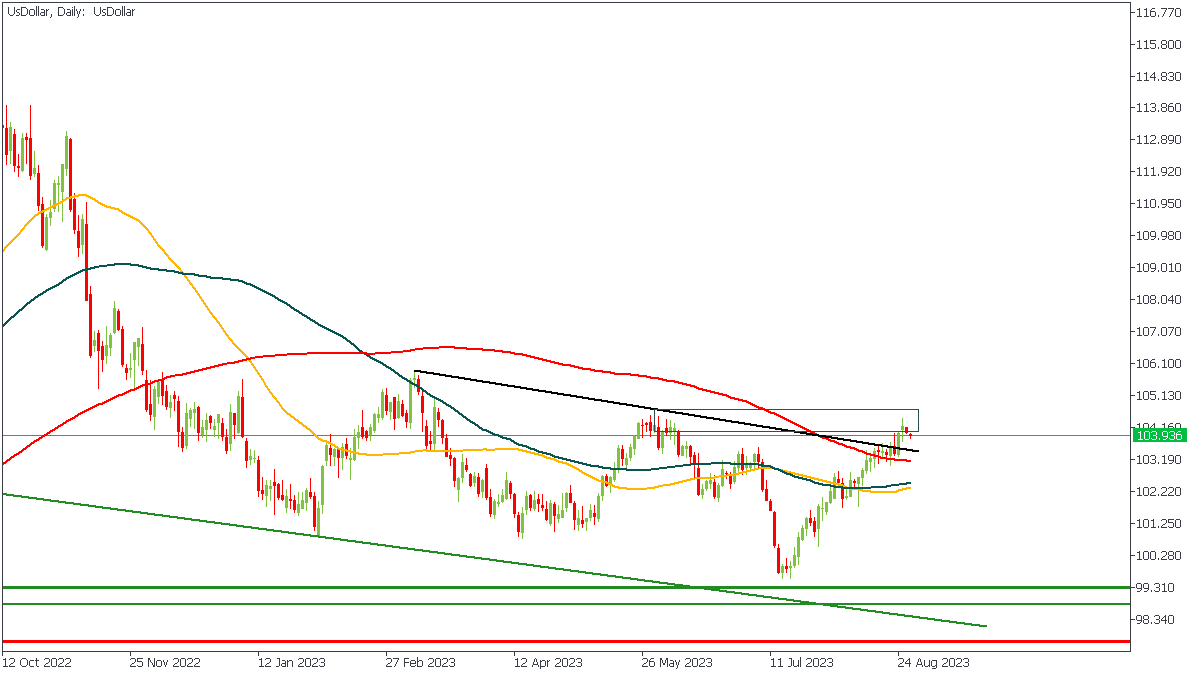
The US Dollar has been prepping for a bearish move for a couple of weeks now, and it seems fully ready to make the move. The resistance trendline, 200-day moving average, and the rally-base-drop supply appear to cause the bearish momentum. In this case, I expect that the bears remain in charge for at least a short while since the price may create a new, lower low.
Analyst’s Expectations:
- Direction: Bearish
- Target: 102.630
- Invalidation: 103.771
XBRUSD - D1 Timeframe
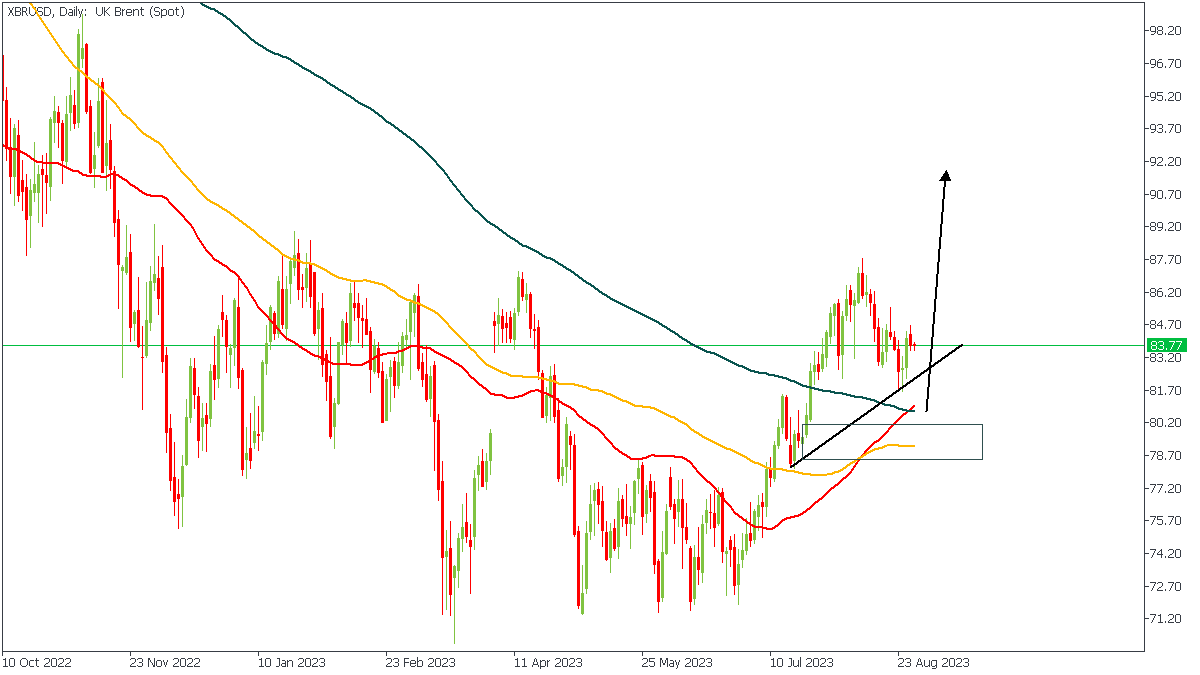
XBRUSD, as seen in the chart above, has made an initial reaction from the trendline support. However, the price may slip lower toward the 200-day Moving average to find a much stronger confluence based on the demand zone, 88% Fibonacci retracement level, and the moving average support.
Analyst’s Expectations:
- Direction: Bullish
- Target: 88.55
- Invalidation: 78.45
XTIUSD - D1 Timeframe
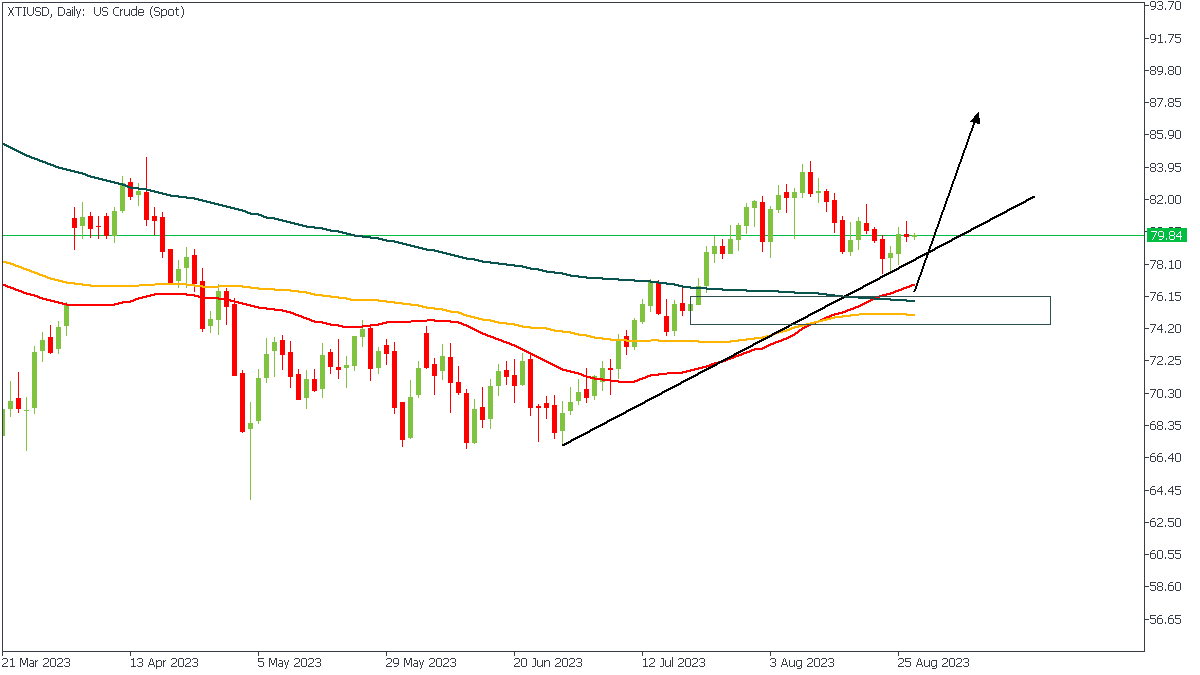
Like XBRUSD, as we saw earlier, the price action on XTIUSD has also made its initial pull away from the trendline support. However, I find it hard to rely on this move because the current market reaction doesn't take place from an actively interesting confluence area. In that sense, I hope to see the price slink into the highlighted demand zone close to the 200-day moving average for my entry consideration.
Analyst’s Expectations:
- Direction: Bullish
- Target: 84.59
- Invalidation: 74.12
CONCLUSION
The trading of CFDs comes at a risk. Thus, to succeed, you have to manage risks properly. To avoid costly mistakes while you look to trade these opportunities, be sure to do your due diligence and manage your risk appropriately.
US: Q2 Real GDP Expanded by a Healthy 2.1%, While GDI Sees Modest Gain
The Bureau of Economic Analysis' second estimate of Q2-2023 real GDP was revised 0.3%-pts lower to 2.1% quarter-over-quarter (q/q, annualized).
Consumer spending advanced by 1.7% – largely unchanged from the previously reported gain of 1.6%. Spending on services was a tick higher at 2.2% but was partially offset by slightly weaker spending on goods (+0.6%).
Non-residential fixed business investment grew by 6.6% (1.5%-pts weaker than the previously reported gain of 7.7%). Structures investment was revised higher (to 11.3% from 9.7%), while both equipment (7.7% from 10.8%) and intellectual property products (2.2% from 3.9%) were softer.
Residential investment declined for the ninth consecutive quarter, falling by 3.6%.
Both imports (-7.0%) and exports (-10.6%) were relatively unchanged from the advance estimate. Overall, net trade's impact on Q2 growth was small, shaving just 0.2%-pts from GDP.
Inventories investment was revised lower and is now estimated to have shaved 0.1%-pts from GDP (previously +0.1%-pts).
Government spending was revised higher to 3.3% (from 2.6%).
Real Gross Domestic Income rose by 0.5% in the second quarter, in contrast to a decline of 1.8% in Q1. Corporate profits were modestly lower, falling by 1.5% (annualized) or $10.6 billion after accounting for inventory valuation and capital consumption adjustments. However, this was more than offset by a solid gain in personal income (+4.2%).
- In terms of the breakdown, corporate profits were lower across the financial sector (-$47.9 billion billion), but modestly higher across the non-financial (+$17.1 billion) sector. The pullback in the former can largely be attributed to the Federal Reserve incurring further losses on its QE bond holdings as interest rates have moved higher.
- Measured as a share of nominal GDP, corporate profits currently sit at 10.5%, or 1.3%-pts below its 2019 average of 11.2%.
Key Implications
Despite the modest downward revisions, the second estimate of Q2 GDP continued to show that economic growth expanded at an above-trend pace last quarter, with all the strength concentrated within domestic demand (i.e., consumption, fixed investment, and government). The acceleration in Q2 business investment is perhaps most notable, reflecting direct and indirect forces related to federal subsidies for green technology, and the delayed post-pandemic recovery trends in the transportation sector (see Quarterly Q&A).
After having contracted in each of the two previous quarters, GDI recorded a modest gain in Q2, helping to narrow what been a historically wide gap between the two measures. The uptick was largely driven by continued gains in personal income, which are helping sustain a healthy pace of consumer spending. That momentum is expected to carry into the third quarter, where GDP growth is currently tracking 3.3%, with consumer spending also looking to advance by over 3%.
USD/JPY Mid-Day Outlook
Daily Pivots: (S1) 145.24; (P) 146.31; (R1) 146.94; More...
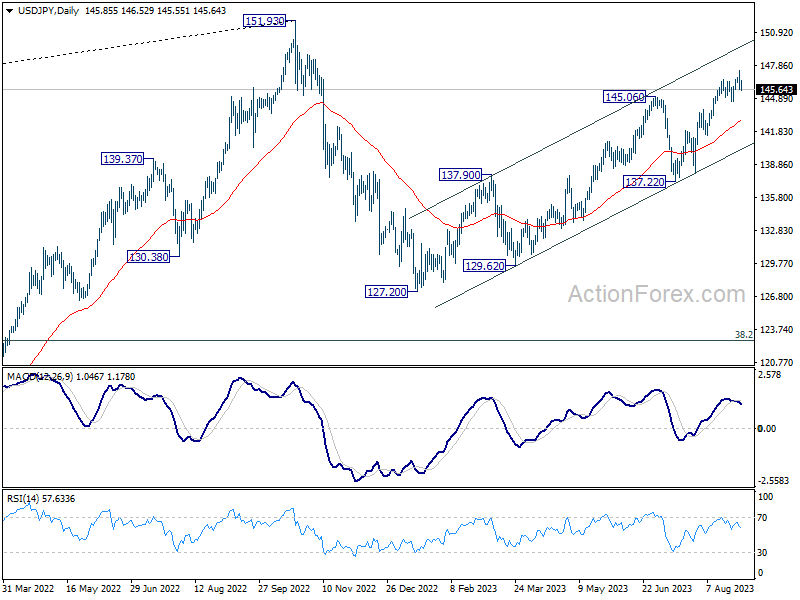
Intraday bias in USD/JPY remains neutral for the moment. Further rally is in favor as long as 144.52 support holds. Above 147.36 will resume the rise from 127.20 to retest 151.93 high. On the downside, however, firm break of 144.52 should confirm short term topping, and turn bias back to the downside for 55 D EMA (now at 142.86).
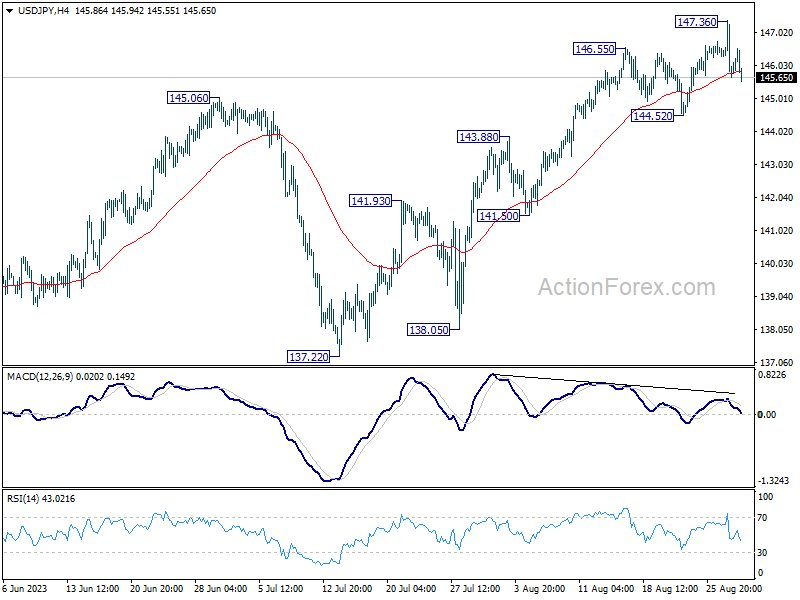
In the bigger picture, overall price actions from 151.93 (2022 high) are views as a corrective pattern. Rise from 127.20 is seen as the second leg of the pattern and could still be in progress. But even in case of extended rise, strong resistance should be seen from 151.93 to limit upside. Meanwhile, break of 137.22 support should confirm the start of the third leg to 127.20 (2023 low) and below.
USD/CHF Mid-Day Outlook
Daily Pivots: (S1) 0.8753; (P) 0.8806; (R1) 0.8837; More....
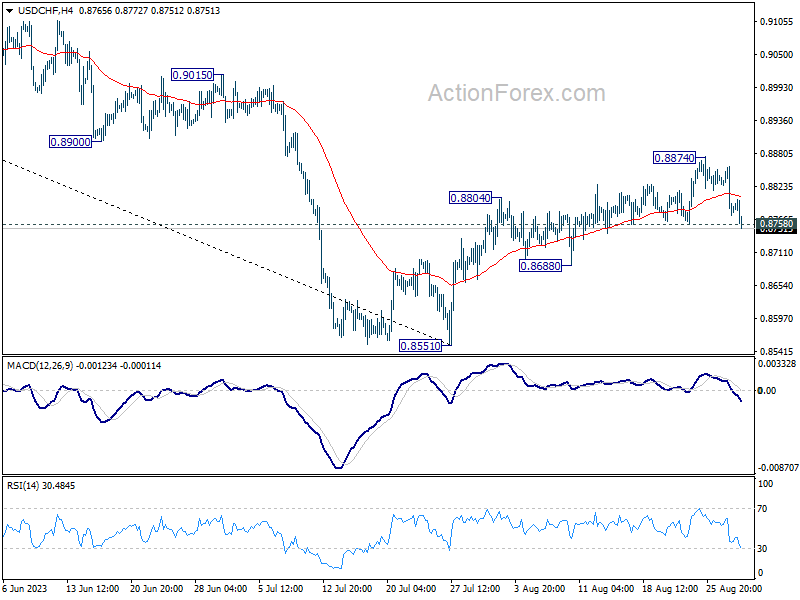
Immediate focus is now on 0.8758 support in USD/CHF with today's fall. Firm break there will argue that corrective rebound from 0.8551 has completed at 0.8874. Intraday bias will be turn back to the downside for 0.8688 support, and then 0.8551 low. Strong rebound from current level will retain near term bullishness though. Break of 0.8874 will resume the rise from 0.8551 to 0.9146 cluster resistance next.
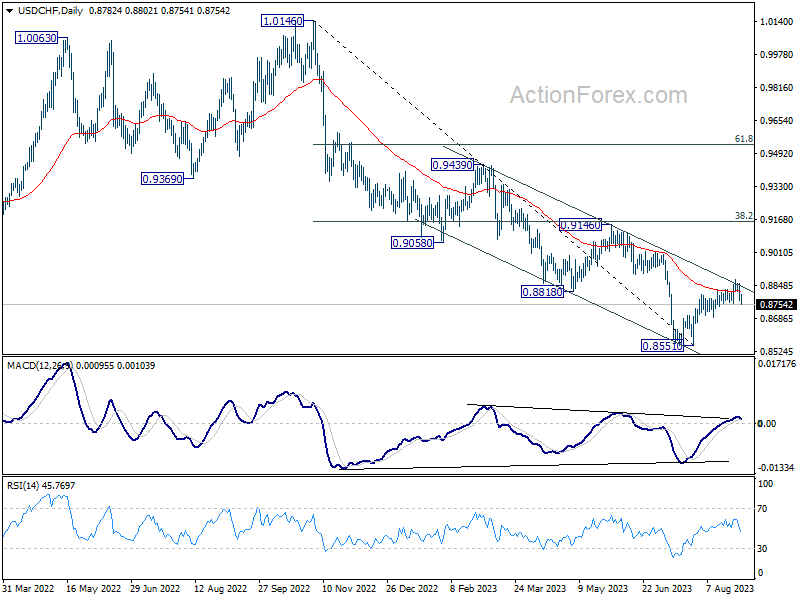
In the bigger picture, rebound from 0.8551 medium term bottom is currently seen as a correction to the downtrend from 1.0146 (2022 high). Further rally would be seen to 0.9146 cluster resistance (38.2% retracement of 1.0146 to 0.8551 at 0.9160). Strong resistance could be seen there to limit upside, at least on first attempt. Nevertheless, medium term outlook is neutral at best as long as 0.8551 holds, until further developments.
GBP/USD Mid-Day Outlook
Daily Pivots: (S1) 1.2586; (P) 1.2621; (R1) 1.2678; More...
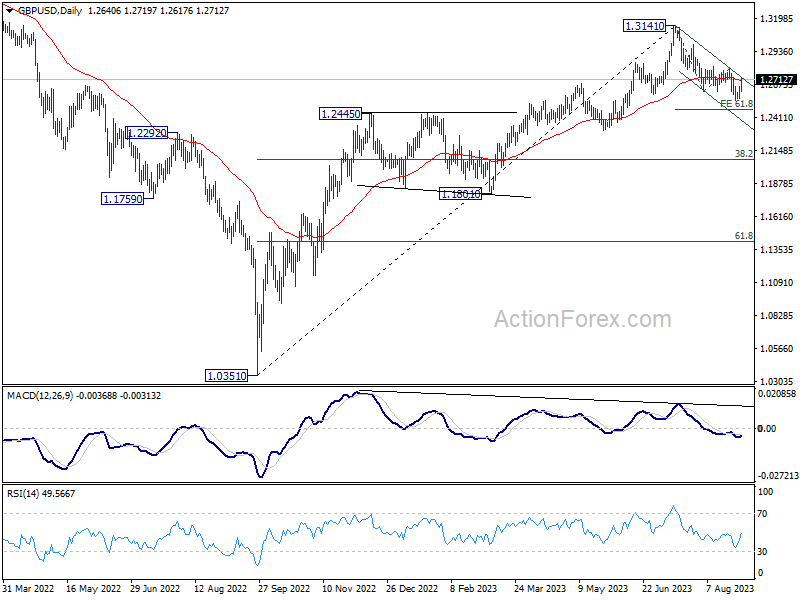
GBP/USD's rebound from 1.2546 extends higher today but it's still capped below 1.2799 resistance. Intraday bias stays neutral first. On the downside, break of 1.2546 will resume whole fall from 1.3141 to 61.8% projection of 1.3141 to 1.2618 from 1.2799 at 1.2476. However, on the upside, firm break of 1.2799 will indicate that the correction from 1.3141 has completed with three waves down to 1.2546. Intraday bias will be turned back to the upside for retesting 1.3141.
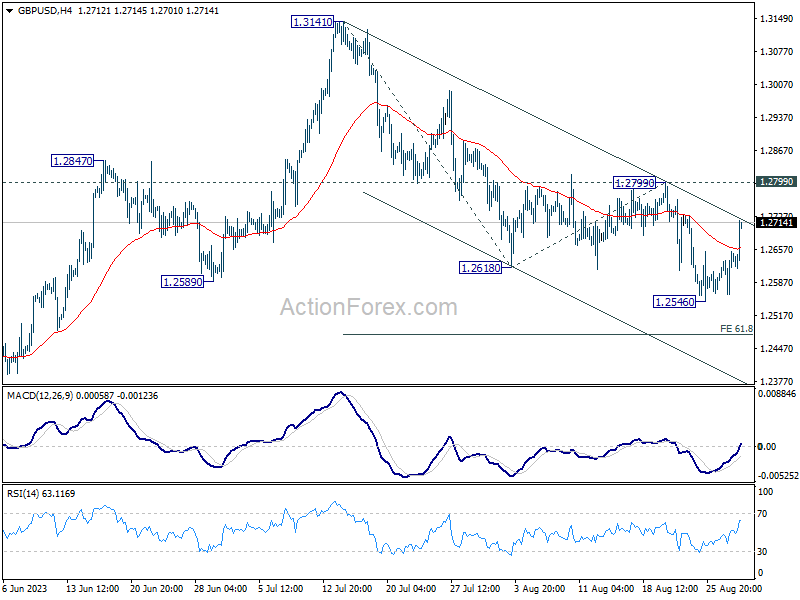
In the bigger picture, for now, fall from 1.3141 medium term top is seen as a correction to up trend from 1.0351 (2022 low). Deeper decline would be seen to 38.2% retracement of 1.0351 to 1.3141 at 1.2075. Strong support would be seen there to bring rebound on first attempt. But outlook will be neutral at best as long as 1.3141 resistance holds, and consolidation from there is set to extend, until further development.