Sample Category Title
WTI Oil Points to August’s High, But Will the Bulls Show Up?
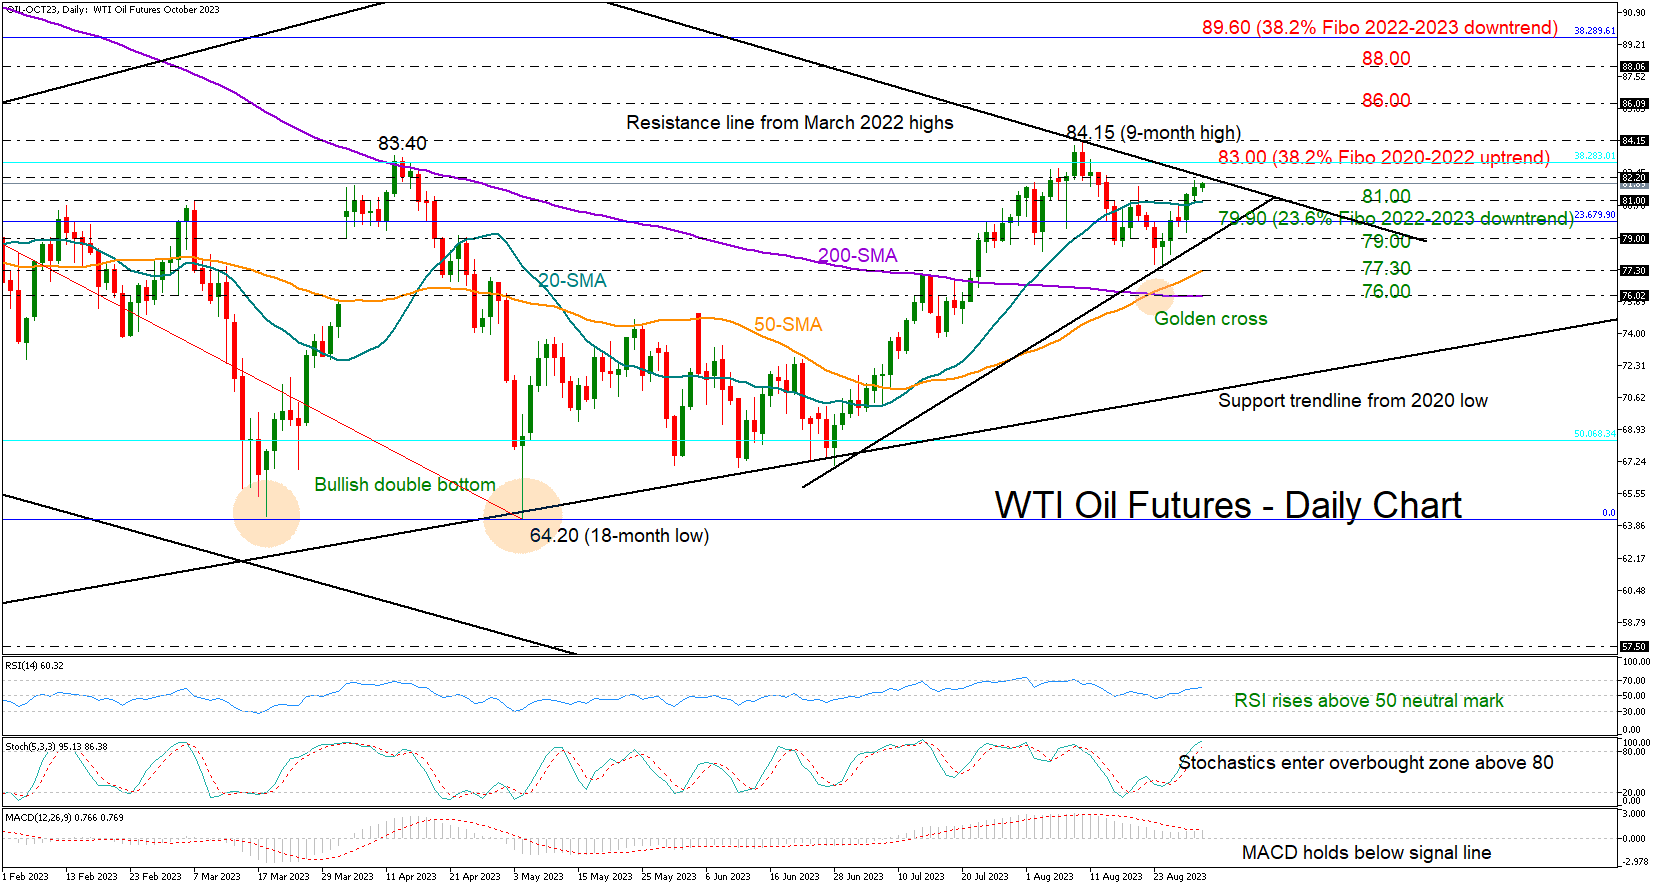
WTI oil futures (October delivery) snapped the 81.00 barricade and crawled moderately back above the 20-day simple moving average (SMA), which has been capping upside movements over the past two weeks.
While the latest bullish action has turned the attention higher to the former constraining zone of 83.00 and August’s high of 84.15, a durable increase cannot be warranted. The RSI has encouragingly distanced itself above its 50 neutral mark, but the stochastic oscillator has already crossed above its 80 overbought level, signaling some persistent fear among investors. Meanwhile, the MACD is still struggling to overcome its red signal line, feeding some caution as well.
Of note, the crucial descending trendline drawn from the March 2022 highs is within breathing distance at 82.20, threatening a downside reversal. On the other hand, the golden cross between the 50- and 200-day SMAs, which is the first in three years, suggests that any negative corrections could be part of the latest bullish phase.
If the price were to re-activate its short-term uptrend above August’s peak of 84.15, immediate resistance could emerge around 86.00. A successful penetration higher might then target the 88.00 barrier, while a more aggressive pickup could retest the 89.60 zone ahead of the key 92.50 ceiling taken from October-November 2022.
Should sellers send the price below its 20-day SMA at 81.00, the 79.90 number might come first into view given the previous limitations within the neighborhood over the past month. The tentative ascending trendline, which connects the lows from June and August, could provide protection as well near 79.00, preventing any declines towards the 50-day SMA at 77.30. A step below the 200-day SMA at 76.00 could be a bigger hassle for the market.
In brief, WTI oil futures seem to be working their way to the top of the previous uptrend, though the technical picture suggests that there might be limited bullish fuel in the tank.
AUDUSD Bounces Back after Hitting 9-month Low
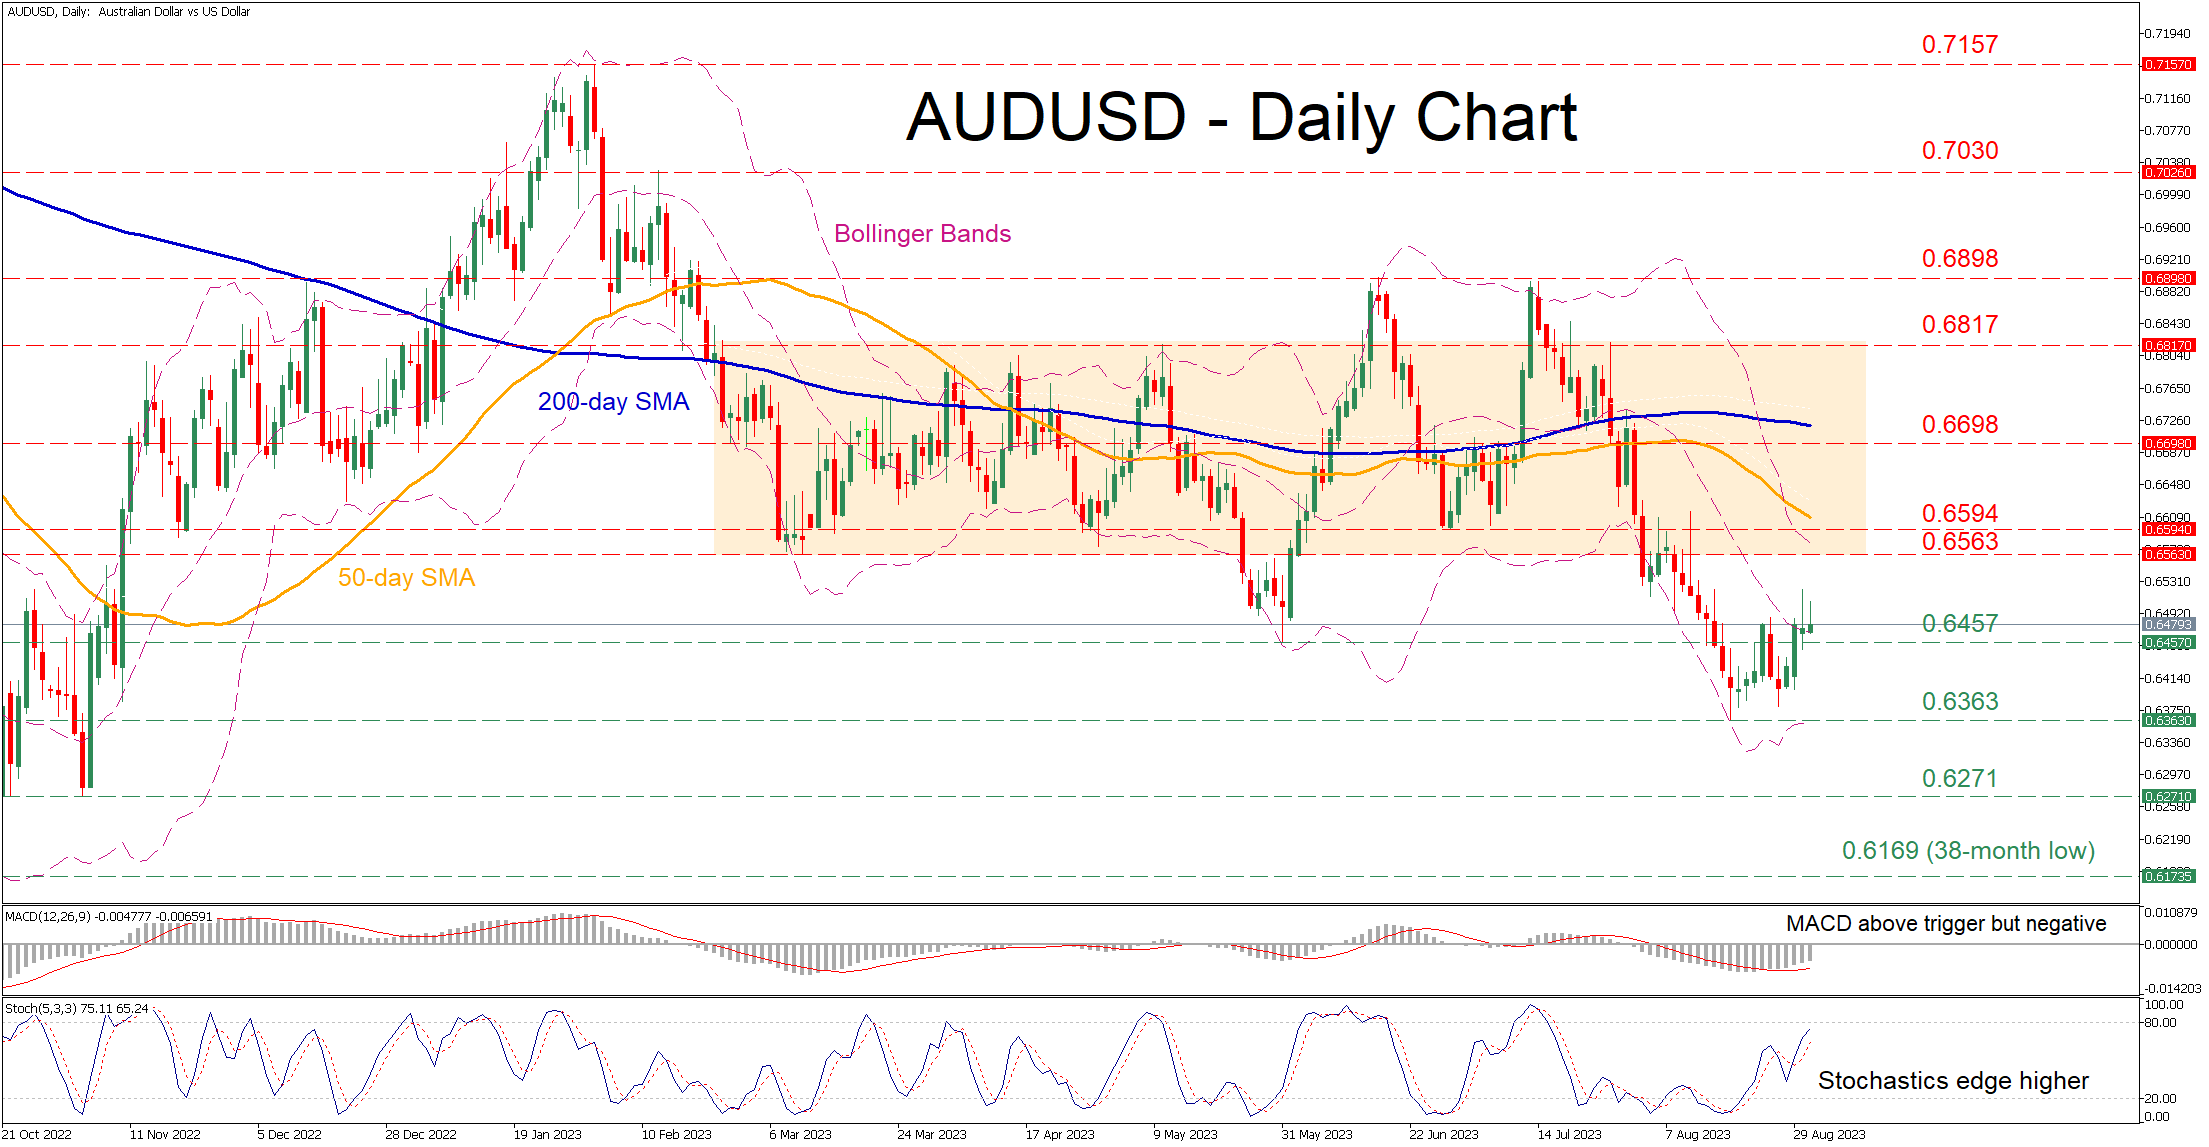
AUDUSD had been in an aggressive decline after its bullish breakout from the rectangle encountered resistance at 0.6898, validating a double top pattern. However, the pair appears to be attempting a recovery since it managed to halt its retreat at the nine-month bottom of 0.6363 in mid August.
The momentum indicators currently suggest that the bearish forces are waning but have not surrendered yet. Specifically, the MACD is strengthening above its red signal line in the negative zone, while the stochastics are ascending sharply.
Should the negative pressures wane, the price could ascend to face a couple of previous support regions such as 0.6563 and 0.6594, which could now serve as resistance zones. Conquering the latter, the bulls may attack the 0.6698 hurdle. Even higher, the May peak of 0.6817 could curb further upside attempts.
Alternatively, bearish actions could send the price to test the May low of 0.6457. A break below that zone could trigger a decline towards the nine-month low of 0.6363. Failing to halt there, the pair might retreat to fresh multi-month lows, where the November 2022 bottom of 0.6271 could provide downside protection.
In brief, AUDUSD appears to have managed to find its footing, but the road to recovery is long. For the bulls to regain confidence, the pair must at least reclaim the 50-day simple moving average (SMA).
Major Market Correlations Between Yields, Stocks and US Dollar
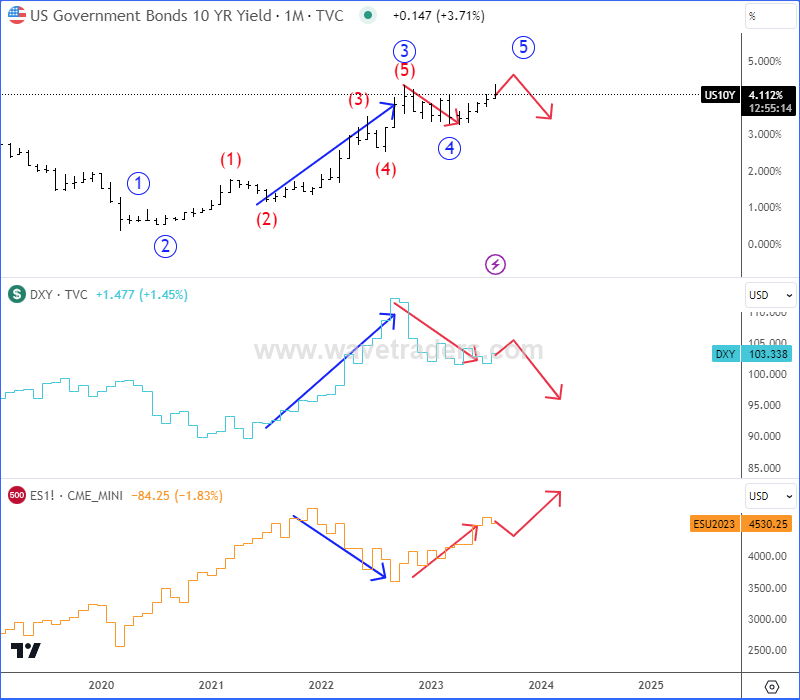
In 2022, the stock market took a hit and the US Dollar gained strength due to higher yields in the US. Toward the end of that year, as yields eased off, the US Dollar lost some of its power, and this coincided with a rebound in stock market performance.
Now, as yields are climbing once again, the US Dollar is regaining strength, but it seems like stocks are beginning to lose their previous momentum. However, the situation might shift if these rising yields are in the process of completing their fifth wave and are on the verge of slowing down. In that case, the US Dollar could actually become weaker again, and the stock market might continue its upward trend. Of course a lot will depend on the FED policy decisions, where dollar can turn down if FED will stop the hiking cycle. Well, a lot will depend on the US data, so market participants will surely watch the NFP very closely tomorrow.
GBP/USD: Bulls Pausing Under Thick Daily Cloud
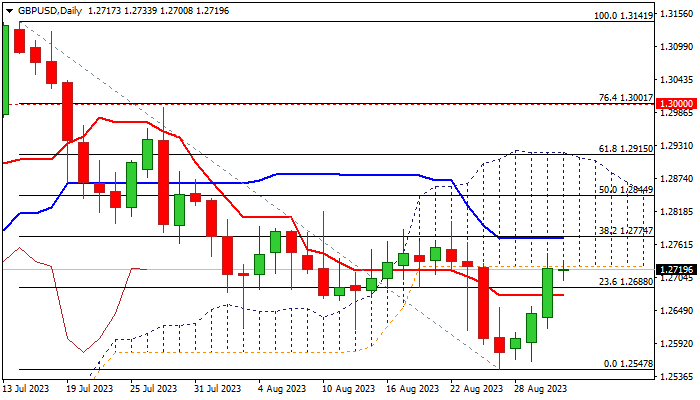
GBPUSD strong recovery of past three days lost traction after testing the base of thick daily Ichimoku cloud (spanned between 1.2724 and 1.2918), as increased headwinds were anticipated at this zone.
Traders also reduced speed ahead of key economic data due today (Eurozone inflation and US core PCE index) which are expected to provide fresh signals and await Friday’s US NFP report for August.
Weaker than expected reading would add to growing speculations that the Fed may consider ending its rate hike cycle as economy slows, which should be supportive for sterling.
Bullishly aligned daily studies continue to underpin near-term action which needs to hold above 1.2680 (10DMA/broken Fibo 23.6% of 1.3141/1.2547) to keep positive bias.
Penetration of daily cloud to generate initial positive signal which will require validation on daily close within the cloud and extension through next pivots at 1.2772/74 (daily Kijun-sen / Fibo 38.2% of 1.3141/1.2547).
Caution on dip and close below 1.2680 which would generate initial signal of recovery stall.
Res: 1.2724; 1.2746; 1.2774; 1.2818.
Sup: 1.2680; 1.2654; 1.2615; 1.2590.
BoE Pill: Current emphasis on sufficiently restrictive policy for sufficiently long
In a speech in South Africa today, BoE Chief Economist Huw Pill underscored the importance of seeing "the job through" to ensure a "lasting and sustainable return of inflation to the 2% target," highlighting the critical balance the bank must strike as it's now in the territory of restrictive policy.
Pill acknowledged the perils of "doing too much," and "inflicting unnecessary damage on employment and growth".
Nevertheless, the present emphasis, he noted, is on maintaining "sufficiently restrictive" policy for "sufficiently long" to assure a sustainable return to the inflation target, echoing the language used in the MPC's last statement.
GBP/JPY Daily Outlook
Daily Pivots: (S1) 184.88; (P) 185.47; (R1) 186.66; More...
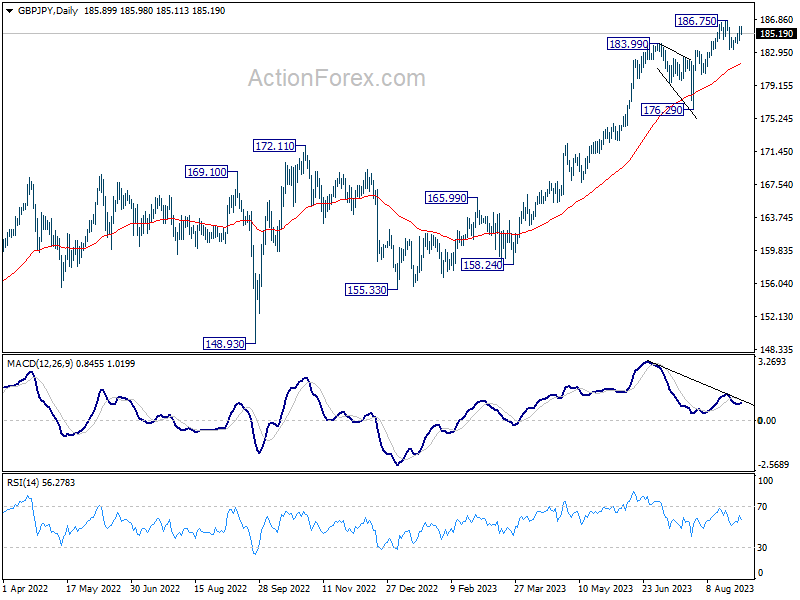
Intraday bias in GBP/JPY stays neutral as range trading continues. Price actions from 186.75 are viewed as a corrective pattern. Another fall could still be seen and break of 183.35 will turn bias to the downside for 55 D EMA (now at 181.57). Nevertheless, firm break of 186.75 will resume larger up trend.
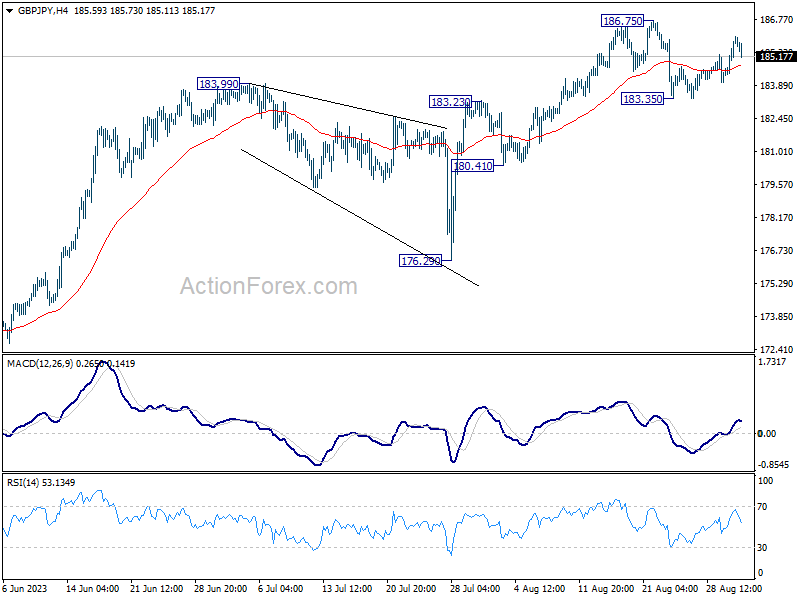
In the bigger picture, up trend from 123.94 (2020 low) is in progress. Next target is 195.86 (2015 high). This will remain the favored case as long as 176.29 support holds, even in case of deeper pull back.
EUR/JPY Daily Outlook
Daily Pivots: (S1) 158.95; (P) 159.36; (R1) 160.17; More....
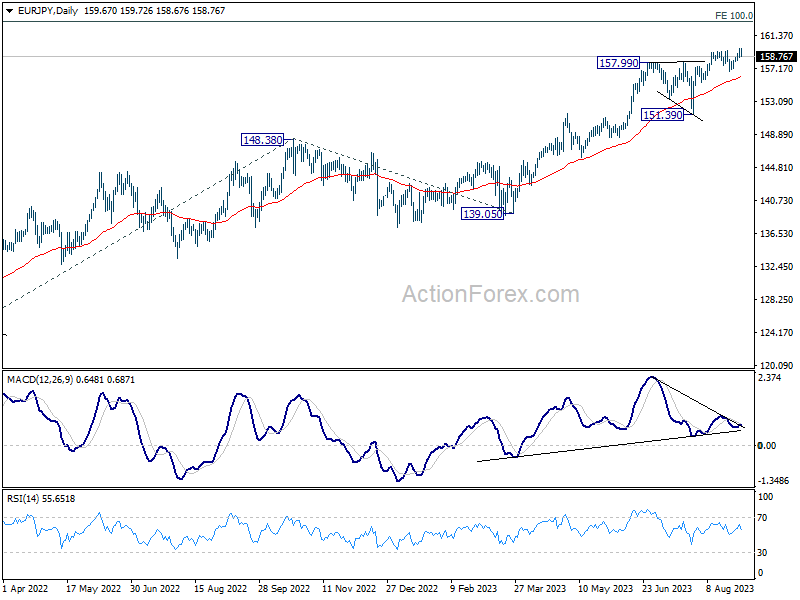
EUR/JPY's breach of 159.47 argues that larger up trend is resuming. But intraday bias is turned neutral again with the retreat from 159.75. For now, further rally is in favor as long as 156.85 support holds. Above 159.75 will extend the rise from 163.06 projection level. Nevertheless, break of 156.85 will turn bias back to the downside for 55 D EMA (now at 156.20) and possibly below.
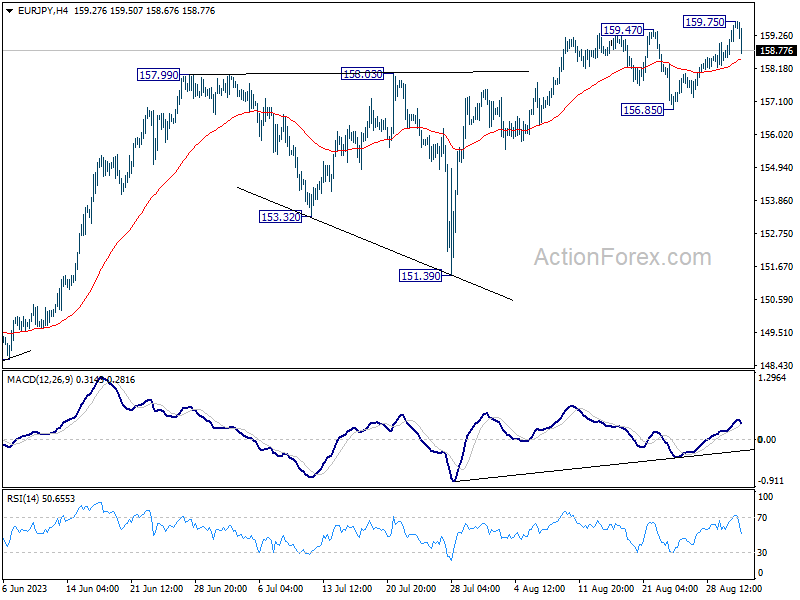
In the bigger picture, rise from 114.42 (2020 low) is in progress. Next target is 100% projection of 124.37 to 148.38 from 139.05 at 163.06. Sustained break there will pave the way to retest long term resistance at 169.96. This will remain the favored case as long as 151.39 support holds, even in case of deep pull back.
EUR/GBP Daily Outlook
Daily Pivots: (S1) 0.8578; (P) 0.8594; (R1) 0.8603; More...
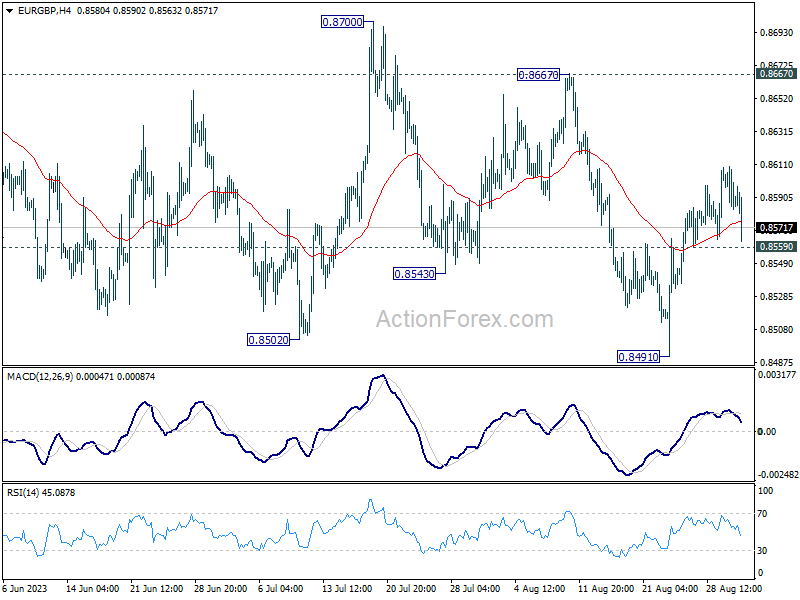
Intraday bias in EUR/GBP is turned neutral again with current retreat. Overall, while further rally could be seen, near term outlook will stay bearish with 0.8667 resistance intact. On the downside, below 0.8559 minors support will turn bias to the downside for retesting 0.8491 low first. Firm break there will resume larger down trend.
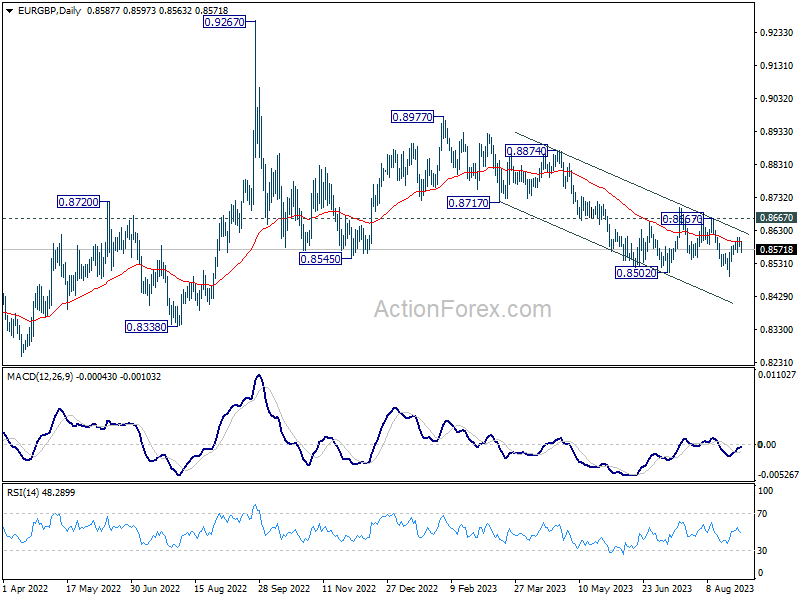
In the bigger picture, the down trend from 0.9267 (2022 high) is seen as part of the long term range pattern from 0.9499 (2020 high). Further decline is in favor as long as 0.8667 resistance holds. Break of 0.8502 will resume the fall towards 0.8201 (2022 low).
EUR/AUD Daily Outlook
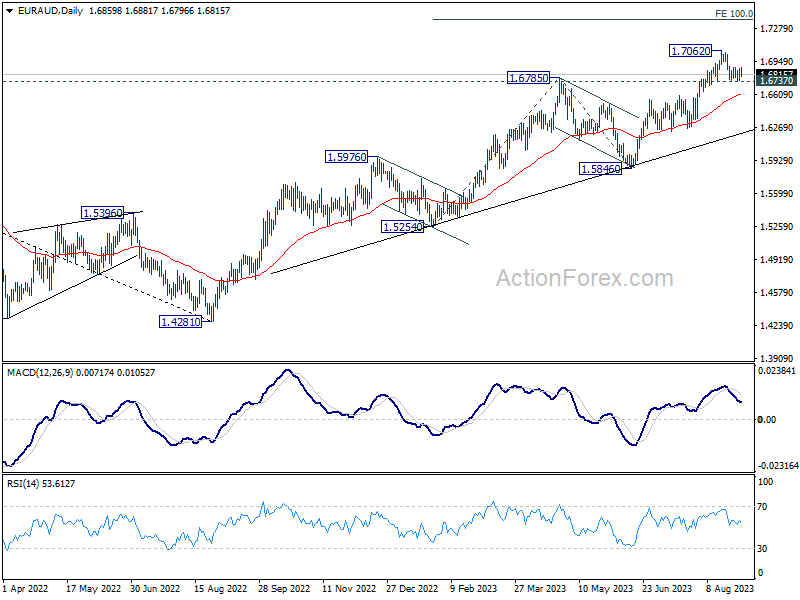
Daily Pivots: (S1) 1.6794; (P) 1.6834; (R1) 1.6909; More...
Intraday bias in EUR/AUD remains neutral for the moment. Further rise is mildly in favor as long as 1.6737 support holds. On the upside, break of 1.7062 resistance will resume larger up trend to 1.7377 projection level next. However, firm break of 1.6737 will bring deeper pull back to 1.6601 resistance turned support instead.
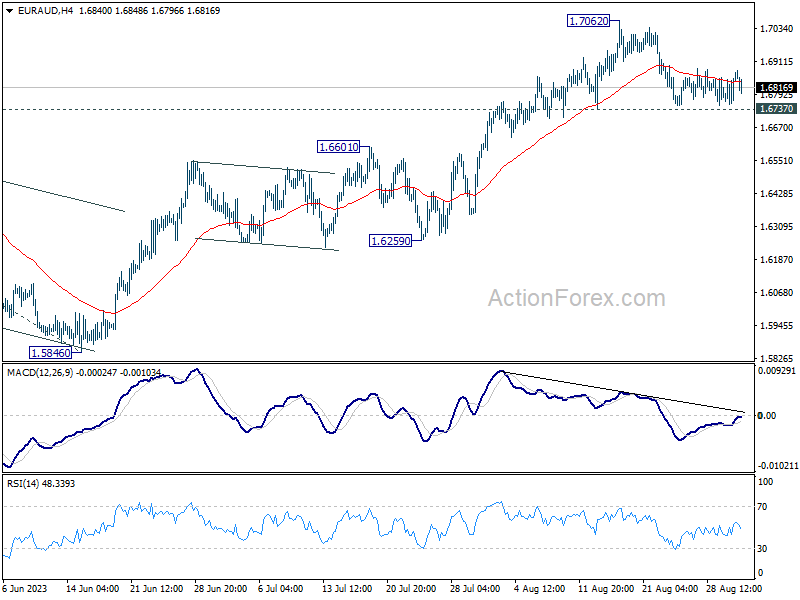
In the bigger picture, the rise from 1.4281 (2022 low) is in progress. Next target is 100% projection of 1.5254 to 1.6785 from 1.5846 at 1.7377. For now, outlook will stay bullish as long as 1.5846 support holds, even in case of another pull back.
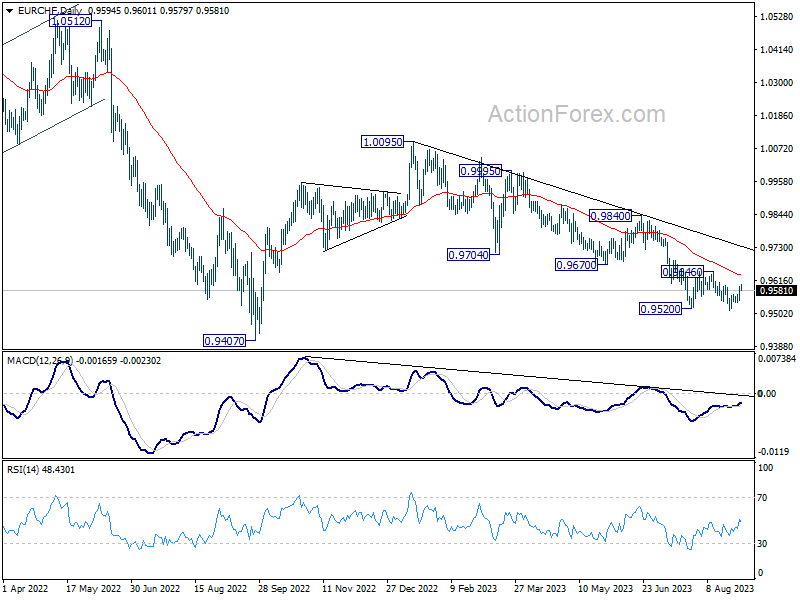
EUR/CHF Daily Outlook
Daily Pivots: (S1) 0.9562; (P) 0.9580; (R1) 0.9614; More...
EUR/CHF failed to sustain above 0.9599 resistance after breaching it briefly. Intraday bias remains neutral first. On the downside, firm break of 0.9513 will resume larger down trend from 1.0095, towards 0.9407 low. Nevertheless, firm break of 0.9599 will bring stronger rise to 0.9646 resistance next.
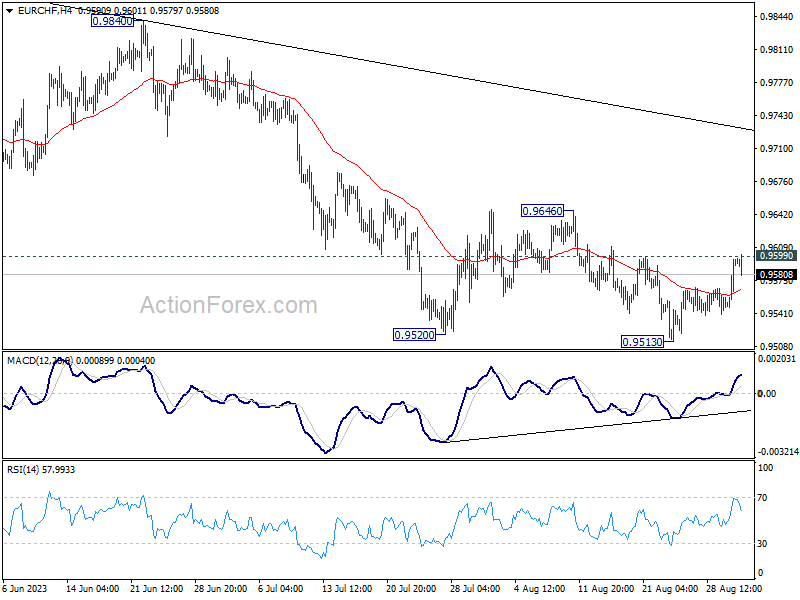
In the bigger picture, medium term outlook is staying bearish as the pair is capped well below falling 55 W EMA (now at 0.9829). Down trend from 1.2004 (2018 high) is in favor to continue. Sustained break of 0.9407 will target 61.8% projection of 1.1149 to 0.9407 from 1.0095 at 0.9018. For now, this will remain the favored case as long as 0.9670 support turned resistance holds, in case of strong rebound.