

Sample Category Title
Wishful Thinking?
America had another ‘bad news is good news’ moment yesterday; softer-than-expected ADP and growth data further fueled expectations that the Federal Reserve (Fed) is – maybe – good for a pause. The ADP report, released yesterday, showed that the US economy added 177K new private jobs in August, lower than expected and more than half the number printed a month earlier, while the US GDP was revised from 2% to 2.1% instead of 2.4%, due to lower business investment than initially reported and to downside revisions in inventory and nonresidential fixed investment. Household spending, however, continued leading the US economy higher; it was revised up to 1.7%. All in all, the data was certainly weaker than expected but the numbers remain strong, in absolute terms.
The S&P500 gained for the 4th consecutive session yesterday, the index is now above the 4500 level and has around 85 points to go before recovering to July highs. The US 2-year yield settles below the 5% level on expectation that the Fed has no reason to push hard to hike rates; it could just wait and see the impact of its latest (and aggressive) tightening campaign.
In the FX, the softening Fed expectations are weighing on the US dollar. The dollar index fell to its 200-DMA and could sink back to its March to August descending channel. But the seasonality is on the dollar’s side in September. Empirical data shows that the US dollar performed better than its peers for six Septembers in a row since 2017, and it gained 1.2% on average, thanks to increased quarter-end dollar buying, and an increased safe haven flows before October – which is seasonally a bad month for stocks, according to Bloomberg.
But the dollar’s relative performance is also much influenced by the growth and price dynamics elsewhere. Looking at the latest Euro-area CPI numbers, the picture in Europe is much less dovish despite morose business and consumer sentiment in Europe and weak PMI numbers printed recently. Despite the dark clouds on the European skies, the latest inflation numbers showed that inflation in both Spain and Germany ticked higher in August for the second month – a U-turn that could be explained by the re-surge in oil prices since the end of June. This morning, the aggregate CPI number may not confirm a fall to 5.1% in headline inflation. And a stronger-than-expected CPI print will likely boost the ECB hawks and get the euro bulls to test the 50-DMA, near 1.0970, to the upside.
Later today, investors will focus on the US core PCE data, which has a heavier weight on the international platform. Therefore, the strength of the US core PCE will say the last word before tomorrow’s jobs data. Analysts expect a steady 0.2% advance on a monthly basis, and a slight advance from 4.1% to 4.2% on a yearly basis. A bad surprise on the topside could eventually wash out the past days’ optimism regarding the future of the Fed policy. So, fingers crossed, we really need the US inflation to fall, and to stay low.
But looking at energy prices, a sustainable fall in headline inflation could be wishful thinking for the upcoming months. US crude remains upbeat near the $82pb, as the latest EIA data showed that crude inventories fall more than 10mio barrel last week, as separate data showed that crude stored on ships at sea fell to the lowest levels in a year - a clear indication that OPEC’s supply cuts are taking effect. Plus, Russia is discussing with OPEC to extend oil-export cuts and Saudi is expected to prolong its supply cuts.
Eurozone Inflation Taking Centre Stage ahead of ECB September Meeting
Market movers today
The key release today will be Euro inflation for August. Releases for Germany and Spain yesterday were slightly higher than expected and leaves some upside risks to the number.
Euro unemployment is also due and so far it has continued to keep declining despite softer growth. The question is if this will change now with the service sector showing clear signs of slowing.
Later today we get US initial jobless claims and core PCE deflator for August. The latter is expected to rise 0.2% m/m again, the same as last month. It is clearly lower than seen earlier this year where monthly changes were 0.3-0.4% m/m. In addition to the PCE-release we also get data for US private consumption and personal income. Private consumption has been the main driver of the economic rebound over the summer. The consensus expects very strong growth in real spending of about 0.5% MoM in July.
Overnight we get the private version of China PMI manufacturing from Caixin for August.
The 60 second overview
China PMIs and markets. This morning official August PMIs out of China were a mixed bag. They showed a smaller than expected contraction in manufacturing (rise from 49.3 to 49.7) but also a smaller than expected expansion in services (drop from 51.5 to 51.0). Given the huge importance of China for the global economy - not least in terms of the industrial cycle and global inflation impulses - Chinese news will remain key to follow in the weeks to come amid a faltering recovery. However, this morning's releases failed to trigger much of a market reaction with Asian indices and global equity futures trading close-to-unchanged territory.
Eurozone inflation. The preliminary inflation figures for Germany and Spain were the main story in markets yesterday. The headline inflation in both Spain and Germany came in higher than expected, and the monthly dynamics in the core measure is still well above 2% on an annualized basis. We also expect this to be the case for the euro area HICP data at 11:00 (CET) today which we expect could add support to the case of a final 25bp rate hike from the ECB in September.
US ADP. In the US, the ADP employment change in August surprised a bit to the downside at 177k (consensus: 195k). As the ADP put it, we are now back to the pace of job creation before the pandemic after two years of exceptional gains. That said, we are still wary that the ADP report has not been a reliable leading indicator for the non-farm payrolls figures which we will get tomorrow.
Equities: Equities were a notch higher in a fairly quiet Wednesday session, driven by US while Europe closed slightly lower. However, cyclicals were in favour in both regions, with sectors such as Technology, Industrials or Consumer Discretionary leading. Also note the strong performance for Nordic pulp lately, with Stora Enso -2% yesterday and +8% the last month. S&P500 closed up 0.4%, Stoxx 600 -0.2% and Nordics -0.7%. Small but mixed moves in Asia while US futures are higher. Chinese manufacturing PMIs rose slightly to 49.7 (from 49.3) but not enough to rock the boat.
Credit: Another very busy day in the primary credit market with a string of high-profile deals. This left secondary activity muted. ITraxx Main was 1bp tighter at 69bp while iTraxx Xover was 3bp tighter at 392bp.
FI: European yields rose yesterday as national CPI prints for August came in stronger than expected. The 10-year German yield was up 8bp following the first German regional inflation prints in the morning, but the move was partly reversed in the afternoon. The implied probability of a 25bp hike at the next ECB meeting in September was unchanged at around 50% at the end of the day. In the US markets, the weak ADP data provided renewed support to the bond market. The 10-year US Treasury yield is now trading close to 4.1% and has declined by close to 25bp since last week.
FX: The last sessions have been characterised by USD weakening on markets scaling back Fed monetary tightening prospects while the Scandies and the CEE cluster in HUF, PLN and CZK have all been among the outperformers amid a "bad news is good news" narrative in markets.
Technical Outlook and Review
DXY:
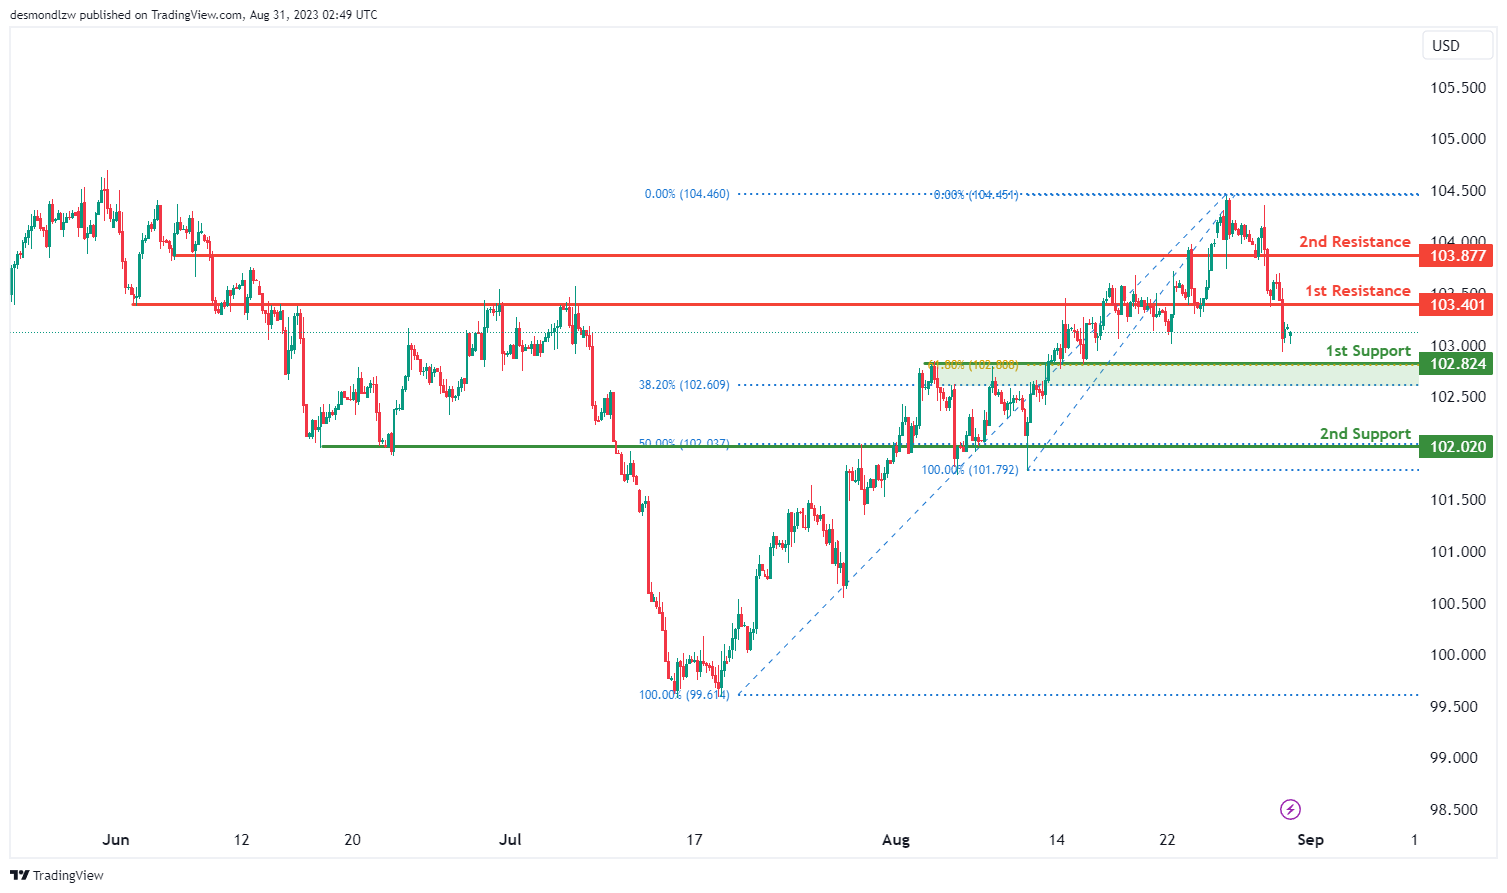
The current state of the DXY chart indicates a bullish momentum overall. There is a potential scenario where the price could experience a bullish rebound from the 1st support level and subsequently move towards the 1st resistance level. The 1st support level at 102.82 holds significance due to being an overlap support, further reinforced by the presence of Fibonacci confluence involving the 38.20% and 61.80% Fibonacci Retracement levels. Similarly, the 2nd support level at 102.02 is also an overlap support, marked at the 50% Fibonacci level.
On the upside, the 1st resistance at 103.40 is categorized as a pullback resistance, while the 2nd resistance at 103.87 is another pullback resistance. These levels suggest potential areas where the price might encounter resistance during upward movement.
EUR/USD:
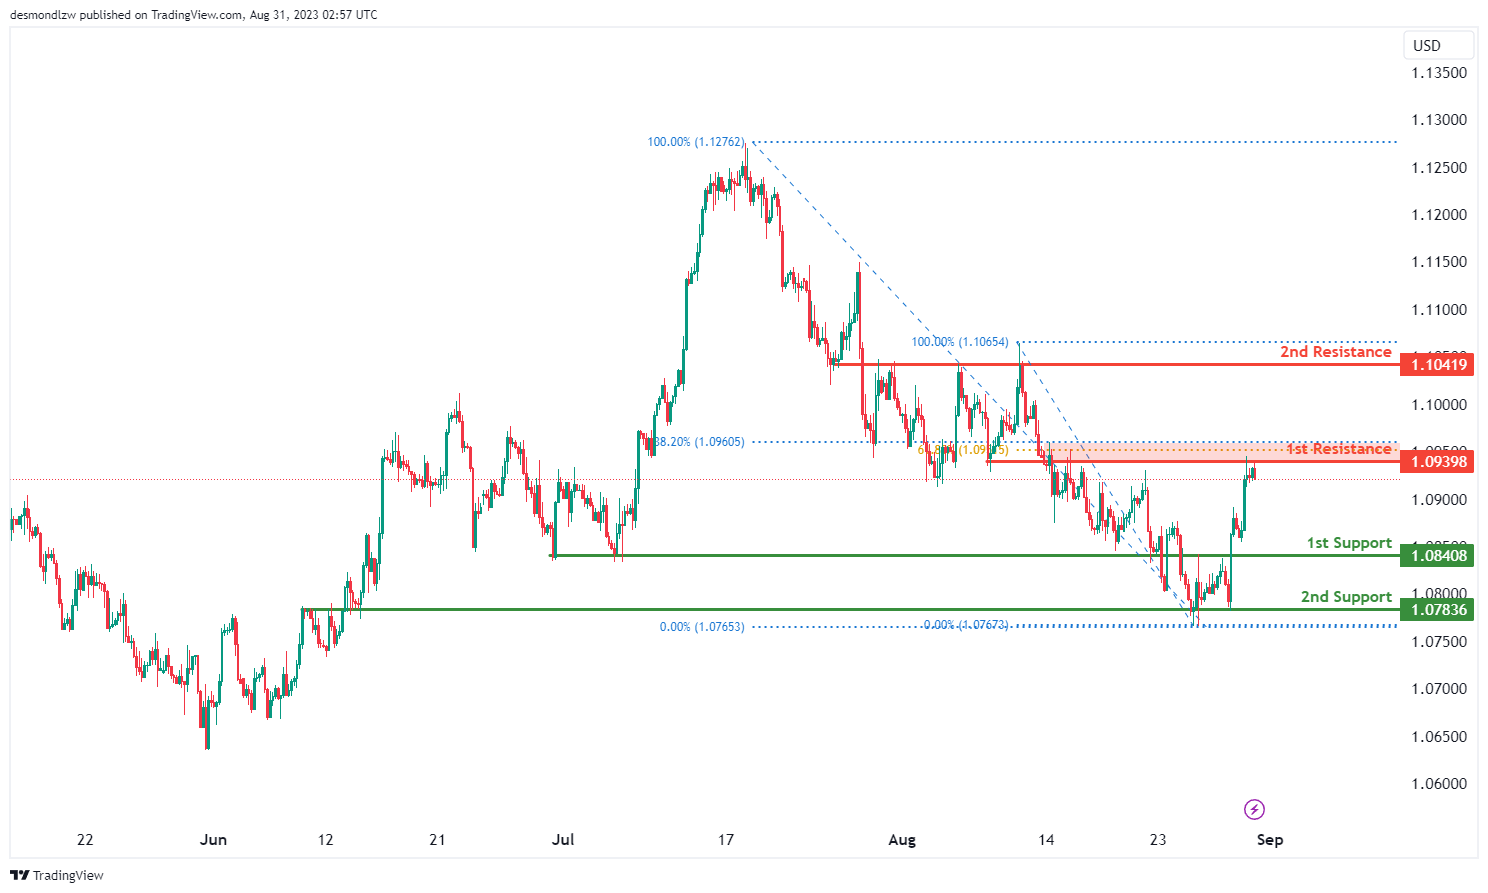
The EUR/USD chart currently exhibits a bearish momentum, suggesting a likely downward movement. One potential scenario to consider is a bearish response coming from the 1st resistance level, leading to a possible drop towards the 1st support level. The 1st support at 1.0840 is notable for providing support during pullbacks, while the 2nd support at 1.0783 is historically a point of support.
Conversely, on the upside, the 1st resistance at 1.0939 acts as a barrier to upward movement and holds added significance due to the presence of both the 61.80% and 38.20% Fibonacci Retracement levels. Similarly, the 2nd resistance at 1.1041 is also a point where price has faced resistance before. These resistance and support levels are key markers to watch for potential price reactions during its course.
EUR/JPY:
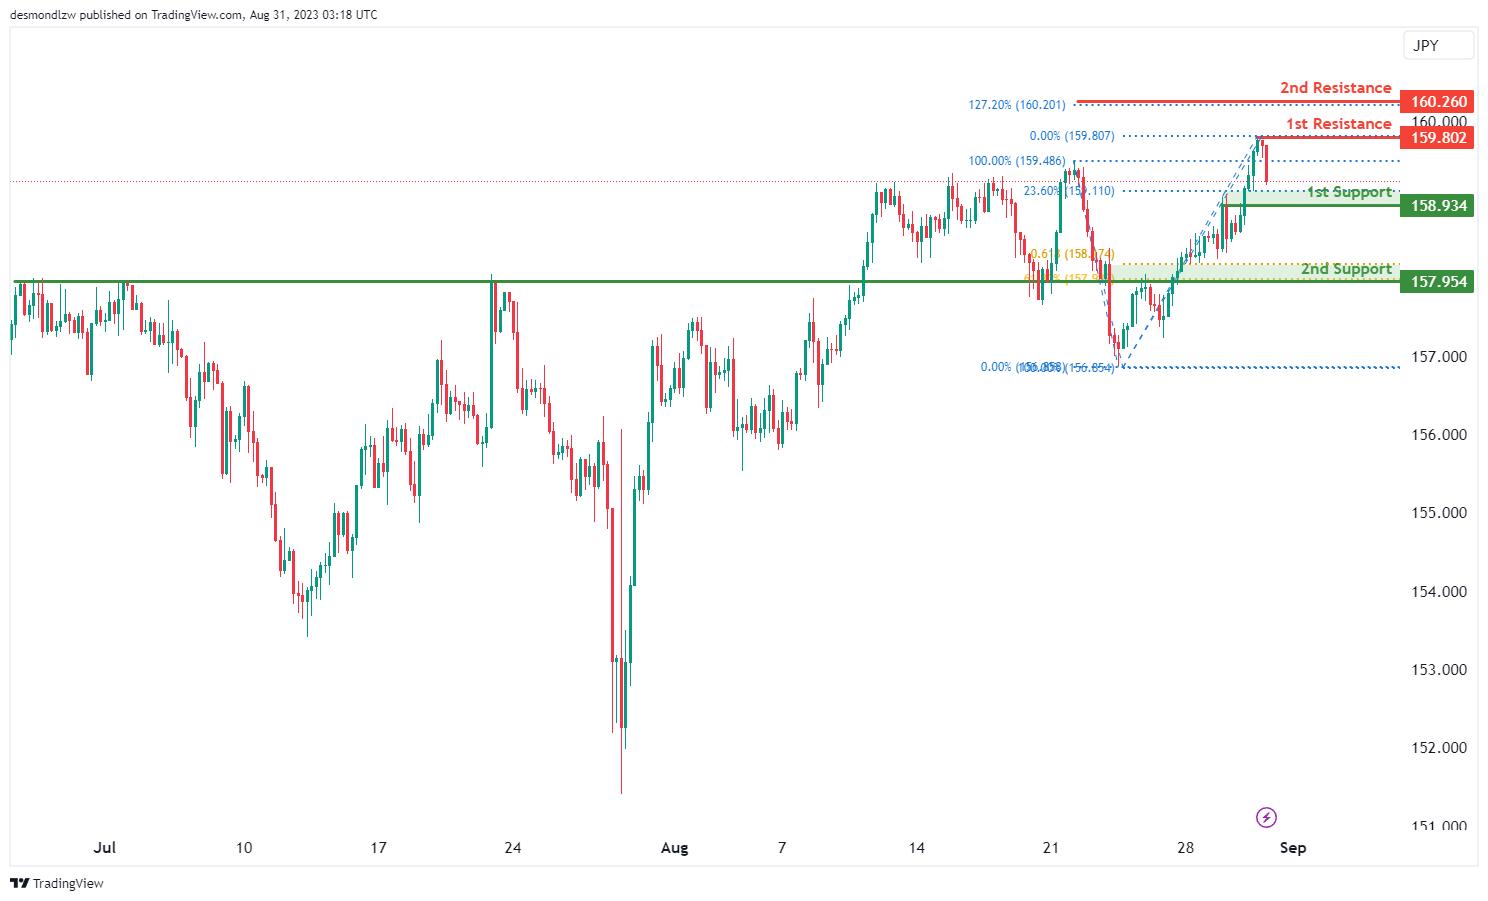
For EUR/JPY, the chart suggests a bullish overall momentum.
The 1st support level at 158.93 is a pullback support and aligns with the 23.60% Fibonacci retracement. This level might attract buying interest as it aligns with a key Fibonacci level.
The 2nd support level at 157.95 is a pullback support and aligns with both the 61.80% Fibonacci retracement and the 61.80% Fibonacci projection. This indicates a potential strong support zone.
The 1st resistance level at 159.80 is a swing high resistance. This level might act as a barrier to further upside movement.
The 2nd resistance level at 160.26 is a 127.20% Fibonacci extension. This level could also potentially act as a resistance point.
EUR/GBP:
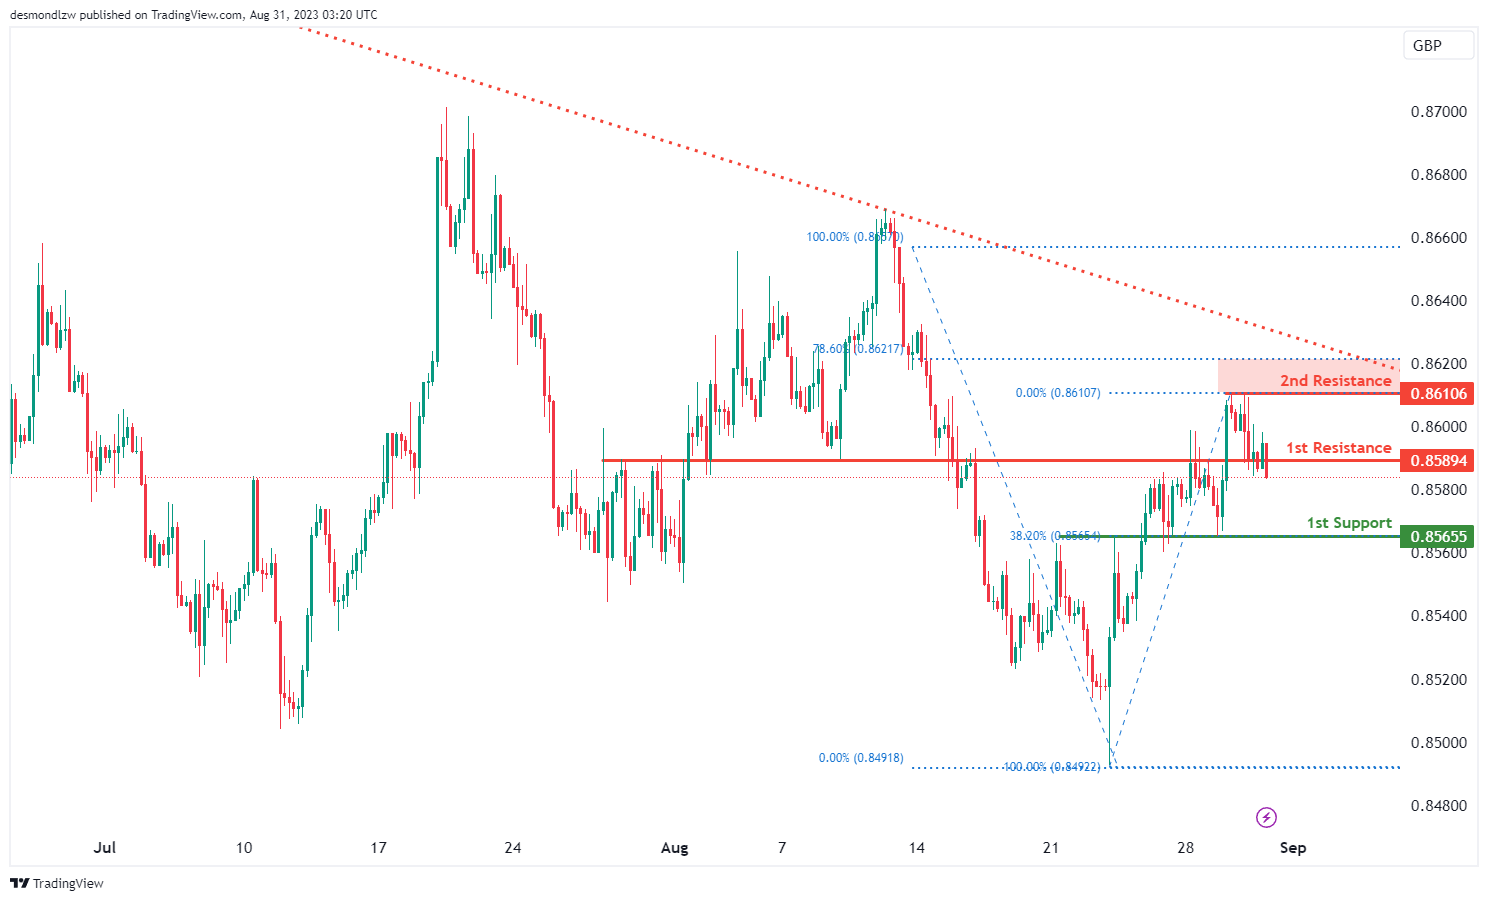
For EUR/GBP, the chart indicates a bearish overall momentum, and there are factors contributing to this bearishness, including being below a major descending trend line.
The 1st support level at 0.8565 is an overlap support and coincides with the 38.20% Fibonacci retracement. This level might provide some potential support for the price, but if the bearish momentum continues, it could be breached.
The 1st resistance level at 0.8589 is a pullback resistance. This level could act as a barrier to any potential upside movements.
The 2nd resistance level at 0.8610 is a swing high resistance and aligns with the 78.60% Fibonacci retracement. This level might serve as a more significant resistance point.
GBP/USD:
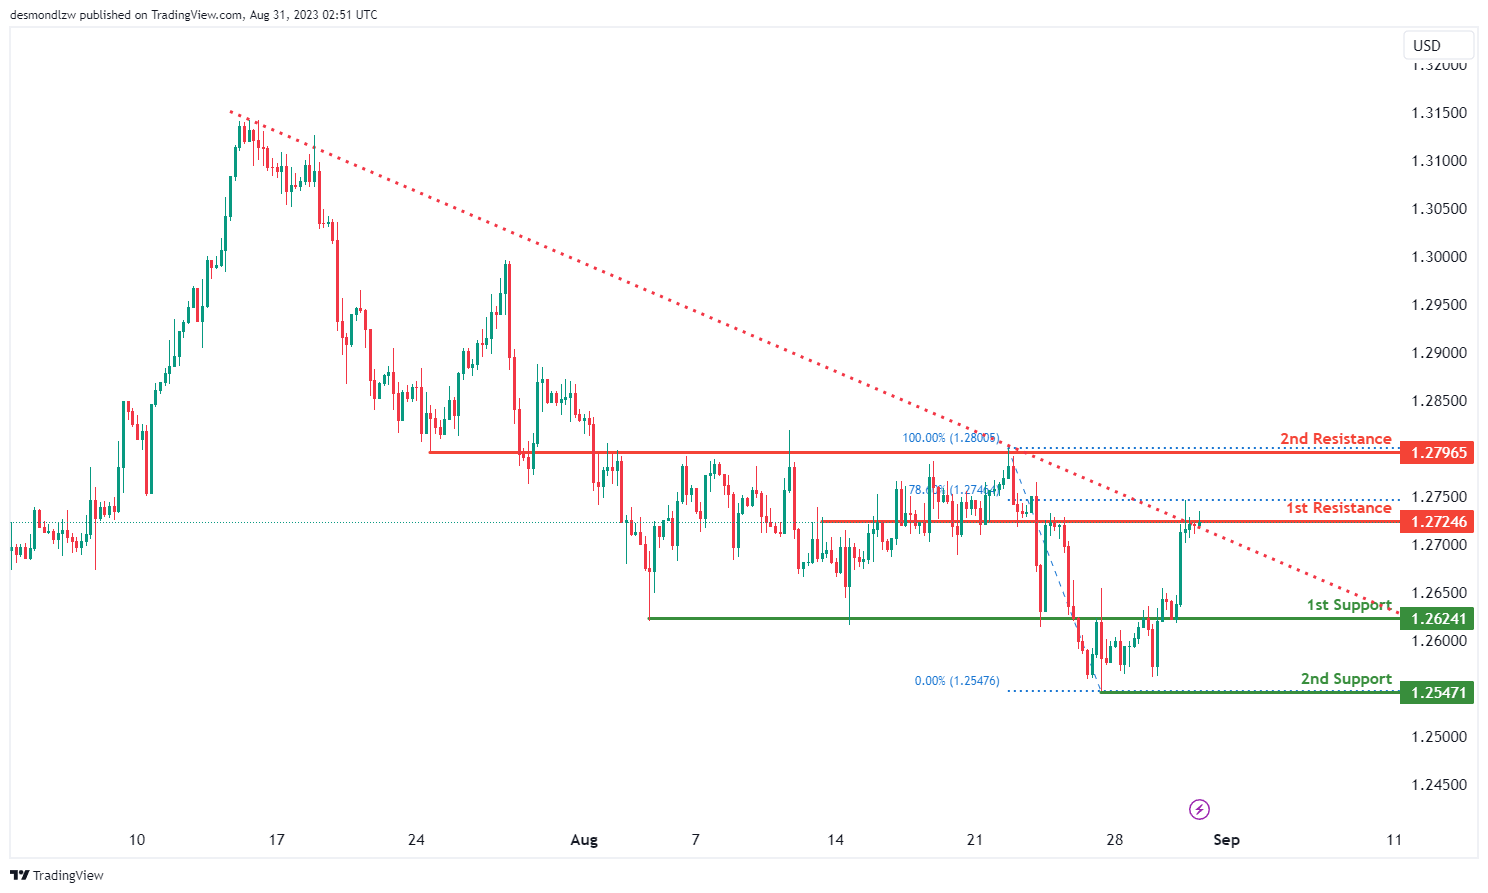
The GBP/USD chart is currently displaying bearish overall momentum, indicating a downward trend in the price. Contributing factors include the price positioning below a major descending trend line, suggesting potential bearish movement. A potential scenario envisions a bearish reaction emerging from the 1st resistance level, leading to a potential drop towards the 1st support. The 1st support at 1.2624 is identified as an overlap support, while the 2nd support at 1.2547 historically serves as a swing low support.
On the upside, the 1st resistance at 1.2724 is an overlap resistance, notably aligned with the 78.60% Fibonacci Retracement. Similarly, the 2nd resistance at 1.2796 is also an overlap resistance. These levels represent important junctures where the price could encounter resistance or support, respectively, in its movement.
GBP/JPY:
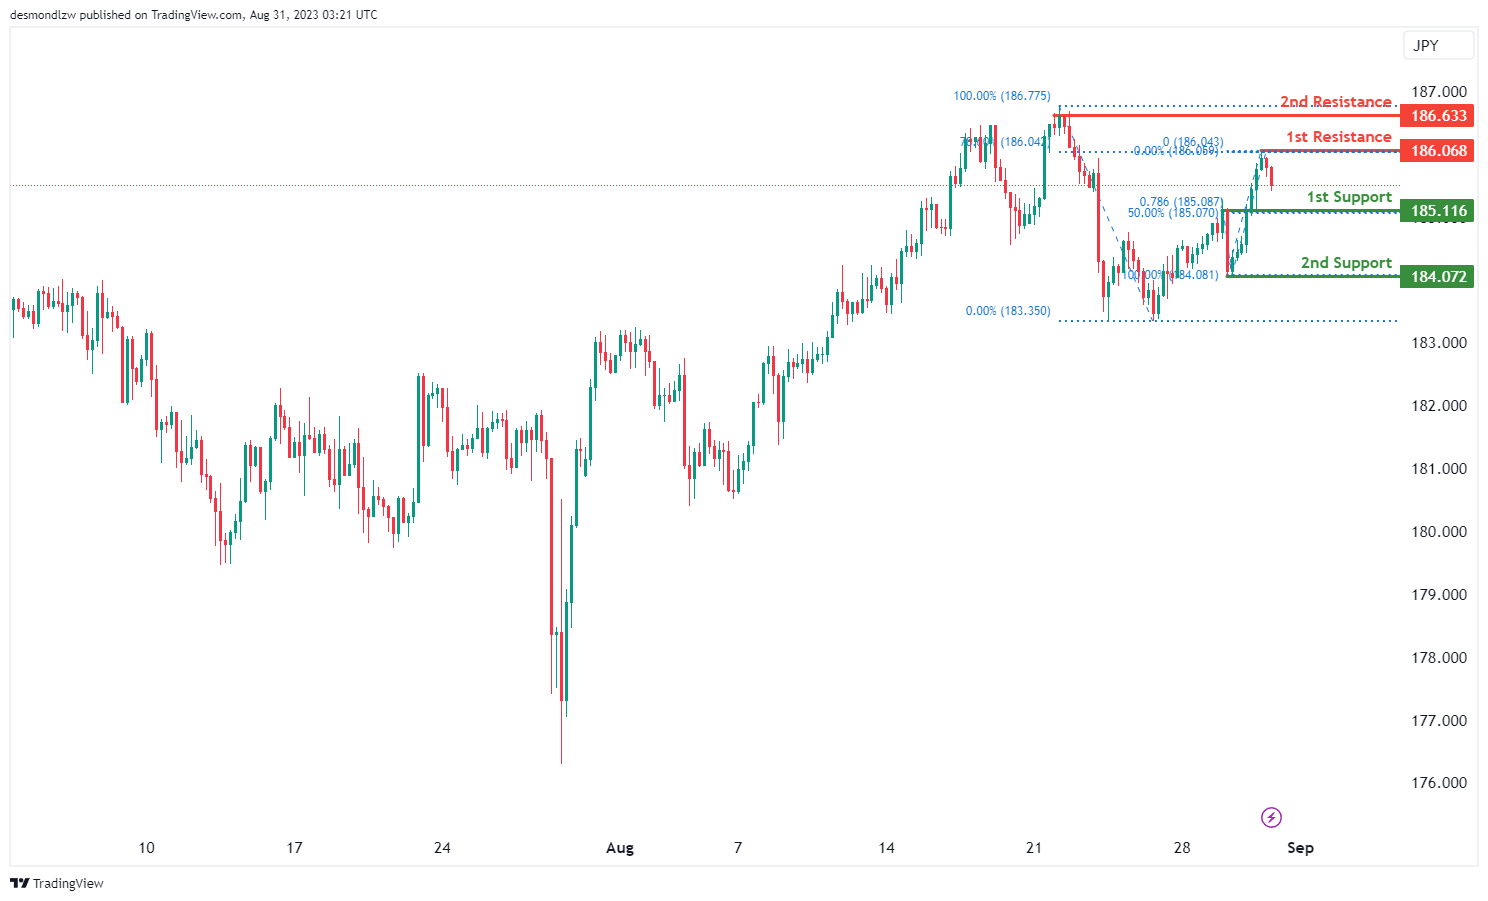
For GBP/JPY, the chart indicates a bullish overall momentum.
The 1st support level at 185.11 is a pullback support and coincides with the 78.60% Fibonacci retracement. This level could potentially act as a bounce point for the price, especially considering the bullish momentum.
The 2nd support level at 184.07 is a swing low support, which could also contribute to providing support to the price if it retraces further.
The 1st resistance level at 186.06 is a swing high resistance and aligns with the 78.60% Fibonacci retracement. This level could present a significant barrier to further upward movement.
The 2nd resistance level at 186.63 is another swing high resistance, which adds to the potential resistance in that area.
USD/CHF:
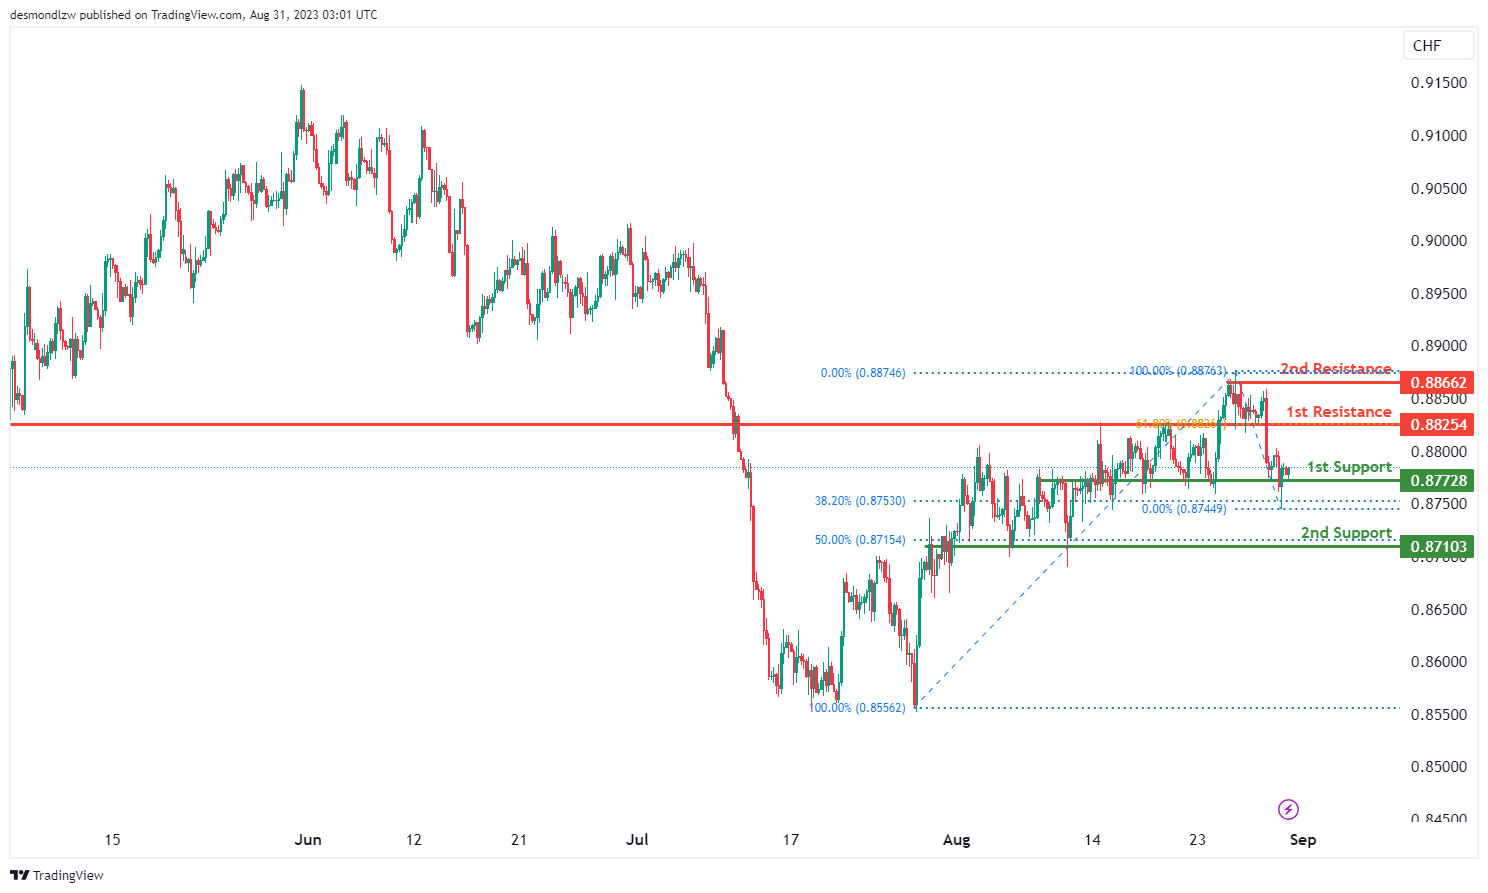
The USD/CHF chart is currently exhibiting a bullish overall momentum, There’s a potential scenario where the price could experience a bullish rebound from the 1st support, possibly moving towards the 1st resistance. The 1st support at 0.8772 is an overlap support, while the 2nd support at 0.8710 serves as an overlap support and aligns with the 50% Fibonacci Retracement.
On the upside, the 1st resistance at 0.8825 acts as a pullback resistance, coinciding with the 61.80% Fibonacci Retracement. Additionally, the 2nd resistance at 0.8866 represents a multi-swing high resistance. These levels hold significance as points where price could potentially encounter resistance or support during its progression.
USD/JPY:
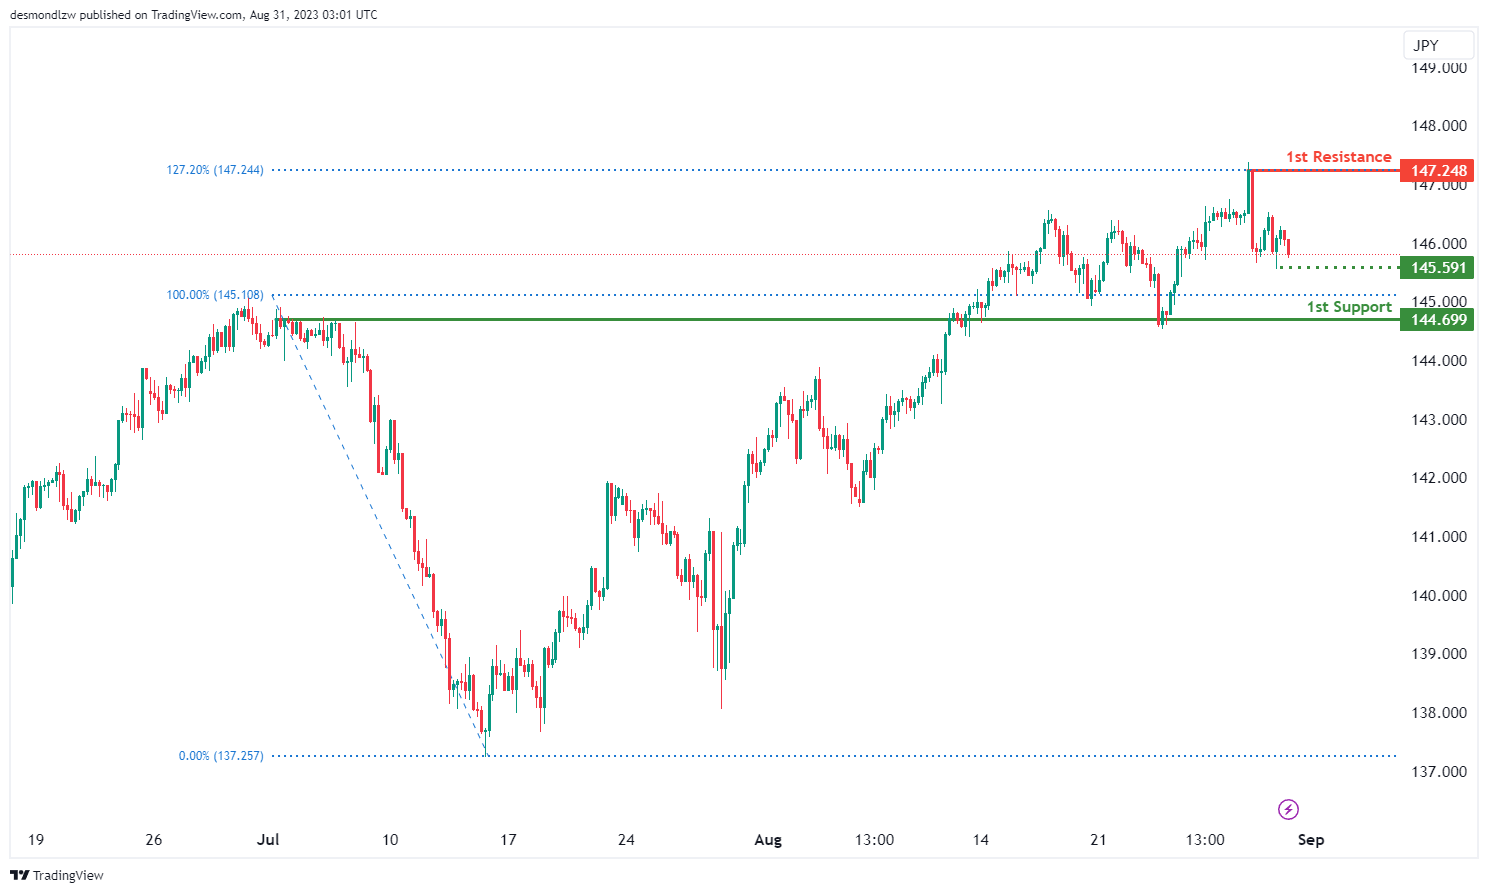
The USD/JPY chart is currently demonstrating a nearish overall momentum, suggesting a continued downward trend. This scenario suggests a potential for bearish continuation towards the 1st support level at 144.69, which carries weight as an overlap support. Adding to this perspective, the intermediate support at 145.59 gains importance as it aligns with swing low support.
Conversely, on the upside, the 1st resistance at 147.24 stands as a significant barrier due to its role as a swing high resistance. Notably, this resistance level is reinforced by the presence of the 127.20% Fibonacci Extension, underscoring its potential as a pivotal point for price action. These identified levels, reflecting historical price patterns and Fibonacci extensions, offer valuable insights for traders assessing potential support and resistance zones.
USD/CAD:
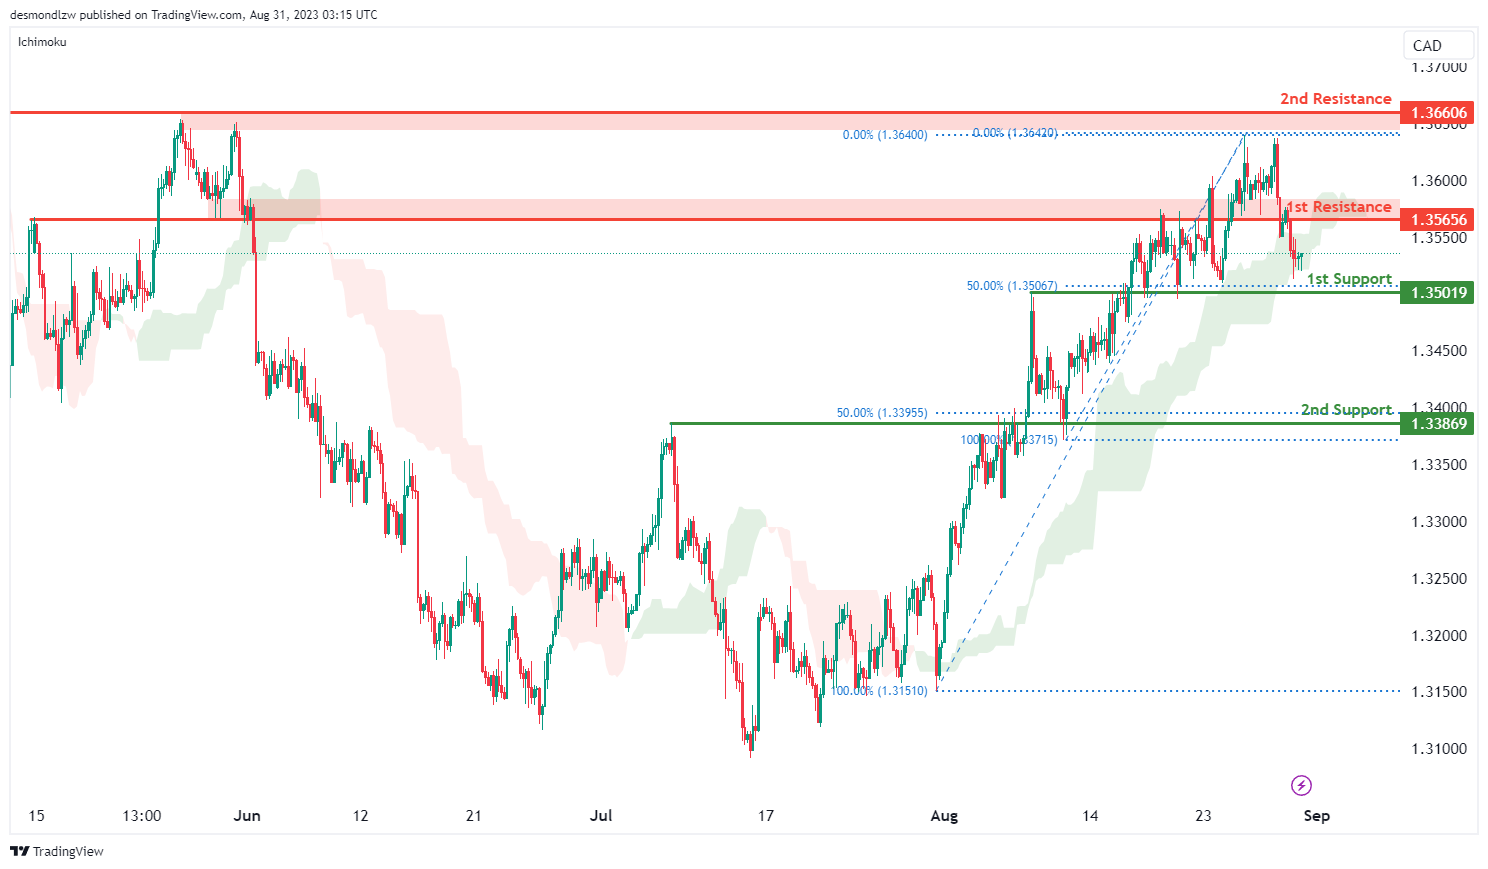
The USD/CAD chart is currently exhibiting a weak bullish momentum with low confidence. One supporting factor for the weak bullish movement is that price is currently situated within the bullish Ichimoku cloud, offering potential support for an upward movement towards the 1st resistance level.
The 1st resistance level at 1.3566 is marked as an overlap resistance while the 2nd resistance level at 1.3661 is also identified as an overlap resistance which could act as a potential barrier to further price appreciation.
To the downside, the 1st support level at 1.3502 is identified as an overlap support that aligns with the 50.00% Fibonacci retracement level. Similarly, the 2nd support level at 1.3387 is also identified as an overlap support that aligns with the 50.00% Fibonacci retracement level.
AUD/USD:
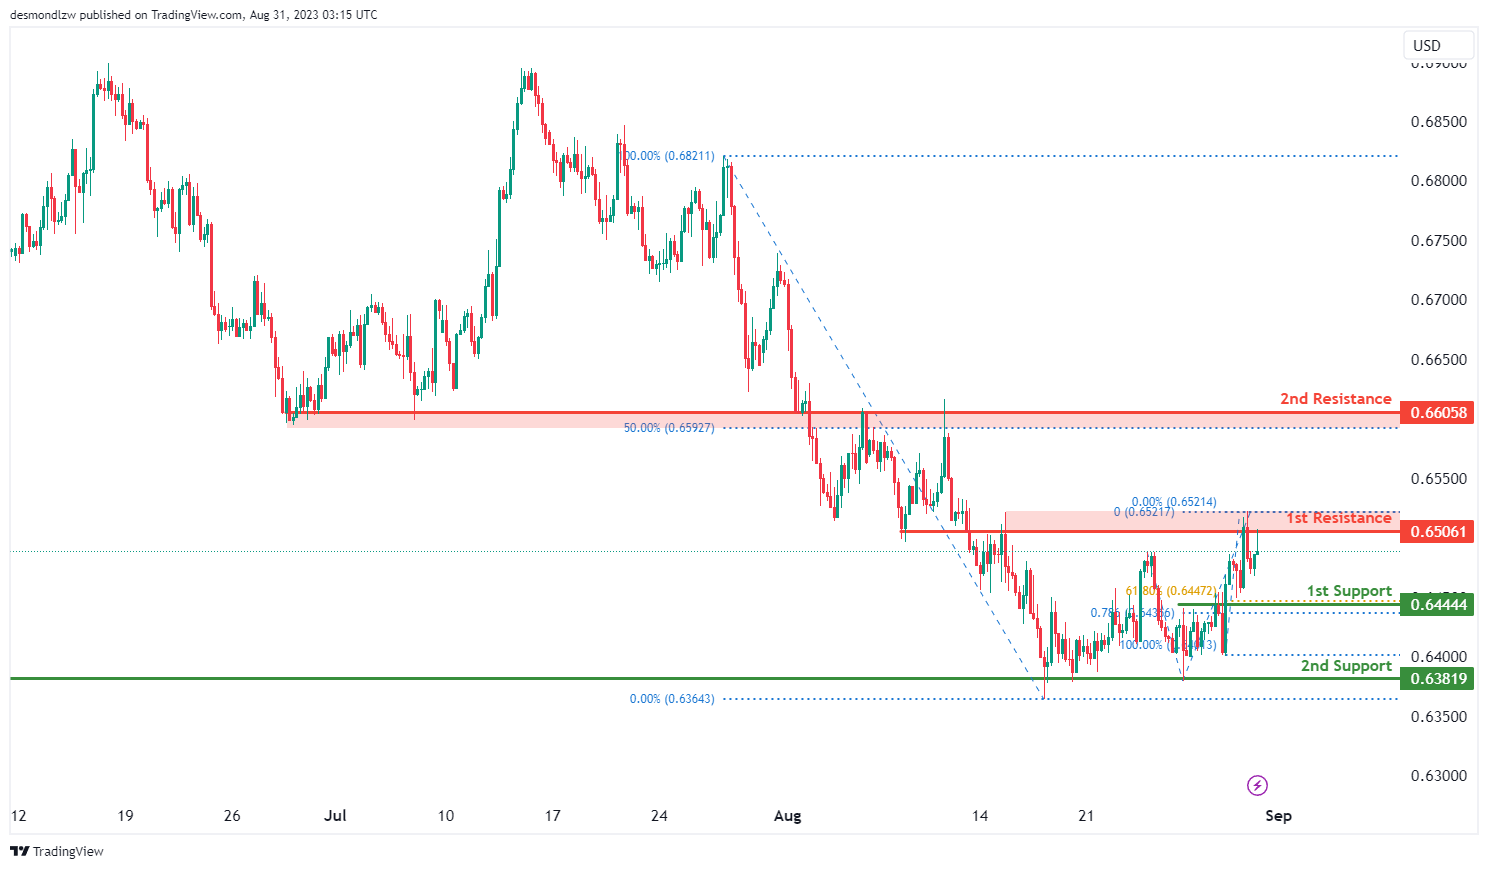
The AUD/USD chart is currently demonstrating a bearish overall momentum, indicating a potential for price to react bearishly off the 1st resistance level and subsequently decline towards the 1st support level.
The 1st resistance level at 0.6506 is identified as an overlap resistance while the 2nd resistance at 0.6606 is also marked as an overlap resistance that aligns with the 50.00% Fibonacci retracement level, acting as a potential significant barrier to further upward movement.
The 1st support level at 0.6444 is marked as an overlap support that aligns with a confluence Fibonacci levels i.e. the 61.80% retracement and the 78.60% projection levels. Furthermore, the 2nd support at 0.6382 is identified as a pullback support.
NZD/USD
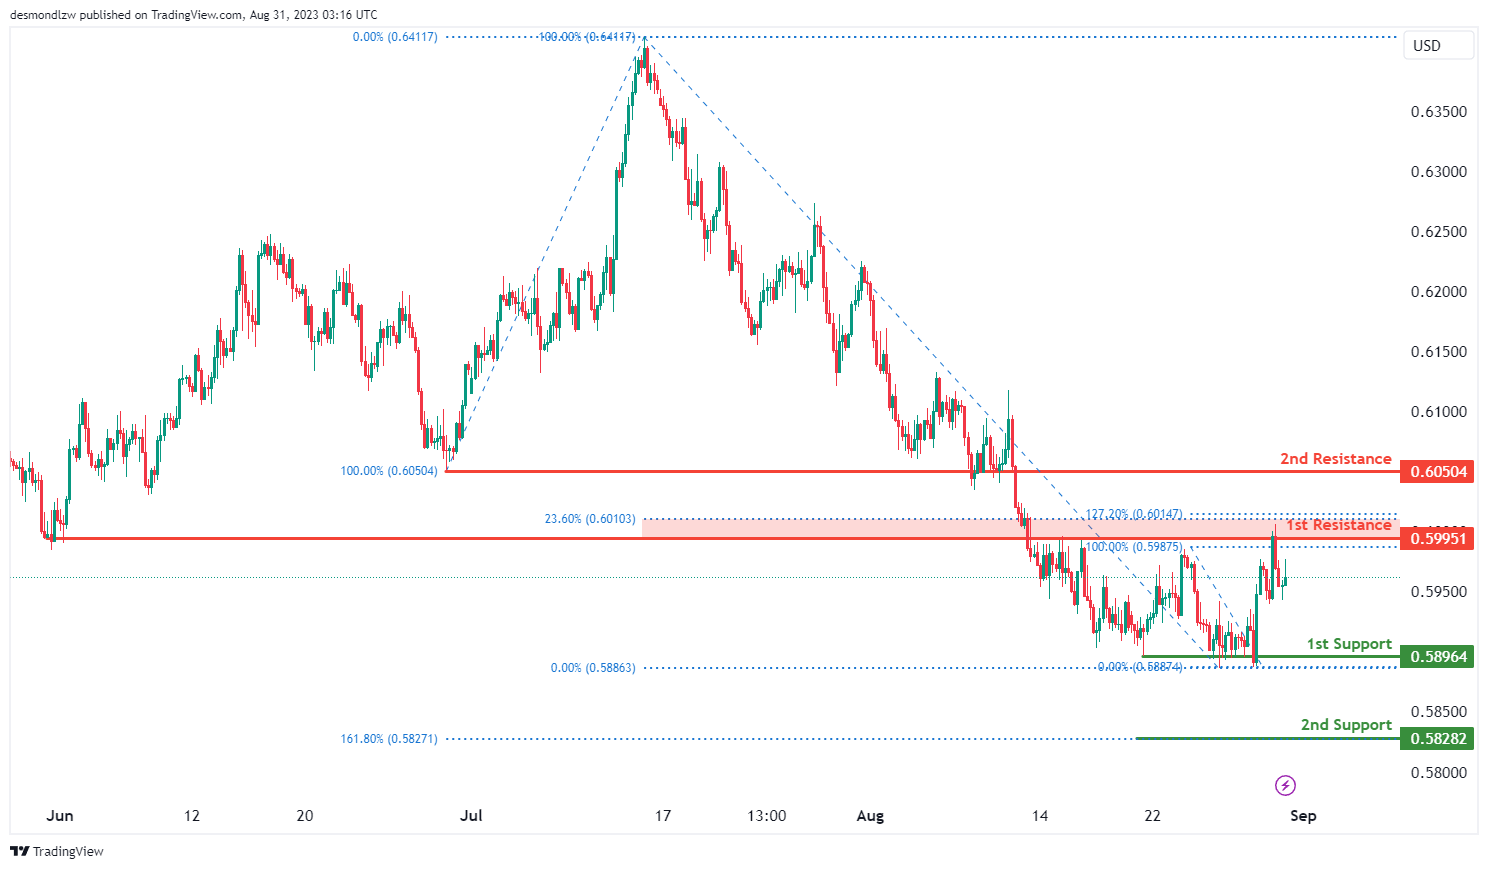
The NZD/USD chart is currently exhibiting a bearish overall momentum, indicating a possibility that price could react bearishly off the 1st resistance level and subsequently decline towards the 1st support level.
The 1st resistance level of 0.5995 is identified as an overlap resistance that aligns with a confluence of Fibonacci levels i.e. the 23.60% retracement and the 127.20% extension levels. Furthermore, the 2nd resistance level at 0.6050 is also identified as an overlap resistance.
The 1st support level at 0.5896 is identified as a multi-swing low support while the 2nd support level at 0.5828 is identified as a pullback support that aligns with the 161.80% Fibonacci extension level.
DJ30:
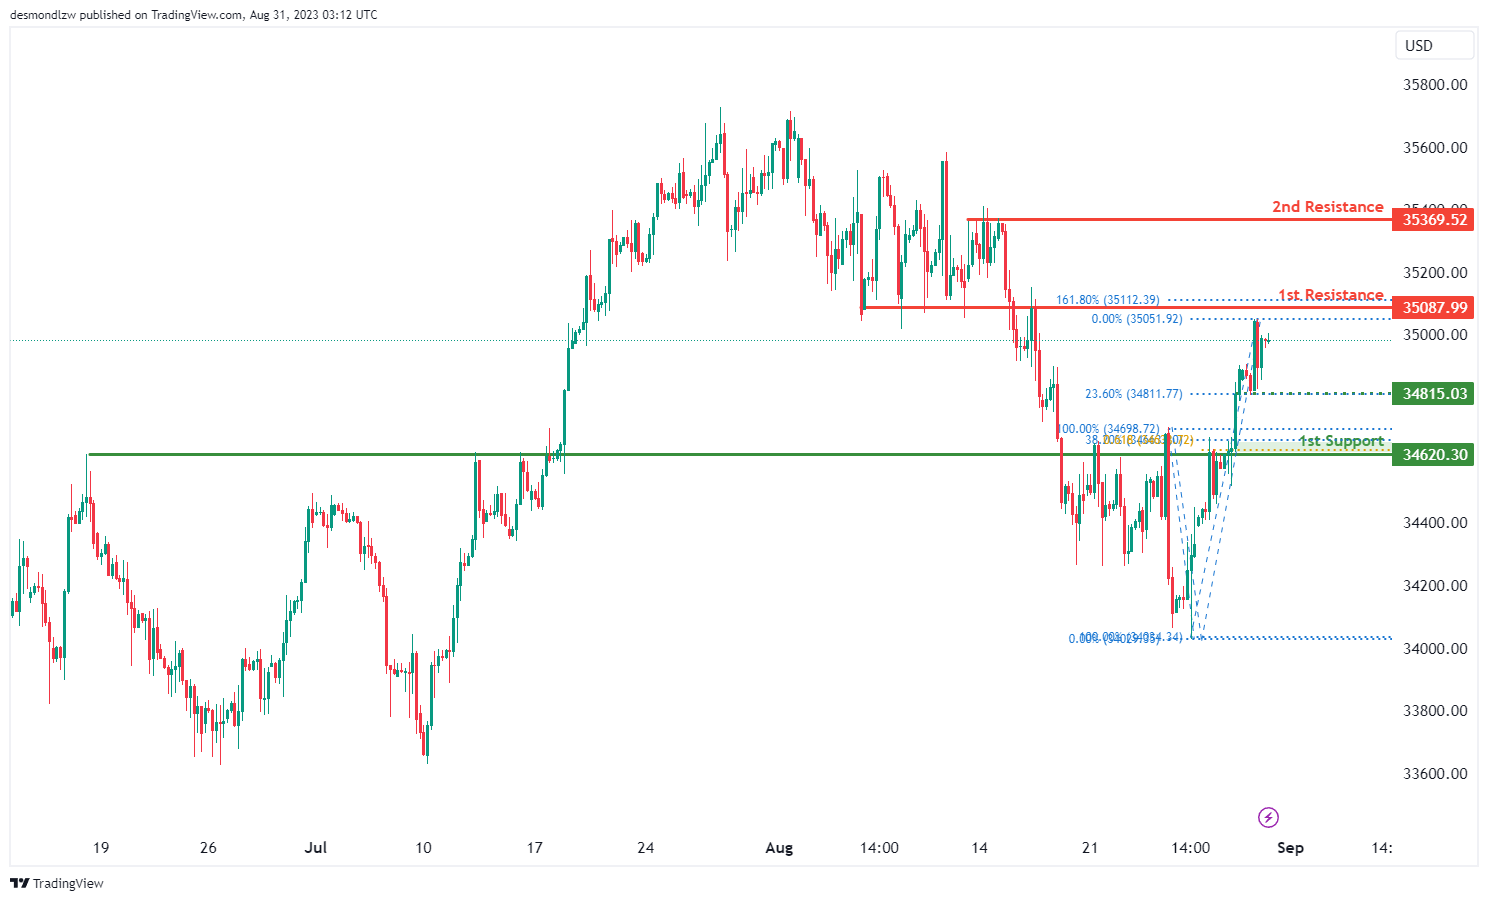
For DJ30, the chart indicates a bearish overall momentum.
The 1st support level at 34620.30 is an overlap support, suggesting that there might be historical price activity around this level that could act as support.
The 1st resistance level at 35087.90 is also an overlap resistance. This level aligns with the 161.80% Fibonacci extension, which indicates a potential resistance point that could lead to a reversal.
The 2nd resistance level at 35369.50 is a multi-swing high resistance. This level might present a stronger barrier to upward movement due to its historical significance.
The intermediate support level at 34815.00 is an overlap support and is further reinforced by the presence of the 23.60% Fibonacci retracement.
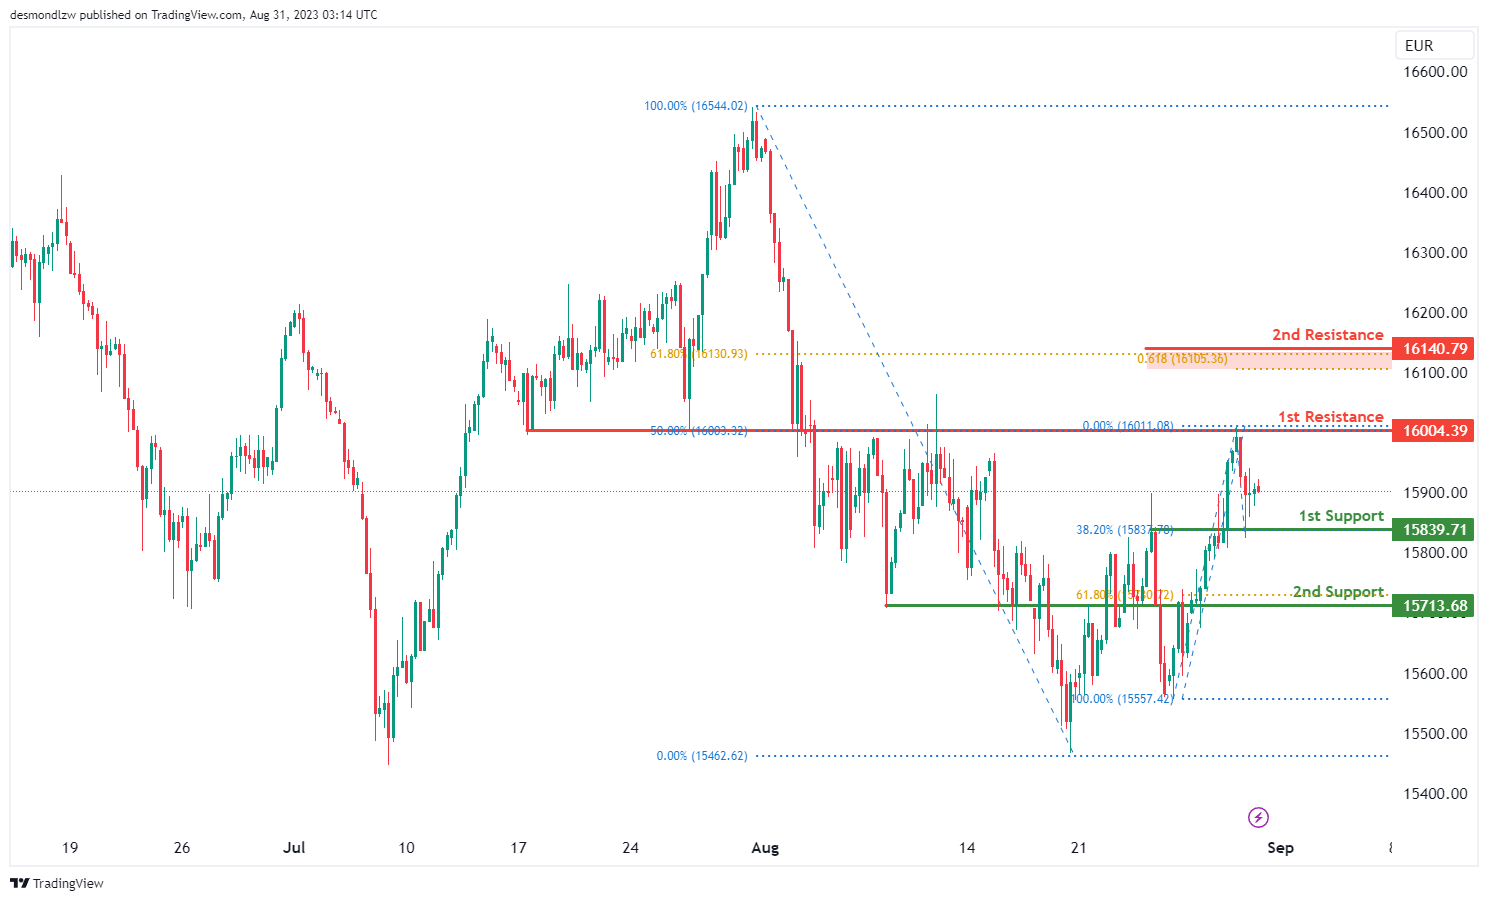
GER30:
For GER30, the chart indicates a bearish overall momentum.
The 1st support level at 15839.70 is an overlap support and aligns with the 38.20% Fibonacci retracement level. This level might provide some buying interest due to historical price activity and the Fibonacci confluence.
The 2nd support level at 15713.60 is a pullback support and coincides with the 61.80% Fibonacci retracement. This level could potentially act as a stronger support point.
The 1st resistance level at 16004.30 is an overlap resistance and also aligns with the 50% Fibonacci retracement. This level might pose a resistance barrier that could lead to a reversal.
The 2nd resistance level at 16140.70 presents a Fibonacci confluence, with both the 61.80% Fibonacci retracement and the 61.80% Fibonacci projection indicating potential resistance.
US500
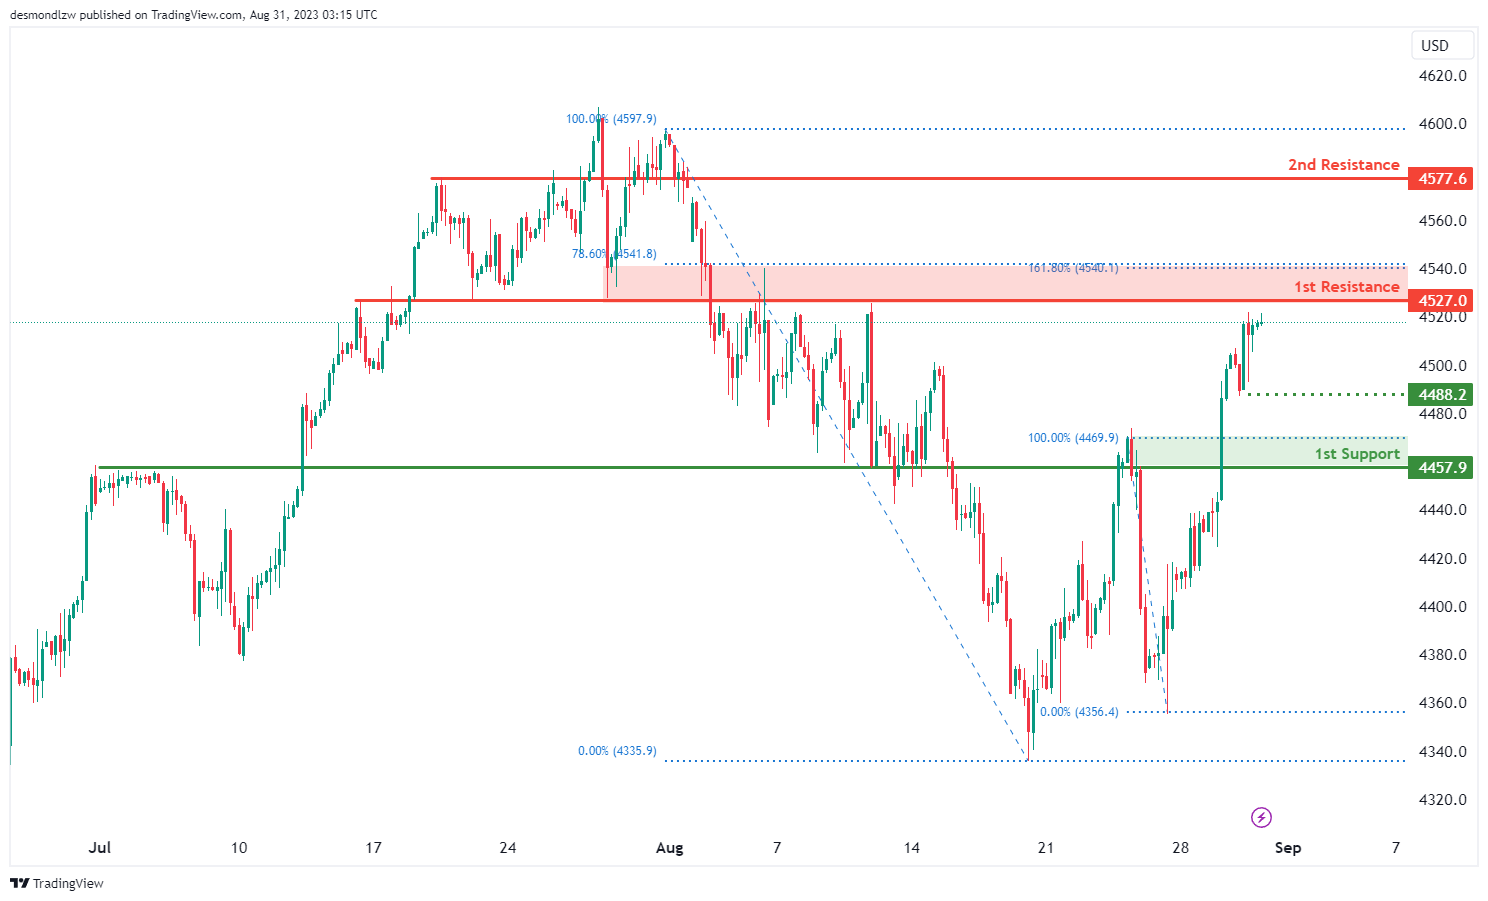
For US500, the chart suggests a bearish overall momentum.
The 1st support level at 4457.9 is a pullback support. This level might offer buying interest as it aligns with the pullback support.
The 1st resistance level at 4527.0 is an overlap resistance and aligns with both the 78.60% Fibonacci retracement and the 161.80% Fibonacci extension. This indicates a potential strong resistance zone.
The 2nd resistance level at 4577.6 is a pullback resistance. This level might also act as a resistance barrier.
BTC/USD:
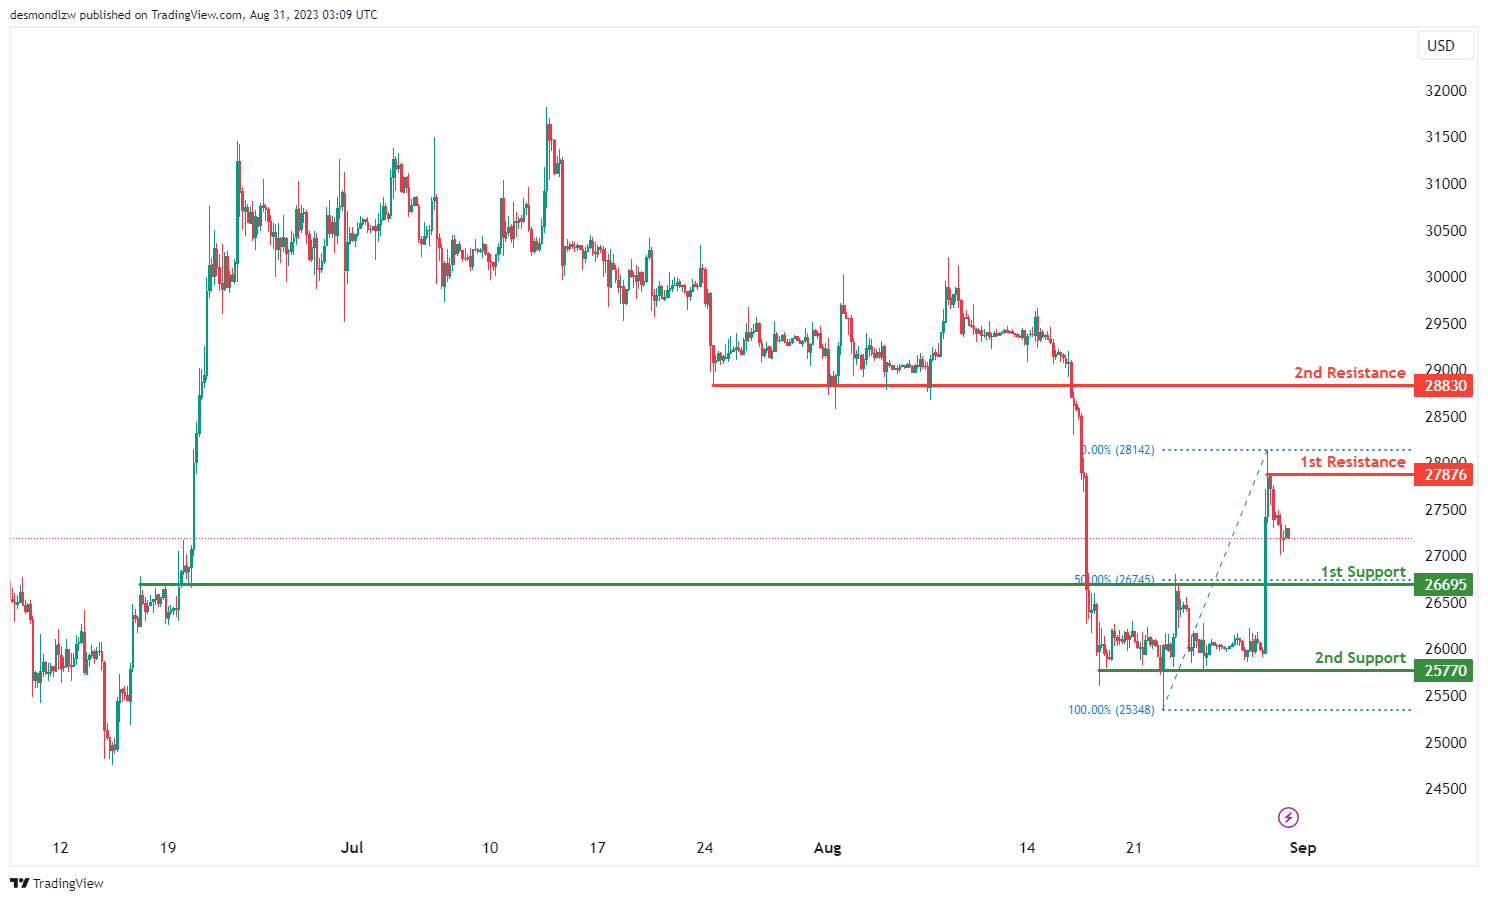
The BTC/USD chart indicates a bearish overall momentum.
The 1st support level at 26695 is an important level due to its characteristics as an overlap support and coincides with the 50% Fibonacci retracement level.
The 2nd support level at 25770 holds significance as a multi-swing low support.
On the resistance side, the 1st resistance level at 27876 is considered a swing high resistance.
The 2nd resistance level at 28830 gains importance as a pullback resistance.
ETH/USD:
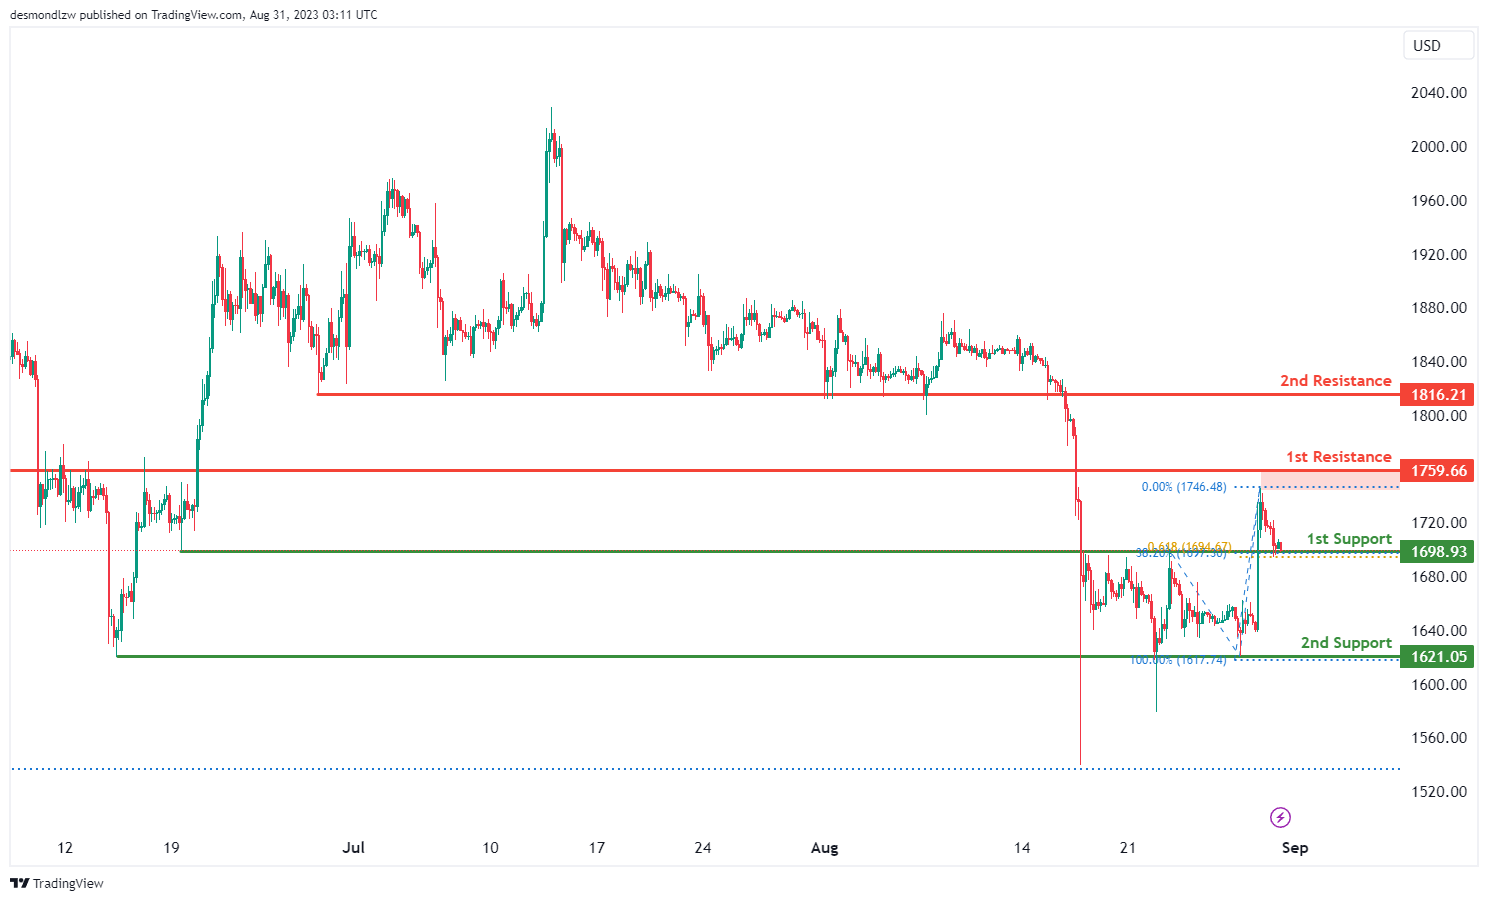
For ETH/USD, the chart indicates a bullish overall momentum.
The 1st support level at 1698.90 is an overlap support and aligns with both the 38.20% Fibonacci retracement and the 61.80% Fibonacci projection. This confluence of Fibonacci levels makes it a potentially strong support area.
The 2nd support level at 1621.00 is a multi-swing low support, which could provide additional reinforcement to its potential as a support zone.
On the resistance side, the 1st resistance level at 1759.60 is an overlap resistance. This level could present a potential barrier to further bullish movement.
The 2nd resistance level at 1816.20 is a pullback resistance. This level might act as a psychological resistance point as it is the higher end of the projected bullish movement.
WTI/USD:
The WTI chart is currently displaying a bearish overall momentum, indicating a downward trend in the price movement. In this scenario, there is a possibility that price could continue its bearish movement towards the 1st support level.
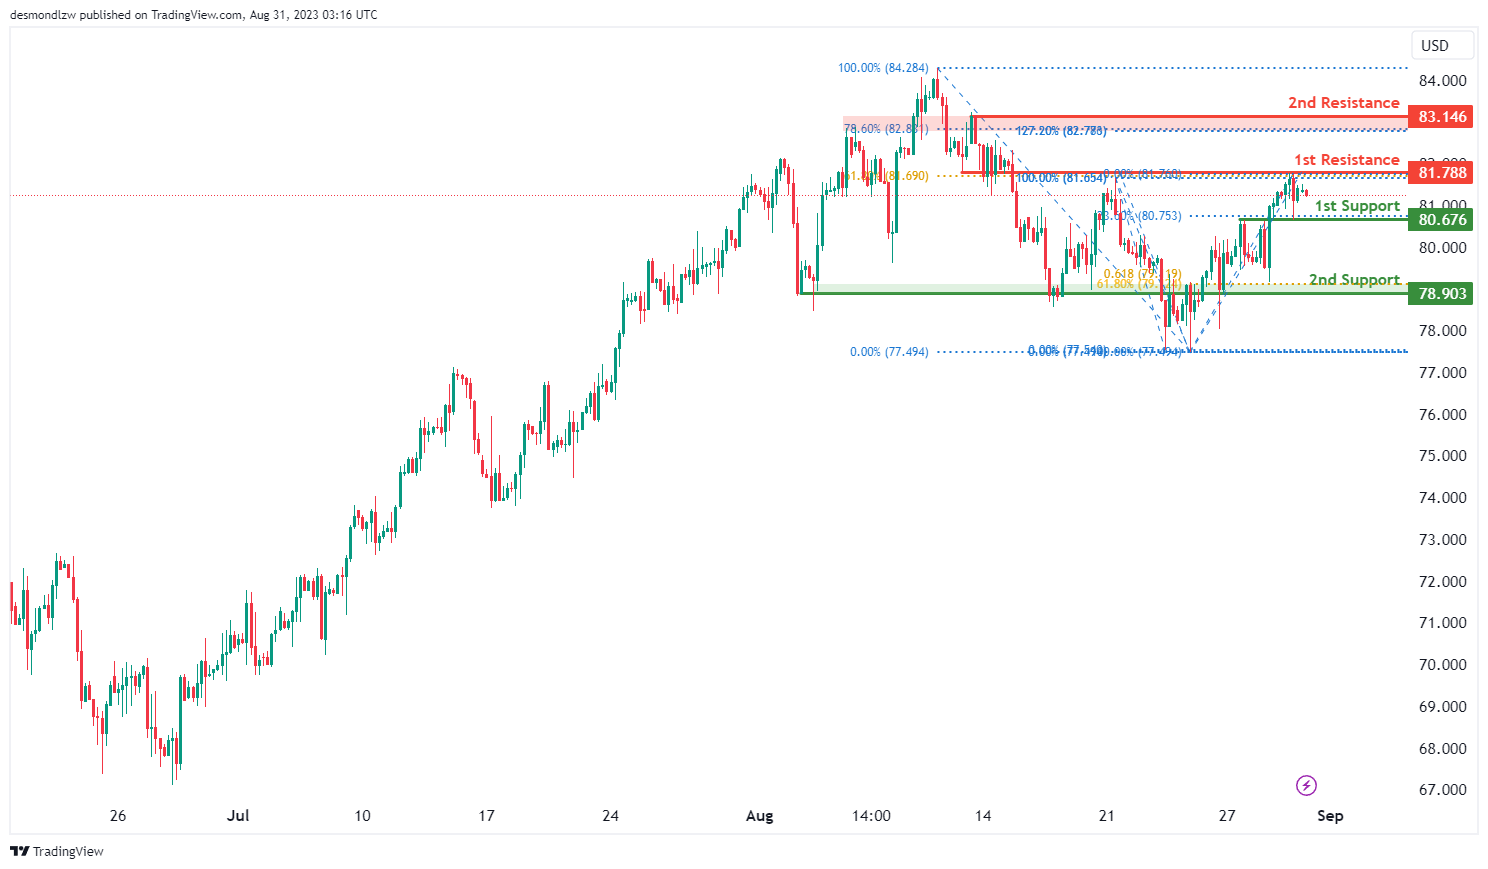
The 1st support level at 80.68 is identified as a pullback support that aligns with the 23.60% Fibonacci retracement level. In addition, the 2nd support level at 78.90 is identified as an overlap support that aligns with a confluence of Fibonacci levels i.e. the 61.80% retracement and the 61.80% projection levels, potentially acting as a stronger support zone.
To the upside, the 1st resistance level at 81.79 is identified as an overlap resistance that aligns with the 61.80% Fibonacci retracement level. Furthermore, the 2nd resistance at 83.15 is identified as a pullback resistance that aligns with a confluence of Fibonacci levels i.e. the 78.60% retracement and the 127.20% extension levels, reinforcing the potential significance of this resistance zone.
XAU/USD (GOLD):
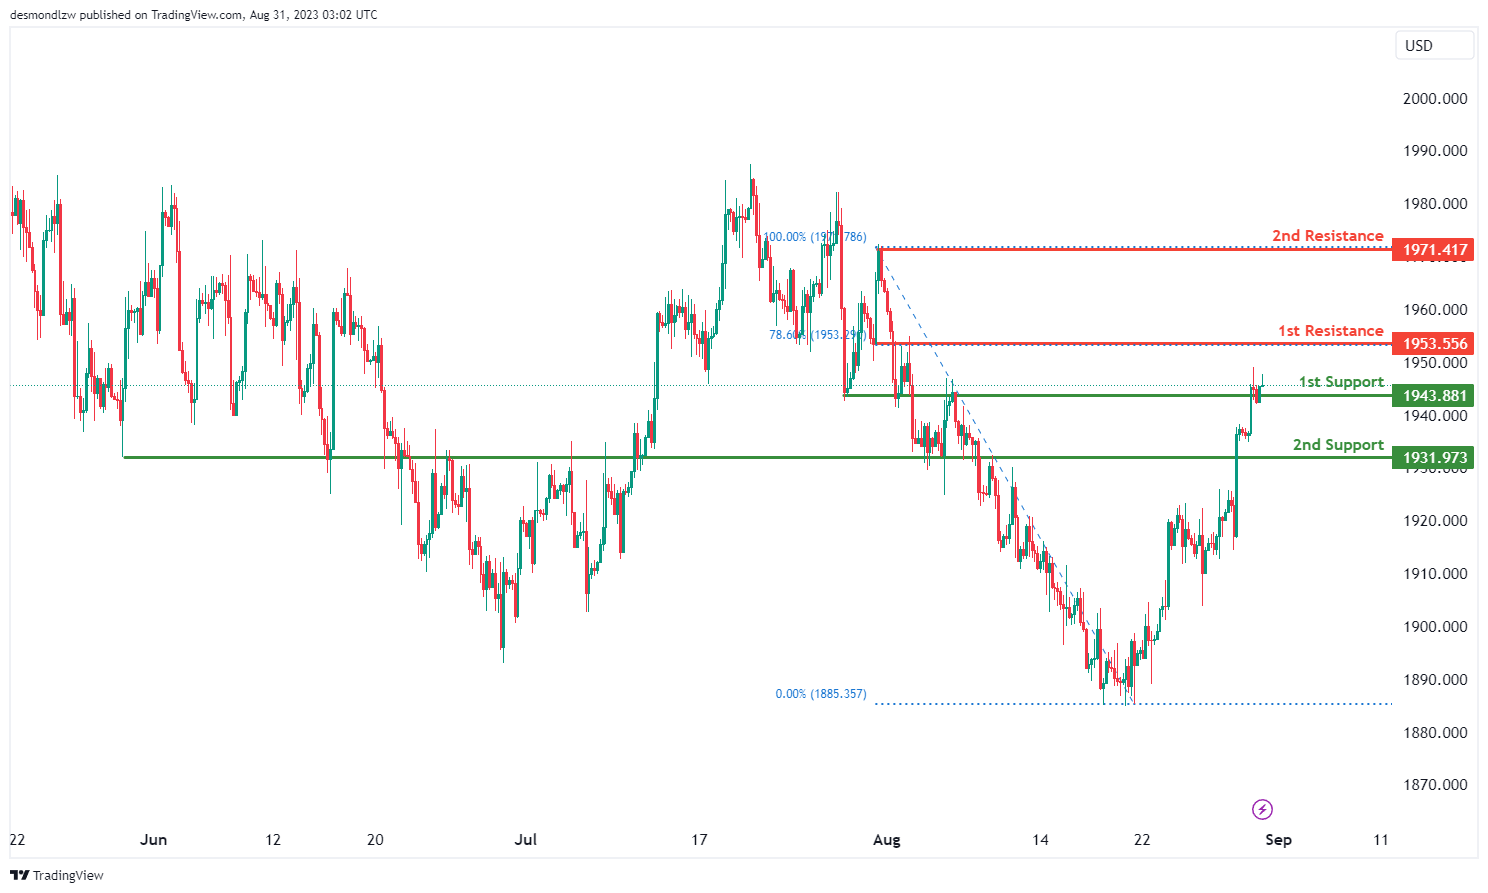
The XAU/USD chart is currently exhibiting a bullish overall momentum, signaling an upward trend. A plausible scenario entails potential bullish continuation towards the 1st resistance level at 1953.55. The 1st support at 1943.88 holds significance as an overlap support, while the 2nd support at 1931.97 gains importance as a pullback support.
On the upper end, the 1st resistance at 1953.55 serves as an overlap resistance, further reinforced by the presence of the 78.60% Fibonacci Retracement. Additionally, the 2nd resistance at 1971.41 represents a notable swing high resistance. These delineated levels, shaped by historical patterns and Fibonacci retracement, offer key insights into potential support and resistance areas for informed trading decisions.
Dollar Stabilizes Amid Lull in Asia; Eurozone CPI and US PCE in Focus
Markets took a breather in today's Asian trading session after Dollar experienced a significant selloff overnight. For now, the greenback seems to have found some footing, as market participants shift their focus to the release of high-impact data—Eurozone's CPI flash and US PCE inflation—slated for later today. Eurozone inflation report is particularly critical as it could have a direct influence on ECB decision to either hike interest rates again or hit pause during its September meeting. Traders should also brace for a potential market jolt with US non-farm payroll data due out tomorrow. A roller coaster of market movements can be expected for the rest of the week.
As it stands, Dollar has been the week's worst performer, trailed by Yen and Canadian Dollar. On the other side of the currency spectrum, Australian Dollar is leading the pack, followed by Euro, Sterling, and then Kiwi. The ongoing interplay between these European major and commodity currencies remains an interesting subplot; it's still unclear which currency will emerge as the week's winner, especially if Dollar's selloff gains more momentum.
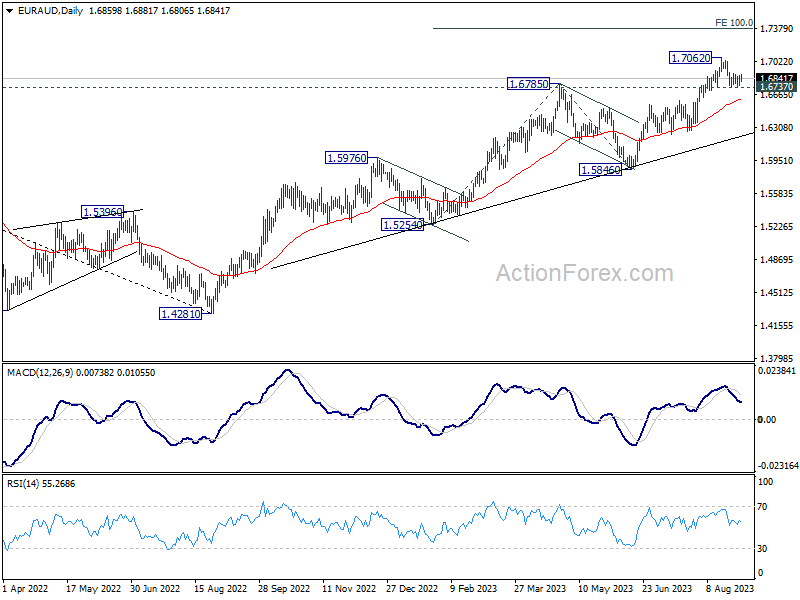
Technically, EUR/AUD is holding firm above 1.6737 support for now, keeping near term outlook bullish. That is, another rise is in favor through 1.7062 to resume larger up trend. In that case, next target is 100% projection of 1.5254 to 1.6785 from 1.5846 at 1.7377. However, firm break of 1.6737 will at least bring deeper correction to 55 D EMA (now at 1.6613), and possibly below. We'll know the answer soon as pivotal data releases loom on the horizon.
In Asia, at the time of writing, Nikkei is up 1.03%. Hong Kong HSI is down -0.50%. China Shanghai SSE is down -0.68%. Singapore Strait Times is up 0.49%. Japan 10-year JGB yield is down -0.002 at 0.653. Overnight, DOW rose 0.11%. S&P 500 rose 0.38%. NASDAQ rose 0.54%. 10-year yield dropped -0.004 to 4.118.
Japan's industrial production slips -2% in Jul, but retail sales resilient
Japan's industrial production took a hit in July, falling by a worse-than-expected -2.0% mom, versus consensus forecast of -1.4% mom. The seasonally adjusted production index stumbled to 103.6, based on 2020 base of 100.
Production was primarily pulled down by substantial drops in electronic parts and devices, which declined -by 5.1% mom. Also, production machinery output shrank by -4.8% mom, with semiconductor manufacturing equipment segment plunging a stark 16.4% mom. However, not all was grim. Production of automobiles showed a modest uptick of 0.6% mom, attributed to the easing of supply chain bottlenecks.
A Ministry of Economy, Trade, and Industry official remarked that the slump in output across various sectors was largely due to diminishing domestic and overseas orders. Consequently, METI has revised its assessment of industrial output from "showing signs of moderately picking up" to "fluctuated indecisively."
Despite the grim industrial landscape, manufacturers surveyed by METI are optimistic, projecting a 2.6% rise in output for August and a 2.4% increase in September.
In contrast to the industrial sector's lackluster performance, retail sales exhibited considerable strength. Sales surged 6.8% yoy in July, beating expectations of a 5.4% yoy increase. This marks the 17th consecutive month of expansion since March 2022. Additionally, retail sales increased 2.1% mom in July, recovering from a -0.6% mom decline in the previous month.
BoJ Nakamura: Achievement of 2% inflation isn't in sight yet
In a marked contrast to fellow BoJ board member Naoki Tamura's recent remarks, Toyoaki Nakamura, known for his dovish stance, stressed the need for a more cautious approach towards tightening Japan's monetary policy. Speaking at an event, Nakamura noted, "Sustainable and stable achievement of our 2% inflation isn't in sight yet. We therefore need more time before shifting to monetary tightening."
Nakamura emphasized the necessity for "close scrutiny of conditions and cautious decision-making" when it comes to modifications in Japan's ultra-loose monetary policy. He further cited weakening economic signs in China and potential ripple effects of aggressive US interest rate hikes as risks clouding Japan's economic outlook.
Interestingly, Nakamura was the sole dissenting voice last month against the BoJ's decision to loosen its grip on yield curve control, underscoring his position as the board's most dovish member. His comments are in stark contrast to those of board member Naoki Tamura, who expressed optimism yesterday that BoJ could have sufficient data by the first quarter of 2024 to assess whether the 2% inflation target could be met sustainably.
NZ ANZ business confidence rose to -3.7, the worst could be over
New Zealand's ANZ Business Confidence index showed a marked improvement in August, rising from -13.1 to -3.7. The data suggests a positive shift in the economic outlook among New Zealand businesses. Own Activity Outlook also jumped from a tepid 0.8 to a robust 11.2.
Several other sub-indicators within the report signaled optimism. Export intentions rose from 1.5 to 7.5, indicating that businesses are more confident about overseas demand. Investment intentions climbed from -3.3 to -1.3, suggesting that companies are less hesitant about capital expenditures. Employment intentions also saw a notable uptick, moving from -1.6 to 4.6, pointing to potential job market expansion.
On the inflationary front, businesses appear to be less worried. Cost expectations decreased from 80.6 to 75.3, pricing intentions fell from 48.1 to 44.0, and inflation expectations eased marginally from 5.14 to 5.06. This cooling in inflationary pressure might be a welcome sign for both the market and RBNZ.
In their commentary, ANZ stated: "Many firms appear to have been pleasantly surprised at how well demand has held up, considering; and the Reserve Bank has stopped raising the OCR (Official Cash Rate), (while reserving the right to change their minds), which may be creating a sense that the worst is over."
China's PMI manufacturing edges up to 49.7, fifth month in contraction
China's official PMI Manufacturing for August rose slightly to 49.7, surpassing market expectations of 49.5. Despite the increment, this marks the fifth consecutive month that the metric is below the 50-threshold, signaling a contraction in the manufacturing sector.
Key sub-indexes within the PMI data painted a mixed picture. Production sub-index saw improvement, rising from 50.2 in July to 51.9 . Similarly, the gauge for new orders nudged up to 50.2 from 49.5. On the downside, new export orders sub-index stayed low at 46.7, though it was slightly up from 46.3 , marking its fifth consecutive month in contraction territory.
Manufacturers' business expectations did see some improvement, rising from 55.1 to 55.6, indicating a slight uptick in future outlook despite current headwinds.
Zhao Qinghe, a senior official from China's National Bureau of Statistics, commented on the situation. "The survey results show that insufficient market demand is still the main problem that enterprises are facing, and the foundation for the recovery and development of the manufacturing industry needs to be further consolidated," he said.
Meanwhile, PMI Non-Manufacturing fell from 51.5 to 51.0, missing market expectations of 51.1, although it still remains in the expansionary territory above 50.
Looking ahead
Eurozone CPI flash is the highlight in European session, while unemployment rate will be featured. . ECB will also release meetings accounts but they're unlikely to reveal anything new. Germany retail sales and unemployment. France will release consumer spending.
Later in the day, main focuses will be on US PCE inflation, while personal income and spending will be published together. Jobless claims and Chicago PMI will also be featured.
EUR/USD Daily Outlook
Daily Pivots: (S1) 1.0870; (P) 1.0908; (R1) 1.0960; More...
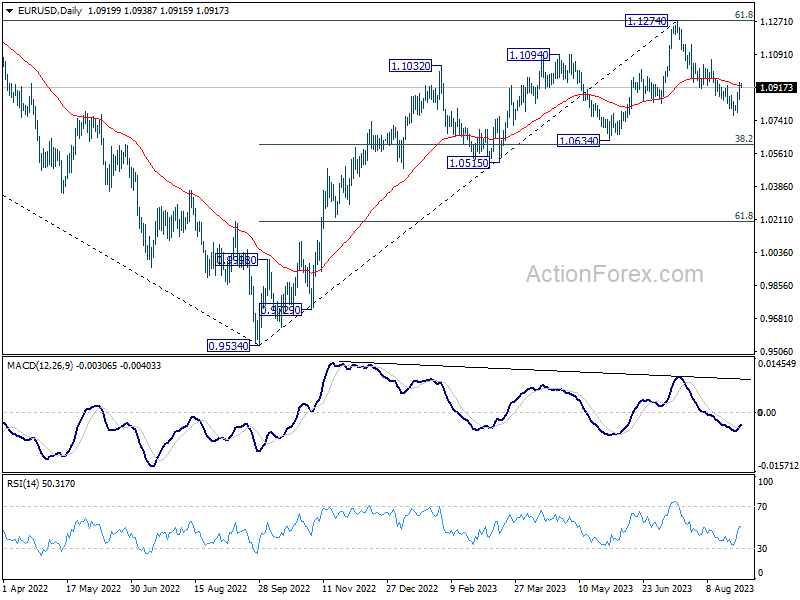
Focus stays on 1.0929 in EUR/USD as the pair is still struggling around this resistance. Sustained break of 1.0929 argue that the corrective fall from 1.1274 has completed with three waves down to 1.0764. Further rally would then be seen to 1.1064 resistance for confirmation. Meanwhile, rejection by 1.0929 will retain near term bearishness. Break of 1.0854 minor support will resume the decline through 1.0764, to 1.0609/34 cluster support next.
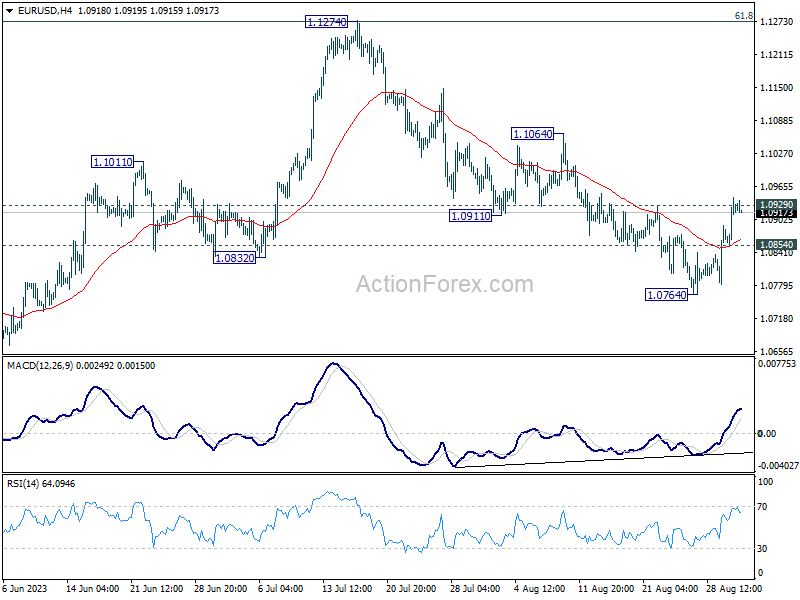
In the bigger picture, fall from 1.1274 medium term top is seen as a correction to up trend from 0.9534 (2022 low). Deeper decline would be seen to 1.0634 cluster support (38.2% retracement of 0.9534 to 1.1274 at 1.0609). Strong support could be seen there, at least on first attempt, to bring rebound. Yet, medium term outlook will be neutral for now, as long as 1.1274 resistance holds.
Economic Indicators Update
| GMT | Ccy | Events | Actual | Forecast | Previous | Revised |
|---|---|---|---|---|---|---|
| 23:50 | JPY | Industrial Production M/M Jul P | -2.00% | -1.40% | 2.40% | |
| 23:50 | JPY | Retail Trade Y/Y Jul | 6.80% | 5.40% | 5.90% | |
| 01:00 | NZD | ANZ Business Confidence Aug | -3.7 | -13.1 | ||
| 01:00 | CNY | NBS Manufacturing PMI Aug | 49.7 | 49.5 | 49.3 | |
| 01:00 | CNY | Non-Manufacturing PMI Aug | 51 | 51.1 | 51.5 | |
| 01:30 | AUD | Private Capital Expenditure Q2 | 2.80% | 1.10% | 2.40% | 3.70% |
| 05:00 | JPY | Housing Starts Y/Y Jul | -6.70% | -0.80% | -4.80% | |
| 06:00 | EUR | Germany Retail Sales M/M Jul | 0.30% | -0.80% | ||
| 06:45 | EUR | France Consumer Spending M/M Jul | 0.30% | 0.90% | ||
| 06:45 | EUR | France GDP Q/Q Q2 | 0.50% | 0.50% | ||
| 07:55 | EUR | Germany Unemployment Change Jul | 10K | -4K | ||
| 07:55 | EUR | Germany Unemployment Rate Jul | 5.60% | 5.60% | ||
| 08:00 | EUR | Italy Unemployment Jul | 7.40% | 7.40% | ||
| 09:00 | EUR | Eurozone Unemployment Rate Jul | 6.40% | 6.40% | ||
| 09:00 | EUR | Eurozone CPI Y/Y Aug P | 5.10% | 5.30% | ||
| 09:00 | EUR | Eurozone CPI Core Y/Y Aug P | 5.30% | 5.50% | ||
| 11:30 | EUR | ECB Monetary Policy Meeting Accounts | ||||
| 12:30 | CAD | Current Account (CAD) Q2 | -11.1B | -6.2B | ||
| 12:30 | USD | Initial Jobless Claims (Aug 25) | 227K | 230K | ||
| 12:30 | USD | Personal Income M/M Jul | 0.30% | 0.30% | ||
| 12:30 | USD | Personal Spending Jul | 0.70% | 0.50% | ||
| 12:30 | USD | PCE Price Index M/M Jul | 0.20% | 0.20% | ||
| 12:30 | USD | PCE Price Index Y/Y Jul | 3.30% | 3.00% | ||
| 12:30 | USD | Core PCE Price Index M/M Jul | 0.20% | 0.20% | ||
| 12:30 | USD | Core PCE Price Index Y/Y Jul | 4.20% | 4.10% | ||
| 13:45 | USD | Chicago PMI Aug | 44.1 | 42.8 | ||
| 14:30 | USD | Natural Gas Storage | 20B | 18B |
EUR/USD Daily Outlook
Daily Pivots: (S1) 1.0870; (P) 1.0908; (R1) 1.0960; More...
Focus stays on 1.0929 in EUR/USD as the pair is still struggling around this resistance. Sustained break of 1.0929 argue that the corrective fall from 1.1274 has completed with three waves down to 1.0764. Further rally would then be seen to 1.1064 resistance for confirmation. Meanwhile, rejection by 1.0929 will retain near term bearishness. Break of 1.0854 minor support will resume the decline through 1.0764, to 1.0609/34 cluster support next.
In the bigger picture, fall from 1.1274 medium term top is seen as a correction to up trend from 0.9534 (2022 low). Deeper decline would be seen to 1.0634 cluster support (38.2% retracement of 0.9534 to 1.1274 at 1.0609). Strong support could be seen there, at least on first attempt, to bring rebound. Yet, medium term outlook will be neutral for now, as long as 1.1274 resistance holds.
China’s PMI manufacturing edges up to 49.7, fifth month in contraction
China's official PMI Manufacturing for August rose slightly to 49.7, surpassing market expectations of 49.5. Despite the increment, this marks the fifth consecutive month that the metric is below the 50-threshold, signaling a contraction in the manufacturing sector.
Key sub-indexes within the PMI data painted a mixed picture. Production sub-index saw improvement, rising from 50.2 in July to 51.9 . Similarly, the gauge for new orders nudged up to 50.2 from 49.5. On the downside, new export orders sub-index stayed low at 46.7, though it was slightly up from 46.3 , marking its fifth consecutive month in contraction territory.
Manufacturers' business expectations did see some improvement, rising from 55.1 to 55.6, indicating a slight uptick in future outlook despite current headwinds.
Zhao Qinghe, a senior official from China's National Bureau of Statistics, commented on the situation. "The survey results show that insufficient market demand is still the main problem that enterprises are facing, and the foundation for the recovery and development of the manufacturing industry needs to be further consolidated," he said.
Meanwhile, PMI Non-Manufacturing fell from 51.5 to 51.0, missing market expectations of 51.1, although it still remains in the expansionary territory above 50.
NZ ANZ business confidence rose to -3.7, the worst could be over
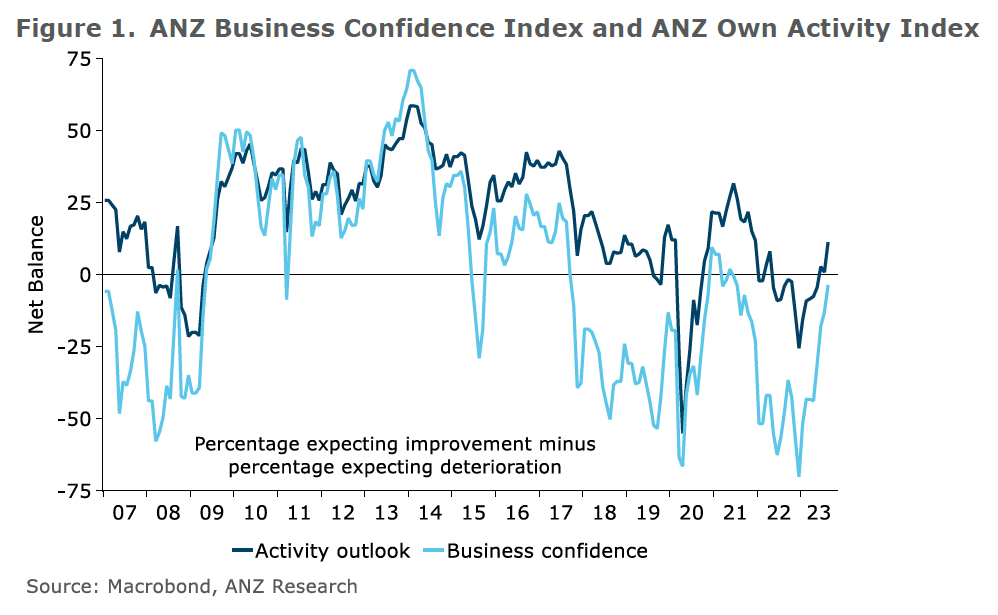
New Zealand's ANZ Business Confidence index showed a marked improvement in August, rising from -13.1 to -3.7. The data suggests a positive shift in the economic outlook among New Zealand businesses. Own Activity Outlook also jumped from a tepid 0.8 to a robust 11.2.
Several other sub-indicators within the report signaled optimism. Export intentions rose from 1.5 to 7.5, indicating that businesses are more confident about overseas demand. Investment intentions climbed from -3.3 to -1.3, suggesting that companies are less hesitant about capital expenditures. Employment intentions also saw a notable uptick, moving from -1.6 to 4.6, pointing to potential job market expansion.
On the inflationary front, businesses appear to be less worried. Cost expectations decreased from 80.6 to 75.3, pricing intentions fell from 48.1 to 44.0, and inflation expectations eased marginally from 5.14 to 5.06. This cooling in inflationary pressure might be a welcome sign for both the market and RBNZ.
In their commentary, ANZ stated: "Many firms appear to have been pleasantly surprised at how well demand has held up, considering; and the Reserve Bank has stopped raising the OCR (Official Cash Rate), (while reserving the right to change their minds), which may be creating a sense that the worst is over."
BoJ Nakamura: Achievement of 2% inflation isn’t in sight yet
In a marked contrast to fellow BoJ board member Naoki Tamura's recent remarks, Toyoaki Nakamura, known for his dovish stance, stressed the need for a more cautious approach towards tightening Japan's monetary policy. Speaking at an event, Nakamura noted, "Sustainable and stable achievement of our 2% inflation isn't in sight yet. We therefore need more time before shifting to monetary tightening."
Nakamura emphasized the necessity for "close scrutiny of conditions and cautious decision-making" when it comes to modifications in Japan's ultra-loose monetary policy. He further cited weakening economic signs in China and potential ripple effects of aggressive US interest rate hikes as risks clouding Japan's economic outlook.
Interestingly, Nakamura was the sole dissenting voice last month against the BoJ's decision to loosen its grip on yield curve control, underscoring his position as the board's most dovish member. His comments are in stark contrast to those of board member Naoki Tamura, who expressed optimism yesterday that BoJ could have sufficient data by the first quarter of 2024 to assess whether the 2% inflation target could be met sustainably.
Japan’s industrial production slips -2% in Jul, but retail sales resilient
Japan's industrial production took a hit in July, falling by a worse-than-expected -2.0% mom, versus consensus forecast of -1.4% mom. The seasonally adjusted production index stumbled to 103.6, based on 2020 base of 100.
Production was primarily pulled down by substantial drops in electronic parts and devices, which declined -by 5.1% mom. Also, production machinery output shrank by -4.8% mom, with semiconductor manufacturing equipment segment plunging a stark 16.4% mom. However, not all was grim. Production of automobiles showed a modest uptick of 0.6% mom, attributed to the easing of supply chain bottlenecks.
A Ministry of Economy, Trade, and Industry official remarked that the slump in output across various sectors was largely due to diminishing domestic and overseas orders. Consequently, METI has revised its assessment of industrial output from "showing signs of moderately picking up" to "fluctuated indecisively."
Despite the grim industrial landscape, manufacturers surveyed by METI are optimistic, projecting a 2.6% rise in output for August and a 2.4% increase in September.
In contrast to the industrial sector's lackluster performance, retail sales exhibited considerable strength. Sales surged 6.8% yoy in July, beating expectations of a 5.4% yoy increase. This marks the 17th consecutive month of expansion since March 2022. Additionally, retail sales increased 2.1% mom in July, recovering from a -0.6% mom decline in the previous month.
NZD/USD Could Struggle Near 0.6000, US NFP Next
Key Highlights
- NZD/USD is facing resistance near 0.6000 and 0.6020.
- It broke a major bearish line with resistance near 0.5935 on the 4-hour chart.
- EUR/USD recovered above the 1.0880 resistance zone.
- The US nonfarm payrolls could increase by 170K in August 2023.
NZD/USD Technical Analysis
The New Zealand Dollar extended its decline below the 0.6050 level against the US Dollar. AUD/USD even broke the 0.6000 level to move further into a bearish zone.
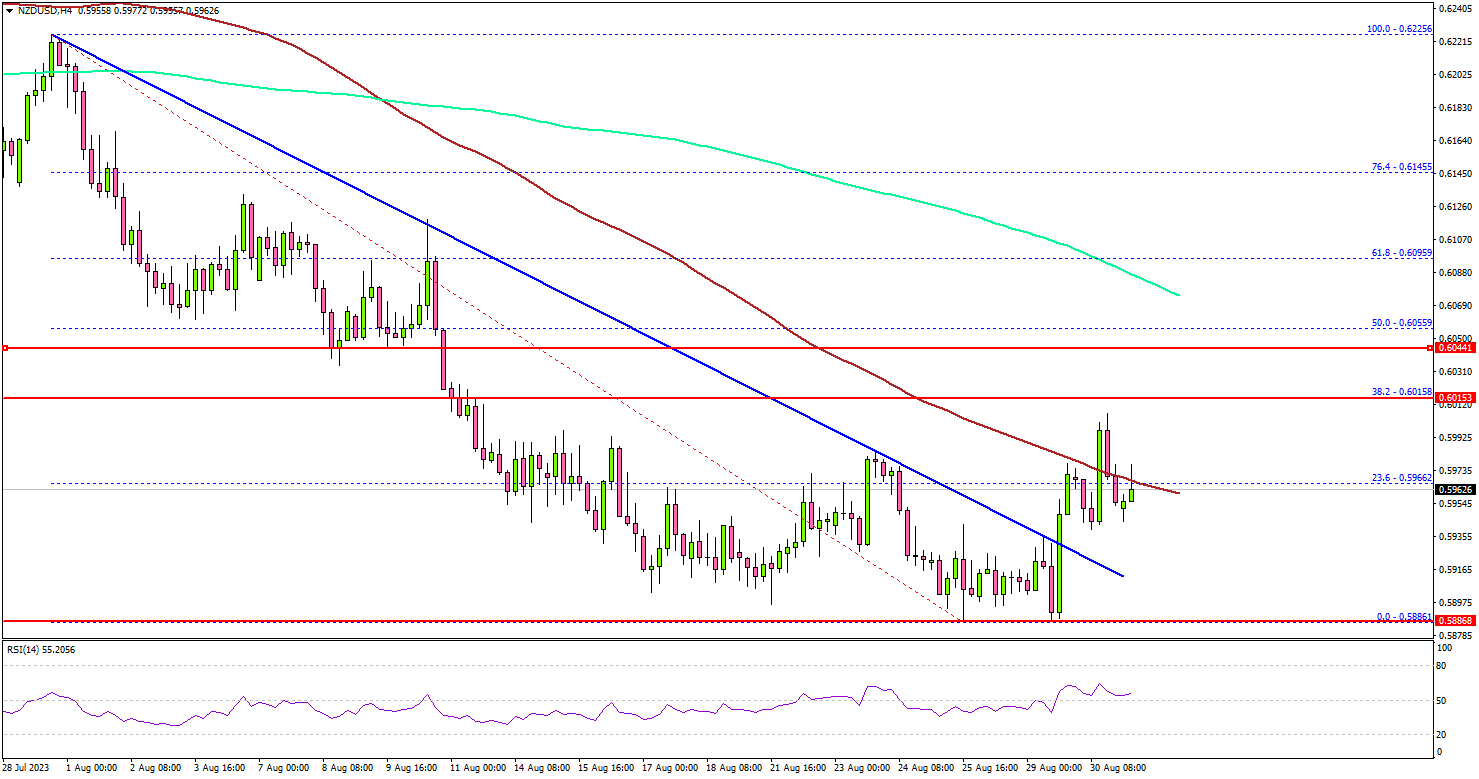
Looking at the 4-hour chart, the pair settled below the 0.6000 level, the 100 simple moving average (red, 4 hours) and the 200 simple moving average (green, 4 hours).
The pair tested the 0.5885 zone. A low was formed near 0.5886 and the pair is now attempting a recovery wave. It broke the 23.6% Fib retracement level of the downward move from the 0.6225 swing high to the 0.5886 low.
Besides, NZD/USD broke a major bearish line with resistance near 0.5935 on the same chart. On the upside, an initial resistance is near the 0.5975 level and the 100 simple moving average (red, 4 hours).
The first major resistance is near the 0.6000 level or the 38.2% Fib retracement level of the downward move from the 0.6225 swing high to the 0.5886 low.
A close above 0.6000 could start a decent increase. In the stated case, the pair could rise toward the 0.6050 level. Any more gains could send the pair toward the 0.6120 level.
If not, the pair might start a fresh decline below the 0.5940 support. The next key support is seen near the 0.5885 level. If there is a move below 0.5885, the pair could dive toward 0.5820.
Looking at EUR/USD, the pair is gaining pace and is currently eyeing a move above the 1.0940 level in the near term.
Economic Releases
- Germany’s Manufacturing PMI for August 2023 - Forecast 39.1, versus 39.1 previous.
- Euro Zone Manufacturing PMI for August 2023 – Forecast 43.7, versus 43.7 previous.
- UK Manufacturing PMI for August 2023 – Forecast 42.5, versus 42.5 previous.
- US ISM Manufacturing PMI for August 2023 – Forecast 47.0, versus 46.4 previous.
- US nonfarm payrolls for August 2023 – Forecast 170K, versus 187K previous.
- US Unemployment Rate for August 2023 - Forecast 3.5%, versus 3.5% previous.