

Sample Category Title
USD/CHF Daily Outlook
Daily Pivots: (S1) 0.8753; (P) 0.8806; (R1) 0.8837; More....
USD/CHF's retreat from 0.8874 extended lower but stays above 0.8758 support. Intraday bias remains neutral first and further rally remains in favor to continue. On the upside, break of 0.8874 will resume the rise from 0.8551 to 0.9146 cluster resistance next. Nevertheless, break of 0.8758 will turn bias back to the downside for 0.8688 support and below.
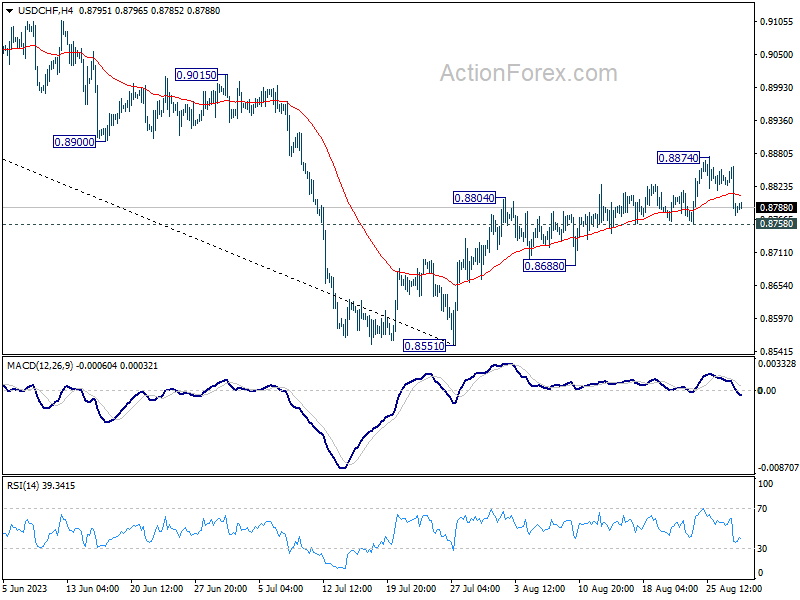
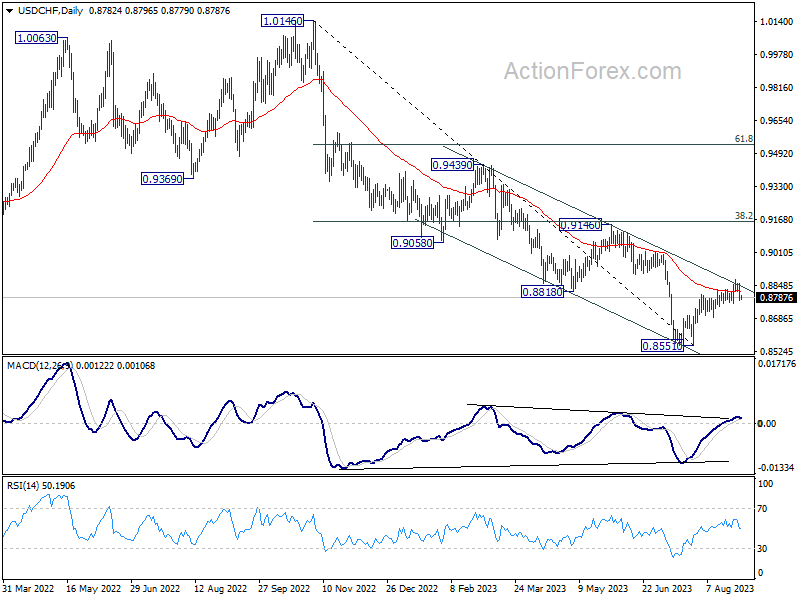
In the bigger picture, rebound from 0.8551 medium term bottom is currently seen as a correction to the downtrend from 1.0146 (2022 high). Further rally would be seen to 0.9146 cluster resistance (38.2% retracement of 1.0146 to 0.8551 at 0.9160). Strong resistance could be seen there to limit upside, at least on first attempt. Nevertheless, medium term outlook is neutral at best as long as 0.8551 holds, until further developments.
Dollar Rally Faltered, With Focus Turning to ADP Jobs
Dollar's attempted rally quickly reversed overnight, following disappointing consumer confidence data. Interestingly, equities gained on what some market participants are calling a "bad news is good news" factor. The logic here is that Fed is now less likely to raise interest rates again this year, thereby giving stocks a lift, as Treasury yields also took a dip. However, it's worth noting that there hasn't been a sustained selloff in the greenback as market attention is largely focused on the impending non-farm payroll and PCE inflation data due this Friday. Meanwhile, today's ADP private job data might still trigger some market reactions.
Australian Dollar is emerging as the week's best performer for now, largely ignoring the lower-than-expected monthly CPI data. It is followed closely by the New Zealand Dollar, buoyed by an overall positive risk sentiment. Euro and Swiss Franc have also firmed up, benefiting from Dollar's momentary stumble. For now, Dollar, Yen, and Canadian Dollar are the laggards in currency markets.
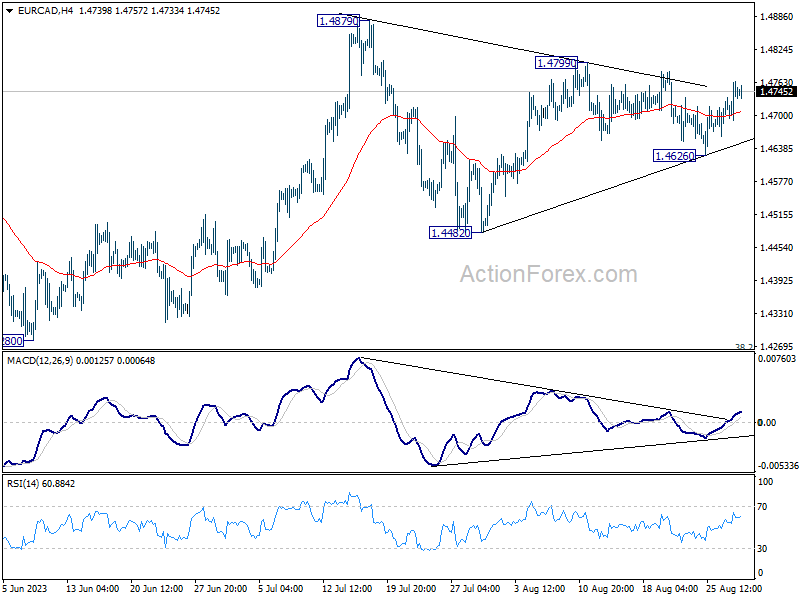
Technically, EUR/CAD is worth a watch in the next few days, with focus on 1.4799 resistance. Firm break there would argue that corrective pattern from 1.4879 has completed, and further rally could then be seen through 1.4879 to resume whole rise from 1.4280. On the other hand, break of 1.4626 support will extend the pattern from 1.4879 with another fall through 1.4482. The next move would be a reaction to either Eurozone CPI flash or Canada GDP, or both.
In Asia, at the time of writing, Nikkei rose 0.33%. Hong Kong HSI is up 0.37%. China Shanghai SSE is up 0.07%. Singapore Strait Times is up 0.16%. Japan 10-year JGB yield rose 0.011 to 0.658. Overnight, DOW rose 0.85%. S&P 500 rose 1.45%. NASDAQ rose 1.74%. 10 year yield dropped -0.090 to 4.122.
Australian CPI eases more than expected to 4.9% in July
Australia's monthly CPI for July registered a deeper than expected slowdown, easing from 5.4% yoy to 4.9% yoy. Analysts had forecasted a milder decline to 5.2% yoy. The underlying inflation measures also indicated a deceleration. CPI excluding volatile items such as holiday travel came in at 5.8% yoy, down from 6.1% yoy. The trimmed mean CPI, which is often regarded as a more accurate reflection of inflationary pressures, slowed from 6.0% yoy to 5.6% yoy.
A closer look at the inflation contributors reveals a mixed picture. Housing costs remained a significant upward pressure, climbing 7.3% on an annual basis. Food and non-alcoholic beverages followed closely, rising by 5.6% yoy. However, this was offset by substantial price falls in other areas. Automotive fuel costs dropped by -7.6%, while fruit and vegetable prices declined by -5.4%, thus tempering the overall July increase.
The latest CPI data comes on the heels of yesterday's hawkish comments from incoming RBA Governor Michele Bullock, who emphasized that her first priority is still to maintain a focus on bringing inflation back down to target. Today's lower-than-expected inflation figures might lend some flexibility to RBA's policy approach, but with sectors like housing and food still exhibiting strong price pressures, the central bank's task appears far from straightforward.
BoJ's Tamura eyes next Q1 for decisive inflation data for policy shifts
BoJ board member Naoki Tamura offered insights into the timeline for potentially phasing out the central bank's ultra-accommodative stance. he signaled that by the first quarter of 2024, BoJ could gather sufficient data to evaluate whether the 2% inflation target could be sustainably achieved.
"It's appropriate at this stage to sustain monetary easing, and earnestly scrutinize wage and price developments," Tamura said, adding that he is hopeful for "further clarity" on the inflation target "around January through March next year" through wage and price data available by that time.
Tamura anticipates that Japan's inflation could slow down for the time being, only to moderately accelerate later. This coincides with his expectation of high wage growth in the next year's spring wage negotiations.
Tamura emphasized that the "biggest key to monetary policy outlook is whether Japan achieves a positive cycle of rising wages and inflation."
Bitcoin soars after Grayscale's legal win, now pressing 55 D EMA
In a notable development for cryptocurrency enthusiasts and investors, Bitcoin experienced a significant surge overnight, pulling other cryptocurrencies higher in its wake. This rally was triggered by Grayscale's key legal victory against the US Securities and Exchange Commission in its bid to launch a Bitcoin exchange-traded fund. The favorable ruling could pave the way for the SEC's approval of other Bitcoin ETF applications, thereby providing the cryptocurrency industry with access to a new pool of retail investor capital.
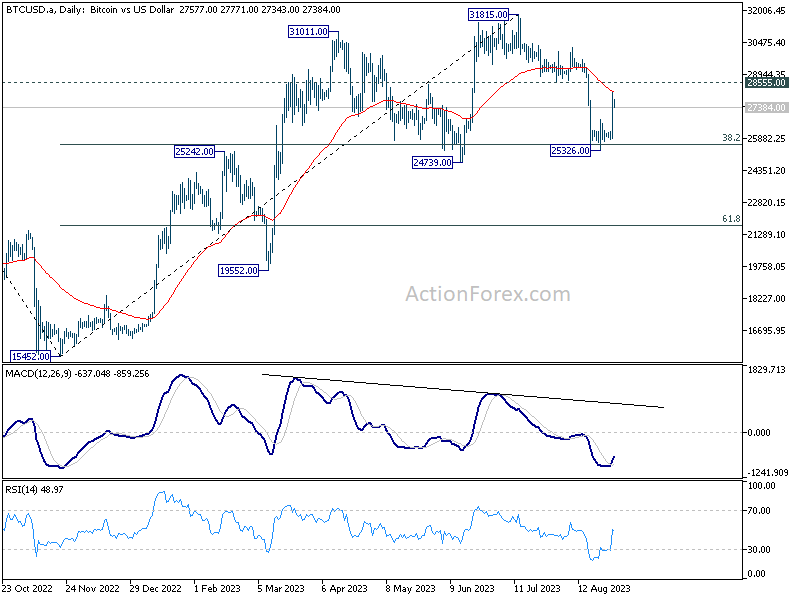
From a technical perspective, Bitcoin's strong bounce suggests that cluster support zone around 25k is defended well for now. This support zone comprises various key levels, including 24739 support, 25242 resistance-turned-support, and more importantly 38.2% retracement of 15452 to 31815 at 25564.
The overnight activity implies that recent price actions from 31815 may simply represent sideways consolidation rather than a bearish trend. It suggests that the medium-term rise from 15452 isn't over just yet.
However, to firmly establish this bullish case, Bitcoin still has hurdles to overcome in the near term. Specifically, it will need to break through the 55 D EMA, currently at 28173, and 28555 support-turned-resistance.
Looking ahead
Swiss will release KOF economic barometer and Credit Suisse economic expectations. Eurozone will release economic sentiment indicator. Germany will release CPI flash.
Later in the day, US will publish ADP job, goods trade balance, pending home sales and Q2 GDP revision.
USD/CHF Daily Outlook
Daily Pivots: (S1) 0.8753; (P) 0.8806; (R1) 0.8837; More....
USD/CHF's retreat from 0.8874 extended lower but stays above 0.8758 support. Intraday bias remains neutral first and further rally remains in favor to continue. On the upside, break of 0.8874 will resume the rise from 0.8551 to 0.9146 cluster resistance next. Nevertheless, break of 0.8758 will turn bias back to the downside for 0.8688 support and below.
In the bigger picture, rebound from 0.8551 medium term bottom is currently seen as a correction to the downtrend from 1.0146 (2022 high). Further rally would be seen to 0.9146 cluster resistance (38.2% retracement of 1.0146 to 0.8551 at 0.9160). Strong resistance could be seen there to limit upside, at least on first attempt. Nevertheless, medium term outlook is neutral at best as long as 0.8551 holds, until further developments.
Economic Indicators Update
| GMT | Ccy | Events | Actual | Forecast | Previous | Revised |
|---|---|---|---|---|---|---|
| 22:45 | NZD | Building Permits M/M Jul | -5.20% | 3.50% | 3.40% | |
| 01:30 | AUD | Monthly CPI Y/Y Jul | 4.90% | 5.20% | 5.40% | |
| 01:30 | AUD | Building Permits M/M Jul | -8.10% | -0.50% | -7.70% | -7.90% |
| 05:00 | JPY | Consumer Confidence Index Aug | 36.2 | 37.5 | 37.1 | |
| 06:00 | EUR | Germany Import Price Index M/M Jul | -0.60% | -0.20% | -1.60% | |
| 07:00 | CHF | KOF Economic Barometer Aug | 91.3 | 92.2 | ||
| 08:00 | CHF | Credit Suisse Economic Expectations Aug | -32.6 | |||
| 08:30 | GBP | Mortgage Approvals Jul | 52K | 55K | ||
| 08:30 | GBP | M4 Money Supply M/M Jul | 0.10% | -0.10% | ||
| 09:00 | EUR | Eurozone Economic Sentiment Indicator Aug | 93.9 | 94.5 | ||
| 09:00 | EUR | Eurozone Services Sentiment Aug | 4.2 | 5.7 | ||
| 09:00 | EUR | Eurozone Industrial Confidence Aug | -9.8 | -9.4 | ||
| 09:00 | EUR | Eurozone Consumer Confidence Aug F | -16 | -16 | ||
| 12:00 | EUR | Germany CPI M/M Aug P | 0.30% | 0.30% | ||
| 12:00 | EUR | Germany CPI Y/Y Aug P | 6.00% | 6.20% | ||
| 12:15 | USD | ADP Employment Change Aug | 205K | 324K | ||
| 12:30 | USD | GDP Annualized Q2 P | 2.40% | 2.40% | ||
| 12:30 | USD | GDP Price Index Q2 P | 2.20% | 2.20% | ||
| 12:30 | USD | Goods Trade Balance (USD) Jul P | -90.0B | -87.8B | ||
| 12:30 | USD | Wholesale Inventories Jul P | 0.20% | -0.50% | ||
| 14:00 | USD | Pending Home Sales M/M Jul | -0.40% | 0.30% | ||
| 14:30 | USD | Crude Oil Inventories | -2.2M | -6.1M |
Australia: July Monthly Inflation Softer Than Market Expectations
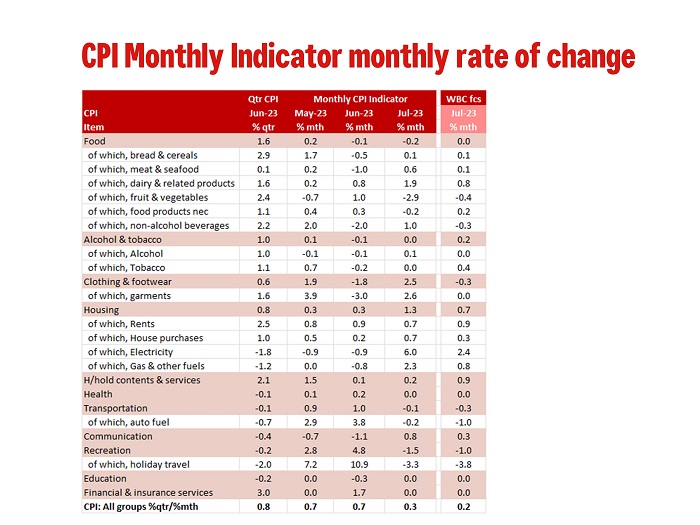
The July Monthly Indicator rose just 4.9%yr (0.3%mth) softer than market expectations but was clost to our 4.8%yr (0.2%mth) forecast. As it is close to our forecast it is unlikely to see us meaningfully revise our Q3 CPI forecast of 1.0%qtr.
The Monthly CPI Indicator printed 0.3%mth/4.9%yr, very close to Westpac’s 0.2%mth/4.8%yr forecast but quite a bit softer than the market’s 5.2%yr forecast.
As expected, electricity presented a key upside risk printing 6.0%mth vs 2.4%mth forecast. Also on the upside was gas & other fuels (2.3%mth vs 0.8%mth forecast), auto fuel (–0.2%mth vs –1.0% forecast), clothing & footwear (2.5%mth vs -0.3% forecast) and dwelling purchases (0.7%mth vs 0.3%mth forecast). All up housing surprised to the upside at 1.3%mth vs 0.7%mth forecast.
Offsetting was falling prices for food (–0.2% vs flat forecast), recreation (–1.5%mth vs –1.0% forecast).
We will process the numbers in more detail and will make any revisions that are necessary, with note to the stronger than expect housing costs but weaker household contents & services. Overall, with a headline print so close to our forecast we doubt any revisions will be significant.
As such it is also consistent with out view that there is no near term pressure for the RBA to increase rates again.
Elliott Wave View: FTSE Rally Expected to Turn Lower
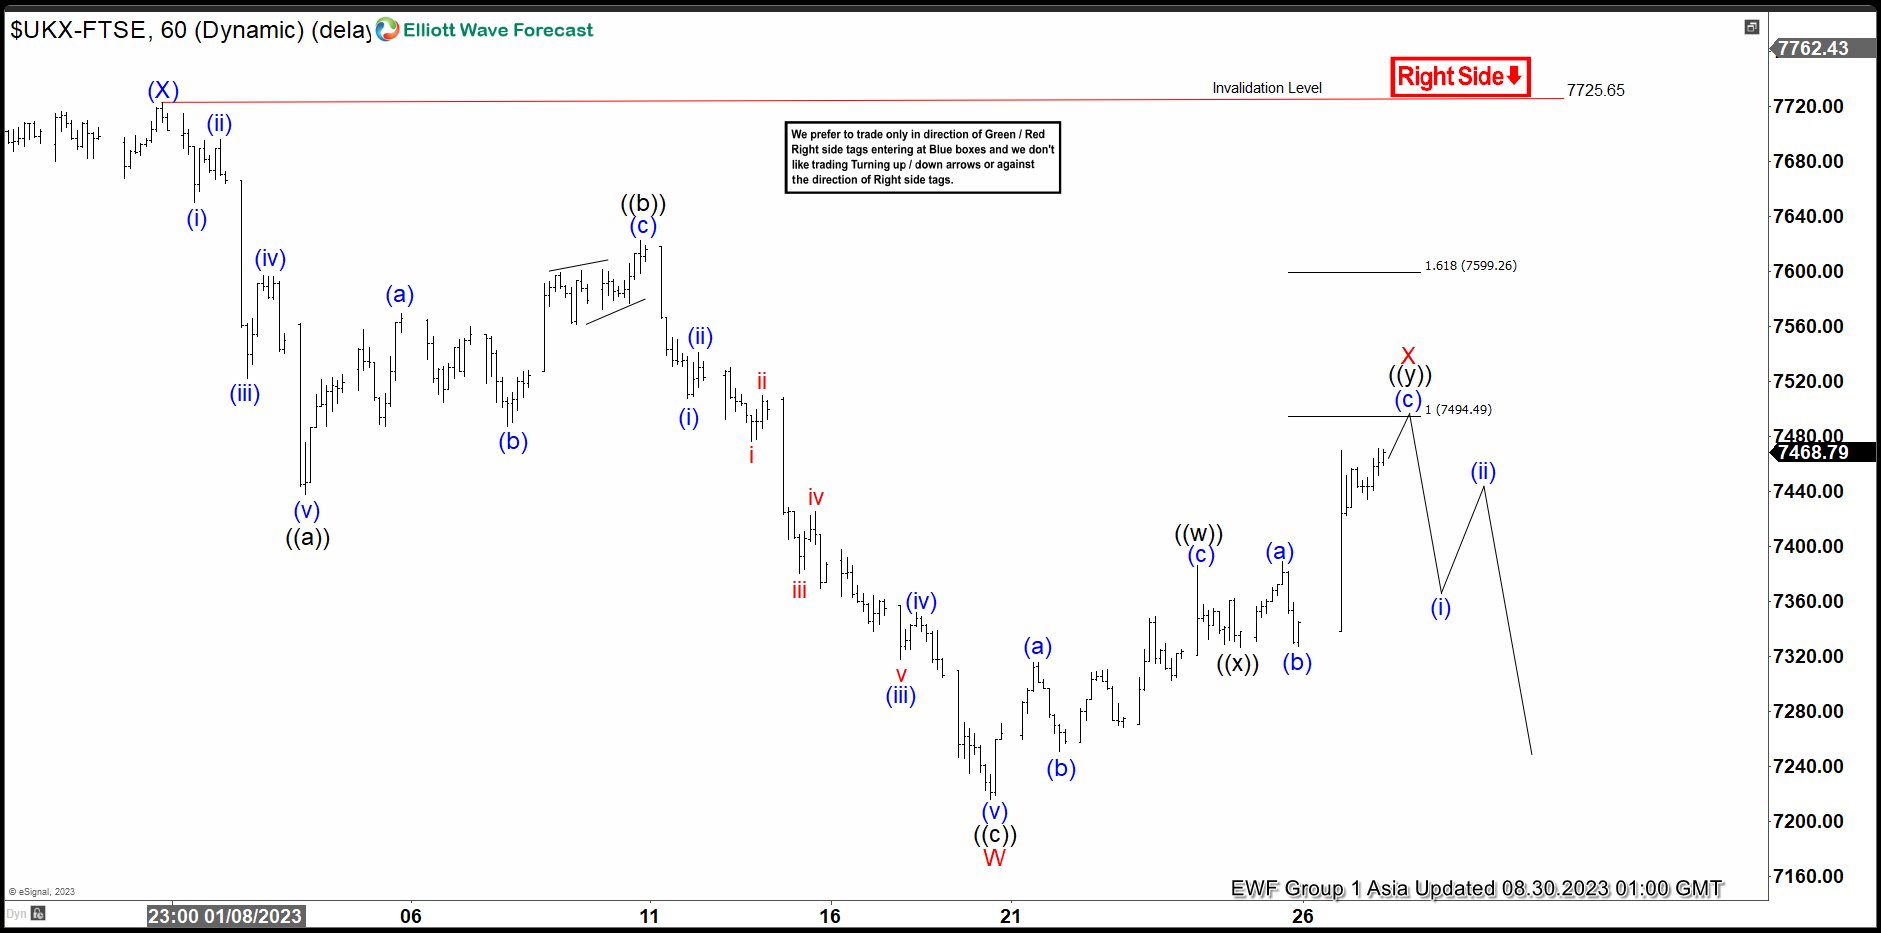
FTSE Index shows a bearish sequence from 4.21.2023 high favoring further downside. The decline from 4.21.2023 high is currently unfolding as a double three Elliott Wave structure. Down from 4.21.2023 high, wave (W) ended at 7229.57 and rally in wave (X) ended at 7725.65. The Index has resumed lower in wave (Y). The internal subdivision of wave (Y) is unfolding as another double three in lesser degree. Down from wave (X), wave ((a)) ended at 7437.88 and rally in wave ((b)) ended at 7622.92. The third leg lower wave ((c)) ended at 7215.76 which completed wave W in higher degree.
Wave X rally is now in progress as a double three. Up from wave W, wave ((w)) ended at 7386.08 and pullback in wave ((x)) ended at 7326.48. Expect wave ((y)) to extend higher towards 7493.79 – 7598.57 area and this should complete wave X in higher degree. Afterwards, Index should turn lower in wave Y. Potential target lower is 100% – 161.8% Fibonacci extension from 2.16.2023 high towards 6560 – 7086.2. Near term, as far as pivot at 7725.65 high stays intact, expect rally to fail in 3, 7, or 11 swing for further downside.
FTSE 60 Minutes Elliott Wave Chart
FTSE Elliott Wave Video
https://www.youtube.com/watch?v=WwHPG_dp4So
Dream JOLTS Data
Yesterday was a typical ‘bad news is good news’ day. Risk sentiment in the US and across the globe was boosted by an unexpected dip in US job openings to below 9 mio jobs in July, the lowest levels since more than two years, and an unexpected fall in consumer confidence in August. The weak data pushed the Federal Reserve (Fed) hawks to the sidelines, and bolstered the expectation of a pause in September, and tilted the probabilities in favour of a no hike in November, as well.
Note that the latest JOLTS data printed the ideal picture for the Fed: Job vacancies eased, but hiring was moderate and the layoffs remained near historically low levels. The data also suggested that the era of Great Resignation, where quit rates hit a record, could be over, as people quitting their jobs retreated to levels last seen before the pandemic. The US 2-year yield dived 15bp, the 10-year yield fell 8bp, while the S&P500 jumped nearly 1.50% to above its 50-DMA and closed the session at a spitting distance from the 4500 level. 90% of the S&P stocks gained yesterday; even the Big Pharma which had a first glance at which medicines will be subject to price negotiations with Medicare held their ground. But of course, tech stocks led the rally, with Nasdaq 100 closing the session with more than a 2% jump. Tesla was one of the biggest gainers of the session with a more than a 7.5% jump yesterday.
US and European futures suggest a bullish open amid the US optimism and news of upcoming deposit and mortgage rate cuts from Chinese banks.
On the data front, all eyes are on the US ADP report and the latest GDP update. The ADP report is expected to reveal below 200K new private job additions in August, while the US growth is expected to be revised from 2% to 2.4% for the Q2 with core PCE prices seen down from 4.90% to 3.80%. If the data is in line with expectations, we shall see yesterday’s optimism continue throughout today. Again, what we want is to see – in the order of importance: 1. Slowing price pressure, 2. Looser, but still healthy jobs market, 3. Slowing but not contracting economy to ensure a soft landing. We will see if that’s feasible.
In Europe, however, that slow landing seems harder to achieve. Today, investors will keep an eye on the latest inflation updates from euro-area countries, and business and sentiment surveys. We expect to see some further red flags regarding the health of the European economy due to tighter financial conditions in Europe and the energy crisis. German Chamber of Commerce and Industry warned yesterday that German businesses are cutting investments and move production abroad due to high energy prices at home. The EURUSD flirted with 1.09 yesterday, as investors trimmed their long dollar positions after the weak JOLTS data. The AUDUSD rebounded, even though the latest CPI print showed that inflation in Australia slowed below 5% in July, a 17-month low. In the UK, shop prices fell to a 10-month low. But it won’t be enough for central bankers to cry victory just yet, because the positive pressure in energy prices remains a major concern for the months ahead. The barrel of American crude is pushing toward the $82pn level, with improved trend and momentum dynamics hinting that the bullish development could further extend.
Technical Outlook and Review
DXY:
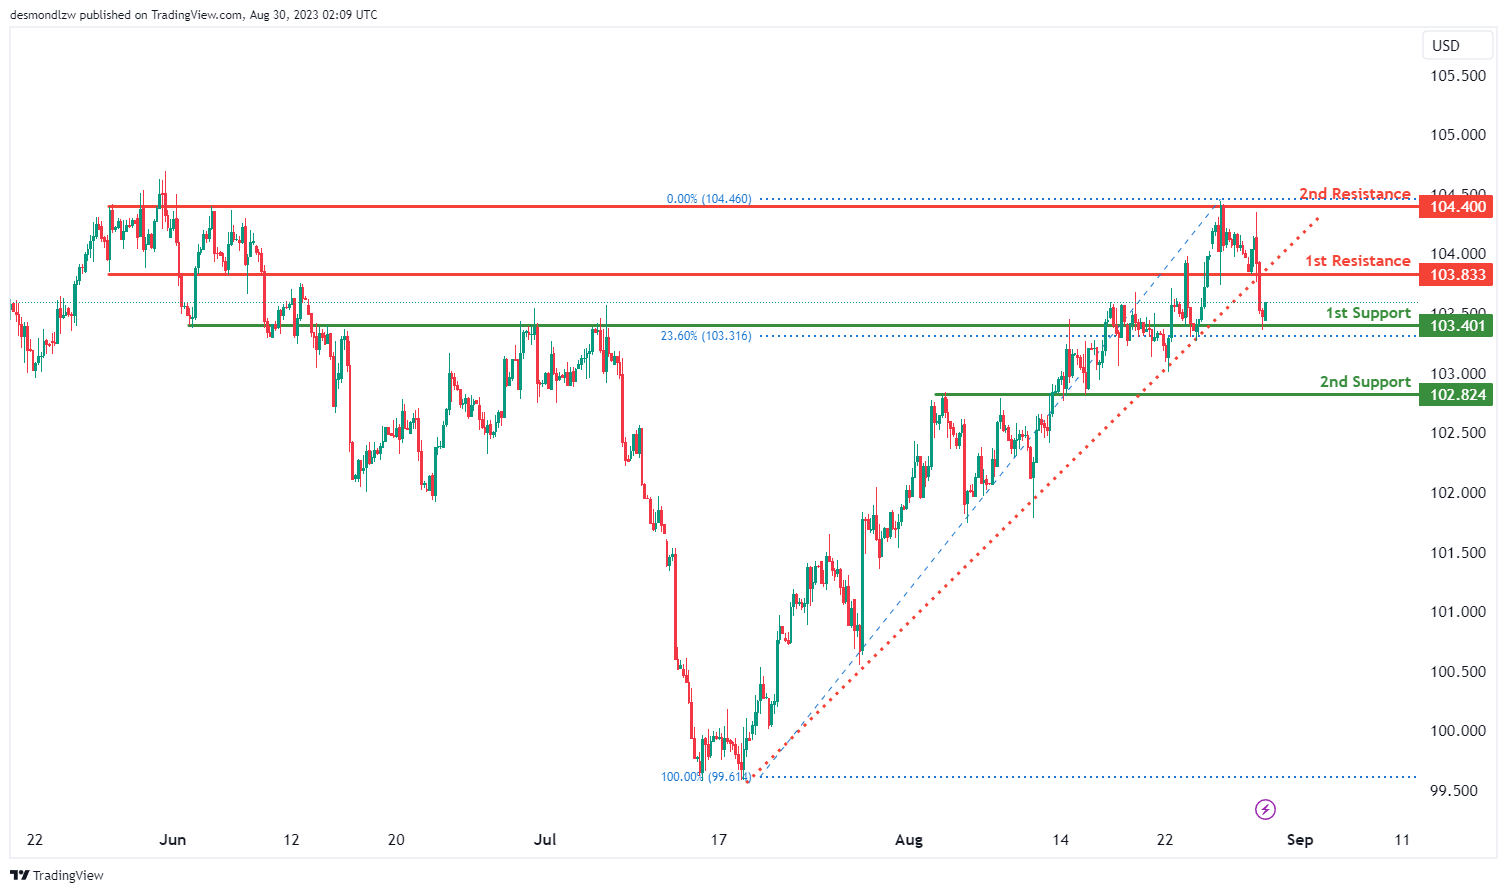
The DXY (US Dollar Index) chart is currently characterized by a bearish momentum, attributed to its break below an ascending support line, indicating the potential for a downward price movement. In this context, the chart could potentially witness a decline towards the 1st support level at 103.40. This level holds significance as an overlap support, backed by historical instances of price finding support in this region.
Further reinforcing potential support, the 2nd support level at 102.82 also serves as an overlap support, suggesting its importance in historical price action. These levels may act as foundations for a short-term drop.
On the flip side, the 1st resistance at 103.83 is marked as a pullback resistance, which might serve as a hurdle for any potential short-term upward correction.
Additionally, the 2nd resistance at 104.40 is identified as a multi-swing high resistance, signifying its historical role as a barrier against upward movements.
EUR/USD:
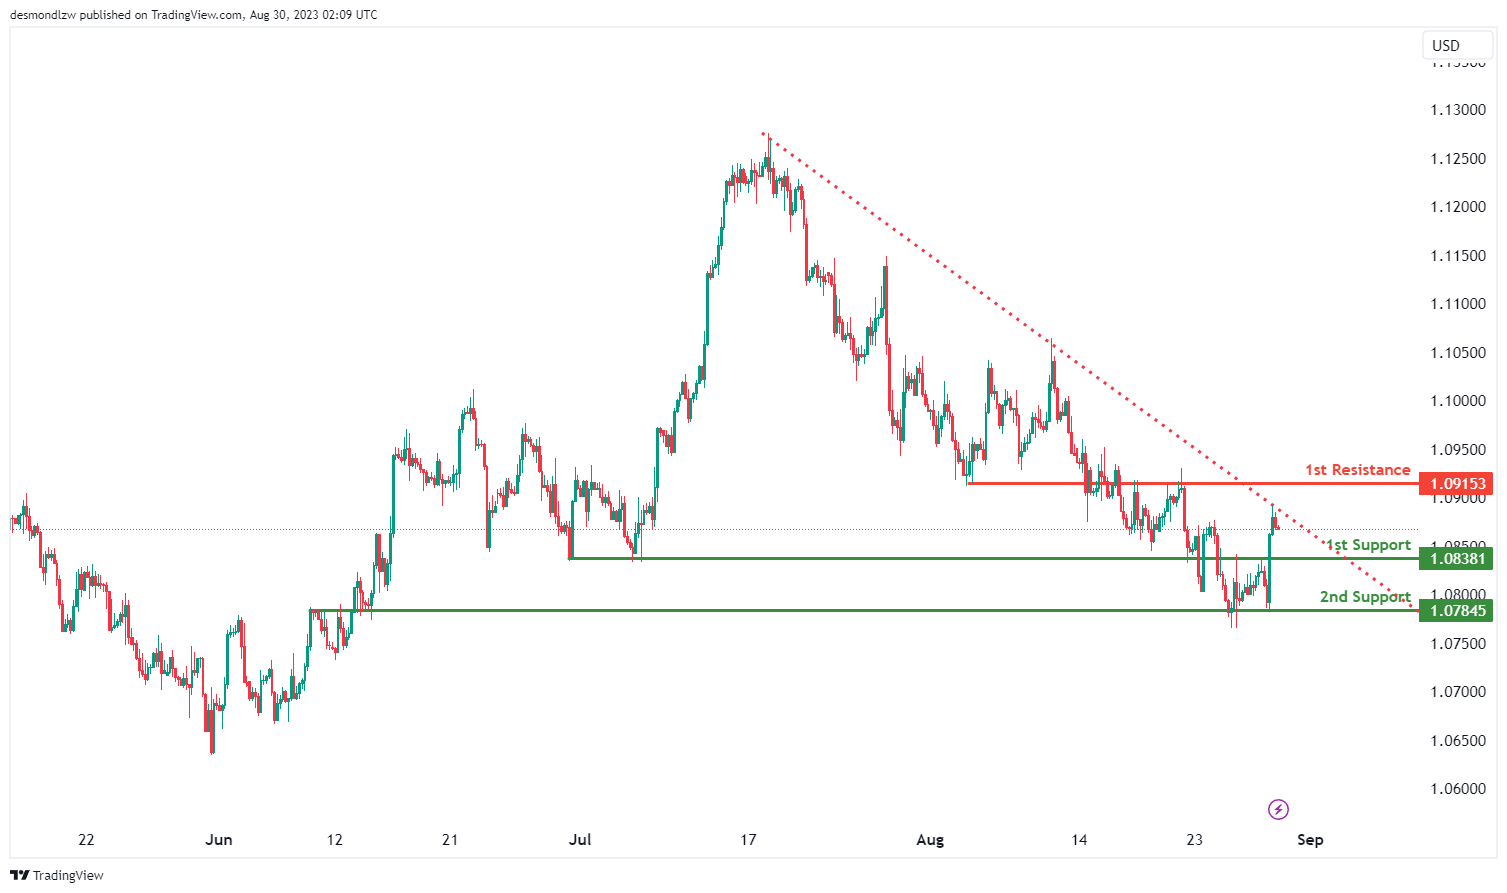
The EUR/USD chart currently exhibits a bearish momentum, primarily influenced by the fact that the price is positioned below a significant descending trend line, indicating a likelihood of further bearish movement. In this context, there’s potential for a short-term upward movement towards the 1st resistance level at 1.0915, followed by a potential reversal off this level, leading to a subsequent drop towards the 1st support level.
The 1st support level at 1.0838 is considered a pullback support, suggesting that historical price action has shown support around this region during pullbacks or corrections.
In addition, the 2nd support level at 1.0784 is marked as an overlap support, indicating its historical significance in terms of providing a base for potential price movements.
On the upside, the 1st resistance at 1.0915 is identified as an overlap resistance, signifying historical instances of price encountering resistance in this area. Traders often monitor these levels for potential price reactions.
EUR/JPY:
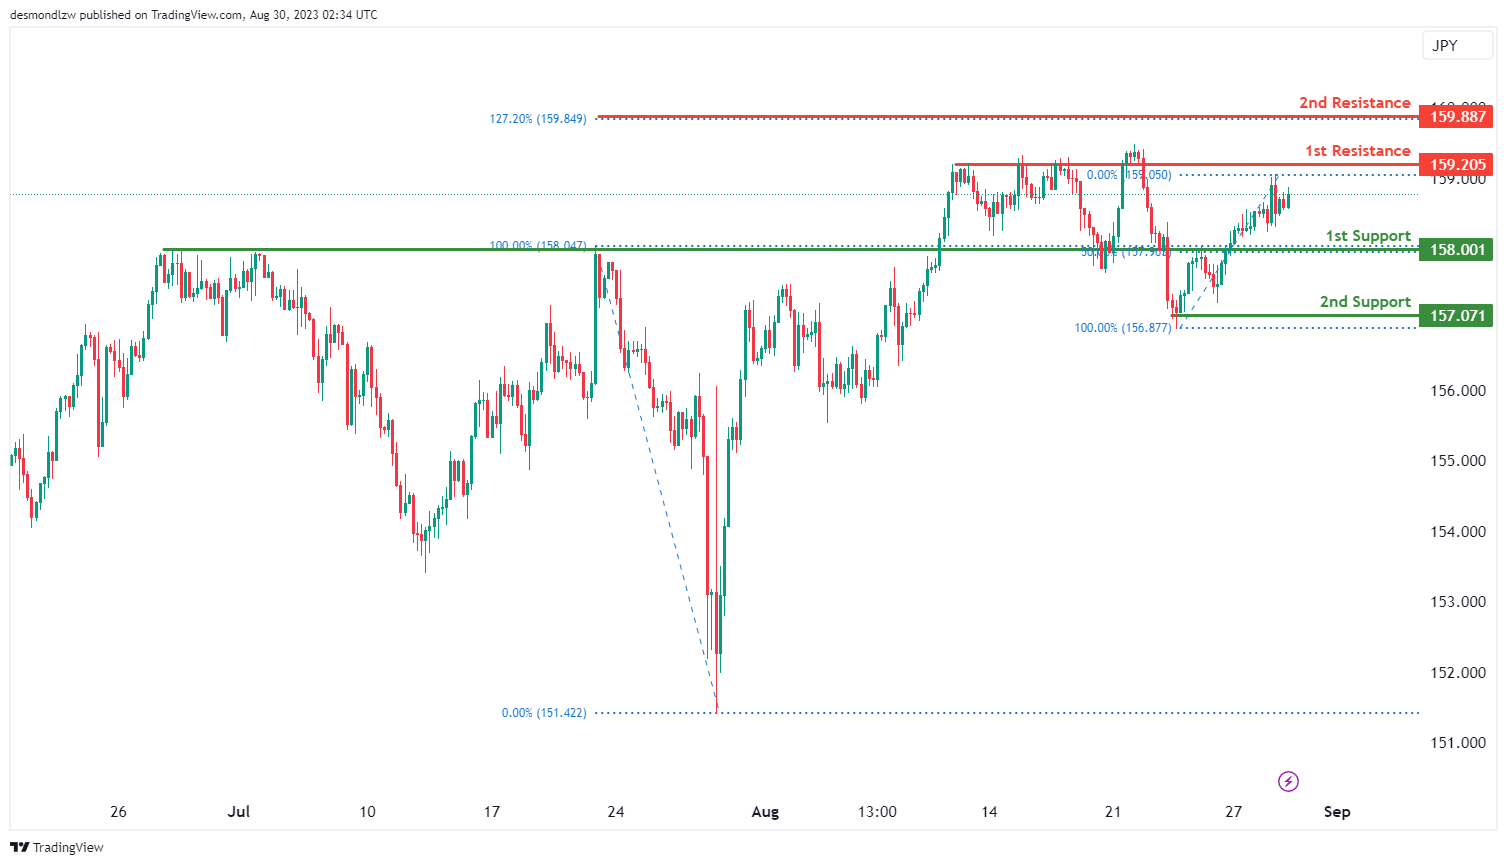
For EUR/JPY, the chart shows a bullish overall momentum.
The 1st support level at 158.00 is an overlap support, indicating potential buying interest at this level. It’s also aligned with the 50% Fibonacci retracement, adding to its significance.
The 2nd support level at 157.07 is a multi-swing low support, further suggesting its importance as a potential area of buying activity.
On the resistance side, the 1st resistance level at 159.20 is an overlap resistance, which might act as a barrier to upward movement.
The 2nd resistance level at 159.88 is particularly interesting as it’s a 127% Fibonacci extension, implying that this level could be a target for bullish momentum.
EUR/GBP:
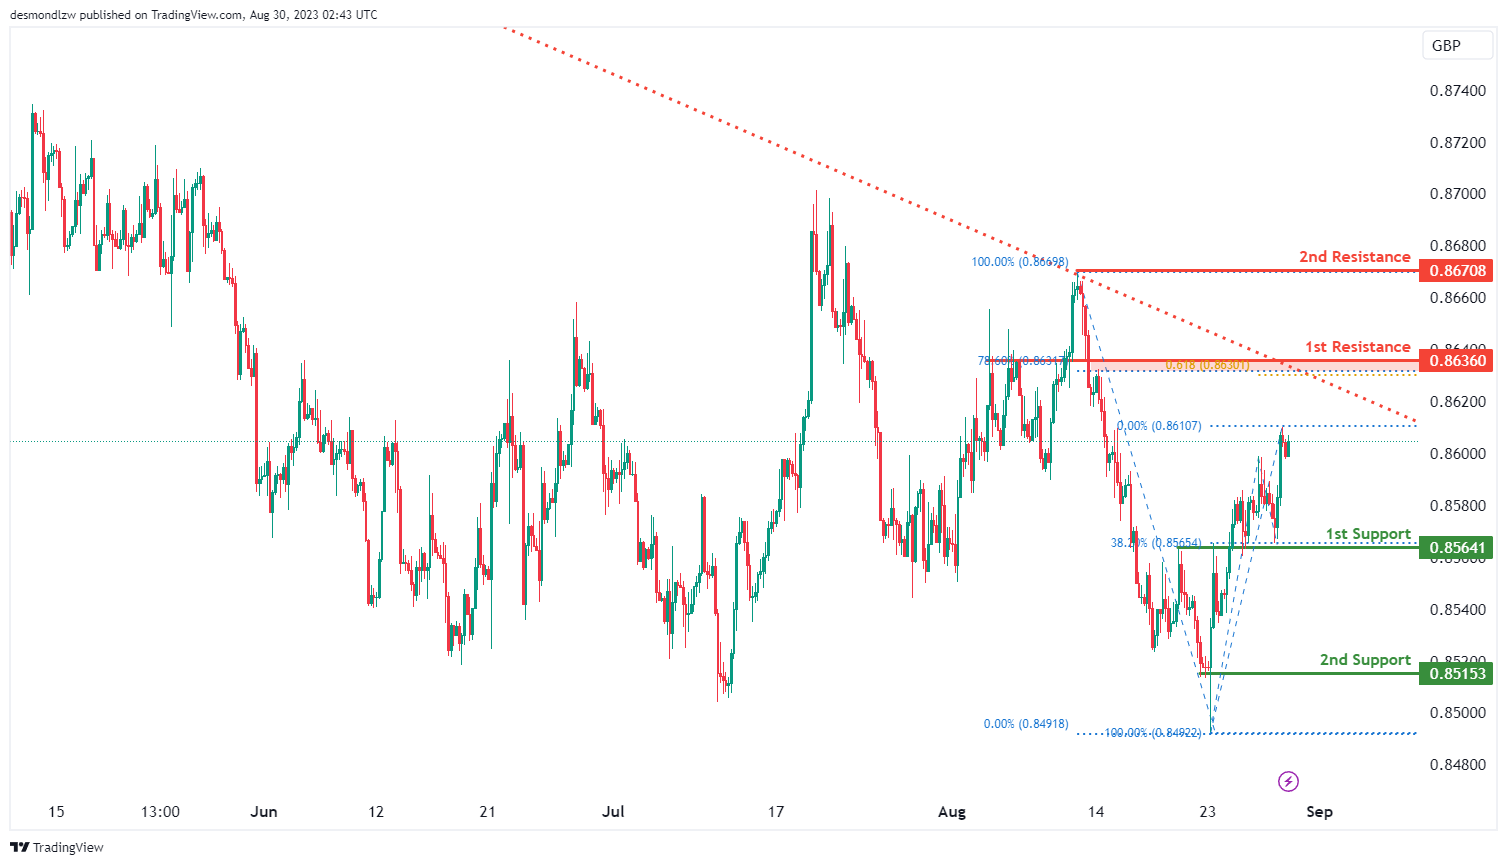
For EUR/GBP, the chart indicates a bullish overall momentum.
The 1st support level at 0.8564 is an overlap support and also coincides with the 38.20% Fibonacci retracement, suggesting potential buying interest at this level.
The 2nd support level at 0.8515 is a swing low support, which could reinforce its significance as a potential area where buyers might step in.
On the resistance side, the 1st resistance level at 0.8636 is an overlap resistance. Moreover, it aligns with both the 78.60% Fibonacci retracement and the 61.80% Fibonacci projection, indicating strong potential for resistance at this level.
The 2nd resistance level at 0.8670 is a swing high resistance, which could further add to its importance as a potential barrier for bullish movement.
GBP/USD:
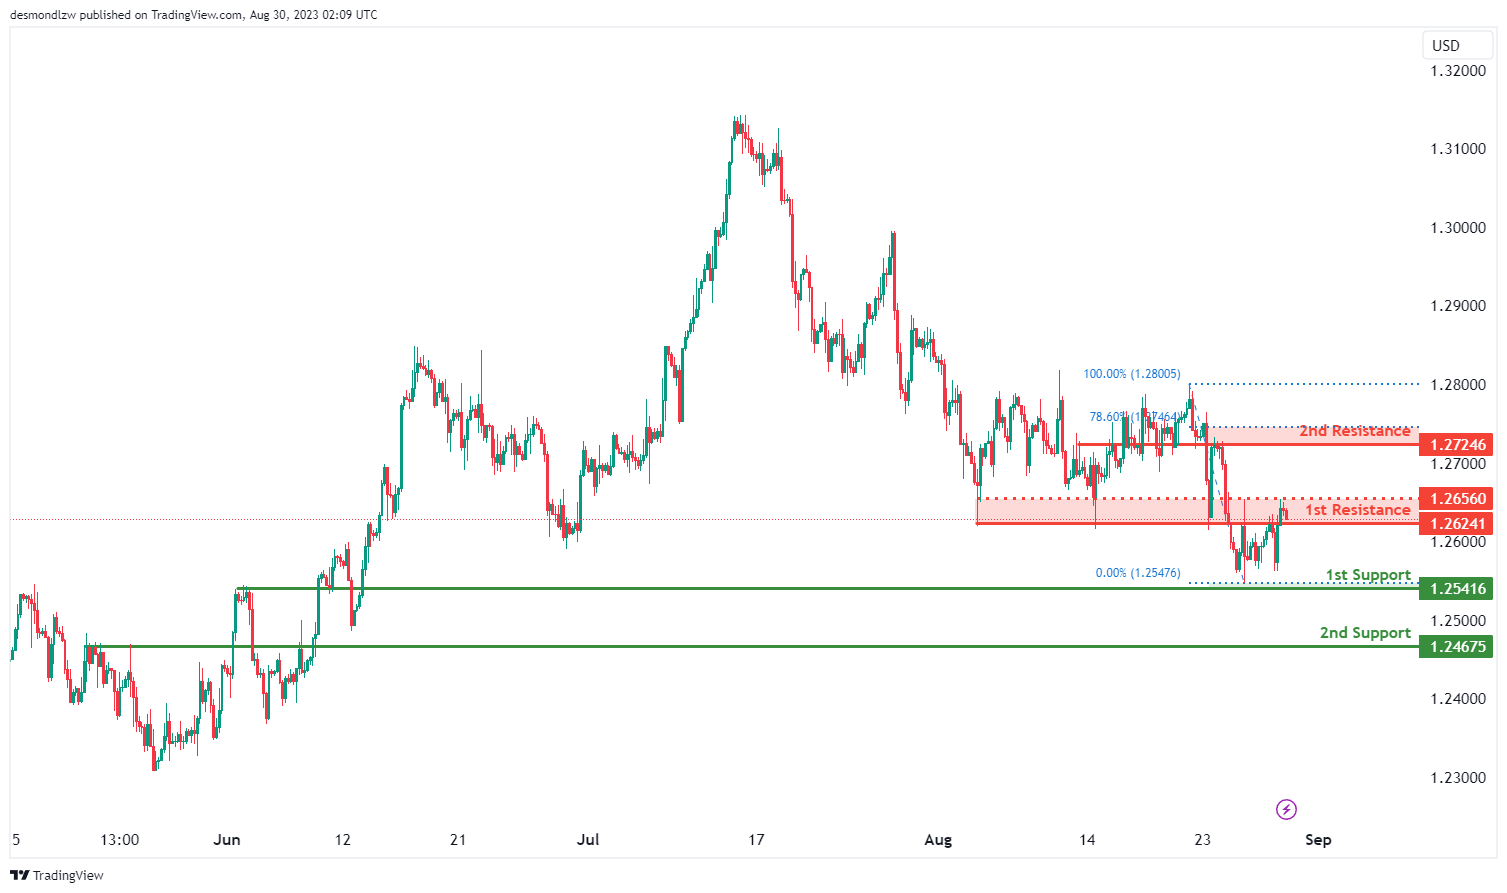
The GBP/USD chart is currently displaying a bearish overall momentum, signaling a downward trend in the price. Within this context, there’s potential for the price to continue its bearish movement and potentially target the 1st support level.
The 1st support at 1.2541 is identified as an overlap support, indicating that historical price action has found support around this level. This level is a significant consideration as it provides a potential base for the price to stabilize or rebound.
The 2nd support level at 1.2467 is classified as a pullback support, suggesting that it aligns with the concept of pullbacks or corrections within the larger downtrend.
On the upside, the 1st resistance level at 1.2624 is marked as an overlap resistance, signifying historical instances where the price has encountered resistance in this region.
Furthermore, the 2nd resistance at 1.2724 is also considered an overlap resistance and is noteworthy due to its alignment with the 78.60% Fibonacci Retracement level. This confluence adds to the potential significance of this level as a barrier to further bullish movement.
GBP/JPY:
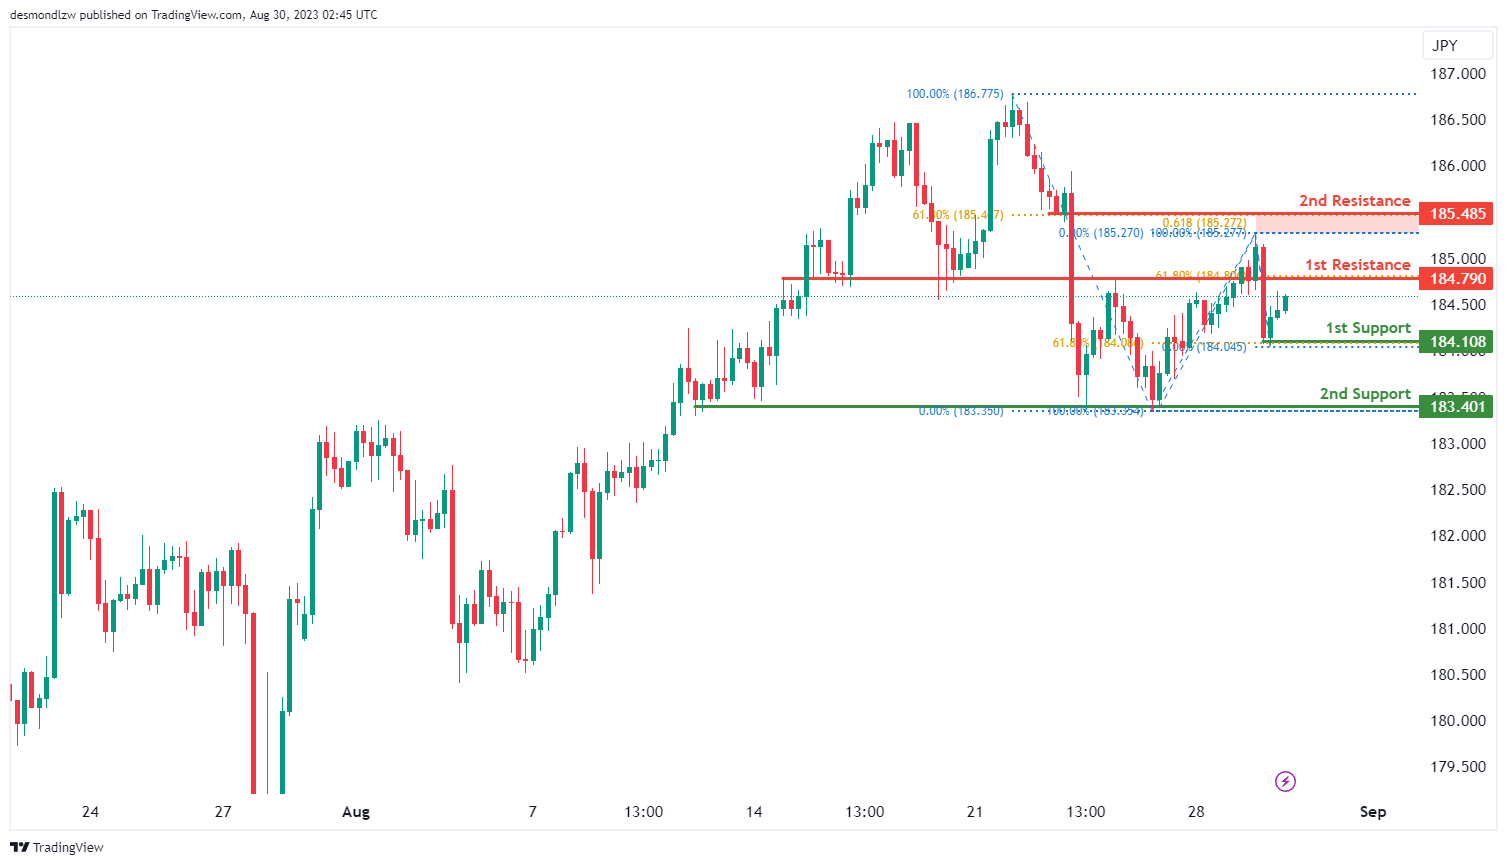
For GBP/JPY, the chart indicates a bullish overall momentum.
The 1st support level at 184.10 is a swing low support and coincides with the 61.80% Fibonacci retracement, suggesting that this level could act as a strong support area.
The 2nd support level at 183.40 is a multi-swing low support, which could provide additional reinforcement to its potential as a support zone.
On the resistance side, the 1st resistance level at 184.79 is an overlap resistance and aligns with the 61.80% Fibonacci retracement. This level could present a significant hurdle for further bullish movement.
The 2nd resistance level at 185.48 is a swing high resistance, and it also coincides with both the 61.80% Fibonacci retracement and the 61.80% Fibonacci projection. This confluence of Fibonacci levels makes it a noteworthy resistance level.
USD/CHF:
The USD/CHF chart is currently exhibiting a bullish overall momentum, indicating an upward trend in the price movement. Within this context, there’s potential for the price to experience a bullish bounce off the 1st support level and potentially move towards the 1st resistance.
The 1st support level at 0.8771 is identified as an overlap support, signifying that historical price action has found support around this level. This level is significant as it could act as a base for potential upward movements.
Similarly, the 2nd support level at 0.8710 is also considered an overlap support, adding further weight to its potential as a support zone.
On the upside, the 1st resistance level at 0.8825 is noted as a pullback resistance. This suggests that historical price action might encounter resistance around this area, potentially causing a short-term pullback.
The 2nd resistance at 0.8866 is characterized as a multi-swing high resistance. This level could be an important target for the bullish movement if the price continues to gain momentum.

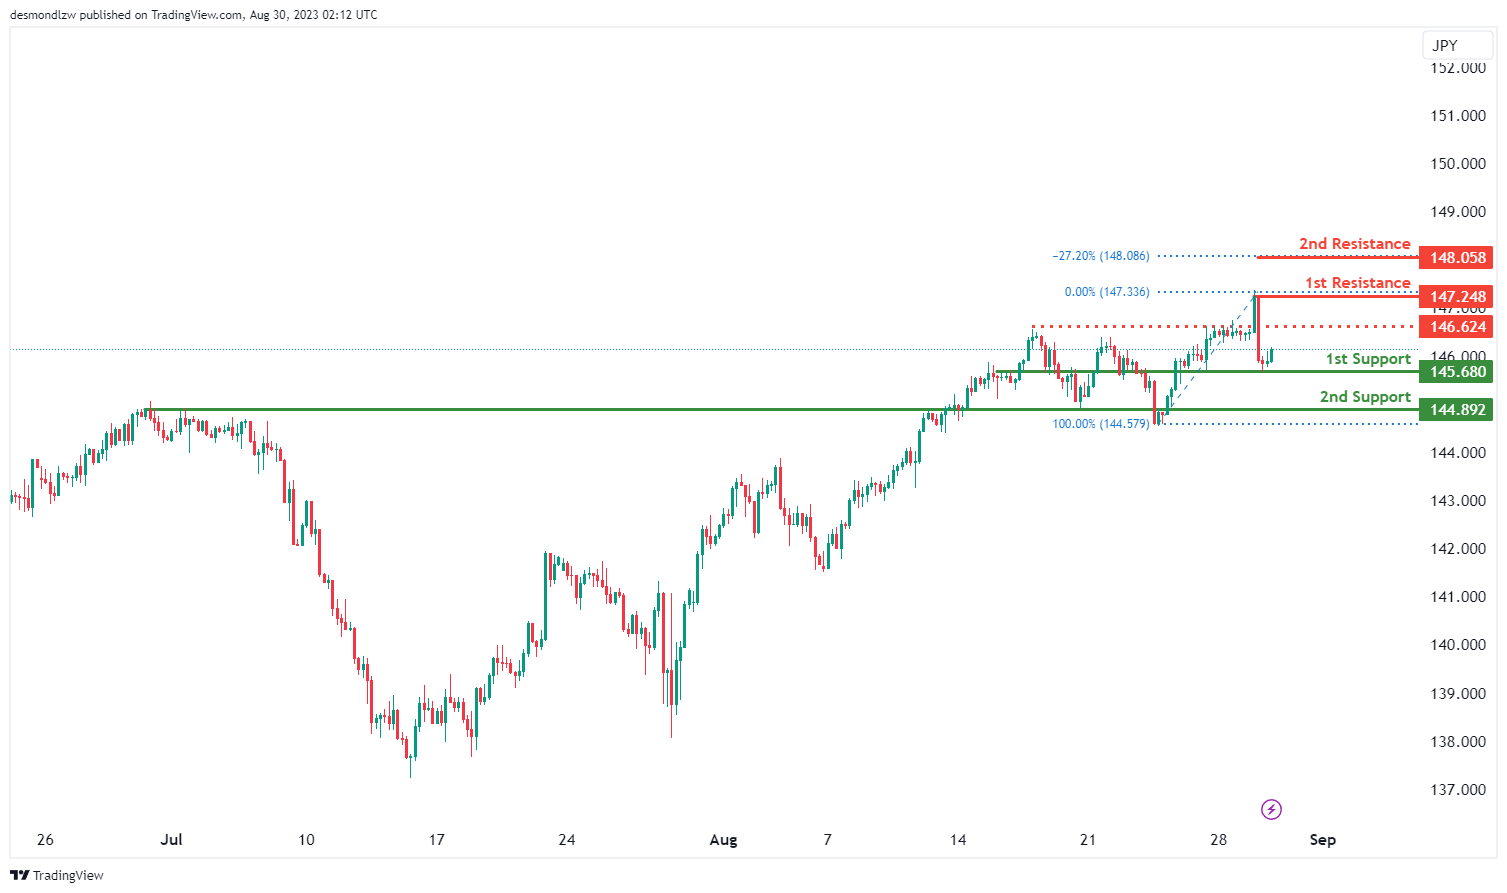
USD/JPY:
The USD/JPY chart is currently demonstrating a bullish overall momentum, indicating an upward trend in the price movement. There’s a potential for the price to experience a bullish continuation towards the 1st resistance level.
The 1st support level at 145.68 is identified as an overlap support, indicating historical instances where the price found support around this level. This level serves as a potential foundation for upward movements.
Similarly, the 2nd support level at 144.89 is considered a pullback support. This level might act as a stronger support zone, considering its alignment with the pullback nature and its significance in previous price action.
On the upside, the 1st resistance level at 147.24 is noted as a swing high resistance. This suggests that the price has previously encountered resistance around this area, potentially causing a temporary pause or reversal in the bullish momentum.
The 2nd resistance level at 148.05 is significant as it aligns with the -27% Fibonacci Expansion. This confluence suggests that this level could serve as a potential target for the bullish move if the price continues to gain momentum.
An intermediate resistance at 146.62, marked as a pullback resistance, also adds to the potential resistance areas that the price might encounter during its bullish movement.
USD/CAD:
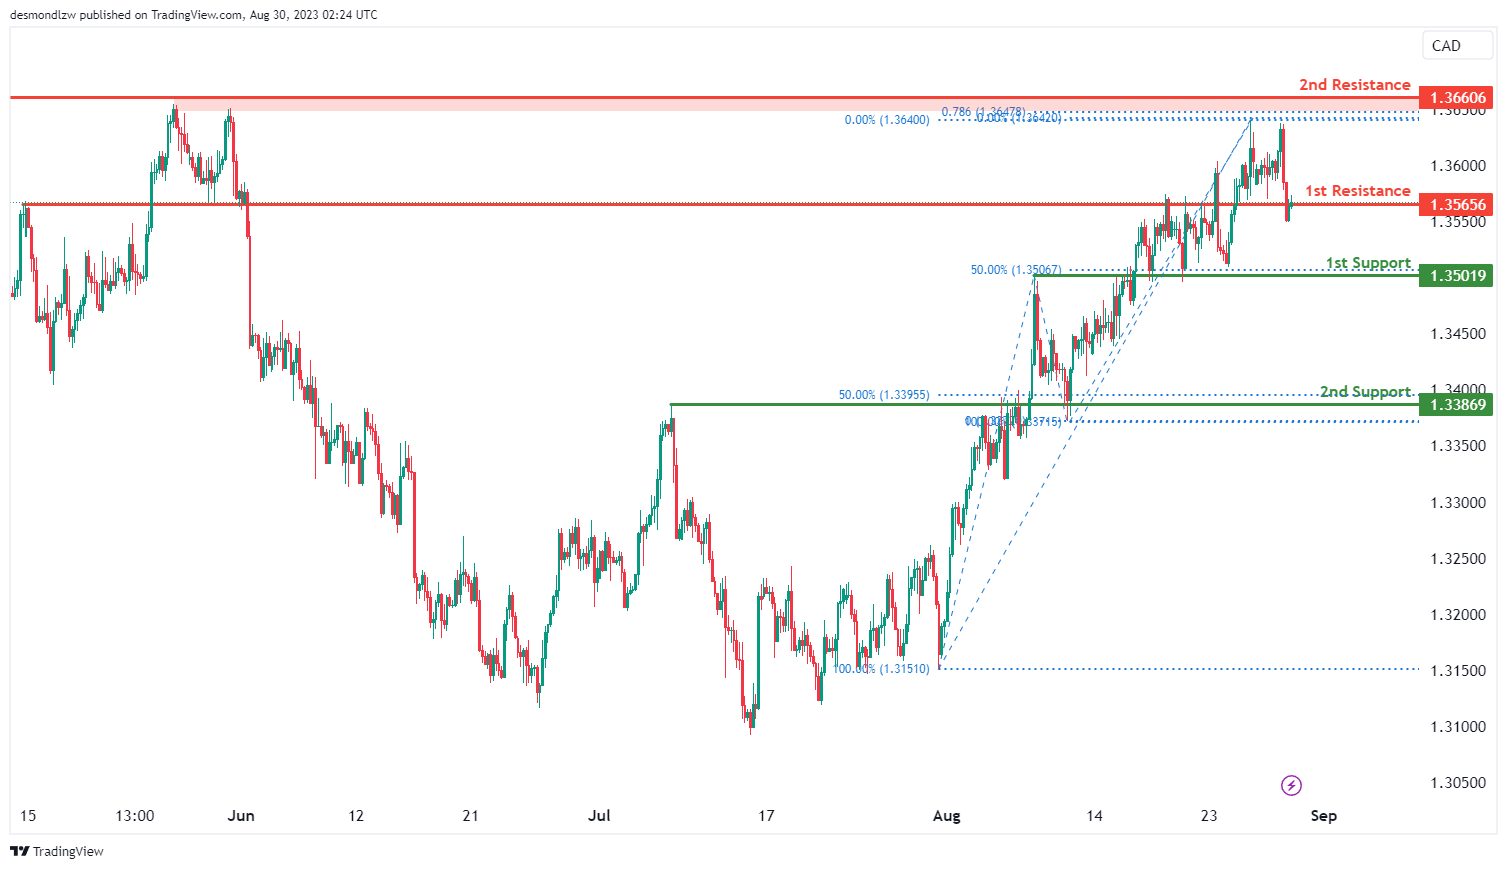
The USD/CAD chart is currently demonstrating a bearish overall momentum. Given this scenario, there is potential for price to react with a bearish movement upon reaching the 1st resistance level and subsequently decline towards the 1st support level.
The 1st support at 1.3502 is identified as an overlap support that coincides with the 50.00% Fibonacci retracement level. Furthermore, the 2nd support level at 1.3387 is also identified as an overlap support that aligns with the 50.00% Fibonacci retracement level.
To the upside, the 1st resistance level at 1.3566 is marked as an overlap resistance while the 2nd resistance at 1.3661 is identified as an overlap resistance that aligns with the 78.60% Fibonacci projection level.
AUD/USD:
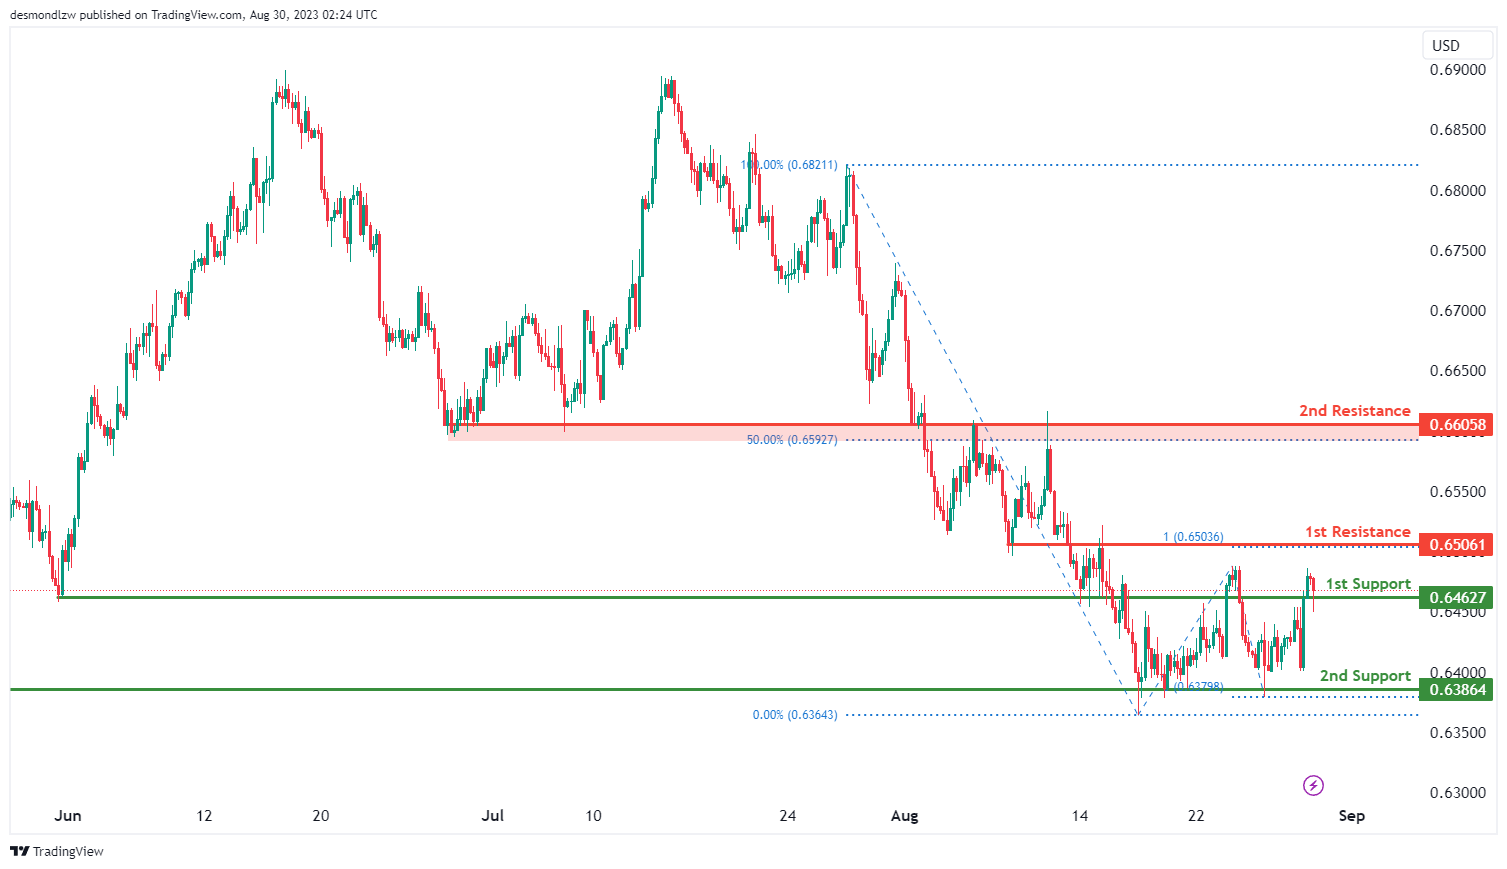
The AUD/USD chart is currently displaying a bearish overall momentum, indicating a prevailing downward trend in the price movement. There is potential for price to break below the 1st support level and descend further toward the 2nd support level.
The 1st support at 0.6463 is identified as an overlap support while the 2nd support level at 0.6386 is considered a pullback support.
To the upside, the 1st resistance level at 0.6506 is identified as an overlap resistance that aligns with the 100.00% Fibonacci projection level. The 2nd resistance at 0.6606 is also identified as an overlap resistance that aligns with the 50.00% Fibonacci retracement level.
NZD/USD
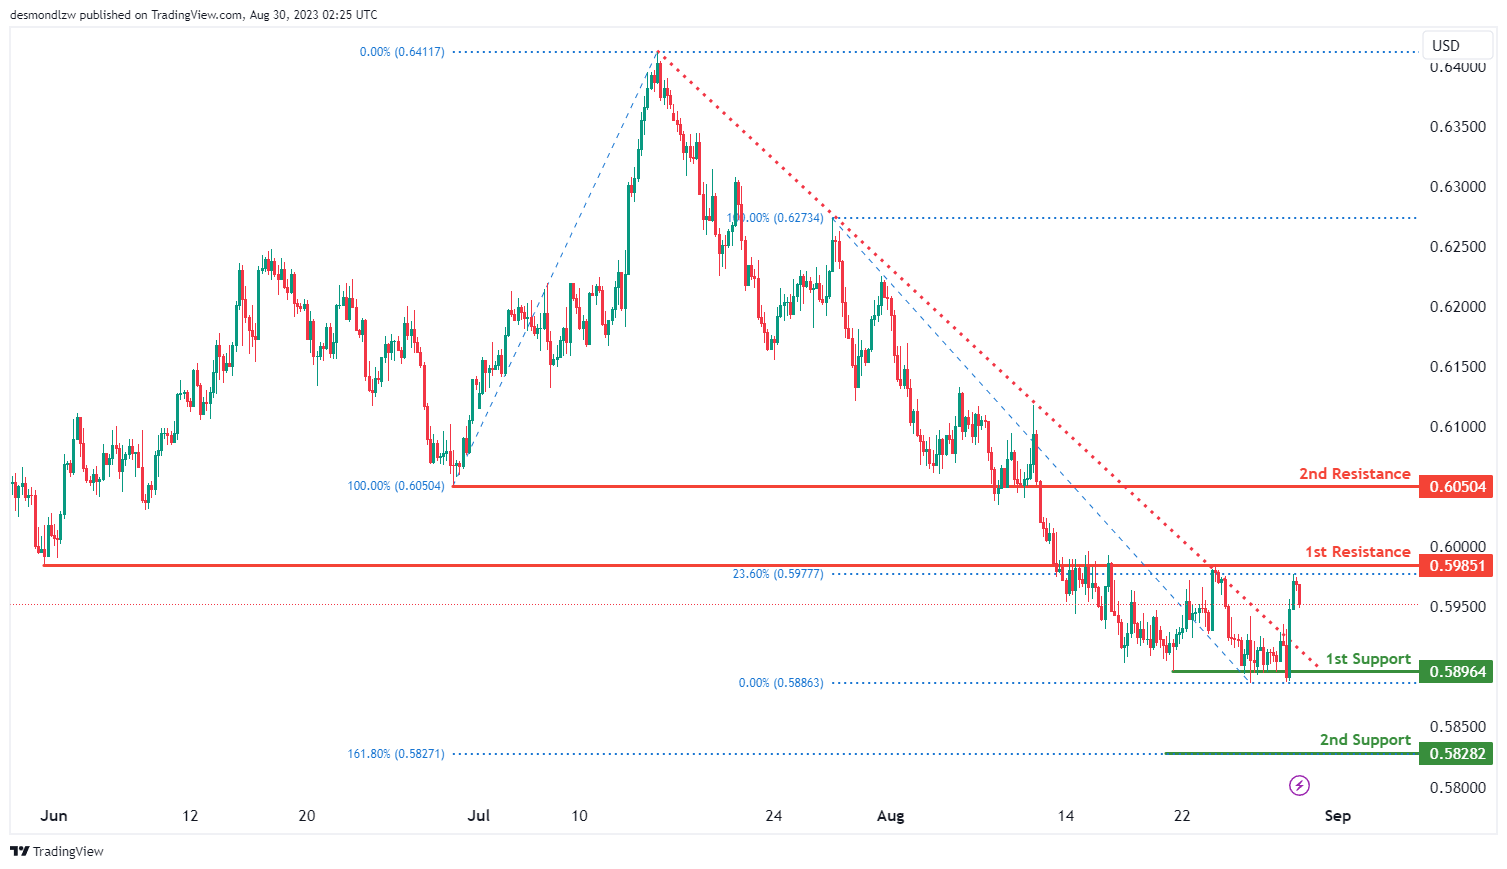
The NZD/USD chart currently exhibits a bearish momentum, indicating a downward trend in the price movement. There is potential for price to continue its bearish trajectory towards the 1st support level.
The 1st support level at 0.5896 is identified as a multi-swing low support while the 2nd support at 0.5828 is identified as a support level that aligns with the 161.80% Fibonacci extension level.
To the upside, the 1st resistance level of 0.5985 is identified as an overlap resistance that aligns with the 23.60% Fibonacci retracement level. Furthermore, the 2nd resistance at 0.6050 is also identified as an overlap resistance.
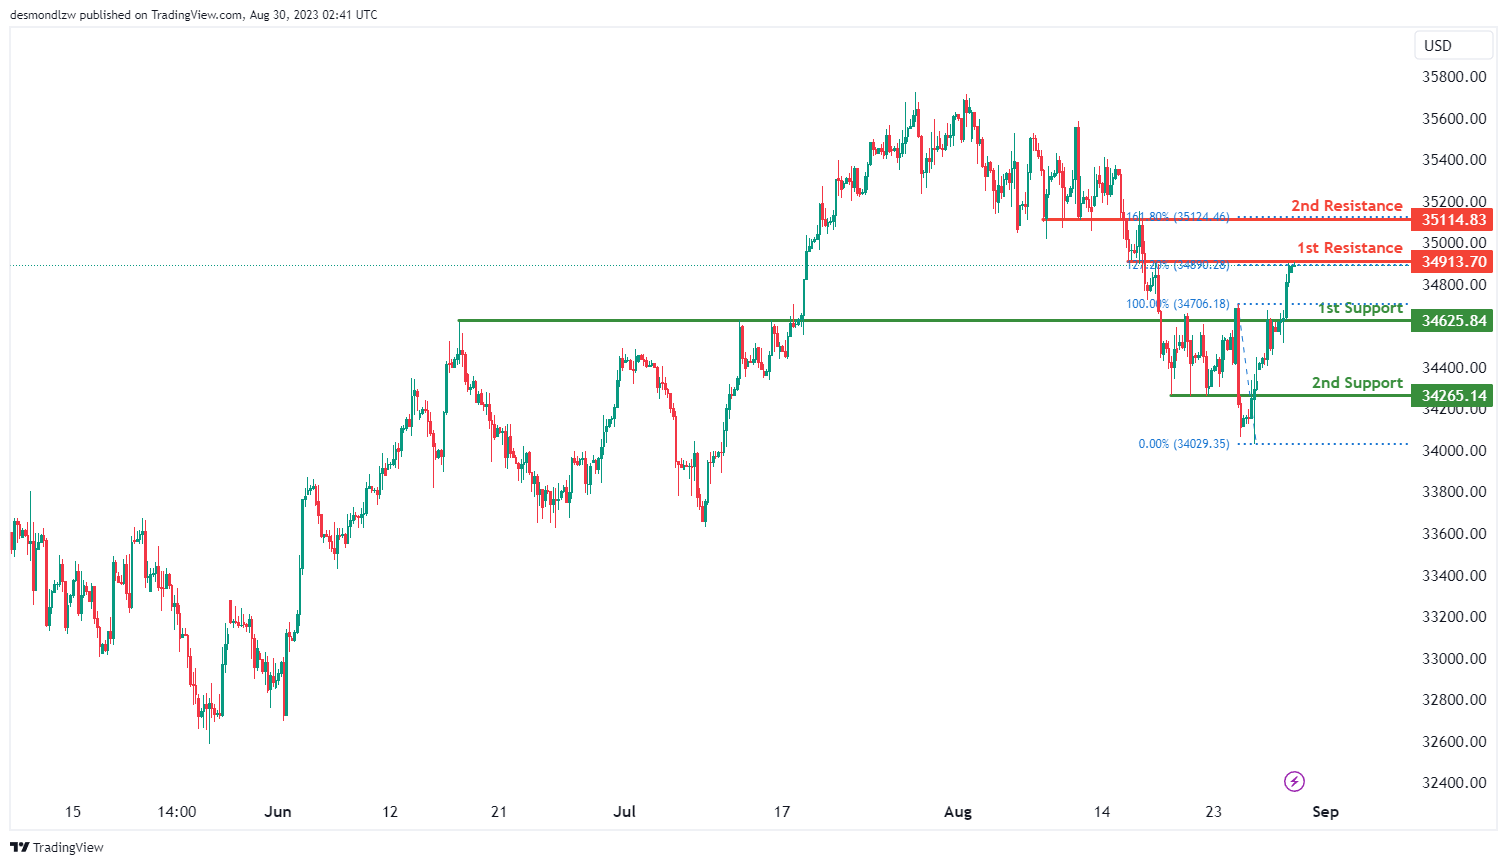
DJ30:
The DJ30 (Dow Jones 30) chart indicates a bearish overall momentum.
The 1st support level at 34265.80 is an overlap support, suggesting a potential area where price might find some buying interest.
The 2nd support level at 34265.10 is also an overlap support, reinforcing the significance of this zone.
On the resistance side, the 1st resistance level at 34913.70 is considered a pullback resistance and is further supported by the 127.20% Fibonacci extension level.
The 2nd resistance level at 35114.80 is an overlap resistance and is also coinciding with the 161.80% Fibonacci extension.
GER30:
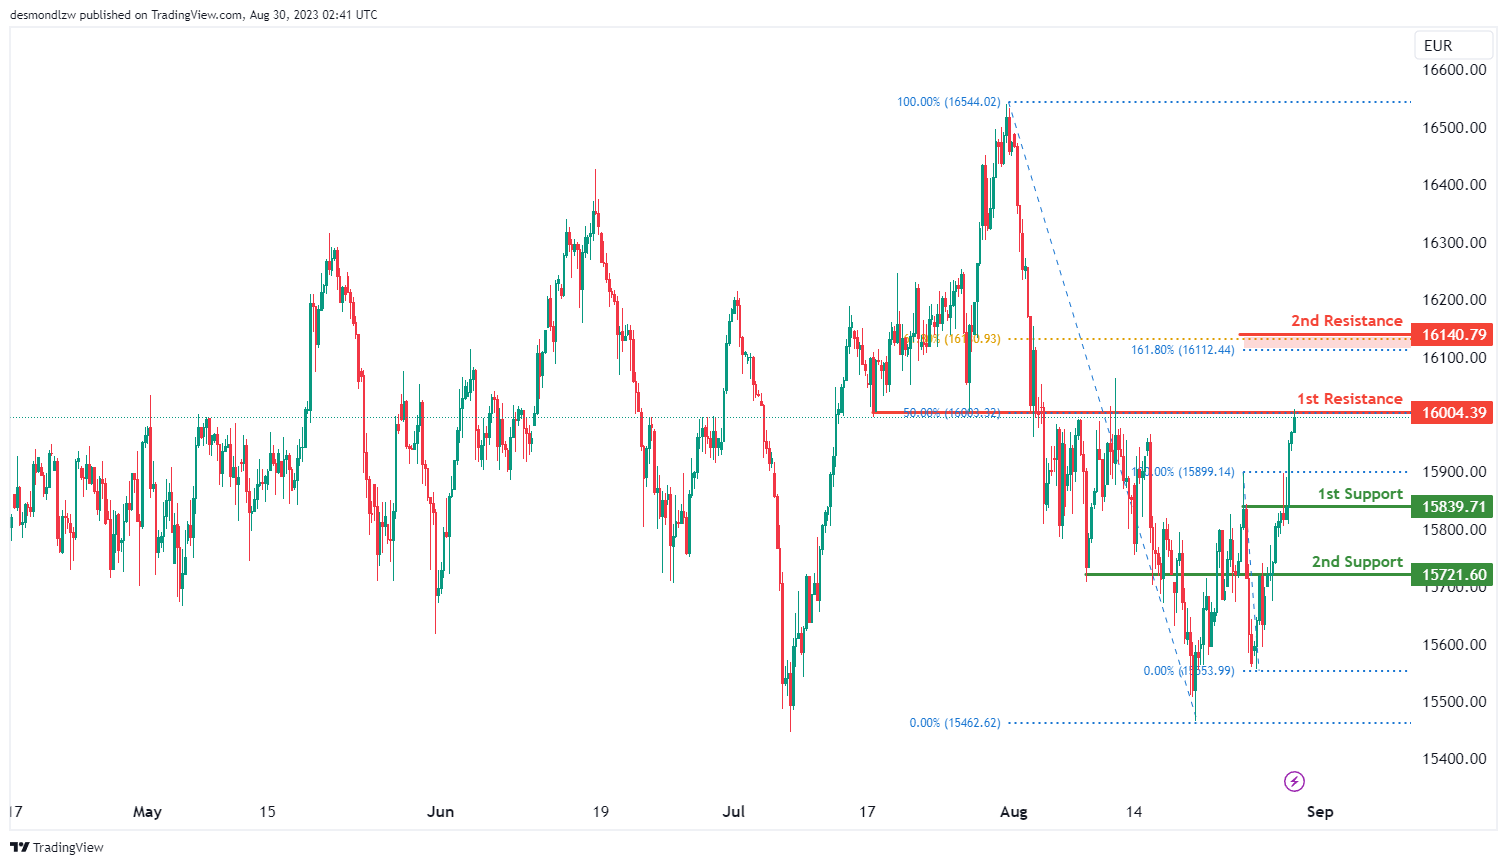
The GER30 (DAX 30) chart is showing a bearish overall momentum.
The 1st support level at 15839.70 is an overlap support, indicating a potential area where price could find some buying interest.
The 2nd support level at 15721.60 is also an overlap support, further strengthening the significance of this level.
On the resistance side, the 1st resistance level at 16004.30 is an overlap resistance, suggesting a potential area where selling pressure might emerge. This level is also supported by the 50% Fibonacci retracement.
The 2nd resistance level at 16140.70 is particularly interesting as it’s coinciding with both the 61.80% Fibonacci retracement and the 161.80% Fibonacci extension. This is a Fibonacci confluence zone, potentially adding to its significance.
US500
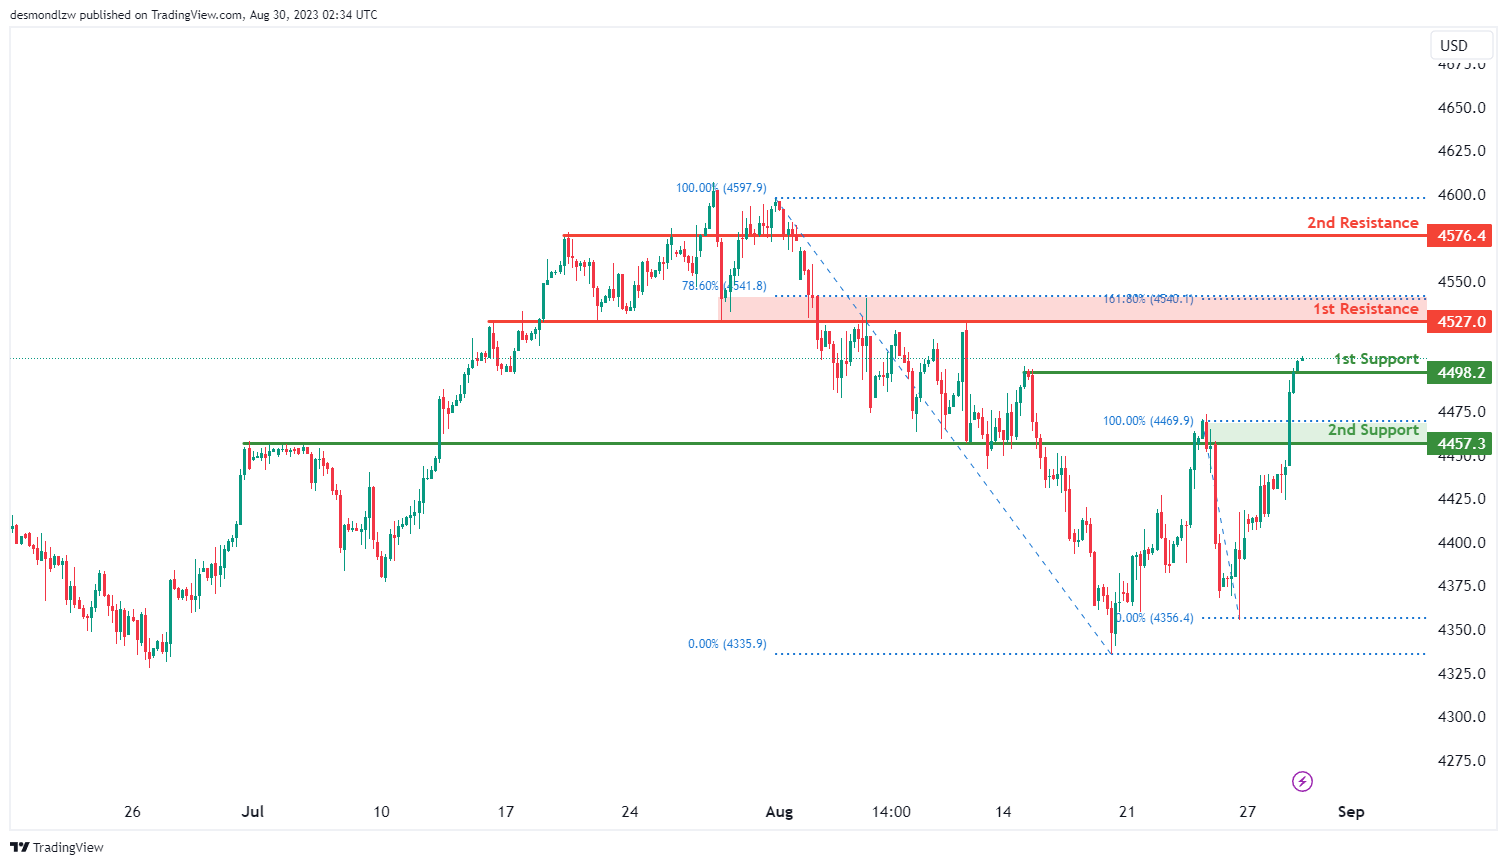
The US500 chart is currently exhibiting bullish momentum. Within this upward trajectory, there’s potential for the index to proceed with its bullish course, aiming for the 1st resistance level situated at 4527.0. This resistance is not only characterized by its overlap status but is further underscored by a notable Fibonacci confluence, aligning with both the 78.60% Fibonacci Retracement and the 161.80% Fibonacci Extension. This confluence may enhance the resistance’s significance in terms of price interactions.
In the context of support, the 1st support level is pinpointed at 4498.2, identified as a pullback support, while the 2nd support level stands at 4457.3, designated as an overlap support. Both these levels offer potential areas where buying interest might intensify. On the higher side, beyond the 1st resistance, the 2nd resistance is found at 4576.4 and is distinguished by its overlap resistance status, marking another potential ceiling for bullish movements.
BTC/USD:
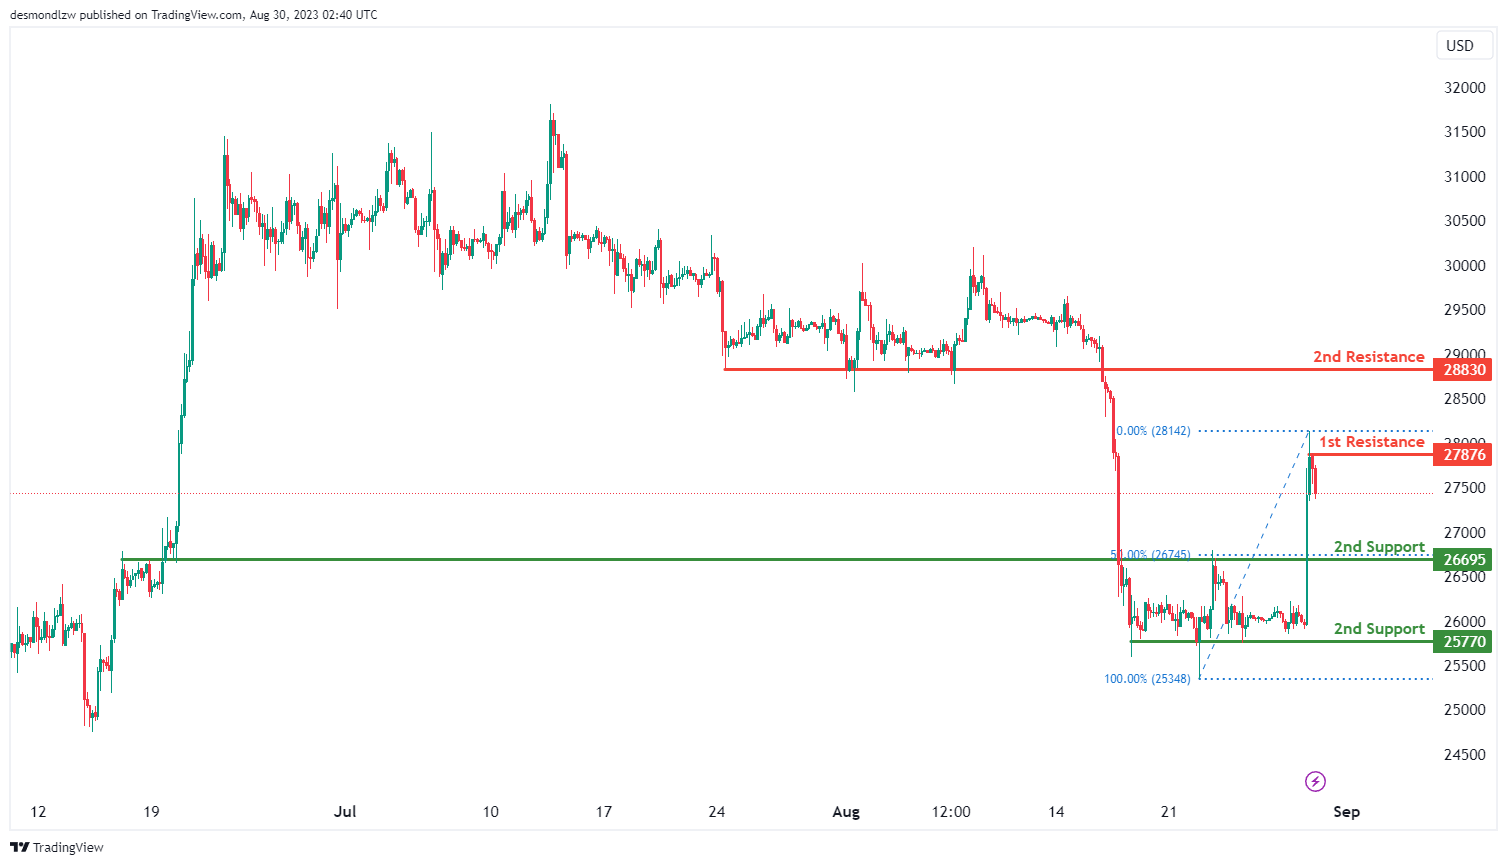
The BTC/USD chart indicates a bearish overall momentum.
The 1st support level at 26695 is an important level due to its characteristics as an overlap support and coincides with the 50% Fibonacci retracement level.
The 2nd support level at 25770 holds significance as a multi-swing low support.
On the resistance side, the 1st resistance level at 27876 is considered a swing high resistance.
The 2nd resistance level at 28830 gains importance as a pullback resistance.
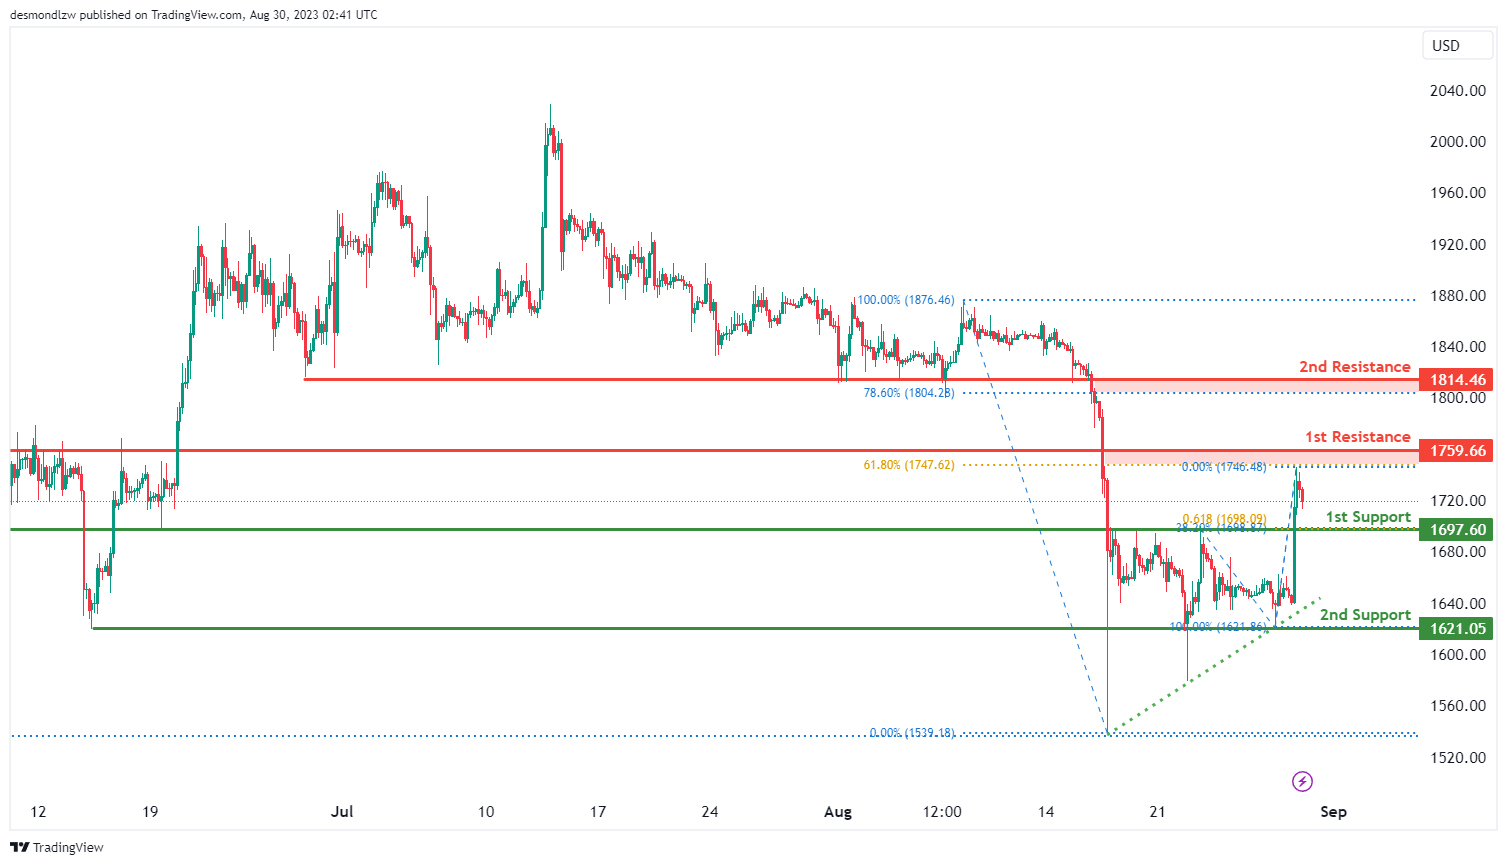
ETH/USD:
The ETH/USD chart indicates a bearish overall momentum.
The 1st support level at 1697.60 is significant due to its characteristics as an overlap support and its confluence with the 38.20% Fibonacci retracement level and the 61.80% Fibonacci projection.
The 2nd support level at 1621.00 is a multi-swing low support, which could also act as a potential area of interest.
On the resistance side, the 1st resistance level at 1759.60 is considered an overlap resistance.
The 2nd resistance level at 1814.40 holds importance as a pullback resistance coinciding with the 78.60% Fibonacci retracement level.
WTI/USD:
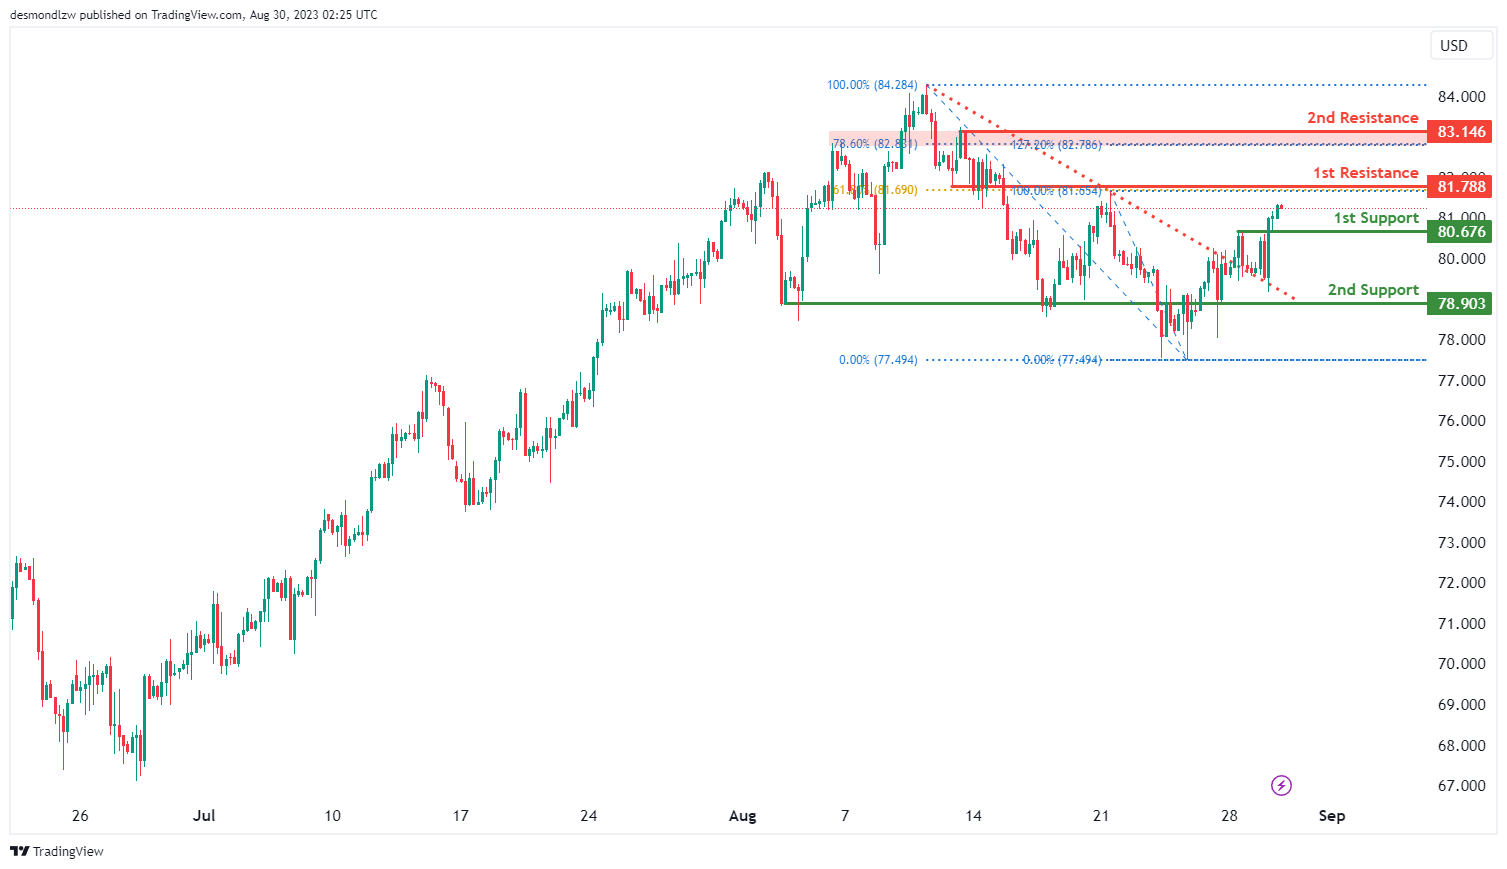
The current momentum of the WTI chart suggests a bullish trend, which has been spurred by the price’s breakthrough above a descending trendline. This breakout has ignited the potential for a bullish price movement towards the 1st resistance level.
The 1st resistance level at 81.79 is identified as an overlap resistance that aligns with the 61.80% Fibonacci retracement level. In addition, the 2nd resistance level at 83.15 is identified as pullback resistance that aligns with a confluence of Fibonacci levels i.e. the 78.60% retracement and the 127.20% extension levels, reinforcing this level as a significant resistance barrier.
To the downside, the 1st support level at 80.68 is identified as a pullback support while the 2nd support level at 78.90 is identified as an overlap support.
XAU/USD (GOLD):
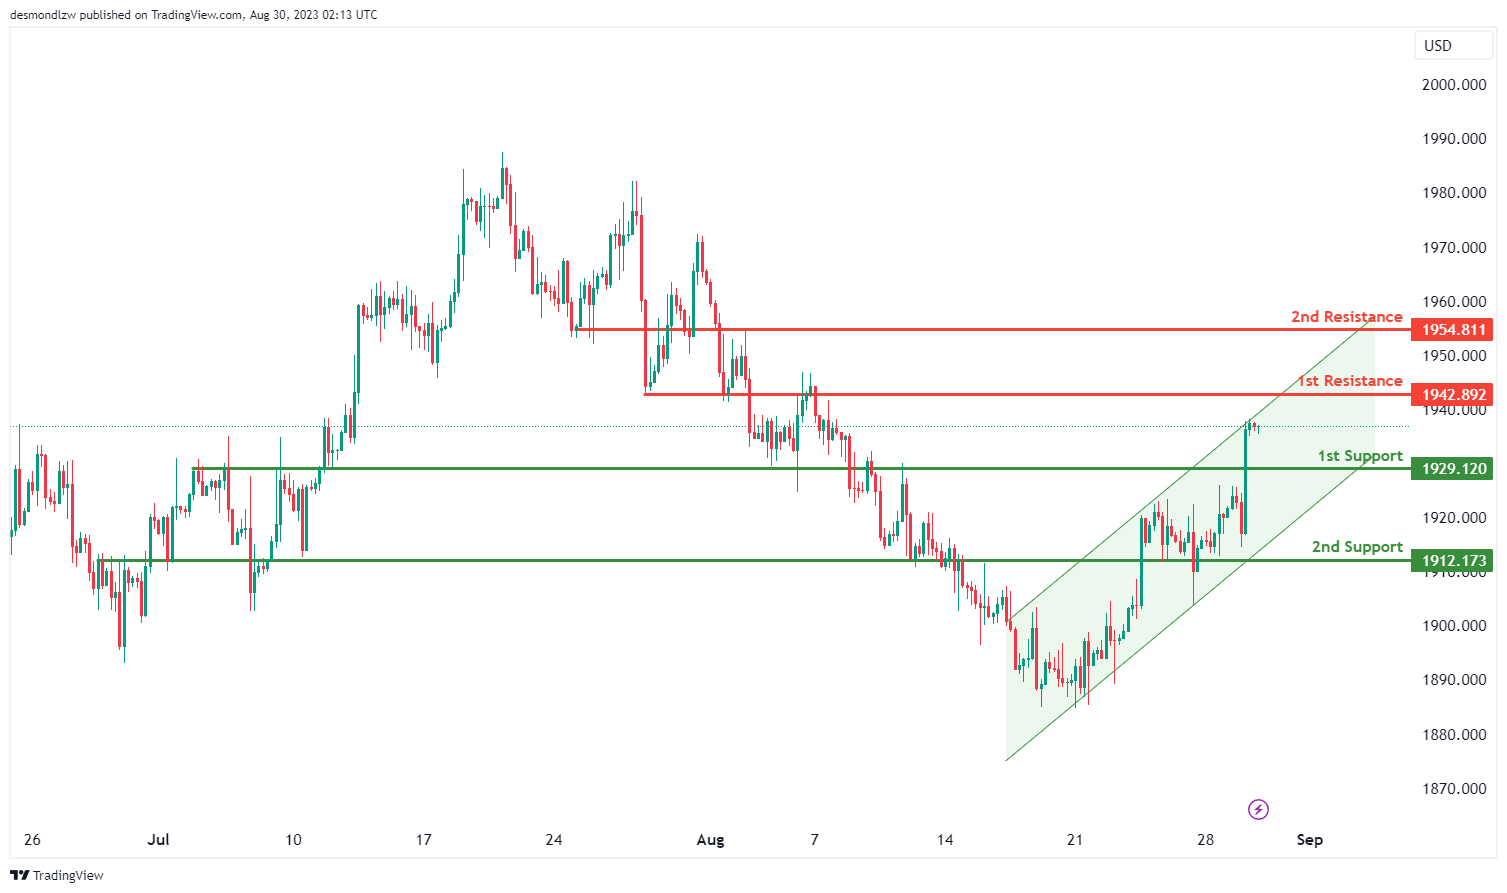
The XAU/USD chart is currently exhibiting a bullish overall momentum, indicating an upward trend in its price movement. This momentum is reinforced by the fact that the price is contained within a bullish ascending channel, suggesting a potential for further upward movement.
In terms of potential price movements, there are key levels to consider:
The 1st support level at 1929.12 is identified as a pullback support. This level represents an area where the price might find support during pullback phases within the overall bullish trend.
The 2nd support level at 1912.17 is considered an overlap support, implying that historical price action has found support around this level before. This adds to the potential significance of this level as a potential support zone.
On the upside, the 1st resistance level at 1942.89 is noted as an overlap resistance. Historical price action has encountered resistance in this region previously, making it a level to watch for potential reversals or continuation patterns.
The 2nd resistance level at 1954.81 is also marked as an overlap resistance. Similar to the 1st resistance, this level could act as a target for the bullish movement if the price continues its upward momentum.
Bitcoin soars after Grayscale’s legal win, now pressing 55 D EMA
In a notable development for cryptocurrency enthusiasts and investors, Bitcoin experienced a significant surge overnight, pulling other cryptocurrencies higher in its wake. This rally was triggered by Grayscale's key legal victory against the US Securities and Exchange Commission in its bid to launch a Bitcoin exchange-traded fund. The favorable ruling could pave the way for the SEC's approval of other Bitcoin ETF applications, thereby providing the cryptocurrency industry with access to a new pool of retail investor capital.
From a technical perspective, Bitcoin's strong bounce suggests that cluster support zone around 25k is defended well for now. This support zone comprises various key levels, including 24739 support, 25242 resistance-turned-support, and more importantly 38.2% retracement of 15452 to 31815 at 25564.
The overnight activity implies that recent price actions from 31815 may simply represent sideways consolidation rather than a bearish trend. It suggests that the medium-term rise from 15452 isn't over just yet.
However, to firmly establish this bullish case, Bitcoin still has hurdles to overcome in the near term. Specifically, it will need to break through the 55 D EMA, currently at 28173, and 28555 support-turned-resistance.
BoJ’s Tamura eyes next Q1 for decisive inflation data for policy shifts
BoJ board member Naoki Tamura offered insights into the timeline for potentially phasing out the central bank's ultra-accommodative stance. he signaled that by the first quarter of 2024, BoJ could gather sufficient data to evaluate whether the 2% inflation target could be sustainably achieved.
"It's appropriate at this stage to sustain monetary easing, and earnestly scrutinize wage and price developments," Tamura said, adding that he is hopeful for "further clarity" on the inflation target "around January through March next year" through wage and price data available by that time.
Tamura anticipates that Japan's inflation could slow down for the time being, only to moderately accelerate later. This coincides with his expectation of high wage growth in the next year's spring wage negotiations.
Tamura emphasized that the "biggest key to monetary policy outlook is whether Japan achieves a positive cycle of rising wages and inflation."
Australian CPI eases more than expected to 4.9% in July
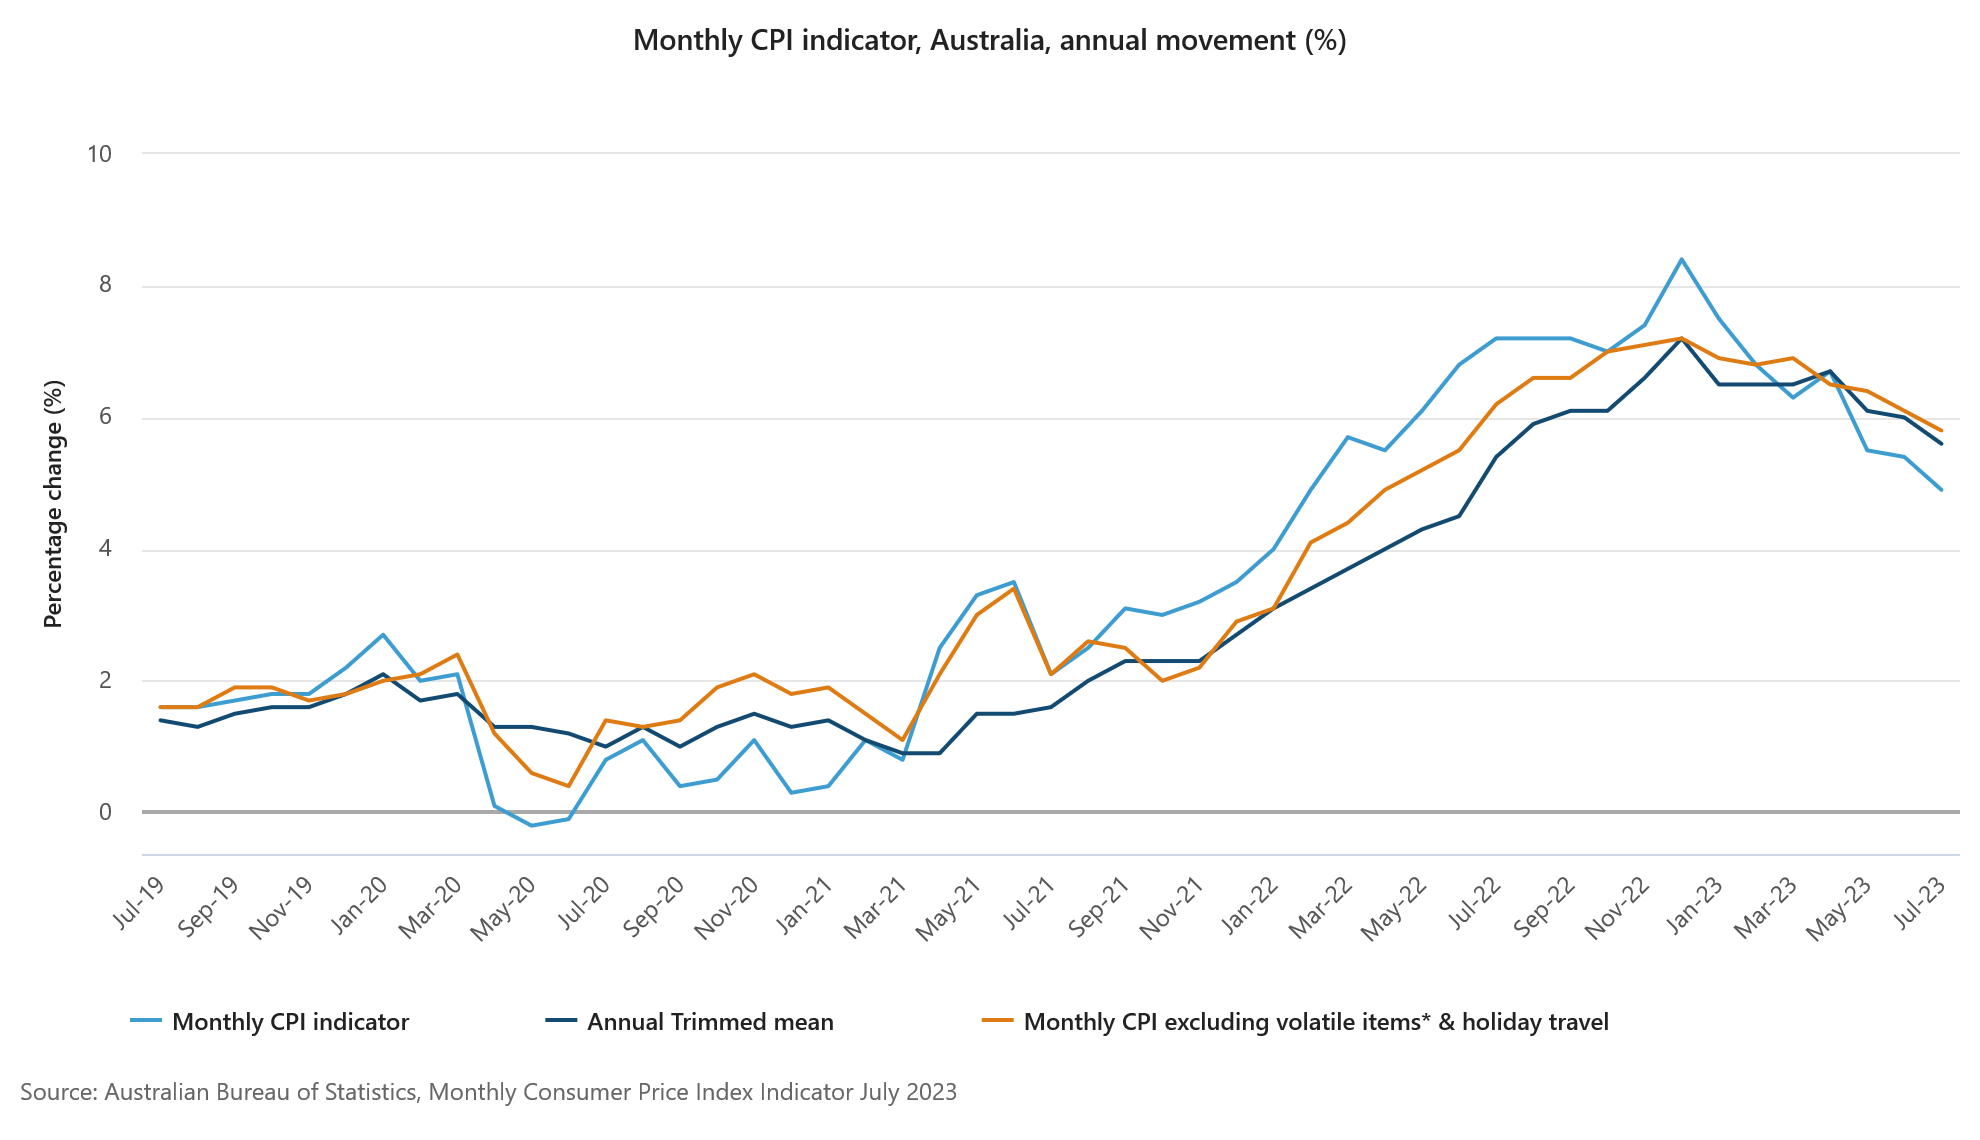
Australia's monthly CPI for July registered a deeper than expected slowdown, easing from 5.4% yoy to 4.9% yoy. Analysts had forecasted a milder decline to 5.2% yoy. The underlying inflation measures also indicated a deceleration. CPI excluding volatile items such as holiday travel came in at 5.8% yoy, down from 6.1% yoy. The trimmed mean CPI, which is often regarded as a more accurate reflection of inflationary pressures, slowed from 6.0% yoy to 5.6% yoy.
A closer look at the inflation contributors reveals a mixed picture. Housing costs remained a significant upward pressure, climbing 7.3% on an annual basis. Food and non-alcoholic beverages followed closely, rising by 5.6% yoy. However, this was offset by substantial price falls in other areas. Automotive fuel costs dropped by -7.6%, while fruit and vegetable prices declined by -5.4%, thus tempering the overall July increase.
The latest CPI data comes on the heels of yesterday's hawkish comments from incoming RBA Governor Michele Bullock, who emphasized that her first priority is still to maintain a focus on bringing inflation back down to target. Today's lower-than-expected inflation figures might lend some flexibility to RBA's policy approach, but with sectors like housing and food still exhibiting strong price pressures, the central bank's task appears far from straightforward.
AUD/USD Eyes Recovery Above 0.6500, US GDP Next
Key Highlights
- AUD/USD could recover above 0.6480 and 0.6500.
- A key bearish trend line is forming with resistance near 0.6445 on the 4-hour chart.
- EUR/USD might recover above the 1.0880 resistance zone.
- The US GDP could grow 2.4% in Q2 2023 (Preliminary).
AUD/USD Technical Analysis
The Aussie Dollar extended its decline below the 0.6550 level against the US Dollar. AUD/USD even broke the 0.6500 level to move further into a bearish zone.
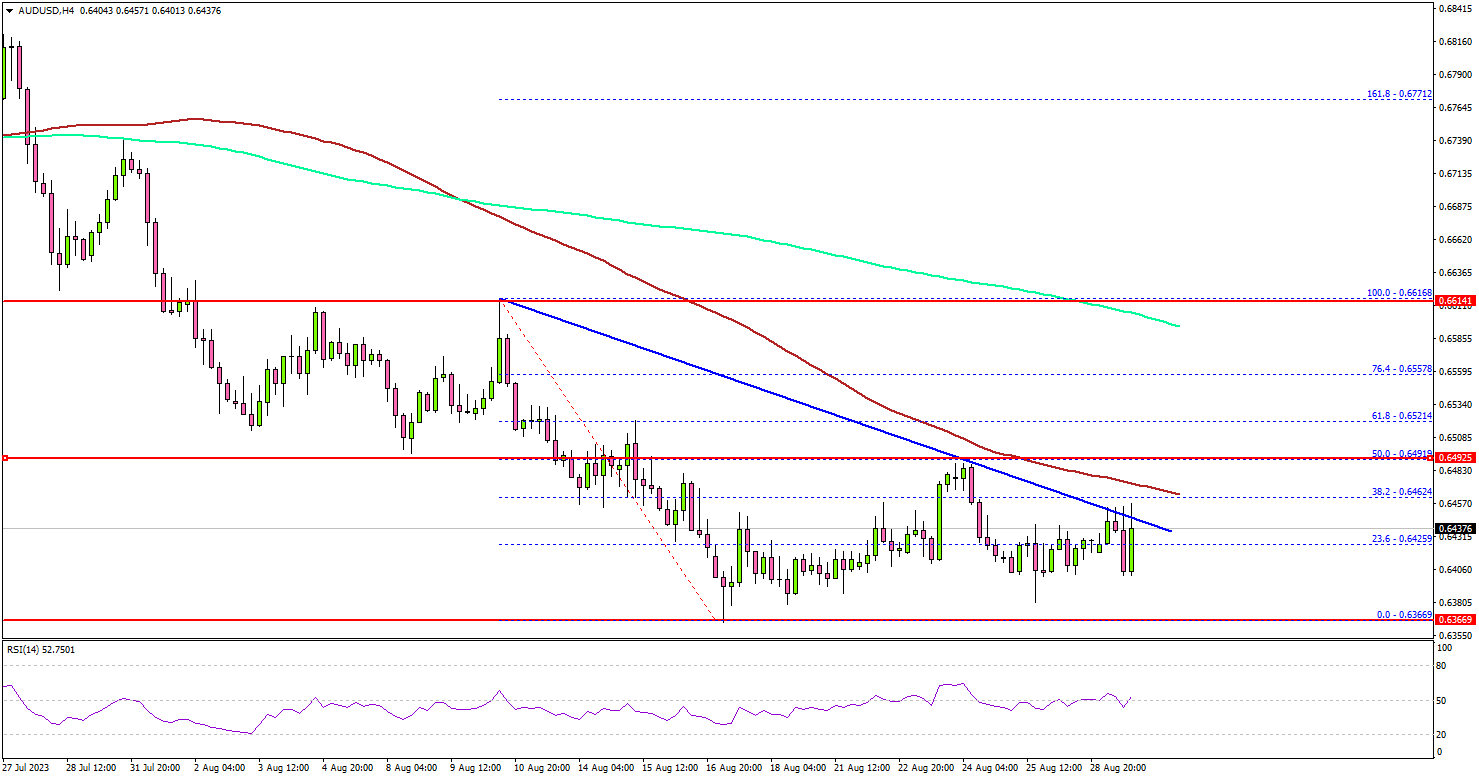
Looking at the 4-hour chart, the pair settled below the 0.6500 level, the 100 simple moving average (red, 4 hours) and the 200 simple moving average (green, 4 hours).
The pair tested the 0.6365 zone. A low was formed near 0.6366 and the pair is now attempting a recovery wave. It broke the 23.6% Fib retracement level of the downward move from the 0.6616 swing high to the 0.6366 low.
On the upside, an initial resistance is near the 0.6450 level. There is also a key bearish trend line forming with resistance near 0.6445 on the same chart.
The first major resistance is near the 0.6465 level or the 100 simple moving average (red, 4 hours). The main resistance is forming near the 0.6500 zone. It is close to the 50% Fib retracement level of the downward move from the 0.6616 swing high to the 0.6366 low.
A close above 0.6500 could start a decent increase. In the stated case, the pair could rise toward the 0.6580 level. Any more gains could send the pair toward the 0.6620 level.
If not, the pair might continue to move down below the 0.6350 support. The next key support is seen near the 0.6520 level. If there is a move below 0.6520, the pair could dive toward 0.6450.
Looking at EUR/USD, the pair is showing some signs of a recovery wave and it might climb above the 1.0880 resistance.
Economic Releases
- US ADP Employment Change for August 2023 - Forecast 195K, versus 324K previous.
- US Gross Domestic Product for Q2 2023 (Preliminary) – Forecast 2.4% versus previous 2.4%.