

Sample Category Title
EURJPY Correcting in 7 Swing Within Bullish Trend
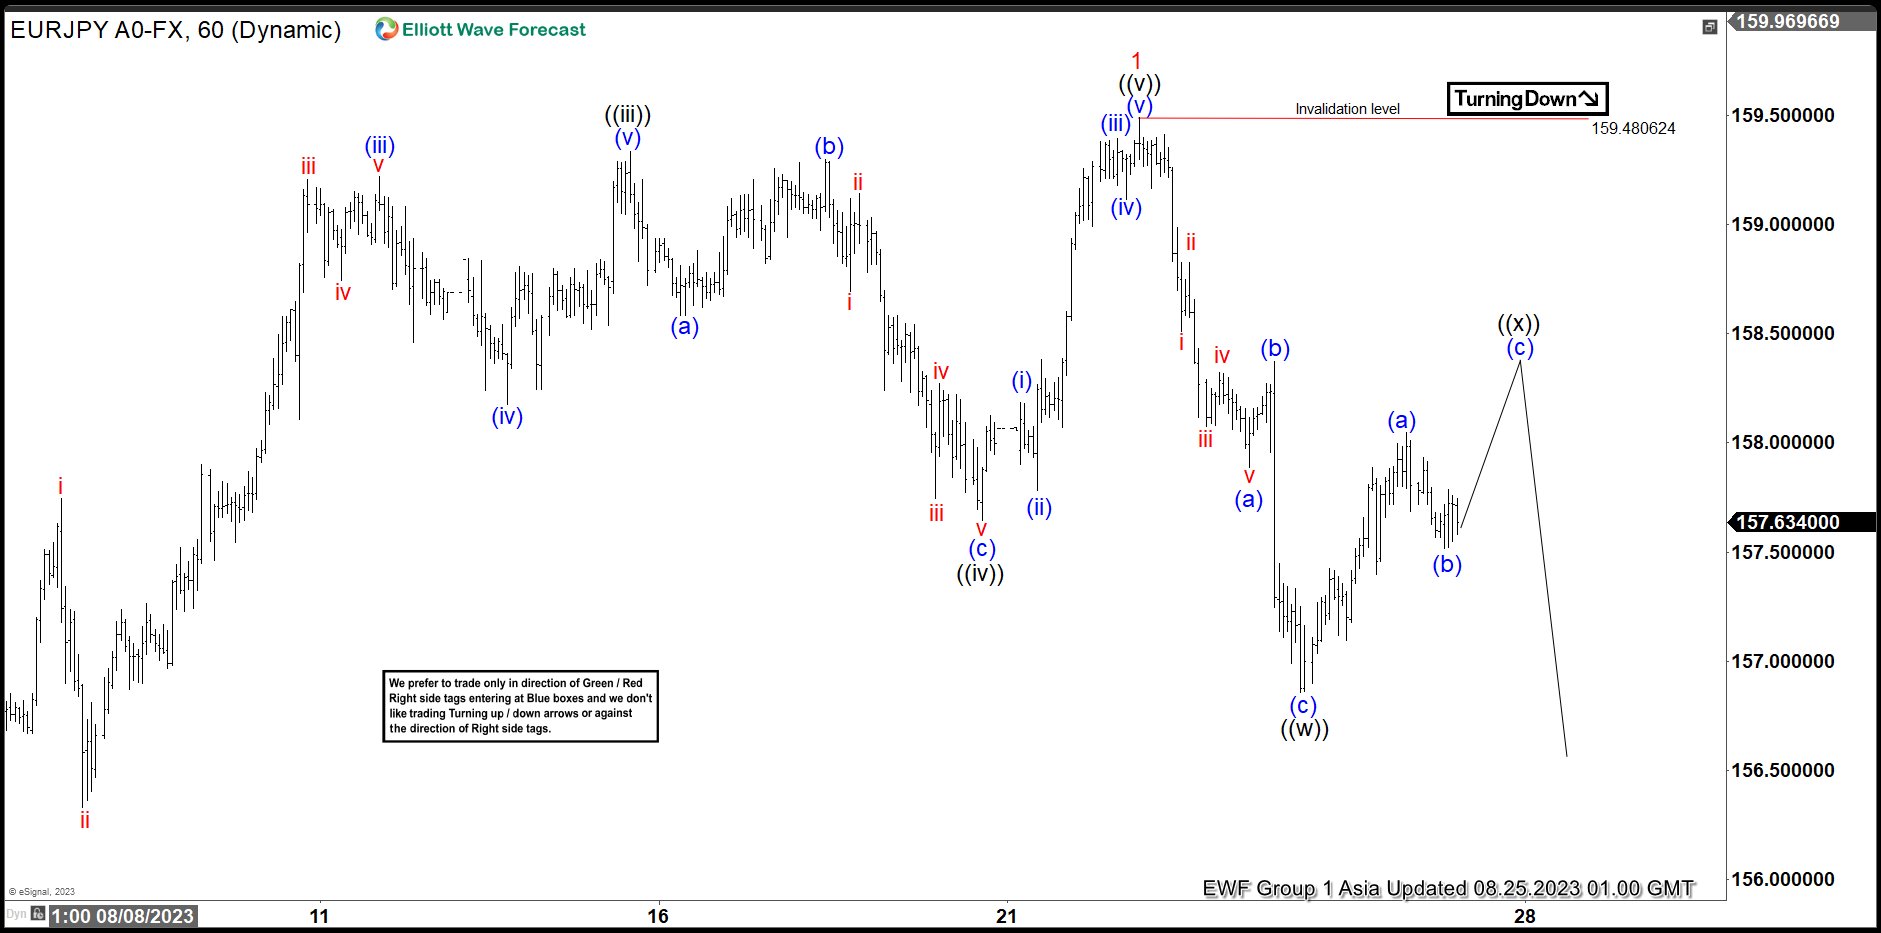
Short Term Elliott Wave view suggests cycle from 7.28.2023 low ended with wave 1 at 159.4 in 5 waves impulse. Up from 7.28.2023 low, wave ((i)) ended at 157.49 and pullback in wave ((ii)) ended at 155.53. Pair extends higher in wave ((iii)) towards 159.33 and pullback in wave ((iv)) ended at 157.66. Subdivision of wave ((iv)) unfolded as a zigzag Elliott Wave structure. Down from wave ((iii)), wave (a) ended at 158.58, and wave (b) ended at 159.29. Pair resumes lower in wave (c) towards 157.64 which completed wave ((iv)) in higher degree. Pair then resumed higher in wave ((v)) towards 159.48 which completed wave 1 in higher degree.
Wave 2 pullback is currently in progress as a 7 swing double three structure. Down from wave 1, wave (a) ended at 157.88 and wave (b) ended at 158.37. Pair resumed lower in wave (c) towards 156.85 which completed wave ((w)). Wave ((x)) rally is now in progress in 3 waves zigzag. Up from wave ((w)), wave (a) ended at 158.04. Near term, while below 159.48, expect the rally to fail in 3, 7, or 11 swing and pair to resume lower.
EURJPY 60 Minutes Elliott Wave Chart
EURJPY Elliott Wave Video
https://www.youtube.com/watch?v=U0P9xikm8h8
USD/CAD Daily Outlook
Daily Pivots: (S1) 1.3532; (P) 1.3561; (R1) 1.3611; More....
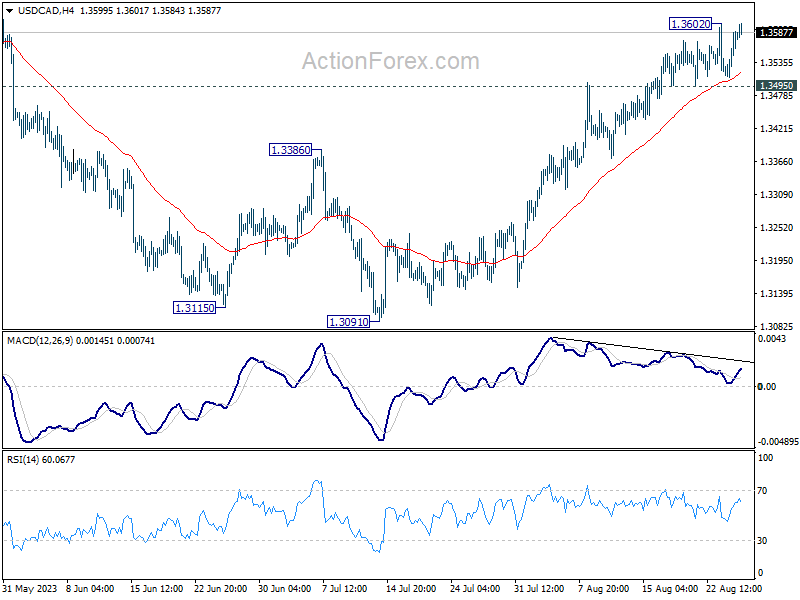
USD/CAD is staying in range below 1.3602 and intraday bias remains neutral. On the upside, break of 1.3602 will resume the whole rally from 1.3091 to 1.3653 resistance first. Decisive break there will confirm that correction from 1.3976 has completed, a target a test on this high. However, break of 1.3495 will indicate short term topping, on bearish divergence condition in 4H MACD, and turn bias to the downside for deeper pull back.
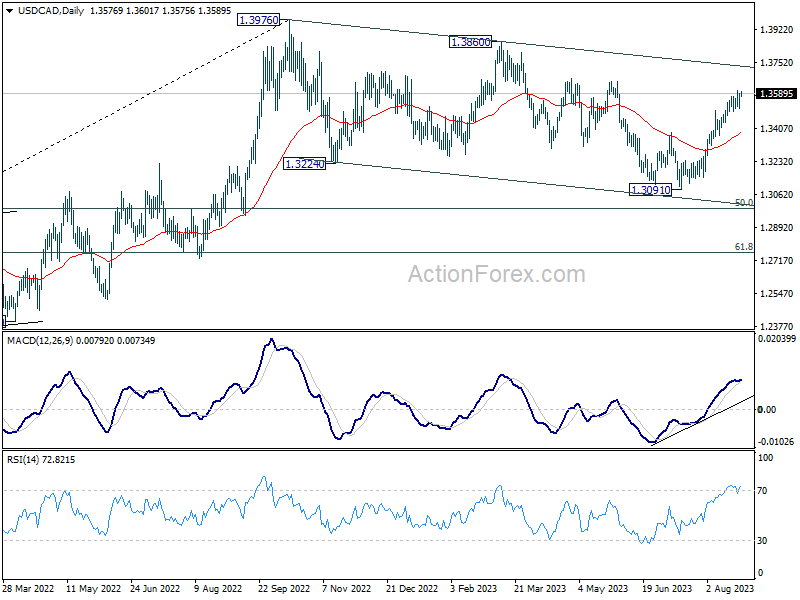
In the bigger picture, price actions from 1.3976 are viewed as a corrective fall only. Upon completion, rise from 1.2005 (2021 low) would resume through 1.3976. Next target is 61.8% projection of 1.2005 to 1.3976 from 1.3091 at 1.4309. In case of another fall, downside should be contained by 61.8% retracement of 1.2005 to 1.3976 at 1.2758.
AUD/USD Daily Report
Daily Pivots: (S1) 0.6391; (P) 0.6439; (R1) 0.6467; More...
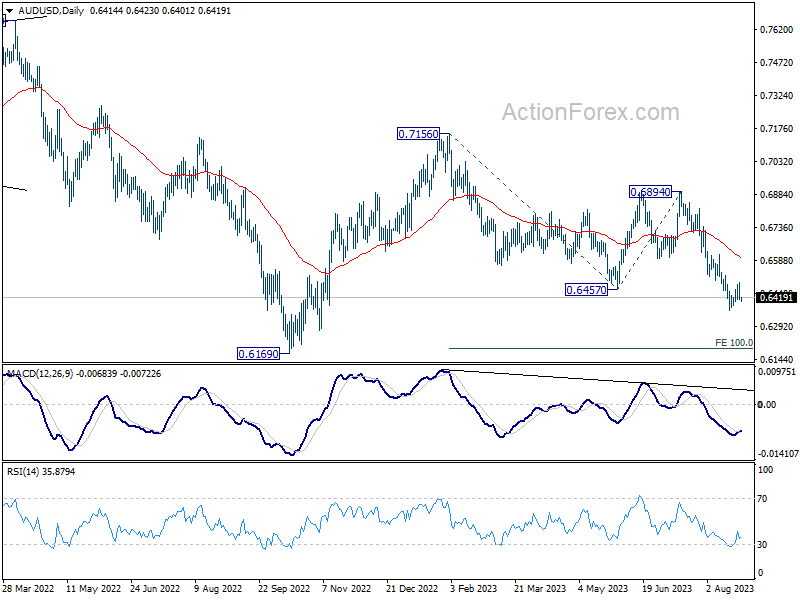
Intraday bias in AUD/USD stays neutral as consolidation from 0.6363 could extend. While stronger recovery cannot be ruled out, upside should be limited by 0.6615 resistance. Break of 0.6363 will resume larger fall from 0.7156 to 100% projection of 0.7156 to 0.6457 from 0.6894 at 0.6195.
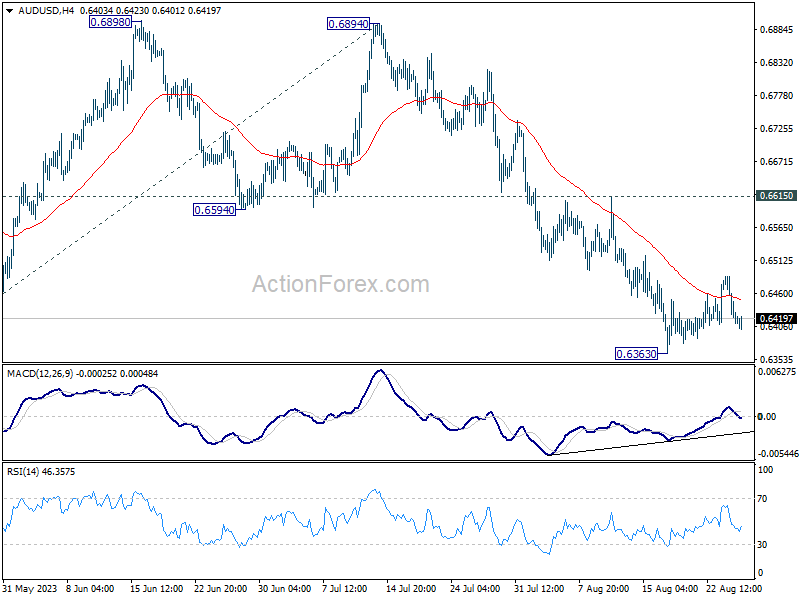
In the bigger picture, current development argues that the down trend from 0.8006 (2021 high) is still in progress. Decisive break of 0.6169 will target 61.8% projection of 0.8006 to 0.6169 to 0.7156 at 0.6021. This will now remain the favored case as long as 0.6894, in case of strong rebound.
USD/JPY Daily Outlook
Daily Pivots: (S1) 144.98; (P) 145.47; (R1) 146.34; More...
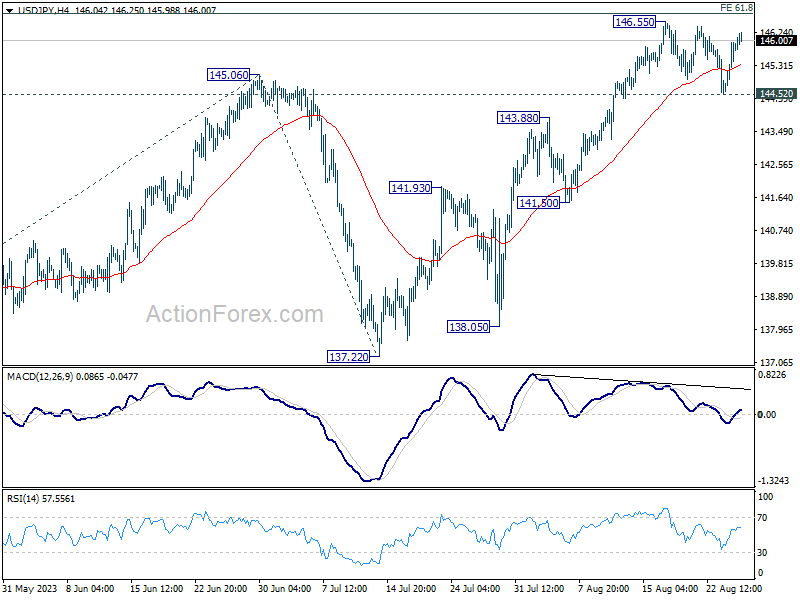
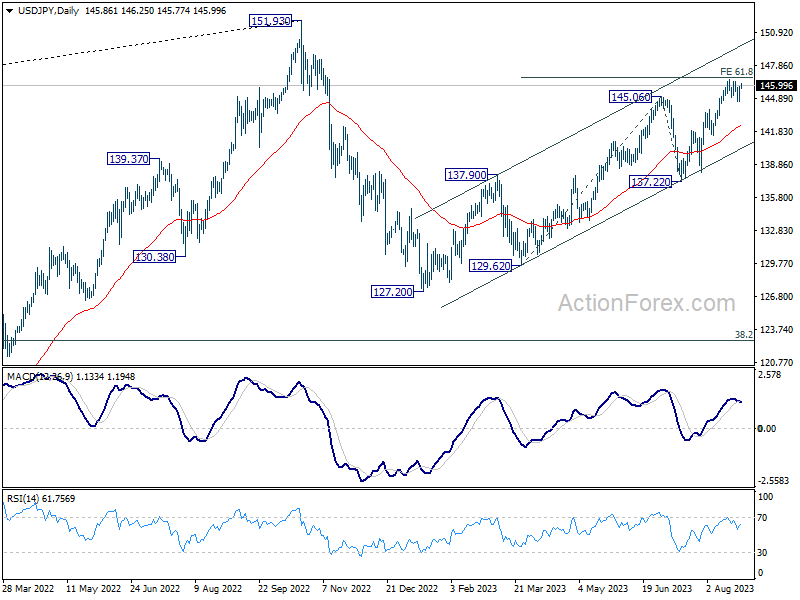
Intraday bias in USD/JPY stays neutral as it's still bounded in range. On the upside, sustained break of 61.8% projection of 129.62 to 145.06 from 137.22 at 146.76 will pave the way to retest 151.93 high. However, considering bearish divergence condition in 4H MACD, firm break of 144.52 support will be a sign of reversal, and turn bias back to the downside for 55 D EMA (now at 142.45).
In the bigger picture, overall price actions from 151.93 (2022 high) are views as a corrective pattern. Rise from 127.20 is seen as the second leg of the pattern and could still be in progress. But even in case of extended rise, strong resistance should be seen from 151.93 to limit upside. Meanwhile, break of 137.22 support should confirm the start of the third leg to 127.20 (2023 low) and below.
USD/CHF Daily Outlook
Daily Pivots: (S1) 0.8786; (P) 0.8819; (R1) 0.8878; More....
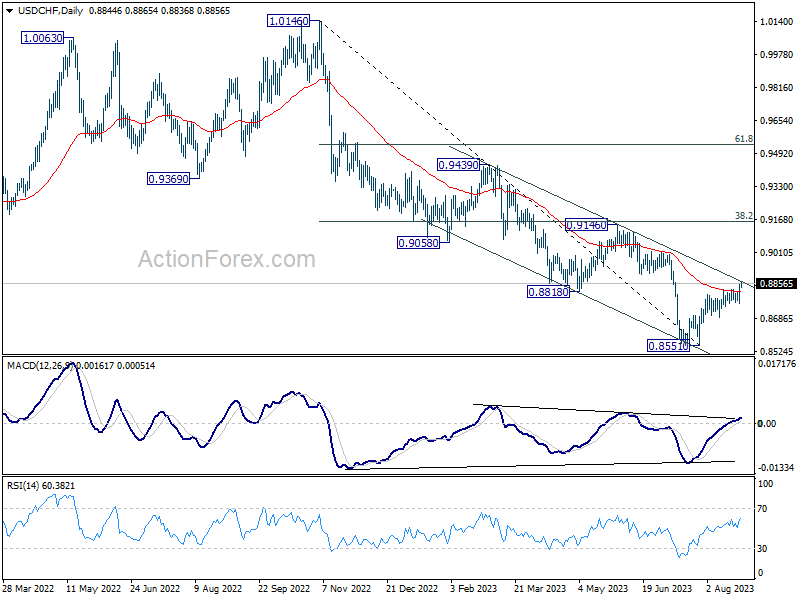
Intraday bias in USD/CHF remains on the upside at this point. Further rally should be seen to 0.9146 cluster resistance next. Strong resistance could be seen there to limit upside, at least on first attempt. On the downside, break of 0.8758 support is needed to indicate completion of the rebound from 0.8551. Otherwise, near term outlook is cautiously bullish in case of retreat.
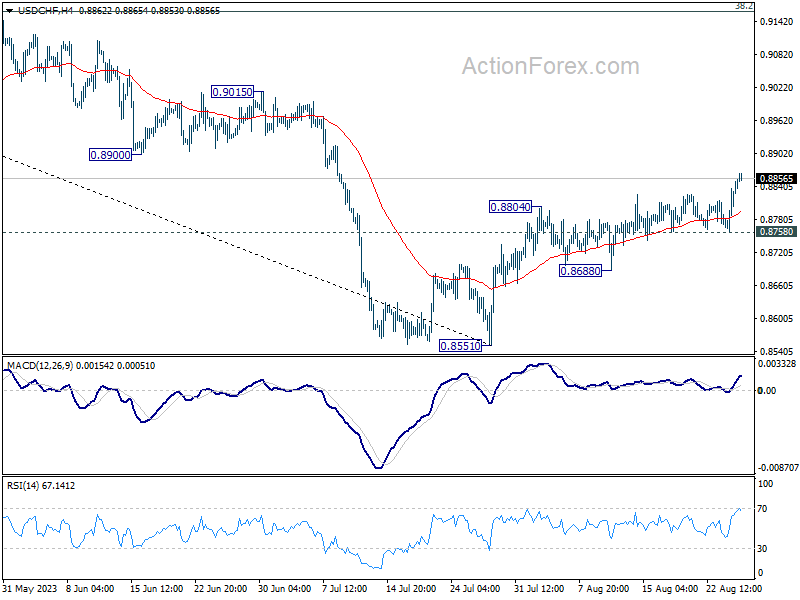
In the bigger picture, rebound from 0.8551 medium term bottom is currently seen as a correction to the downtrend from 1.0146 (2022 high). Further rally would be seen to 0.9146 cluster resistance (38.2% retracement of 1.0146 to 0.8551 at 0.9160), even as a correction. For now, medium term outlook is neutral at best as long as 0.8551 holds, until further developments.
EUR/USD Daily Outlook
Daily Pivots: (S1) 1.0820; (P) 1.0846; (R1) 1.0888; More...
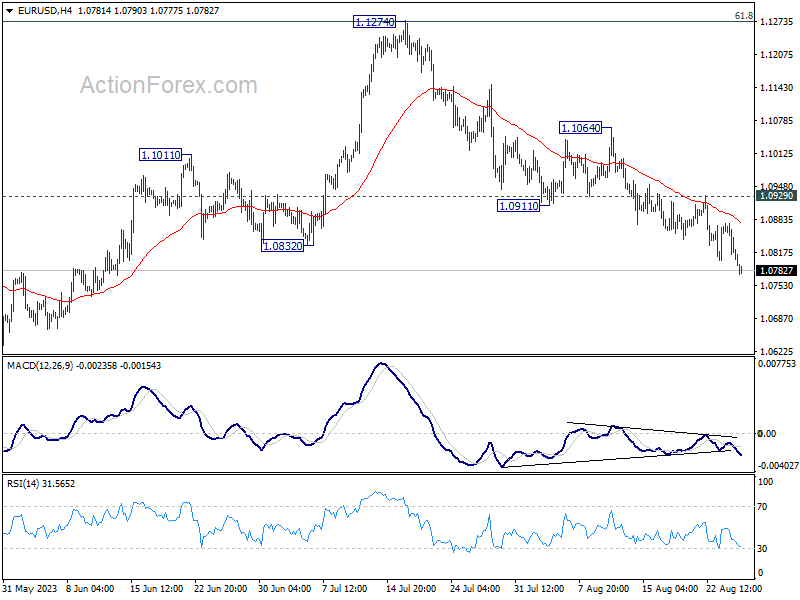
EUR/USD's fall from 1.1274 resumed after brief consolidations and intraday bias is back on the downside. Further decline would be seen to 1.0609/34 cluster support next. On the upside, break of 1.0929 resistance is needed to indicate short term bottoming. Otherwise, outlook will remain bearish in case of recovery.
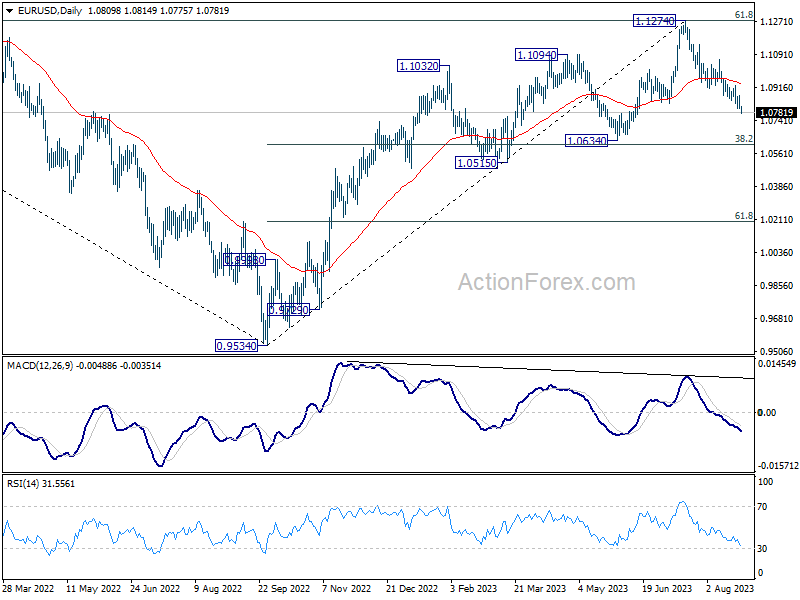
In the bigger picture, fall from 1.1274 medium term top is seen as a correction to up trend form 0.9534 (2022 low). Deeper decline would be seen to 1.0634 cluster support (38.2% retracement of 0.9534 to 1.1274 at 1.0609). Strong support could be seen there, at least on first attempt, to bring rebound. Yet, medium term outlook will be neutral for now, as long as 1.1274 resistance holds.
USD Awaits Catalyst
USD/JPY tests resistance
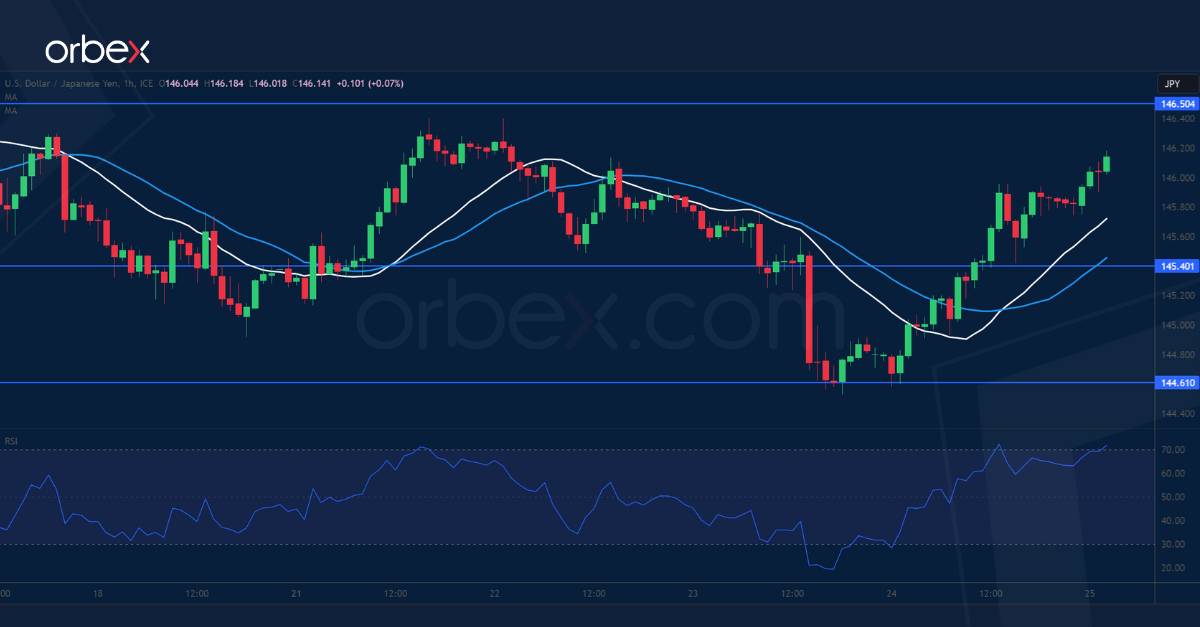
The Japanese yen retreated as the Tokyo area’s CPI fell short of expectations in August. The US dollar’s dip has come to a rest near July’s peak of 144.60, suggesting the bulls’ willingness to keep the uptrend intact in the medium-term. A close above 145.70 at the start of a previous bearish breakout is important in cutting short the selling momentum, and 145.40 from that supply area has turned into a fresh support. A break above the recent top of 146.50 would open the door to an extension to last October’s milestone at 150.00.
XAG/USD seeks support
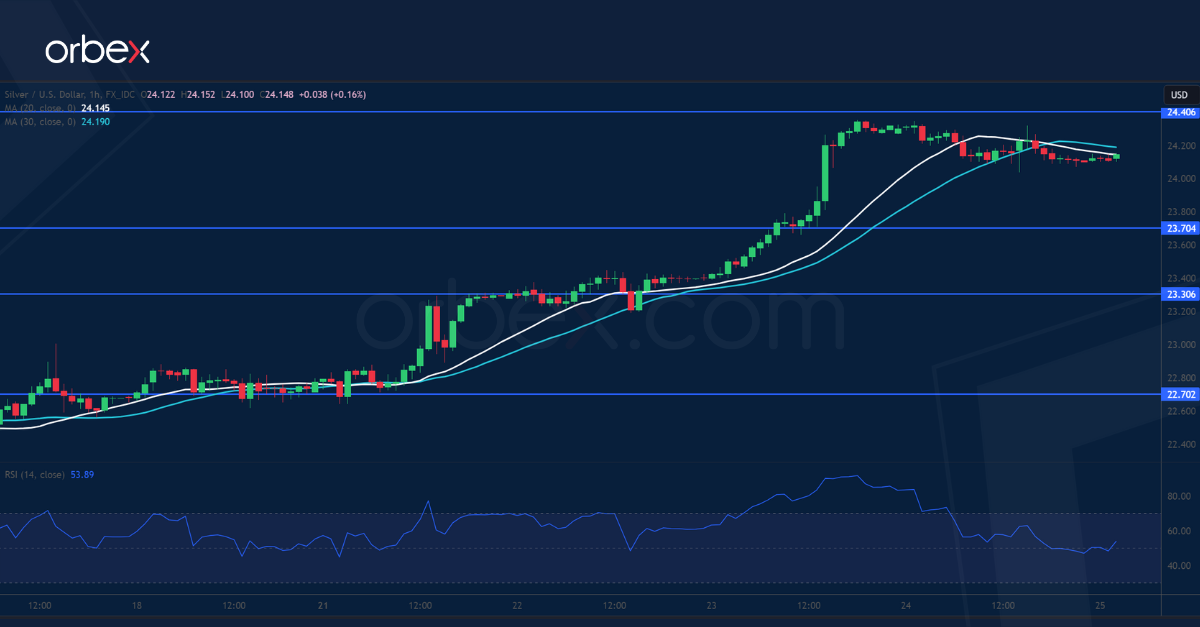
Silver consolidates gains as traders await Fed Chair Powell's speech at the Jackson Hole Symposium. A jump above the support-turned-resistance of 23.50 has forced sellers to cover, stirring up volatility in the process. 24.40 might be the bears’ last stronghold and its breach could expose last month’s high of 25.20, which would be a step closer to resume the climb from March. In the meantime, the RSI’s overbought condition caused a retreat as intraday buyers took some chips off the table. 23.70 is the first level to expect support.
NAS 100 clears resistance
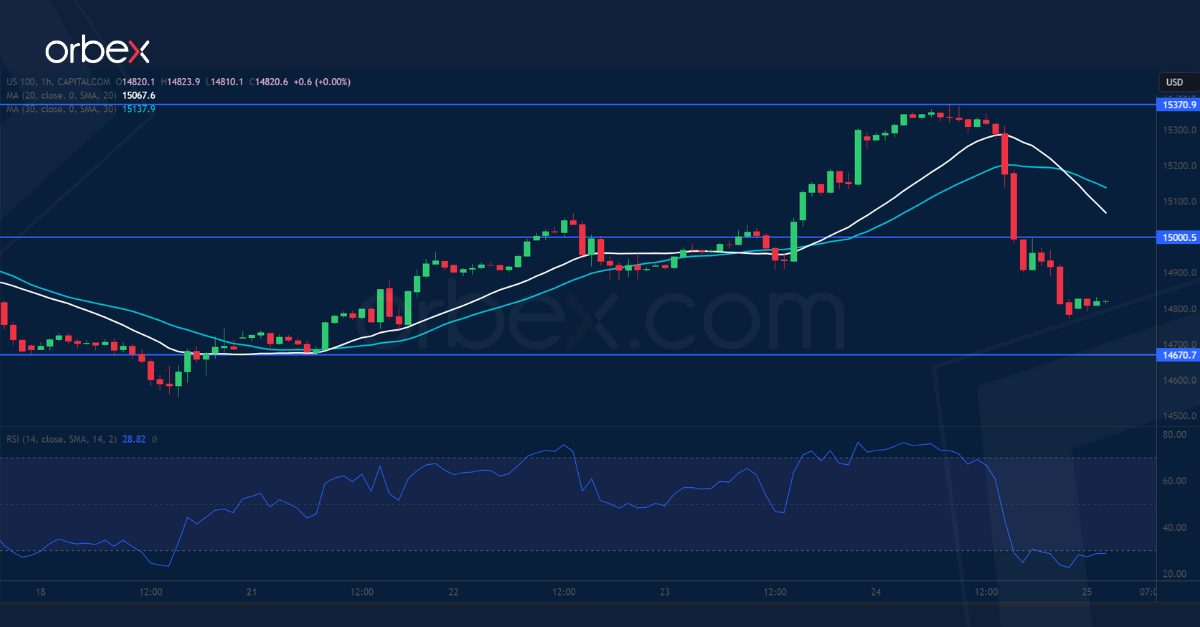
The Nasdaq 100 soared initially as Nvidia's solid revenue forecast boosted AI-related stocks. On the daily chart, a hammer pattern in the demand zone around 14700 suggests that the index might have reached its bottom. A pop above the tip of a previous swing high at 15260 has prompted more sellers to cover, clearing the path for a potential recovery to 15600. However, the bulls will need to reclaim the psychological level of 15000. As the RSI ventures into oversold territory, 14670 is a fresh level to contain the pullback.
Expect a Hawkish Market Reaction After Powell’s Address Tonight
Markets
Wednesday’s PMI-triggered correction didn’t went that far after all. In the run-up to Powell’s Jackson Hole address, it’s still all to play for when it comes to key technical levels. The US 2-yr yield closed above 5% following a daily gain of 5.3 bps. Longer tenors still added up to 3.3 bps in the US yesterday. Weekly jobless claims fell from 239k to 230k despite a surge in Hawaii with core durable goods orders exceeding forecasts. Fed speeches included Philly Fed Harker who repeated his view that the Fed has probably done enough and Boston Fed Collins who anticipates one more rate hike this year as the US economy has not yet slowed enough to put inflation on a sustainable trajectory downward. She added “I do think it’s extremely likely that we will need to hold for a substantial amount of time but exactly where the peak is, I would not signal right at this point.” Higher core yields weighed on risk sentiment as the Nvidia-driven tech rally fizzled out. Most European stock markets closed up to 0.8% lower, with the EuroStoxx 50’ s technical shooting star signal suggesting a new test of 4200 support is in the making. Losses in main US benchmarks varied between 1% and 1.8%. The dollar is ready for Powell’s speech, finally taking out 103.57 resistance in the trade-weighted index (DXY). The greenback extends its rally this morning, currently changing hands at 104.22 and immediately aiming for the May high at 104.70. EUR/USD lost 1.0834 support and dipped below the 200d moving average around 1.08. Next support is situated at 1.0635. In a broader context, smaller and less liquid currencies are all suffering in the run-up to today’s Jackson Hole speeches.
We expect a hawkish market reaction after Powell’s address tonight. He’ll put the tone on keeping rates at peak levels for an extended period of time. June dots and July FOMC Minutes clearly show a preference to hike policy rates one more time, which the Fed chair might flag. The neutral rate is another key topic. We stressed in June that silently, Fed governors were moving towards an increase of this theoretical rate. In December 2022, only 3 of them put it above 2.5% in the dot plot. This number increased to 4 in March and 7 (out of 18) in June. Higher real rate and a potential higher neutral rate have been the main driver of August market moves so far (core bond & stock sell-off with USD gains). Finally, a lot of (theoretical) debate is on raising the inflation target. Powell and co stressed that is absolutely not an option for the moment, which we agree to.
News and views
The Polish government yesterday approved the Budget draft for 2024. It now expects a budget deficit of 4.5% of GDP next year. That is substantially higher compared to the expected short-fall of 3.4% that was put forward in April when the country submitted its long-term financing plan to the European commission. In its budget projection, the government still expects economic growth of 3% in 2024 (from 0.9% this year). CPI inflation is seen at 6.6%. The proposal assumes a sharp rise in revenues from PLN 605bn to over PLN 680bn. On the spending side, the budget includes higher wages for public sector workers and it raises spending on social programs including child benefits and payments for pensioners. The government will also increase defense spending to an estimated 4.2% of GDP. Higher spending also should be seen in the light of the elections that will take place on October 15. A supportive fiscal policy might complicate the efforts of the National Bank of Poland to further reduce inflation (10.8% in July).
August inflation data for the Tokyo area published this morning mostly came out slightly softer than expected. The core inflation measure excluding fresh food eased from 3% to 2.8%. Headline inflation also decelerated from 3.2% to 2.9%. However, core inflation excluding both fresh food and energy remained at the multi-year peak of 4%. Utility prices were down 15% Y/Y due to government measures. At the same time, food prices were still 8.2% higher compared to the same month last year. Good prices rose 4% Y/Y. Services prices gained 2% Y/Y. For now, the BoJ still holds the line that it needs further confirmation that inflation returns to 2% in a sustained manner after it made ‘limited’ tweaks to its policy of Yield Curve control at the end of July policy meeting.
Nasdaq 100 Technical: Bearish Momentum Reasserts
- Bearish elements have emerged at a key inflection/resistance level of 15,415.
- The leader of the AI boom, Nvidia has shaped a bullish exhaustion where its initial price actions’ exuberance dissipated ex-post Q2 earnings result release.
- 15,135 key short-term resistance to watch on the Nasdaq 100 to maintain bearish bias.
The price actions of the US Nas 100 Index (a proxy for the Nasdaq 100 futures) have indeed shaped the expected minor countertrend rebound sequence from the 18 August 2023 low of 14,553 and rallied by +5.6% to print an intraday high of 15,375 during yesterday’s 24 August European opening hour.
The upward spurt seen on Thursday, 24 August at the start of the Asian session has been primarily attributed to a strong upmove of +6% seen in the share price of Nvidia in the after-US hours trading session of Wednesday, 23 August right after the release of its stellar fiscal Q2 earnings result.
Interestingly, the exuberance of Nvidia that has triggered an initial positive feedback loop into the benchmark US stock indices dissipated as the US session got underway yesterday.
In addition, several key bearish technical elements emerged which suggests that the potential impulsive down moves of the short to medium-term bearish trend of the US Nas 100 Index has resumed.
Daily bearish Marubozu candlestick formed right a key inflection/resistance zone
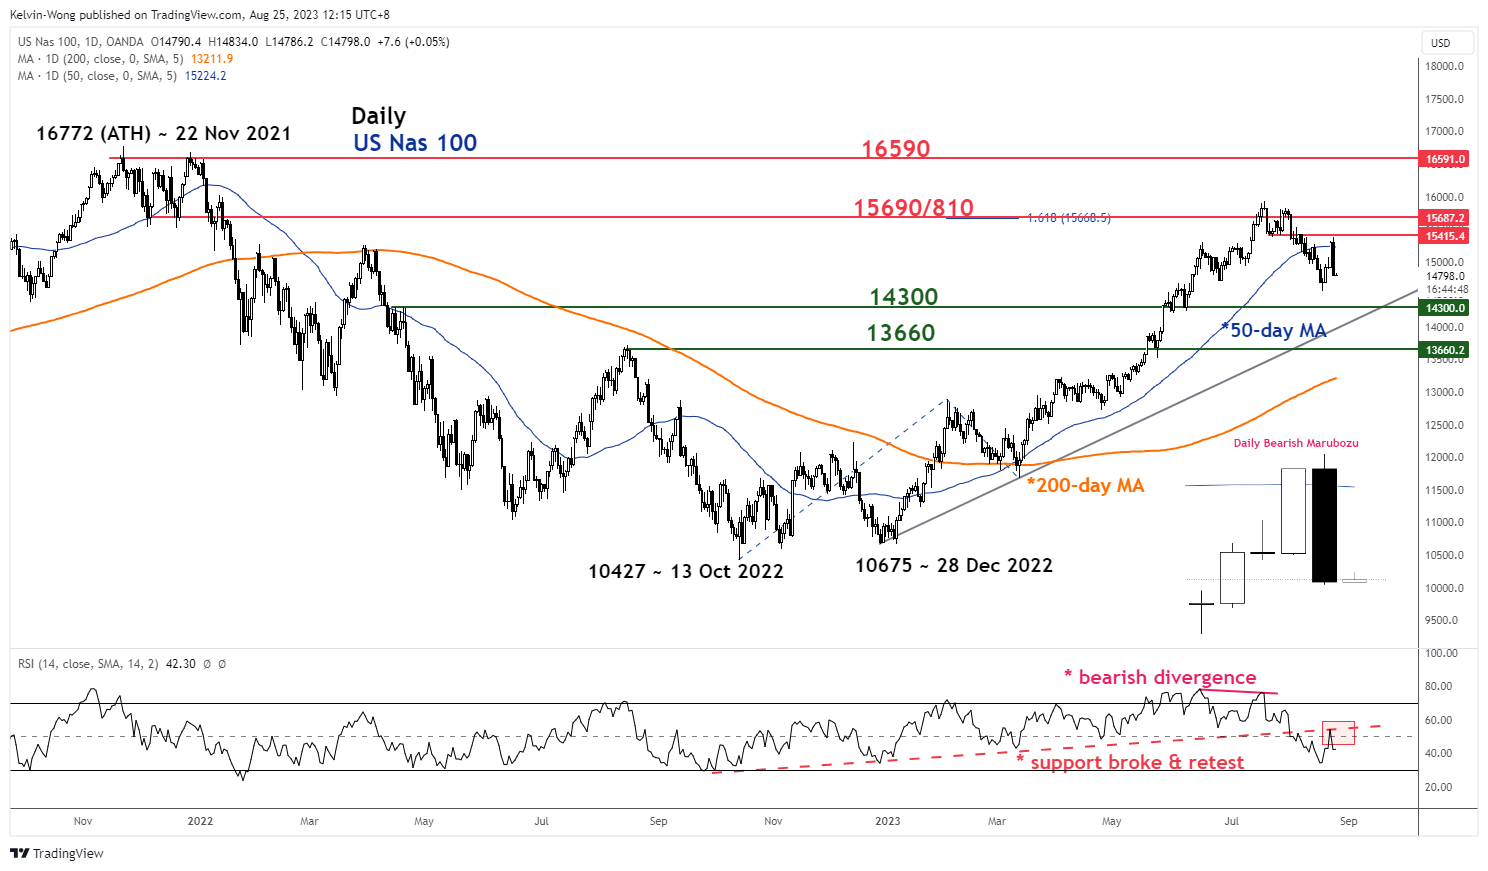
Fig 1: US Nas 100 medium-term trend as of 25 Aug 2023 (Source: TradingView, click to enlarge chart)
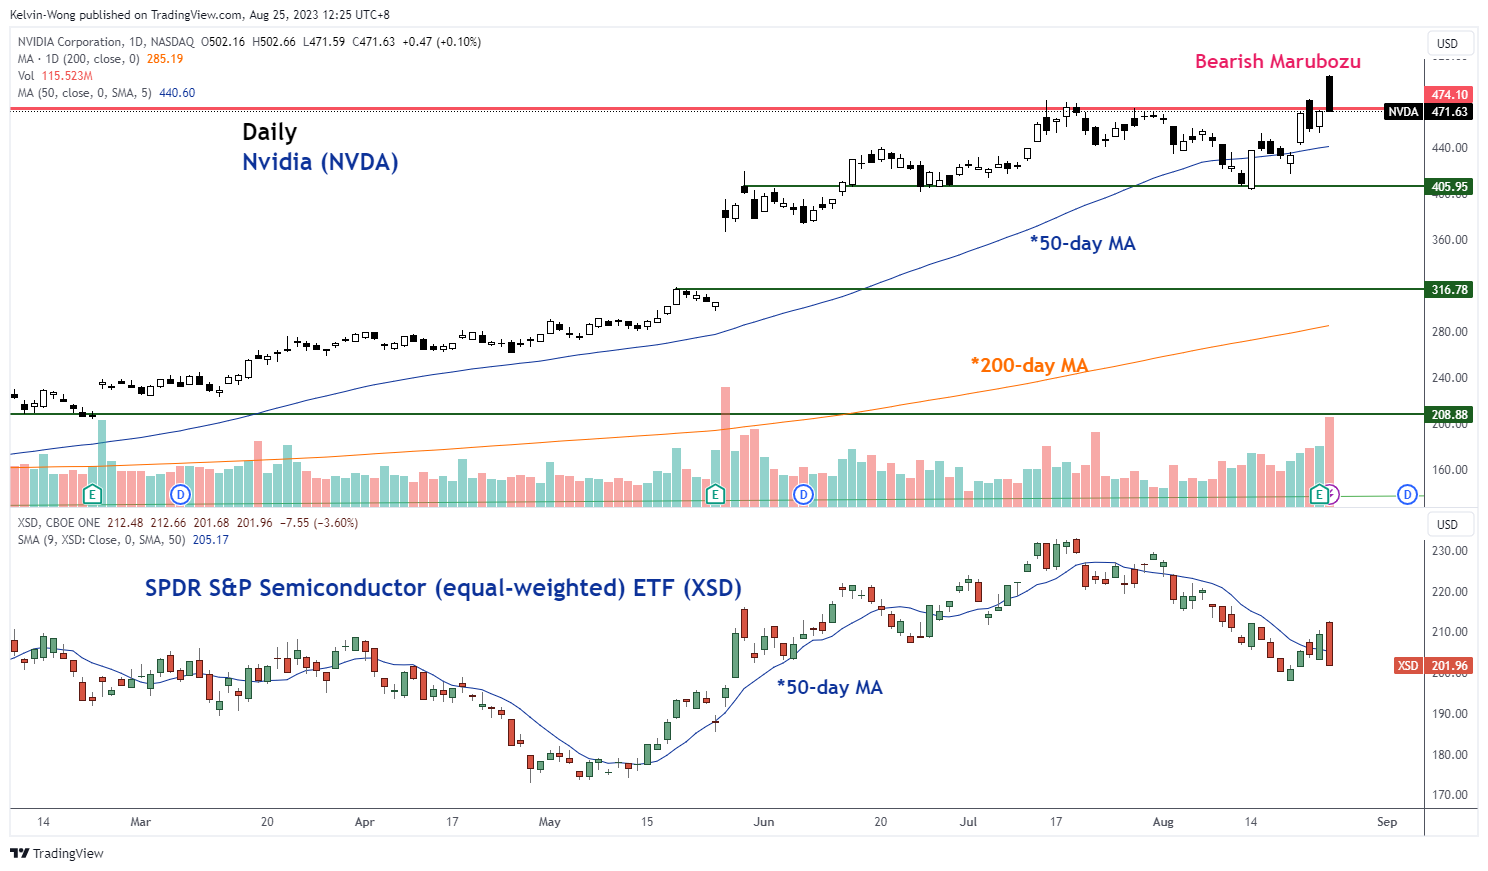
Fig 2: Medium-term trend of Nvidia & SPDR S&P Semiconductor ETF as of 24 Aug 2023 (Source: TradingView, click to enlarge chart)
As seen in Figure 1, several bearish elements have been detected on the daily chart of the US Nas 100 Index. Firstly, its price actions have formed a firm bearish tone candlestick pattern called “Marubozu”, a long-body candle where its opening price and closing price were almost the same as its intraday high and intraday low respectively.
Secondly, the emergence of such a key bearish reversal candlestick pattern is being formed right at a key inflection zone where the 50-day moving average and the former swing low of 24 July 2023 confluence at a 15,415 resistance level adds credence to a potential future bearish movement in price actions of the Index.
Thirdly, the current conditions of the daily RSI oscillator suggest that medium-term downside momentum remains intact.
The price actions of Nvidia as seen in Fig 2 have also depicted similar bearish elements where it ended yesterday’s 24 August US session with a daily bearish “Marubozu” and reintegrated below a key resistance of 474.10 with a high-volume reading.
The US Nas 100 slipped back below the 20-day moving average
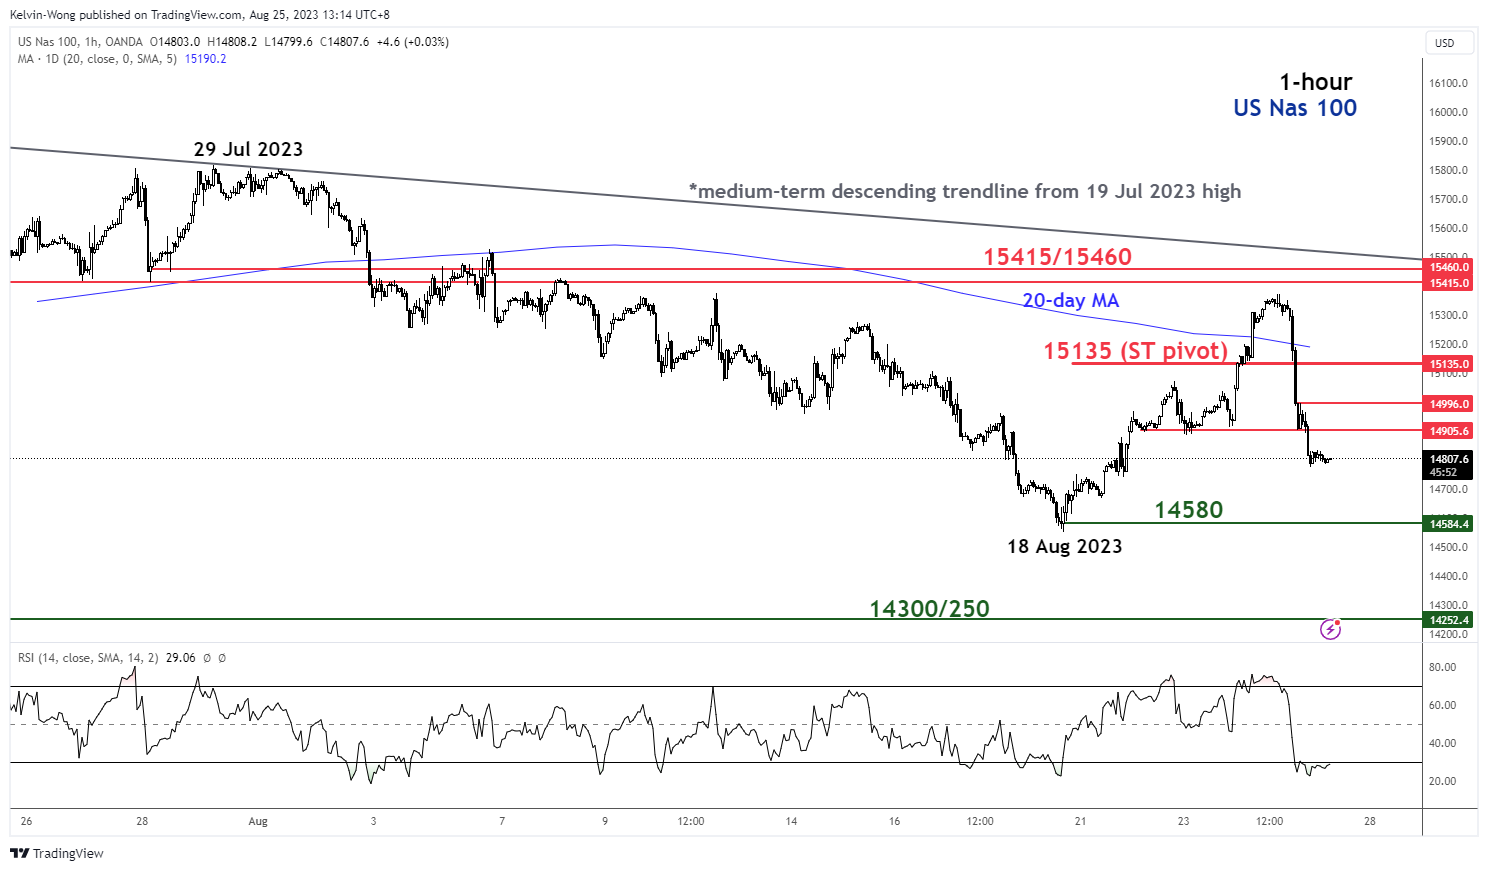
Fig 3: US Nas 100 minor short-term trend as of 25 Aug 2023 (Source: TradingView, click to enlarge chart)
The hourly chart of the US Nas 100 has indicated the potential continuation of the impulsive down move of its short-term downtrend phase as the minor countertrend rebound from the 18 August 2023 low is likely to be over.
Watch the 15,135 key short-term pivotal resistance (also the 20-day moving average) to maintain the bearish tone and a break below 14,580 exposes the next support at 14,300/250 (Fibonacci extension cluster & and a graphical support, refer to the daily chart in Fig 1).
On the other hand, a clearance above 15,135 negates the bearish tone to see a retest on the 15,415/460 medium-term resistance.
Market Jitters ahead of Jackson Hole
Market movers today
The main event today will be the US Fed's Jackson Hole Symposium where Powell will deliver his speech 16:05 CET. This is an opportunity the chairman has previously used to correct market views, for example last year. ECB president Largarde will speak at 21:00 CET.
In Germany, we get the August IFO business survey and it will be interesting to see if it confirms the gloomy picture painted by the PMIs yesterday. We also get revised GDP and other national accounts data for Q2, but that is mostly of historical interest since the indicators for July and August have been so negative.
The 60 second overview
Anxiety ahead of Jackson Hole: Bond yields moved back up again yesterday and equities moved lower ahead of key speeches at the Jackson Hole by Fed governor Jerome Powell and ECB President Lagarde later today. Markets are again pricing a more than 50% probability that the Fed and ECB will both hike again by November.
ECB's Nagel says much too early to consider rate hike pause: Bundesbank President Joachim Nagel said in an interview at the Jackson Hole that it is "much too early to think about a pause" saying that he would wait for additional data before making a decision. He pointed to still high inflation and strong labour market data. His more dovish colleague at the ECB, Portuguese Mario Centeno on the other hand urged officials to be cautious with the next policy move saying risks are materialising.
BRICS expansion: At the BRICS Summit in Johannesburg the group yesterday invited six new members into the club: Argentina, Saudi Arabia, Egypt, UAE, Iran and Ethiopia. The BRICS now represent close to half the world's population and more than 1/3 of global GDP and will likely become a stronger force representing the Global South. While it is a very diverse group their common interest is to create a stronger voice to what they see as a too Western-dominated world order with too little representation of the Global South in organisations such as the IMF, World Bank and the UN. They have also expressed a wish to create an alternative global financial infrastructure less reliant on the USD and SWIFT.
Equities: Global equities reversed yesterday after the optimism on Wednesday. Market more or less flipped around, the reason being renewed yield, inflation and central banks fear. A couple of solid macro data and a hawkish leaning Fed was enough to ruin the fragile inflation optimism built on Wednesday. Hence, Powell's speech this afternoon will be followed closely. Growth underperforming together with cyclicals while VIX ticking back north of 17. In US Dow -1.1%, S&P 500 -1.4%), Nasdaq -1.9% and Russell 2000 -1.3%. The negative sentiment drags on to Asia this morning with Japanese stocks being down almost 2%. US and European futures close to unchanged while waiting for the afternoon speech from Mr. Powell.
FI: The initial yield drop from the market open was gradually reversed through the day amid little significant news flow as we await Powell and Lagarde today at Jackson Hole. The yields in the 10y point were broadly unchanged on the day. After Wednesday's PMIs markets are pricing only 9bp at the ECB September meeting in three weeks' time.
FX: Risk sentiment remains shaky and equities dropped as for the first time the US money market sees an above 50% probability of a November hike. This translated into USD strength, with EUR/USD taking out new 3M lows below 1.08. As per usual, the sour risk sentiment hurt the NOK but surprisingly the SEK showed more resilience. Slightly lower-than-expected Japanese inflation over night adds to the upside in USD/JPY.
Credit: Though CDS indices opened sharply tighter, sentiment turned around during the afternoon, which led iTraxx Xover to widen 2.2bp and Main to close more or less unchanged. Primary market activity was muted, with the only new deals brought to the EUR market being in covered bond format.
Nordic macro
In Sweden unemployment and PPI data is released today.