

Sample Category Title
GBP/USD Mid-Day Outlook
Daily Pivots: (S1) 1.2638; (P) 1.2702; (R1) 1.2788; More...
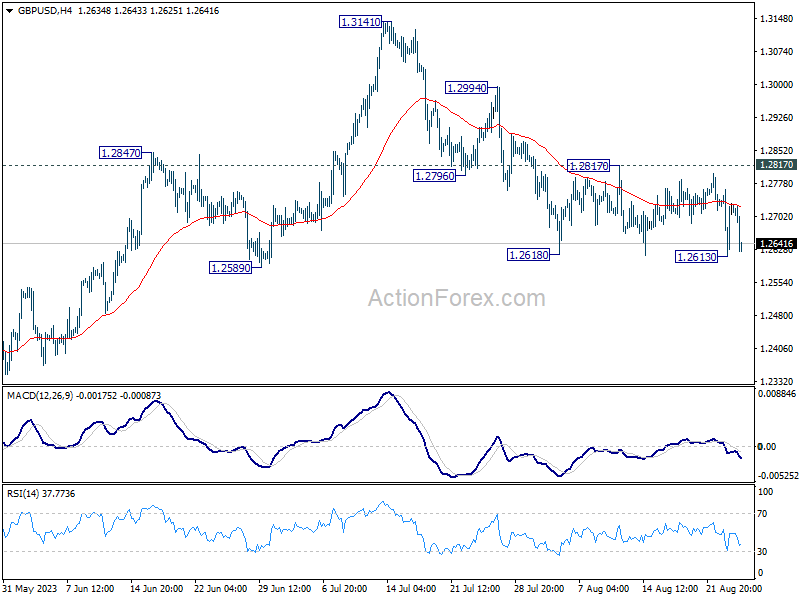
Intraday bias in GBP/USD stays neutral for the moment. On the downside, firm break of 1.2613 and sustained trading below 1.2678 resistance turned support will argue that it's already in a larger correction. Deeper decline would then be seen to 1.2306 support next. Nevertheless, break of 1.2817 minor resistance will indicate that the pull back from 1.3141 has completed, and turn bias back to the upside for stronger rebound.
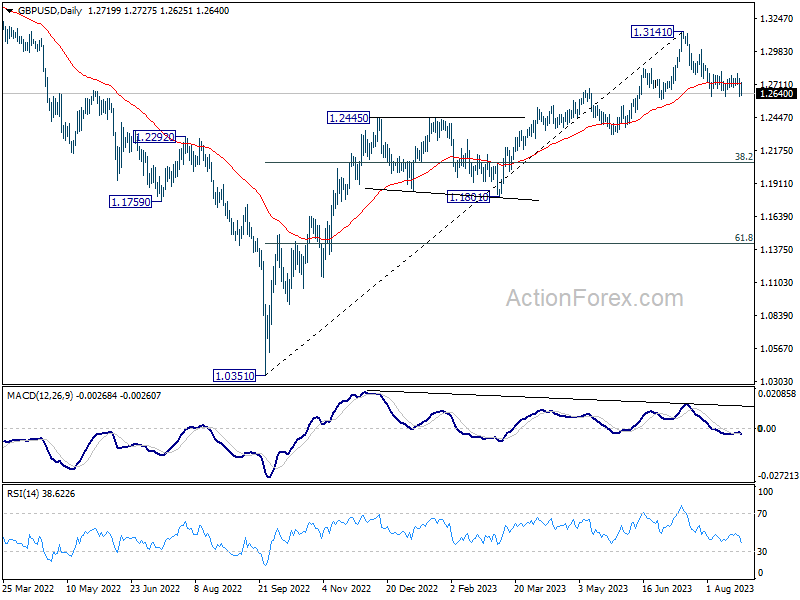
In the bigger picture, a medium term top could be in place at 1.3141 already, on bearish divergence condition in D MACD. Sustained trading below 55 D EMA (now at 1.2723) should confirm this case, and bring deeper fall to 38.2% retracement of 1.0351 to 1.3141 at 1.2075, as a correction to up trend from 1.0351 (2022 low). For now, rise will stay mildly on the downside as long as 1.3141 resistance holds, in case of strong rebound.
USD/JPY Mid-Day Outlook
Daily Pivots: (S1) 144.29; (P) 145.10; (R1) 145.65; More...
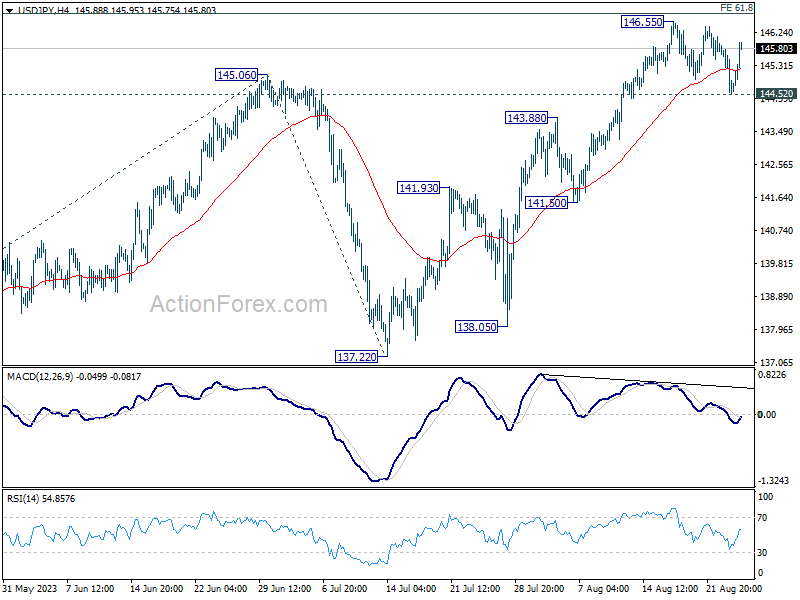
Intraday bias in USD/JPY remains neutral for the moment. On the upside, sustained break of 61.8% projection of 129.62 to 145.06 from 137.22 at 146.76 will pave the way to retest 151.93 high. However, considering bearish divergence condition in 4H MACD, firm break of 144.52 support will be a sign of reversal, and turn bias back to the downside for 55 D EMA (now at 142.30).
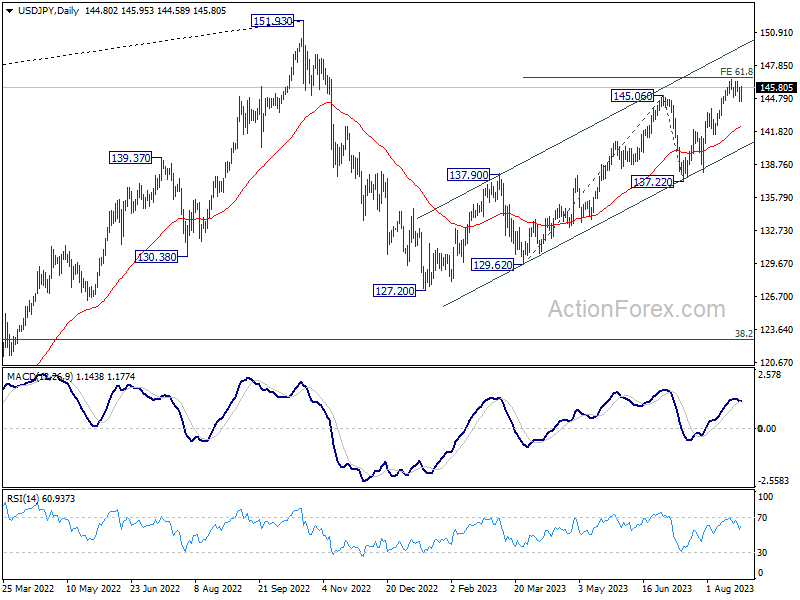
In the bigger picture, overall price actions from 151.93 (2022 high) are views as a corrective pattern. Rise from 127.20 is seen as the second leg of the pattern and could still be in progress. But even in case of extended rise, strong resistance should be seen from 151.93 to limit upside. Meanwhile, break of 137.22 support should confirm the start of the third leg to 127.20 (2023 low) and below.
USD/CHF Mid-Day Outlook
Daily Pivots: (S1) 0.8763; (P) 0.8790; (R1) 0.8806; More....
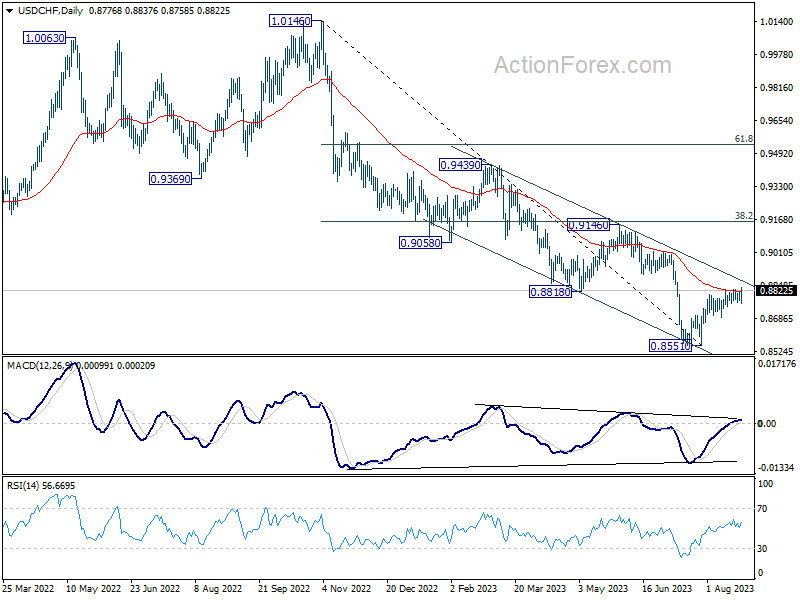
USD/CHF's break of 0.8826 suggest that rebound from 0.8551 is resuming, and intraday bias is back on the upside. Sustained trading above 0.8818 support turned resistance will carry larger bullish implication, and target 0.9146 cluster resistance next. On the downside, below 0.8758 support will turn bias back to the downside for 0.8688 support instead.
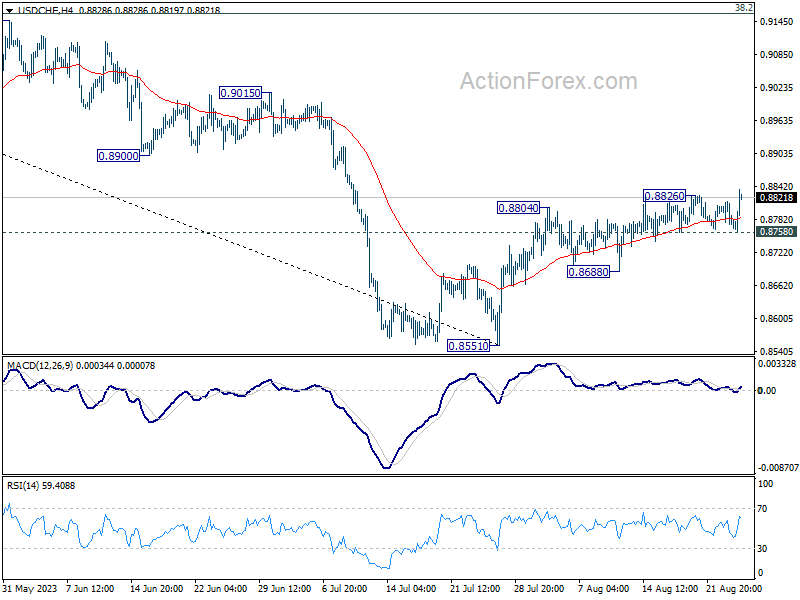
In the bigger picture, a medium term bottom could be in place at 0.8551 already, on bullish convergence condition in D MACD. Sustained trading above 0.8818 support turned resistance will bring further rise to 0.9146 cluster resistance (38.2% retracement of 1.0146 to 0.8551 at 0.9160), even as a correction. Nevertheless, break of 0.8851 will resume the down trend from 1.0146 instead.
Dollar Resurgence Amid Rising Treasury Yields
Dollar exhibits renewed vigor in the early US trading hours, marking broad-based gains. While today's data showcased robust initial jobless claims and a mixed bag for durable goods orders, these don't seem to be the primary catalysts fueling the Dollar's ascent. A more plausible driver is the resurgence of treasury yield, with the 10-year yield reclaiming territory above 4.2% mark. The tech-heavy NASDAQ is also poised for an upbeat opening, bolstered by Nvidia's impressive post-market earnings release from the prior day. However, DOW futures tell a more muted tale.
As the day progresses, Canadian Dollar is tailing the US counterpart, as the day's second-best performer. Euro trails close behind. At the other end of the spectrum, Kiwi and Aussie languish, with Sterling also underperforming. The Japanese Yen and Swiss Franc exhibit a mixed performance, failing to set a clear direction.
Technically, USD/CHF's break of 0.8826 temporary top suggest that rebound form 0.8851 is resuming. Focus will be on whether EUR/USD and GBP/USD would follow by breaking through 1.0801 and 1.2613 temporary lows. Also, USD/CHF could be marching back to 146.55 resistance too. Break of all these level together will confirm underlying bullish momentum in the greenback. However, such a rally may hinge on hawkish insights from Fed Chair Jerome Powell and fellow attendees at the Jackson Hole Symposium.
In Europe, at the time of writing, FTSE is up 0.25%. DAX is up 0.06%. CAC is up 0.14%. Germany 10-year yield is up 0.0030 at 2.524. Earlier in Asia, Nikkei rose 0.87%. Hong Kong HSI rose 2.05%. China Shanghai SSE rose 0.12%. Singapore Strait Times rose 0.21%. Japan 10-year JGB yield dropped -0.0284 to 0.649.
US durable goods orders down -5.2% as transport equipment fell -14.2%
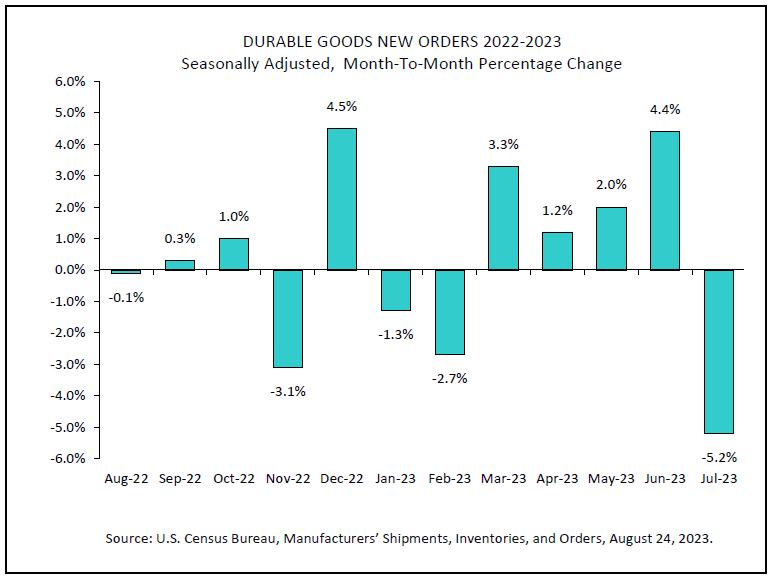
US durable goods orders dropped -5.2% mom to USD 285.9B in July, worse than expectation of -4.0% mom. Ex-transport orders rose 0.5% mom to USD 187.2B, above expectation of 0.2% mom. Ex-defense orders dropped -5.4% mom to USD 270.9B. Transportation equipment fell -14.2% mom to USD 98.7B.
US initial jobless claims down -10k to 230k
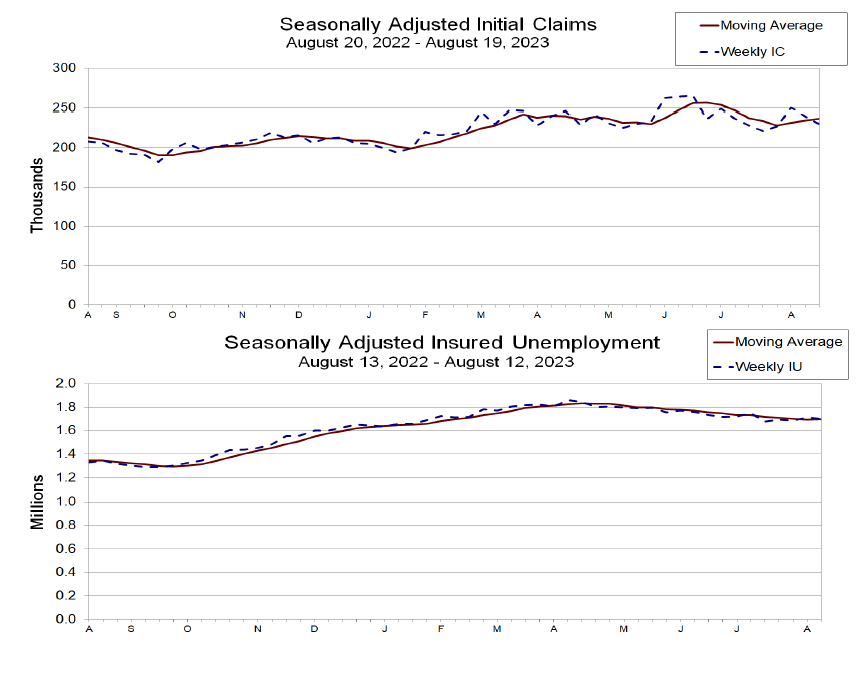
US initial jobless claims fell -10k to 230k in the week ending August 19, better than expectation of 241k. Four-week moving average of initial claims rose 2k to 238k.
Continuing claims dropped -9k to 1702k in the week ending August 12. Four-week moving average of continuing claims rose 6k to 1697k.
USD/CHF Mid-Day Outlook
Daily Pivots: (S1) 0.8763; (P) 0.8790; (R1) 0.8806; More....
USD/CHF's break of 0.8826 suggest that rebound from 0.8551 is resuming, and intraday bias is back on the upside. Sustained trading above 0.8818 support turned resistance will carry larger bullish implication, and target 0.9146 cluster resistance next. On the downside, below 0.8758 support will turn bias back to the downside for 0.8688 support instead.
In the bigger picture, a medium term bottom could be in place at 0.8551 already, on bullish convergence condition in D MACD. Sustained trading above 0.8818 support turned resistance will bring further rise to 0.9146 cluster resistance (38.2% retracement of 1.0146 to 0.8551 at 0.9160), even as a correction. Nevertheless, break of 0.8851 will resume the down trend from 1.0146 instead.
Economic Indicators Update
| GMT | Ccy | Events | Actual | Forecast | Previous | Revised |
|---|---|---|---|---|---|---|
| 12:30 | USD | Initial Jobless Claims (Aug 18) | 230K | 241K | 239K | |
| 12:30 | USD | Durable Goods Orders Jul | -5.20% | -4.00% | 4.60% | |
| 12:30 | USD | Durable Goods Orders ex Transportation Jul | 0.50% | 0.20% | 0.50% | |
| 14:30 | USD | Natural Gas Storage | 36B | 35B |
US initial jobless claims down -10k to 230k
US initial jobless claims fell -10k to 230k in the week ending August 19, better than expectation of 241k. Four-week moving average of initial claims rose 2k to 238k.
Continuing claims dropped -9k to 1702k in the week ending August 12. Four-week moving average of continuing claims rose 6k to 1697k.
US durable goods orders down -5.2% as transport equipment fell -14.2%
US durable goods orders dropped -5.2% mom to USD 285.9B in July, worse than expectation of -4.0% mom. Ex-transport orders rose 0.5% mom to USD 187.2B, above expectation of 0.2% mom. Ex-defense orders dropped -5.4% mom to USD 270.9B. Transportation equipment fell -14.2% mom to USD 98.7B.
BTCUSD Consolidates as Declines Pauses
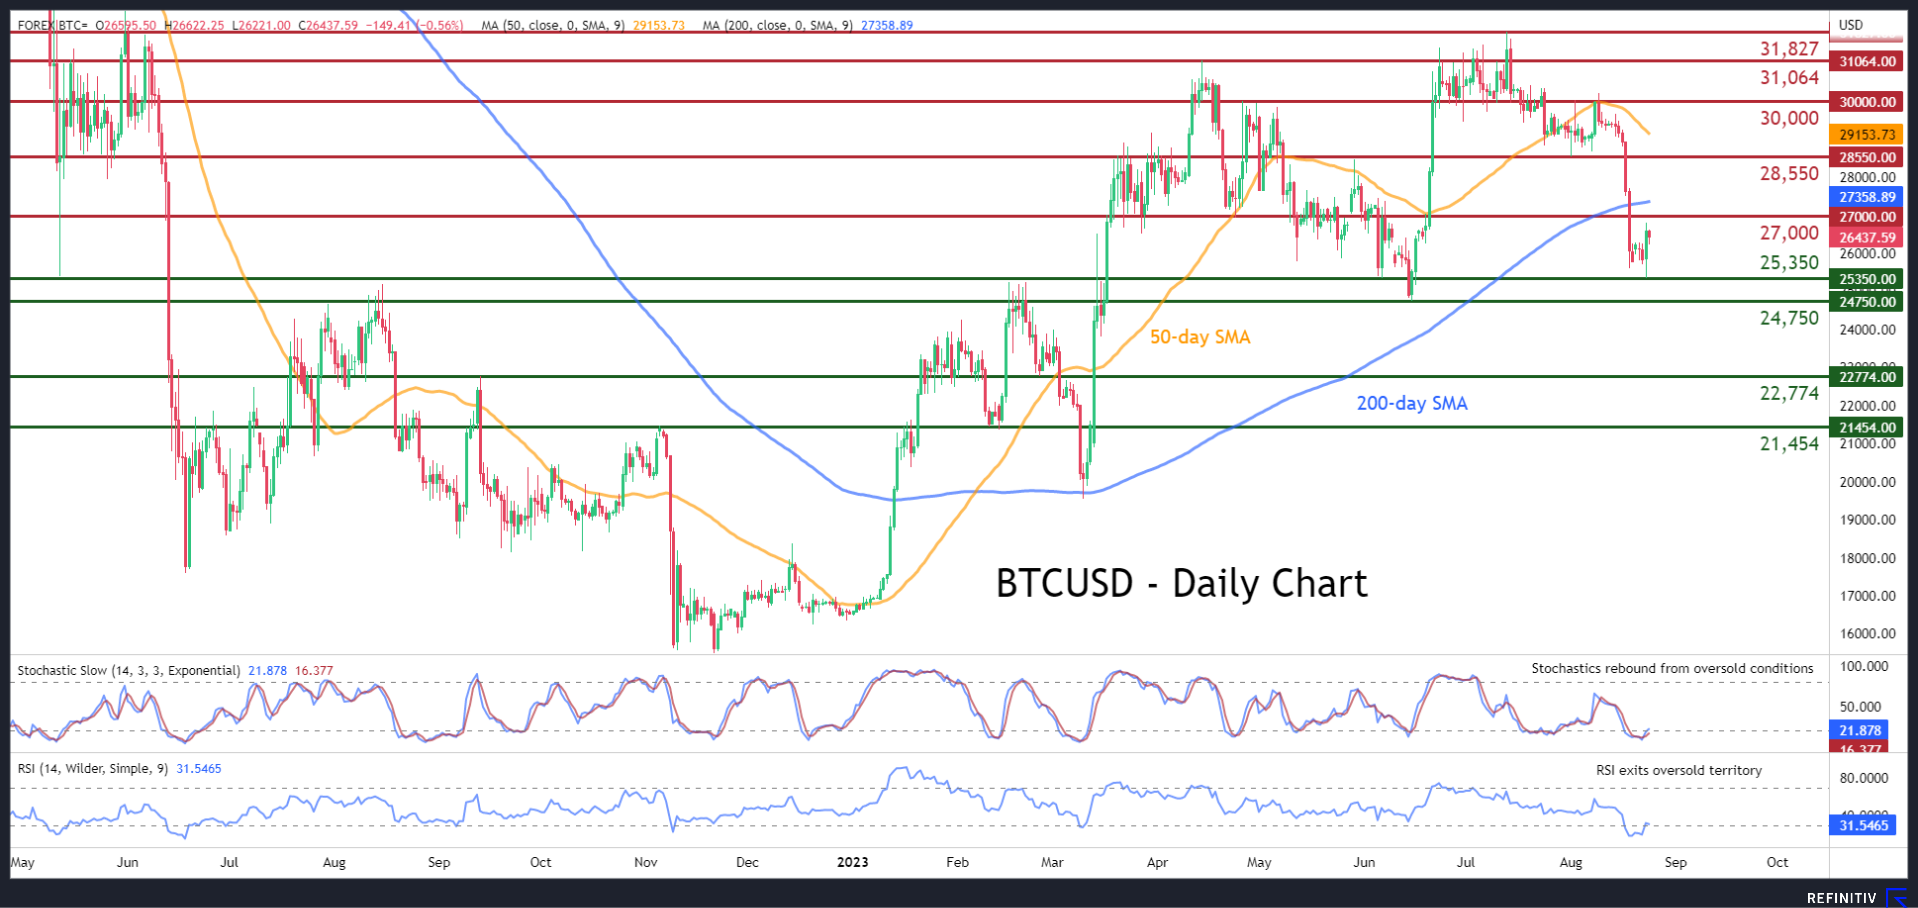
After a prolonged period of sideways trading during the summer months, BTCUSD (Bitcoin) experienced a vast sell-off, dropping to a fresh two-month low of 25,350. Nevertheless, the king of cryptos appears to have temporarily paused its decline, with the price trading without clear direction for the past few sessions.
The momentum indicators currently suggest that bearish pressures are fading. Specifically, both the RSI and the stochastic oscillator managed to escape their oversold territories, hinting that the latest drop might have been overstretched.
If selling interest reignites, the recent two-month low of 25,350 could act as the first line of defense. Should that floor collapse, the spotlight could turn to the June bottom of 24,750 ahead of the 22,774 hurdle. Further retreats could then cease at 21,454, which served both as support and resistance in the past.
Alternatively, should the price regain traction, the April bottom of 27,000 might be the first obstacle for buyers to claim. Surpassing this zone, Bitcoin could advance towards the May resistance of 28,550 before it faces the crucial 30,000 psychological mark. A violation of the latter could open the door for the April peak of 31,064.
Overall, BTCUSD seems to have managed to halt its retreat, but the near-term risks remain tilted to the downside. For the bulls to regain confidence, the price needs to jump back above the 200-day simple moving average (SMA).
GER 40 Index Trims Losses But is Not Out of the Woods
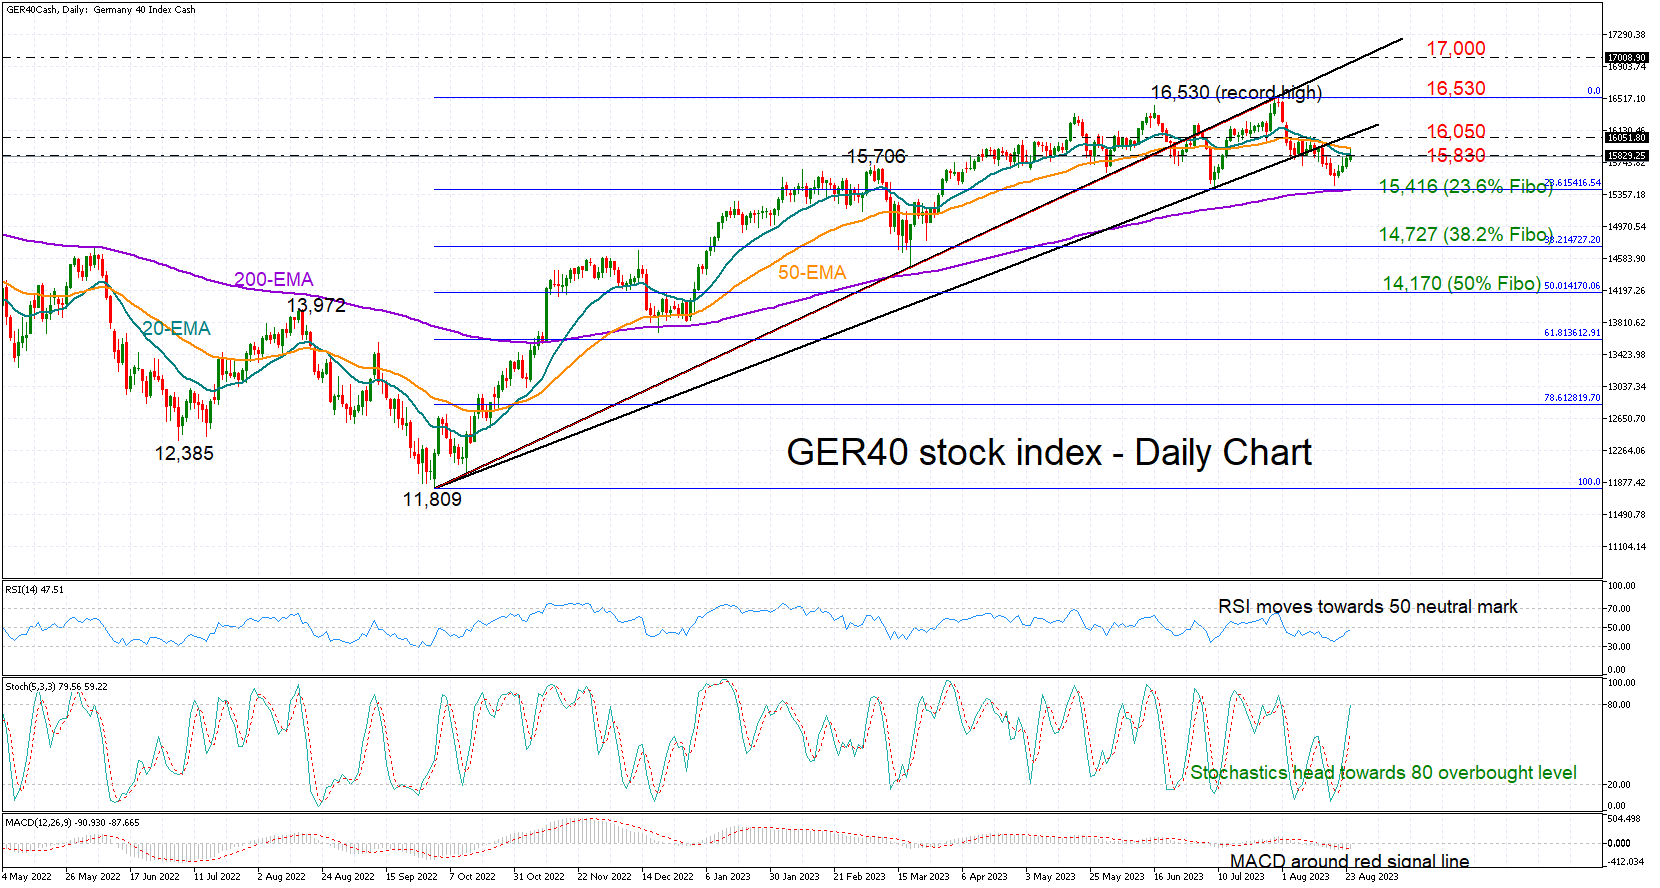
The German 40 index (cash) corrected higher after completing a bullish morning star pattern near its July low of 15,455 and just above the 23.6% Fibonacci retracement of the October 20222-August 2023 uptrend. The 200-day exponential moving average (EMA) made this area important to watch as well.
The rising RSI is an encouraging sign of an improving market sentiment, but the indicator has yet to confirm a bullish bias above its 50 neutral mark. Likewise, the MACD is still hovering around its red signal line despite its soft upturn, while the stochastic oscillator is not far below its 80 overbought level.
Hence, some caution is necessary because the price is testing its 20-day EMA just below the broken ascending trendline from October 2022 at 16,050. A decisive close above that wall could bolster upside pressures towards the record high of 16,530 registered in July. If the bulls stretch into the uncharted territory, they could aim for the 17,000 psychological mark, where the extension of the upper ascending line from October 2022, which stalled the uptrend in July, is positioned.
In the event that the price resumes its bearish short-term trajectory below the 200-day EMA at 15,416, it could depreciate towards the 38.2% Fibonacci area of 14,727. The 50% Fibonacci level of 14,170 might be the next destination if selling forces intensify.
Overall, the GER 40 index keeps fluctuating within a range in the short-term picture. A break above 16,530 or below 15,415 could provide the next direction to the market.
GBP/USD Bounces Back after Falling 1% in One Day
The publication of news on the UK PMI index yesterday signaled an acceleration of the downturn in business activity. The index value was 42.5 (values below 50 indicate a slowdown in the economy). This is the thirteenth consecutive reading of the index below 50, with readings below 42.5 last recorded during the height of the pandemic in the spring of 2020.
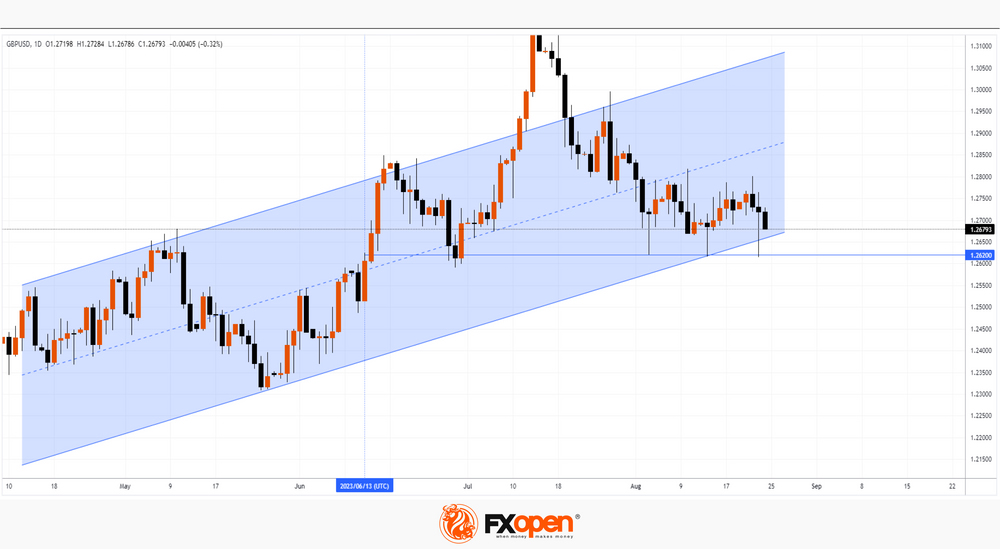
The first reaction to the news was a sharp drop in the GBP/USD rate, but by the end of the trading session, the rate recovered, which can be considered evidence of strong demand.
More bullish arguments are given by the analysis of the volumes of trading in futures for the British pound on the CME exchange:
→ the largest trading volumes for the year were recorded on June 13 (more than 240k contracts were traded at an average of about 100k per day). If you draw a horizontal level from the high of this candle at 1.262, you will see how it acts as support;
→ yesterday, extremely high volumes (more than 155k contracts) were recorded again on a candle with a long lower shadow. That is, high volumes, reflecting the activity of large players, may indicate the relevance of demand for the pound at a price of 1.262.
Moreover, the pound is near the lower border of the rising channel.
Bearish arguments:
→ Since mid-July, the GBP/USD rate has shown a bearish trend. And if there is a breakdown of the level of 1.262, where large volumes were noticed, this will be an important confirmation of the superiority of sellers.
→ Fundamentally, the UK economy looks weaker than the rest, including due to higher inflation rates, which makes the prospects for the pound vague.
This article represents the opinion of the Companies operating under the FXOpen brand only. It is not to be construed as an offer, solicitation, or recommendation with respect to products and services provided by the Companies operating under the FXOpen brand, nor is it to be considered financial advice.
Price of WTI Oil Falls to August Minimum
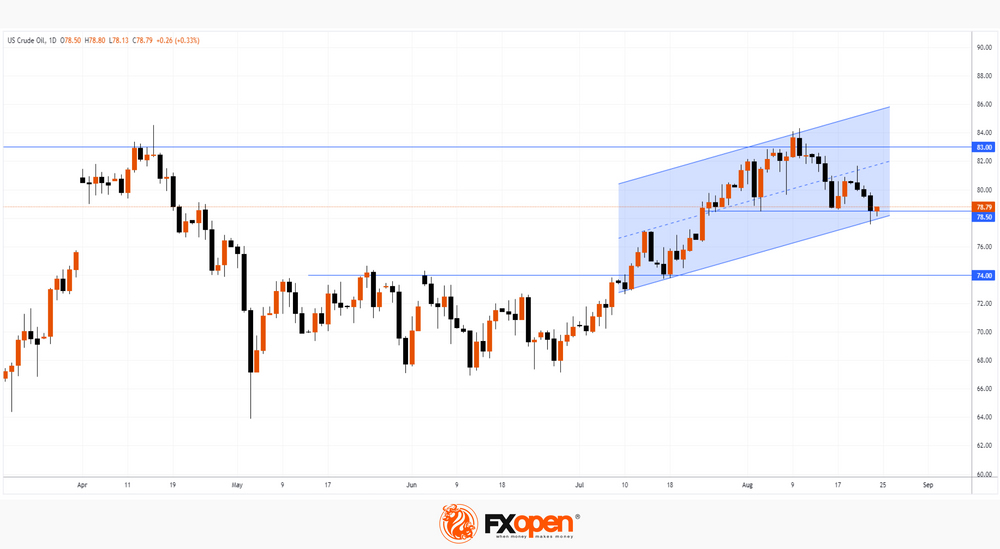
As the chart shows, US Crude Oil fell below USD 78 yesterday for the first time since July 25. This was facilitated by:
→ fears of a crisis that could follow from the collapse of the Chinese property developer Evergrande;
→ alarming PMI data from different economies. Japan reported a contraction in manufacturing activity for the third month in a row. Business activity in the euro area also fell more than expected, especially in Germany. Business activity in the US in August approached the point of stagnation, while growth was the weakest since February.
Bullish arguments:
→ The market has been bullish since July. And the current rollback from the top of July is just a correction.
→ The price of WTI Crude may find support from the lower border of the rising channel, as well as from the level of USD 78.50, from which the price has already formed bullish reversals in August.
→ The level of USD 74 looks like a reliable support.
Bearish arguments:
→ The USD 83 level has served as strong resistance throughout the year. This may be due to the fact that increasing the price above is not beneficial for governments and central banks that are fighting inflation.
→ A candle with a long upper shadow on August 21 (followed by 2 more bearish candles) indicates bearish activity.
This article represents the opinion of the Companies operating under the FXOpen brand only. It is not to be construed as an offer, solicitation, or recommendation with respect to products and services provided by the Companies operating under the FXOpen brand, nor is it to be considered financial advice.