Sample Category Title
Amazing Nvidia
Nvidia announced STUNNING results when it released its Q2 earnings yesterday after the bell. The company reported $13.5bn sales last quarter, well above its $11bn projection, and said that it expects $16bn sales for next quarter, up from $12.6bn forecast last quarter. And oh, earnings jumped to $2.70 per share, versus $2.09 expected by analysts, and the most-loved chipmaker of the year approved $25bn in share buybacks. There is nothing an investor could ask more. The market expectations were sky-high, the results went to the moon, the forecasts for this quarter are as stunning, and the company is expected to earn around $30bn in FY2024 because Nvidia is not and will not be concerned about the industry-wide slump in chips demand, thanks to a decent surge in demand for AI processors in data centers. Magic is happening for Nvidia. So, the stock price jumped 10% in the afterhours trading to flirt with $518 per share, and Nvidia news has a boosting effect on technology stocks, if nothing by confirming that all the talk around the AI-craze was not empty, after all. Nasdaq futures are up by around 1.23% this morning, the S&P500 futures are also in the positive, and further good news is that the yields are down from Europe to US, on meagre PMI numbers released yesterday. And that is the perfect combo for the tech stocks – which have, so far this year, been – unquestionably - the best place to be in the S&P500 this year.
PMI disappointment
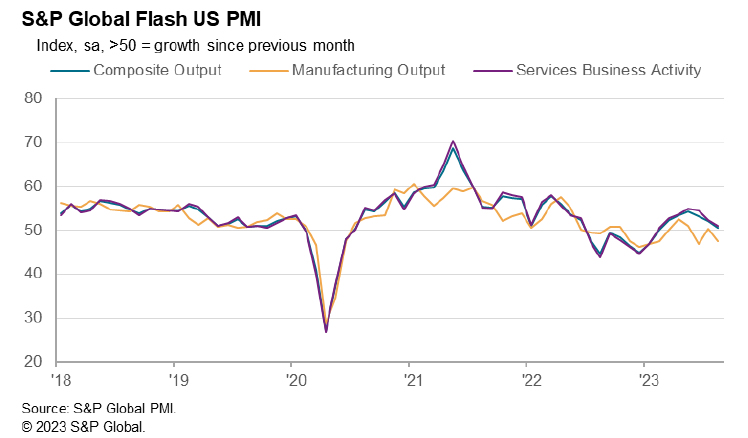
The US 2-year yield slipped below 5% as both manufacturing and services PMI fell unexpectedly in August, adding a layer of complexity to US data, which strong enough to push Atlanta Fed’s GDP forecast for Q3 to 5.8% last week.
August PMI numbers in Europe printed even worse numbers than in the US. The manufacturing PMI was slightly better than expected but remained well below the 50 threshold – in the contraction zone. More disquietingly, the euro-area’s services PMI slipped below 50 – to the contraction zone for the first time since January. What’s even more worrying is that, the services PMI fell into the contraction for the busiest summer month for mass holidays.
As a result, traders now price around 40% chance for a 25bp hike in European Central Bank’s (ECB) next policy meeting, down from 55% before the release. The EURUSD tested the 200-DMA to the downside and remains under the pressure of rising dovish voices for the ECB. And the European bond markets rally: the German 10-year yield fell more than 5.5% yesterday. We see the same gloom across the Channel. All British PMI figures were below 50, and came in worse than expected, pushing Cable shortly below its 100-DMA, which stands near 1.2635. The EURGBP on the other hand fell to a fresh year low, as the continent is now expected to join the UK in its economic demise.
This being said, slow PMI numbers could eventually convince the ECB to slow down on its rate normalizing policy, but it won’t be enough to reverse the policy stance if inflation remains high. The ECB, as the Fed, won’t hesitate to push economies into further economic trouble if inflation doesn’t come down toward their 2% policy target.
The set of morose economic data kept the US crude below the $80pb level, even though the US inventories dived more than 6 mio barrels for the second consecutive week. Trend and momentum indicators remain comfortably negative, and the market conditions are far from the oversold territory, meaning that there is room for a deeper downside correction in oil prices. The key level to watch is the $78.40 level, the major 38.2% Fibonacci retracement on the latest rally and which should, if broken to the downside, call the end of the rally and encourage a bearish reversal, which would then pave the way for a further fall to the 200-DMA, which stands near $75.80pb.
Technical Outlook and Review
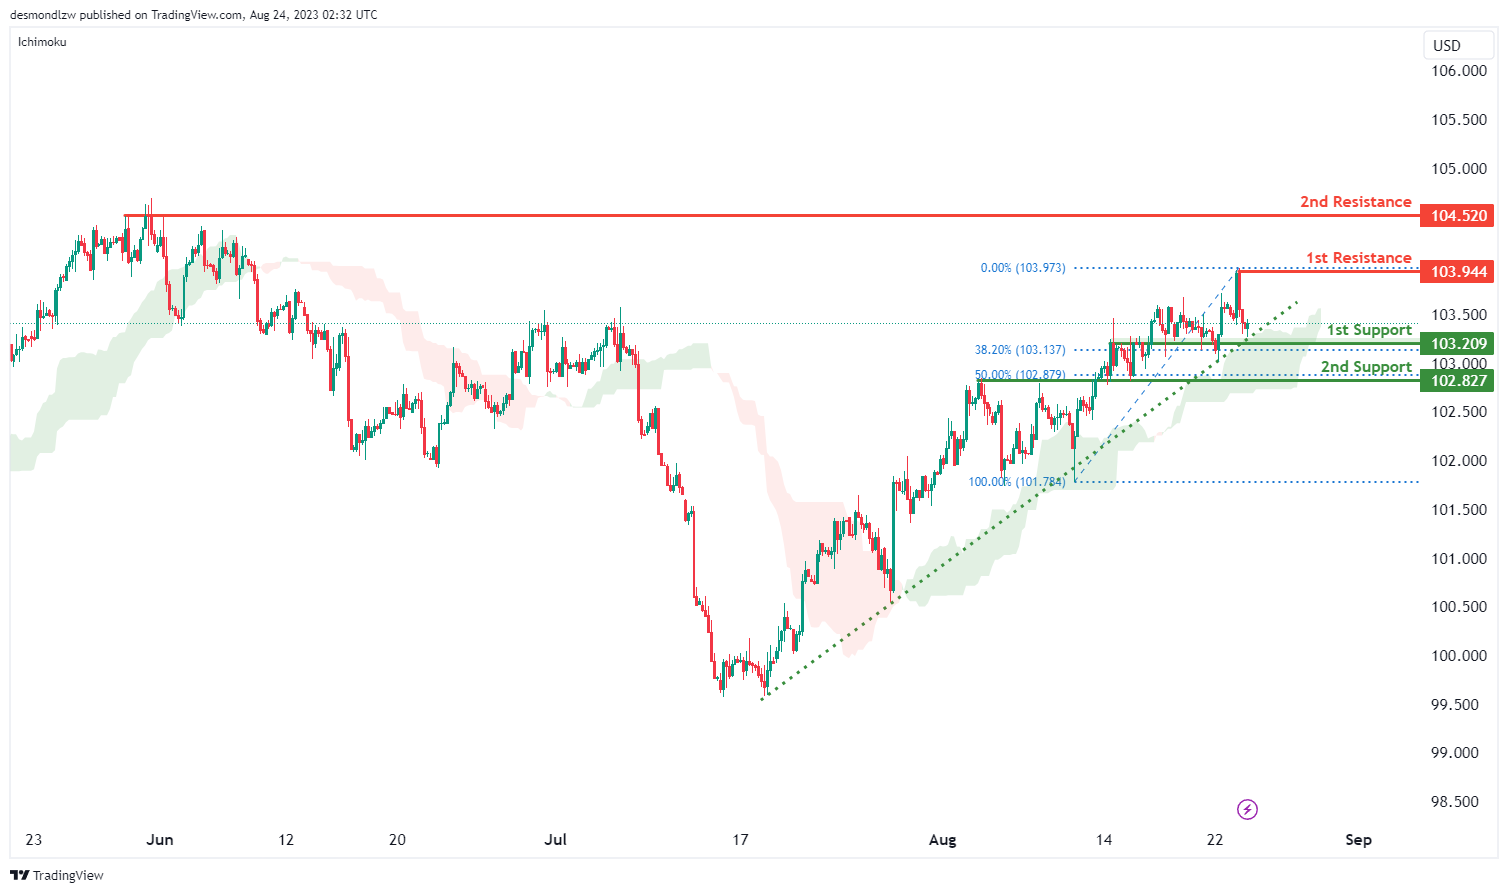
DXY:
The DXY chart currently exhibits a bullish momentum, indicating a prevalent upward trend in the market.
This bullish momentum is supported by the fact that the price is above a major ascending trend line, signifying the potential for further upward movement. Additionally, the price remains above the bullish Ichimoku cloud, contributing to the overall positive momentum.
In this context, there’s a possibility that the price could experience a bullish rebound upon reaching the 1st support level at 103.20. This support level gains significance as an overlap support and aligns with the 23.60% Fibonacci Retracement level. Similarly, the 2nd support at 102.82 holds importance as an overlap support and corresponds to the 50% Fibonacci Retracement level.
On the resistance side, the 1st resistance level at 103.92 stands out as a swing high resistance, potentially posing a hurdle to further upward movement. Similarly, the 2nd resistance at 104.50 gains significance as a multi-swing high resistance.
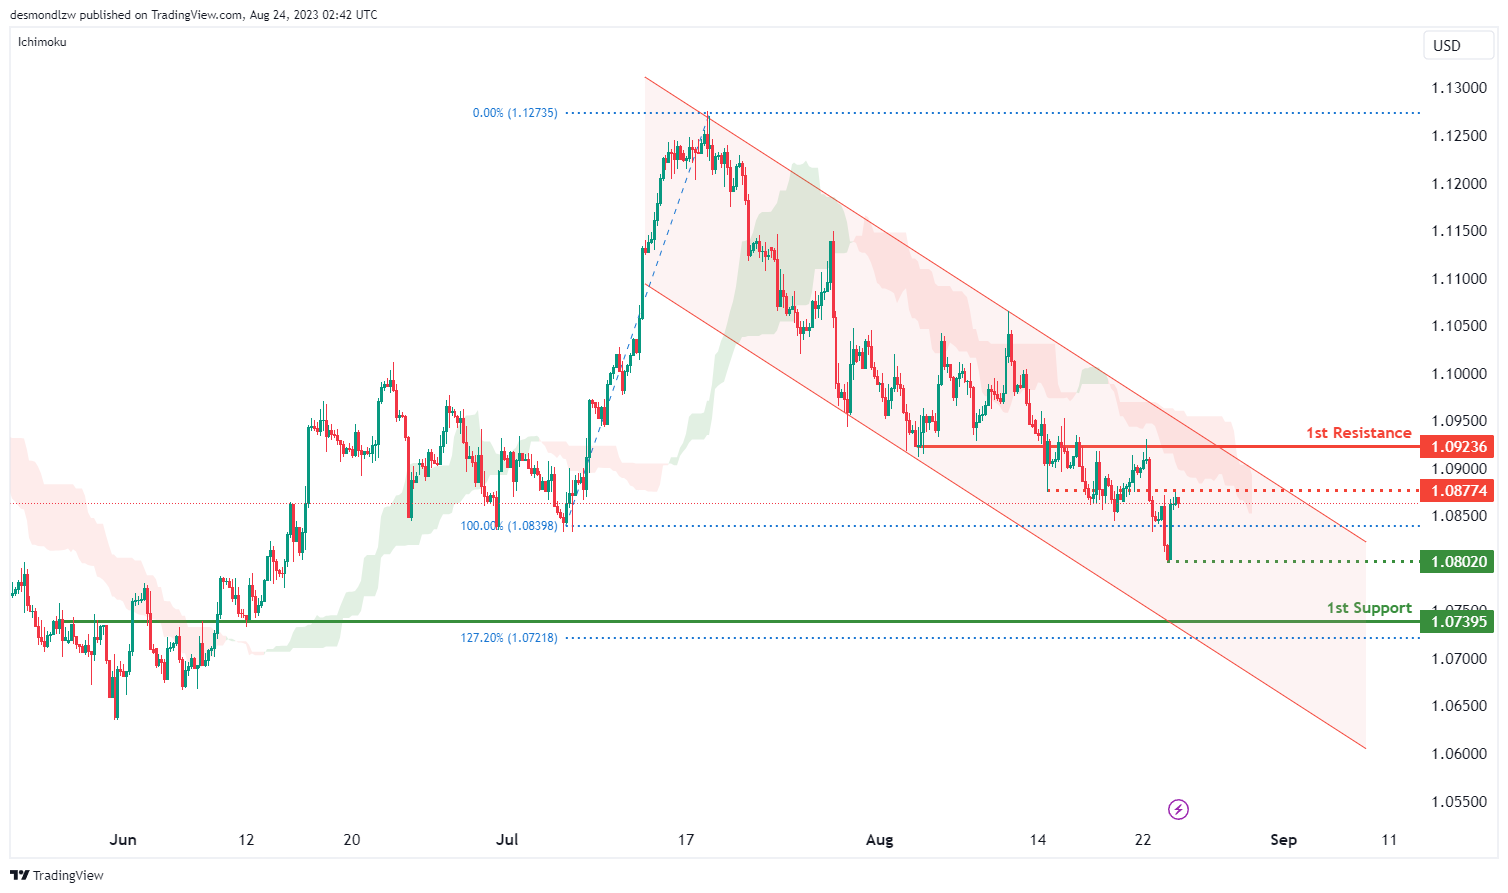
EUR/USD:
The EUR/USD chart currently demonstrates a bearish momentum, characterized by its position within a descending channel. This channel suggests a likelihood of continued downward movement due to the prevailing bearish momentum.
In this context, there’s a potential scenario where the price could undergo a bearish continuation towards the 1st support level at 1.0739. This support level is notable as an overlap support and is reinforced by the presence of the 127.20% Fibonacci Extension.
Additionally, an intermediate support level at 1.0802 holds significance due to its identification as a swing low support, potentially adding to the potential support structure.
On the resistance side, the 1st resistance at 1.0923 stands out as an overlap resistance, potentially acting as a barrier to upward price movement. Similarly, the intermediate resistance level at 1.0877 is significant as another overlap resistance.
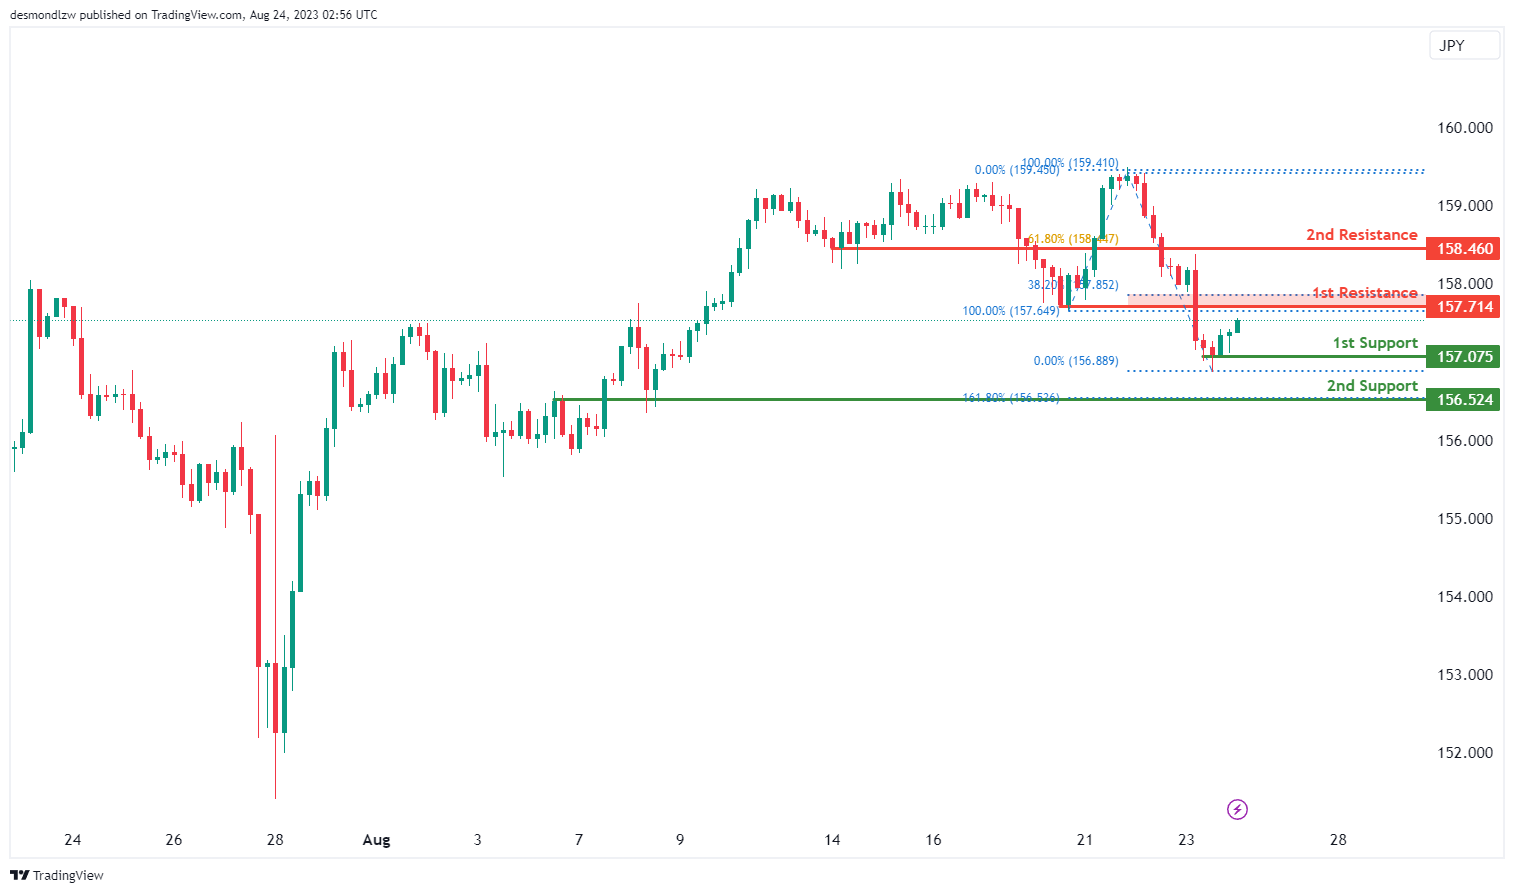
EUR/JPY:
The EUR/JPY chart’s momentum indicates a bearish trend, suggesting a tendency for downward movement.
In this context, there’s a potential scenario where the price could experience a bearish reaction off the 1st resistance at 157.71, leading to a potential drop towards the 1st support at 157.07.
The 1st support at 157.07 holds significance as a multi-swing low support, suggesting that it may act as a level where price could find stability or potentially rebound. The 2nd support at 156.52 is identified as an overlap support and also aligns with the 161.80% Fibonacci Extension level, which adds to its potential significance as a potential bounce point.
Conversely, the 1st resistance at 157.71 is classified as a pullback resistance, indicating that it might restrict upward movements. The 2nd resistance at 158.46 is recognized as a pullback resistance and is associated with the 61.80% Fibonacci Retracement level, reinforcing its potential as a barrier to upward price progress.
Additionally, the intermediate support at 159.20 is considered a pullback support, potentially influencing price reactions.
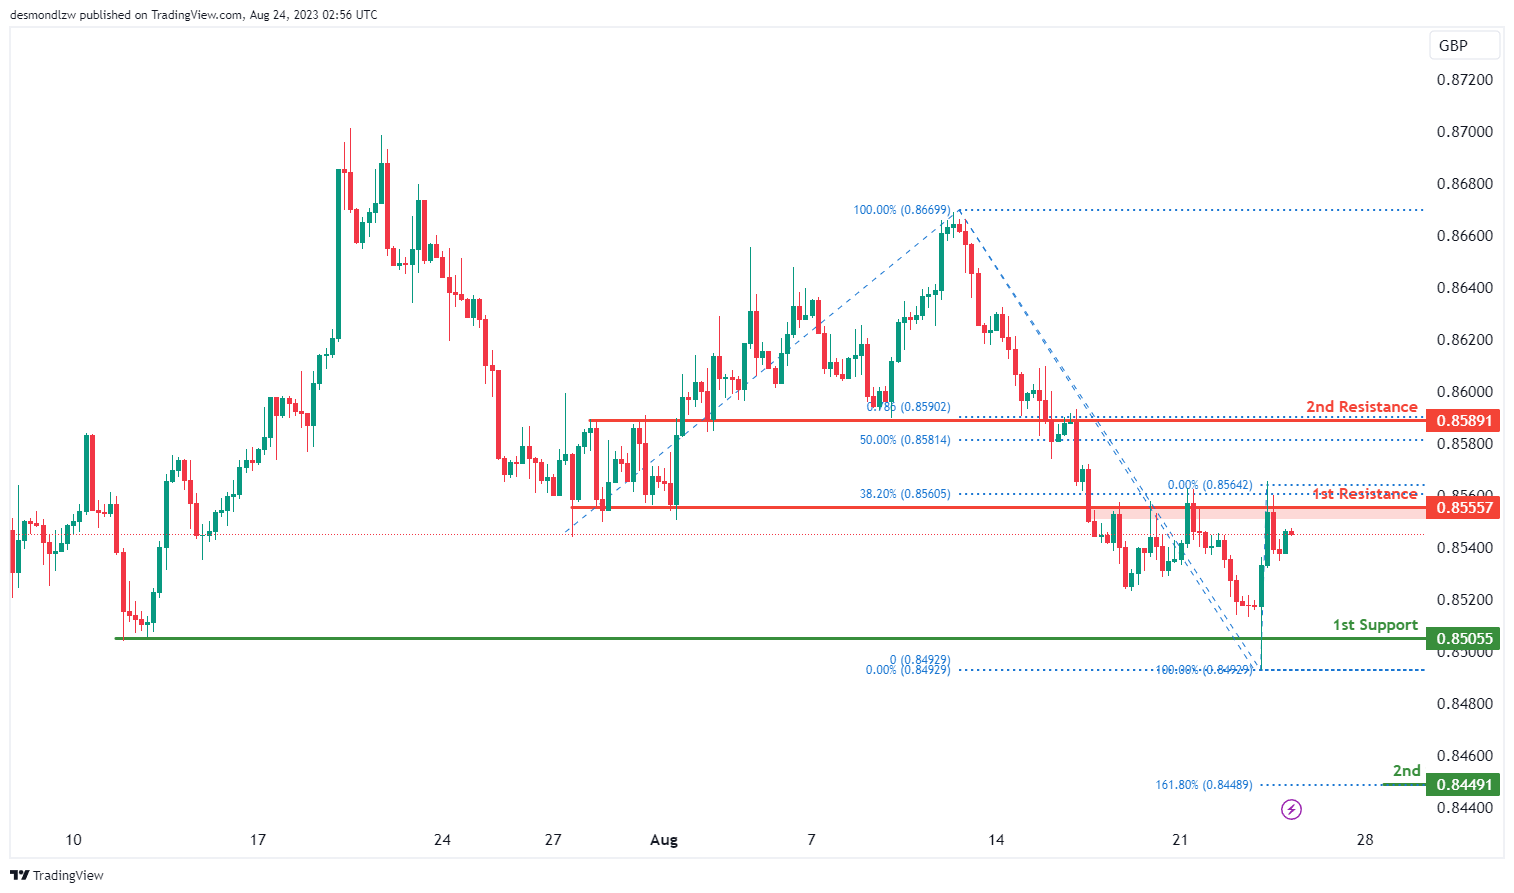
EUR/GBP:
The EUR/GBP chart’s momentum indicates a bearish trend, suggesting a tendency for downward movement.
In this context, there’s a potential scenario where the price could continue its bearish movement towards the 1st support at 0.8505.
The 1st support at 0.8505 is identified as a multi-swing low support, indicating that it may play a significant role in providing a potential level of price stabilization or even a rebound. The 2nd support at 0.8449 is recognized as a swing low support and aligns with the 161.80% Fibonacci Extension level, which adds to its potential significance as a potential bounce point.
On the resistance side, the 1st resistance at 0.8555 is classified as an overlap resistance, implying that it could restrict upward movements. The 2nd resistance at 0.8589 is a pullback resistance and aligns with the 50% Fibonacci Retracement level, suggesting its potential to hinder upward price progress.
GBP/USD:
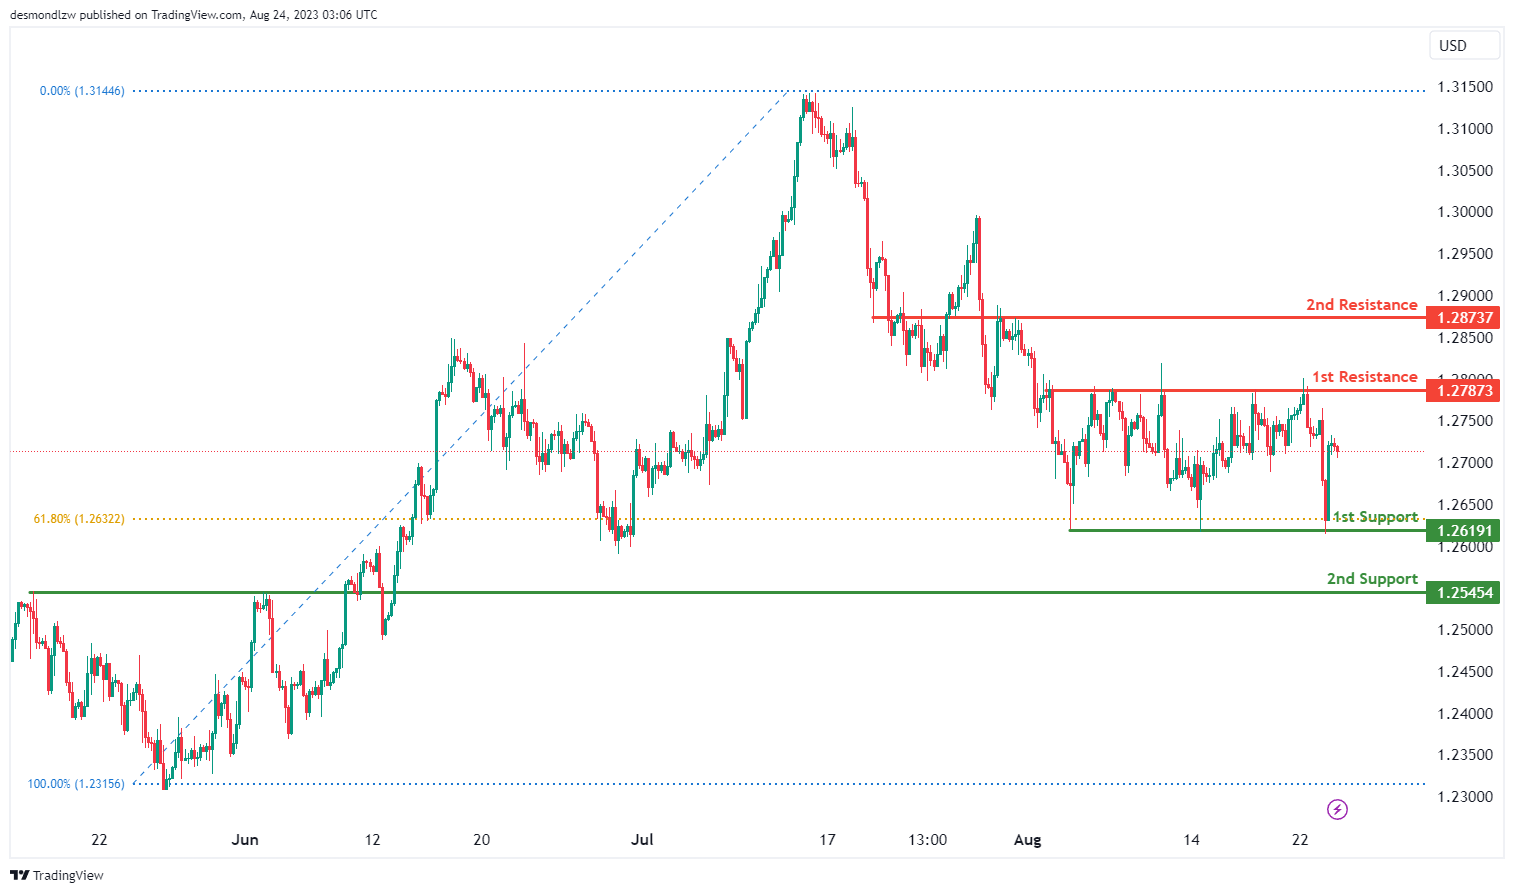
The GBP/USD chart currently reflects a neutral momentum, suggesting a lack of clear directional bias.
Within this context, there’s a potential scenario in which the price might exhibit fluctuations between the 1st support level at 1.2619 and the 1st resistance level at 1.2787.
The significance of the 1st support at 1.2619 is underlined by its identification as a multi-swing low support, with an additional reinforcement from the presence of the 61.80% Fibonacci Retracement.
On the other hand, the 2nd support at 1.2545 is noted as a pullback support, which could contribute to supporting the price during downward movements.
Regarding resistance, the 1st resistance at 1.2787 is considered a swing high resistance, which might act as a hurdle for upward price movement. Similarly, the 2nd resistance level at 1.2873 is significant due to its nature as an overlap resistance.
GBP/JPY:
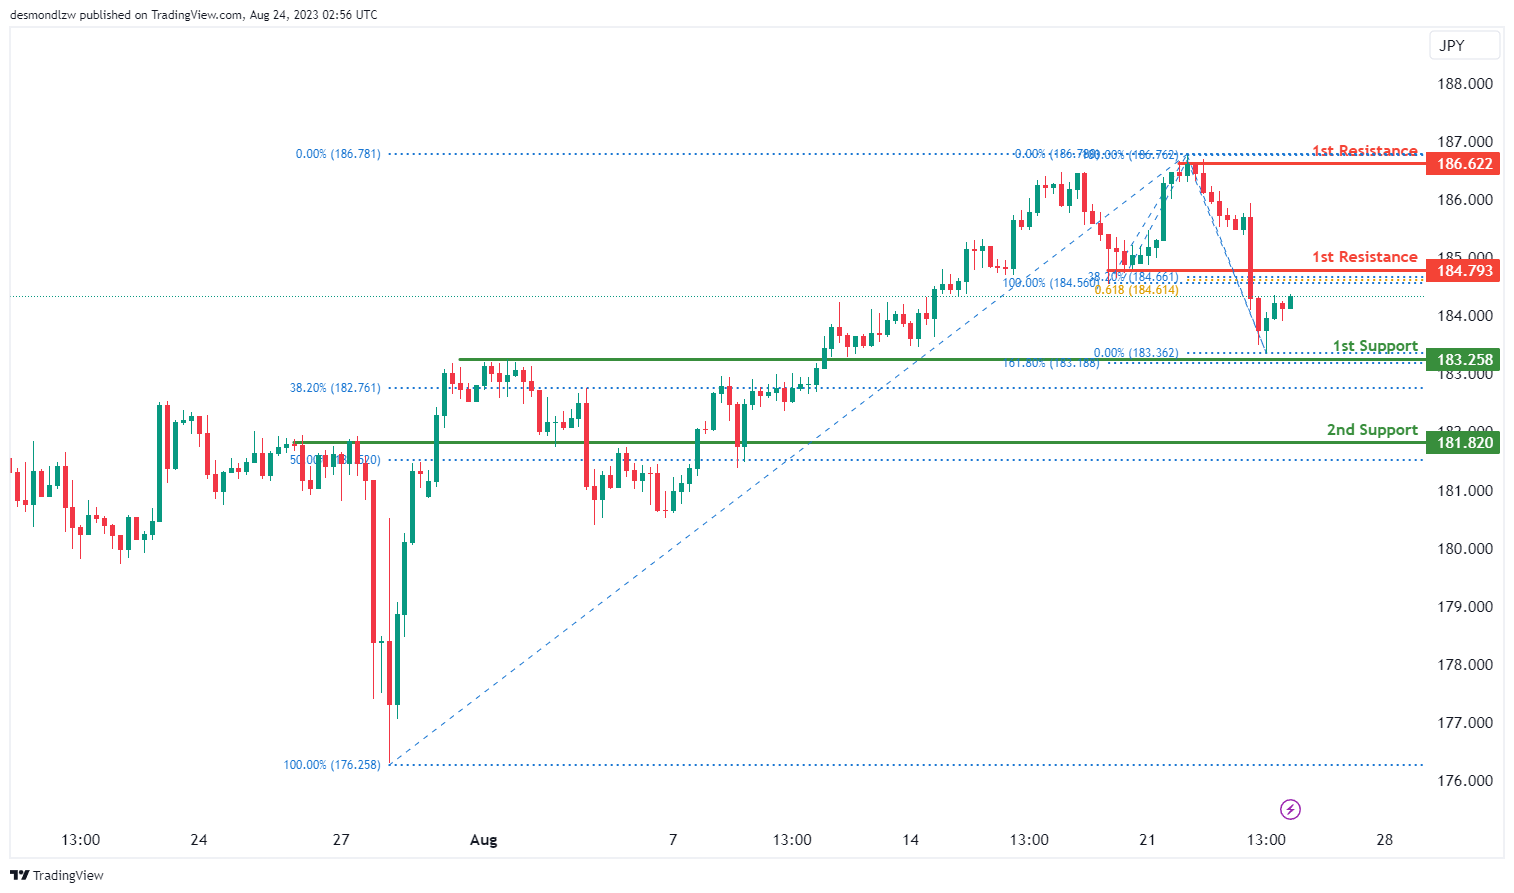
The GBP/JPY chart currently shows a bearish momentum, indicating a prevailing downward trend.
Within this context, there’s a potential scenario where the price might encounter resistance and experience a bearish pullback upon reaching the 1st resistance level at 184.79. This pullback could potentially lead to a drop towards the 1st support level at 183.25.
The significance of the 1st support at 183.25 lies in its identification as an overlap support, with added strength from the alignment with the 161.80% Fibonacci Extension.
Similarly, the 2nd support at 181.82 is also noted as an overlap support, further reinforcing its potential importance as a significant price level.
On the resistance side, the 1st resistance at 184.79 is noteworthy due to its designation as a pullback resistance. Moreover, its alignment with both the 38.20% Fibonacci Retracement and the 61.80% Fibonacci Projection indicates a convergence of Fibonacci levels, making it a key potential resistance zone. The 2nd resistance at 186.62 holds significance as a multi-swing high resistance, suggesting historical resistance strength.
USD/CHF:
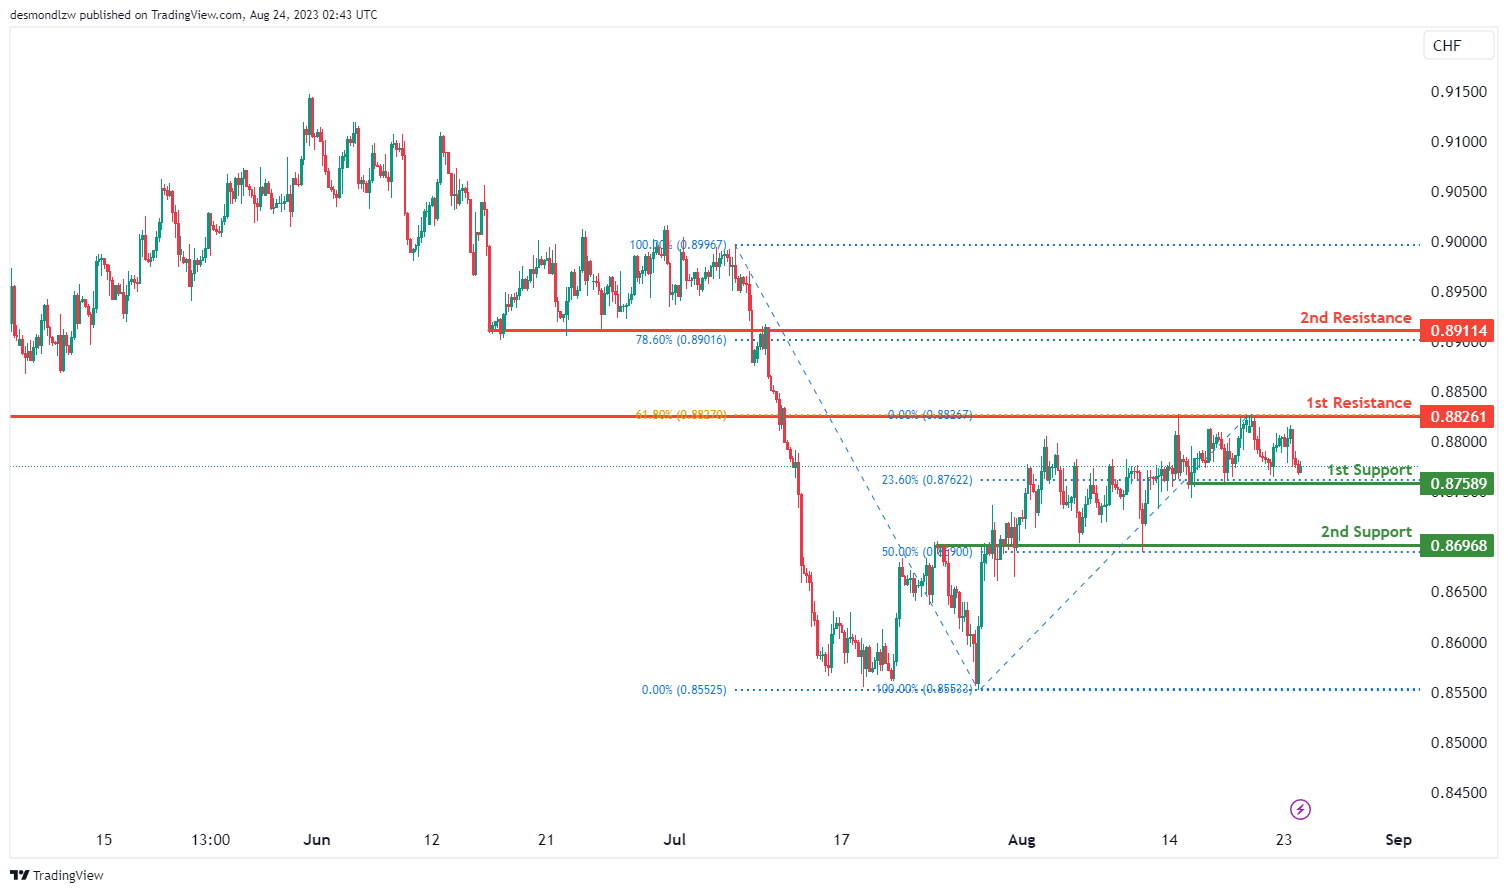
The USD/CHF chart is currently showing a neutral momentum, suggesting a lack of clear directional bias.
In this context, there’s a potential scenario where the price could exhibit fluctuations within a range defined by the 1st support level at 0.8758 and the 1st resistance level at 0.8826.
The 1st support at 0.8758 gains significance from its identification as a multi-swing low support, with an additional backing from the presence of the 23.60% Fibonacci Retracement.
Similarly, the 2nd support at 0.8696 is noted as an overlap support, reinforced by its alignment with the 50% Fibonacci Retracement, potentially acting as a key level during downward movements.
On the resistance side, the 1st resistance at 0.8826 is significant due to its nature as an overlap resistance and its alignment with the 61.80% Fibonacci Retracement, potentially impeding upward price movement. The 2nd resistance level at 0.8911 is also notable as a pullback resistance and coincides with the 78.60% Fibonacci Retracement.
USD/JPY:
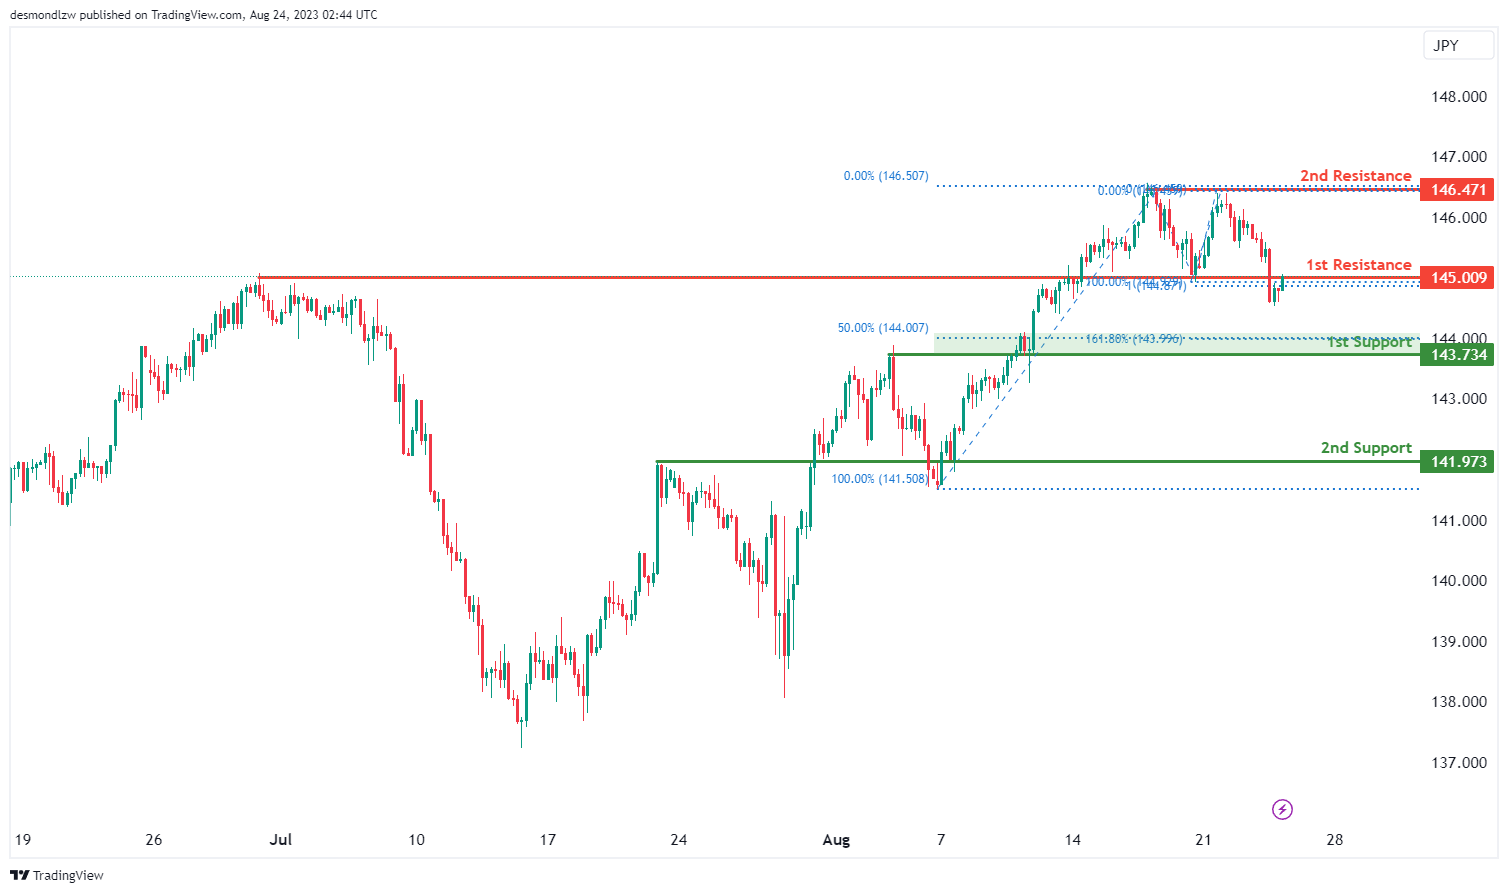
The USD/JPY chart currently indicates a bearish momentum, suggesting a prevailing downward trend.
Within this context, there’s a potential scenario where the price might experience a bearish pullback upon reaching the 1st resistance level at 145.00, potentially leading to a drop towards the 1st support level at 143.73.
The significance of the 1st support at 143.73 lies in its identification as a pullback support, further reinforced by its alignment with both the 50% Fibonacci Retracement and the 161.80% Fibonacci Extension, indicating a convergence of Fibonacci levels and potentially a stronger support zone.
Similarly, the 2nd support level at 141.97 is noted as an overlap support, providing additional reinforcement to its potential as a significant price level.
On the resistance side, the 1st resistance at 145.00 is notable due to its designation as a pullback resistance, which could potentially hinder upward price movement. The 2nd resistance at 146.47 gains importance as a multi-swing high resistance, indicating a strong historical level where selling interest might arise.
USD/CAD:
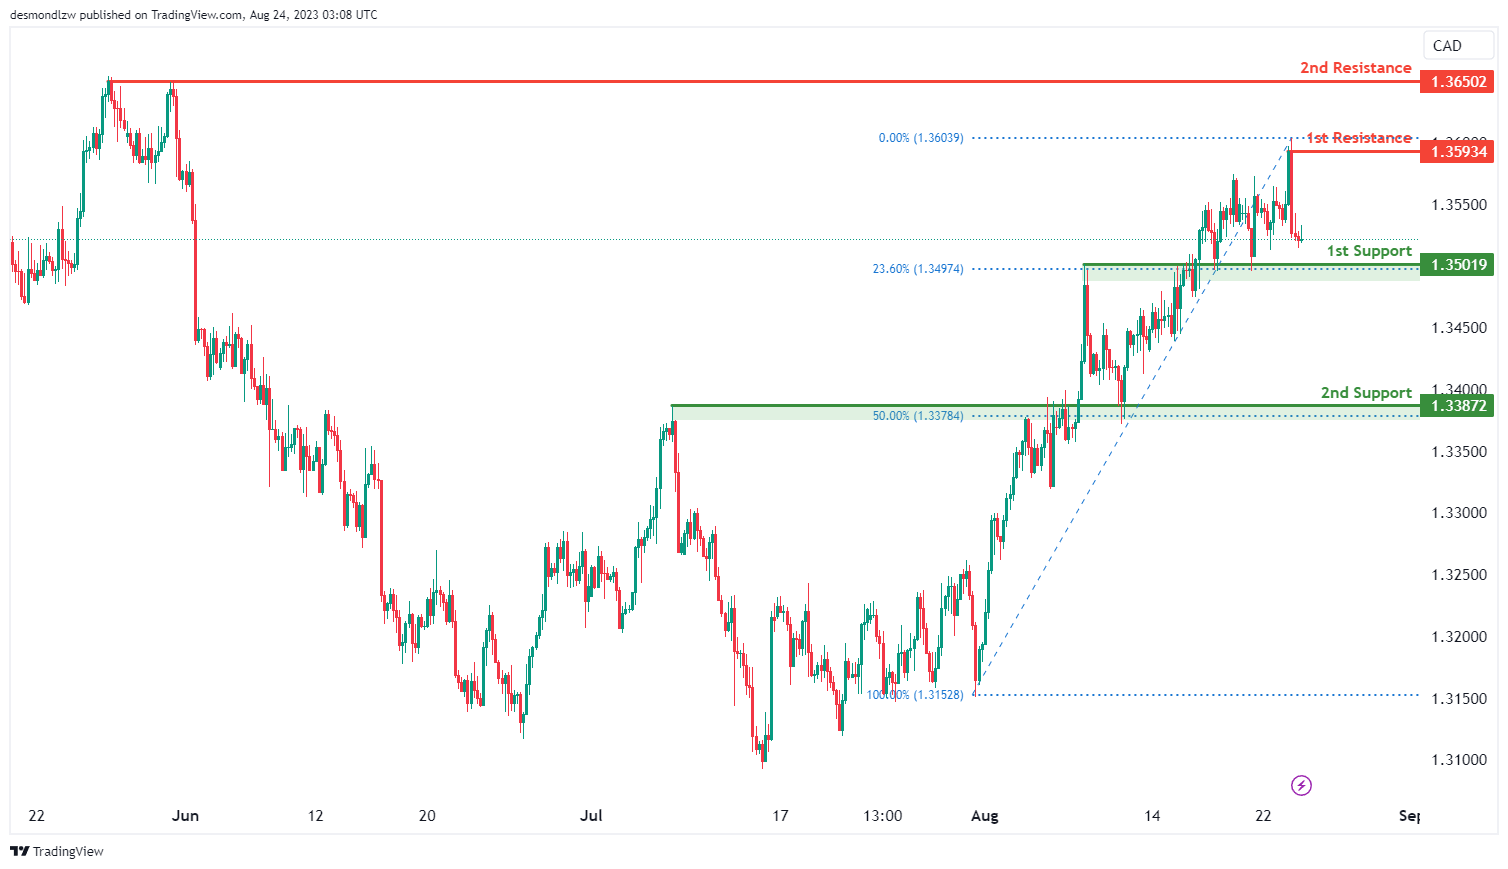
The USD/CAD chart’s momentum indicates a neutral stance, suggesting a lack of a clear directional trend.
Given this neutral momentum, there is a potential for price to fluctuate within a range defined by the 1st support level at 1.3502 and the 1st resistance level at 1.3593.
The significance of the 1st support level at 1.3502 is attributed to its identification as an overlap support that aligns with the 23.60% Fibonacci retracement level. In addition, the 2nd support level at 1.3387 is also identified as an overlap support that aligns with the 50.00% Fibonacci retracement level.
To the upside, the 1st resistance level at 1.3593 is identified as a swing-high resistance while the 2nd resistance level at 1.3650 is identified as a multiple swing-high resistance.
AUD/USD:
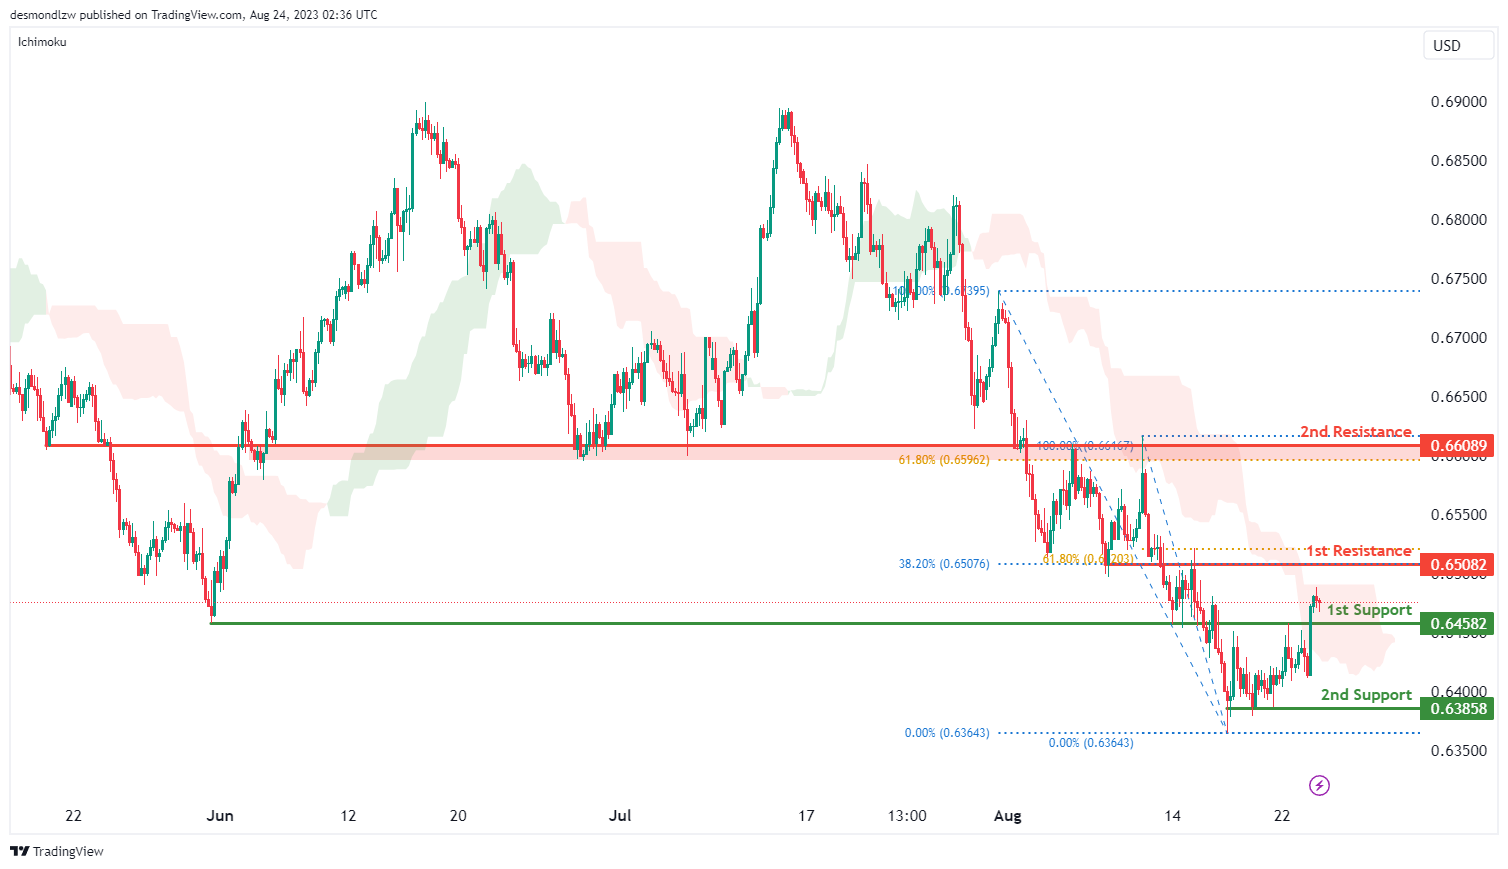
The AUD/USD chart currently indicates a weak bearish momentum, implying a prevalent downward trend in the market. There is a potential for price to pull back towards the 1st support level at 0.6458.
This 1st support level at 0.6458 is identified as an overlap support. Additionally, the 2nd support level at 0.6386 is identified as a multiple swing-low support, potentially acting as a strong barrier.
To the upside, the 1st resistance level at 0.6508 is identified as an overlap resistance that aligns with a confluence of Fibonacci levels i.e. the 38.20% and 61.80% retracement levels. Similarly, the 2nd resistance level at 0.6609 is also identified as an overlap resistance that aligns with the 61.80% Fibonacci retracement level.
NZD/USD
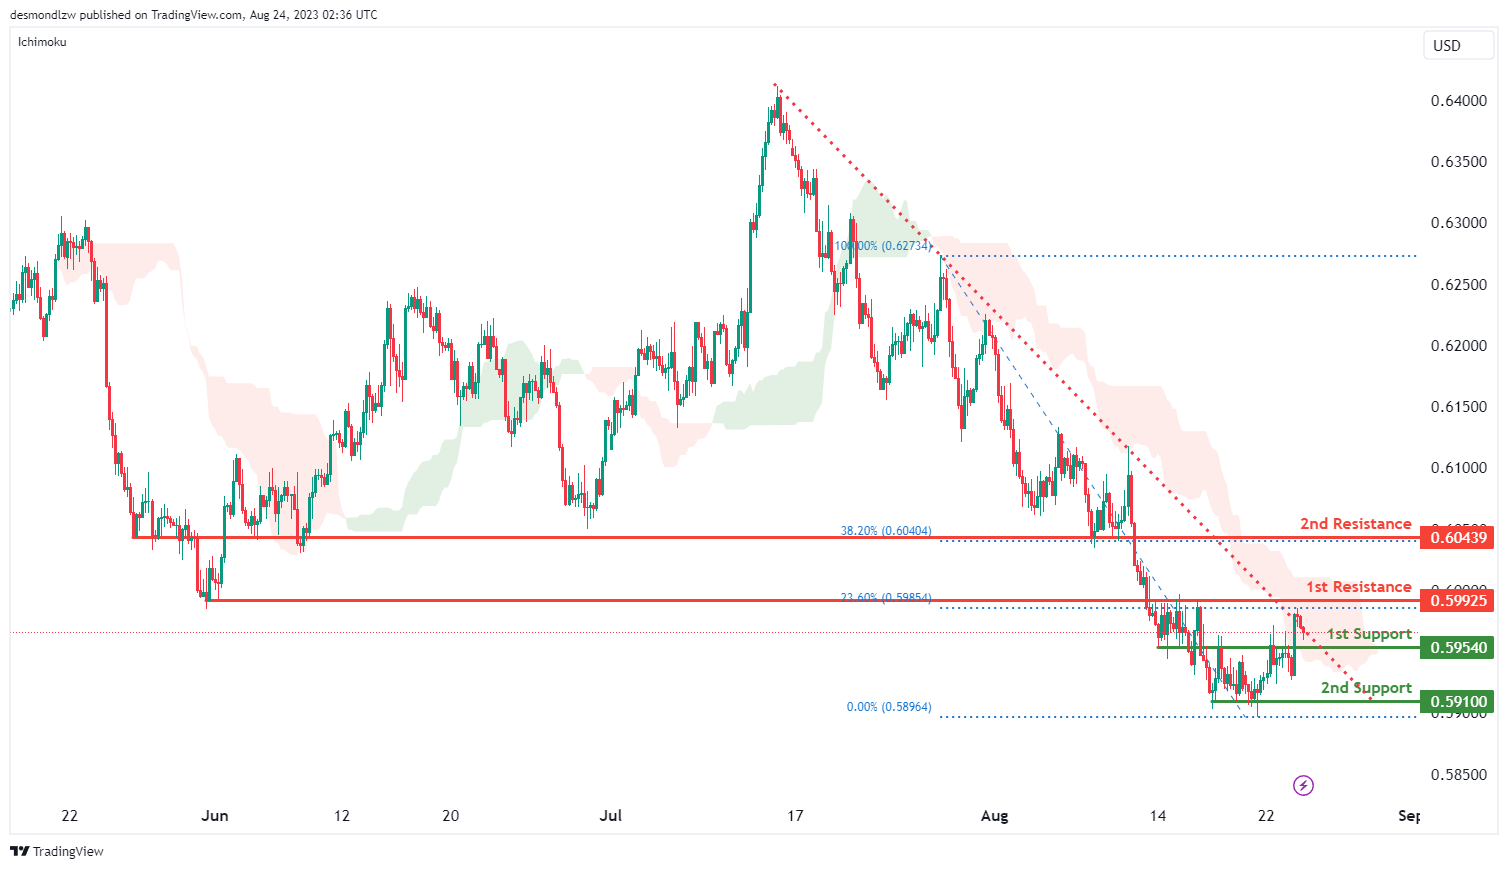
The NZD/USD chart currently reflects a bearish momentum, suggesting a prevailing downward trend. Given this bearish momentum, it is possible that price could pull back towards the 1st support level at 0.5954.
This 1st support level at 0.5954 is identified as an overlap support. Additionally, the 2nd support level at 0.5910 is identified as a multiple swing-low support, potentially offering a robust level of support.
To the upside, the 1st resistance level at 0.5993 is identified as an overlap resistance that aligns with the 23.60% Fibonacci retracement level. Similarly, the 2nd resistance level at 0.6044 is also identified as an overlap resistance that aligns with the 38.20% Fibonacci retracement level.
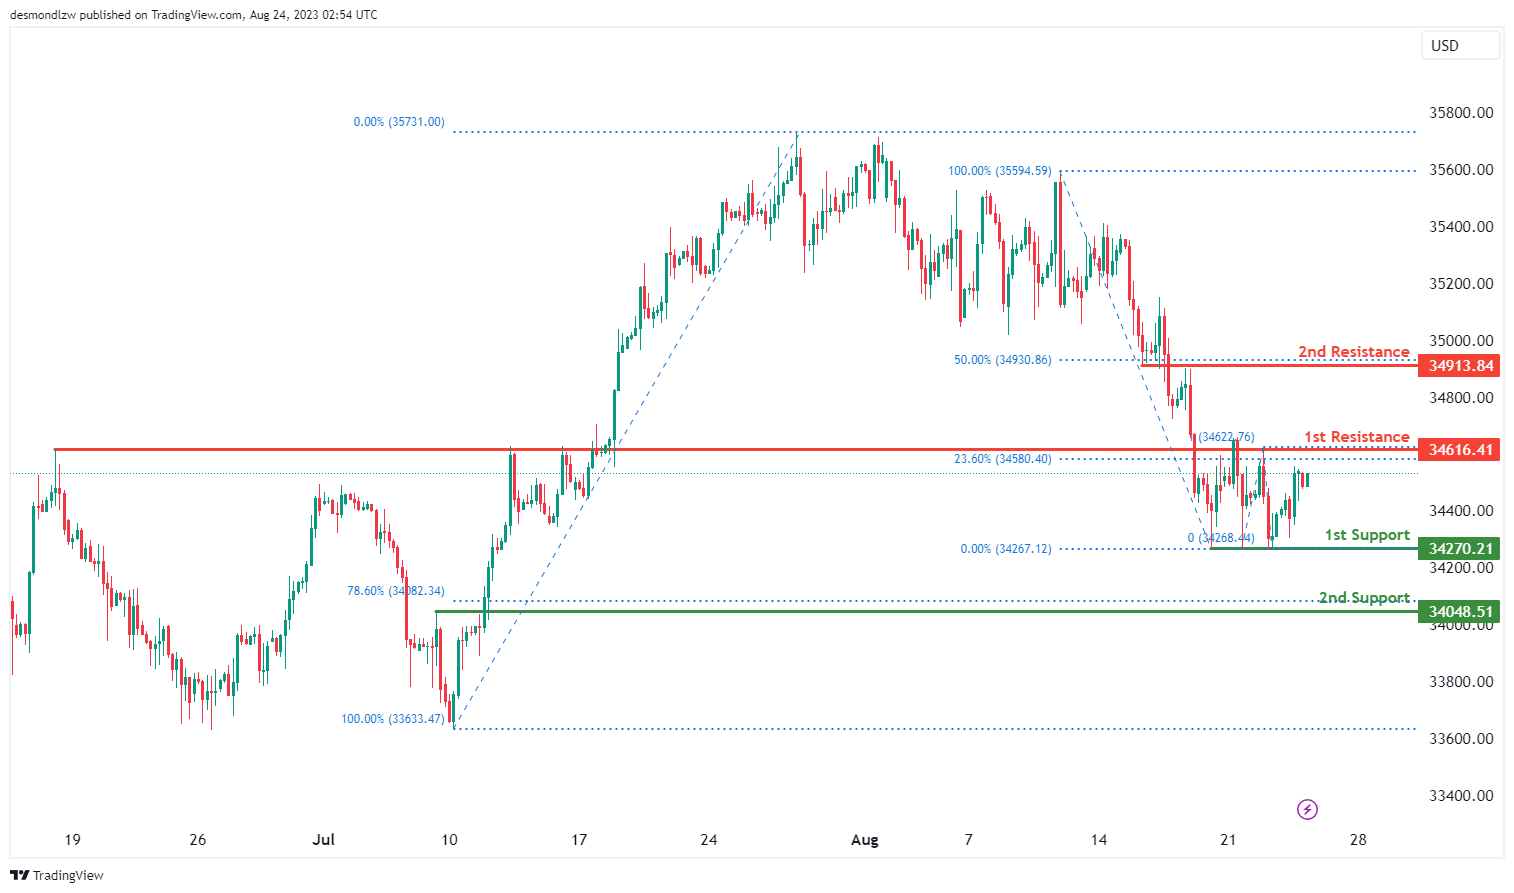
DJ30:
The DJ30 (Dow Jones Industrial Average) chart is currently displaying a neutral momentum, suggesting a lack of a clear trend direction.
Within this context, there’s a possibility that the price might exhibit a pattern of fluctuation between the 1st support level at 34,616.41 and the 1st resistance level at 34,616.41.
The 1st support at 34,616.41 is noted as an overlap support, indicating a historical price level where support has been observed. Additionally, the 2nd support at 34,048.51 gains significance due to its alignment with the 78.60% Fibonacci Retracement, potentially strengthening its role as a pullback support.
As for resistance levels, the 1st resistance at 34,616.41 is designated as an overlap resistance, indicating a historical level where resistance has been observed. The 2nd resistance at 34,913.84 holds importance as an overlap resistance and is aligned with the 50% Fibonacci Retracement, potentially reinforcing its significance.
GER30:
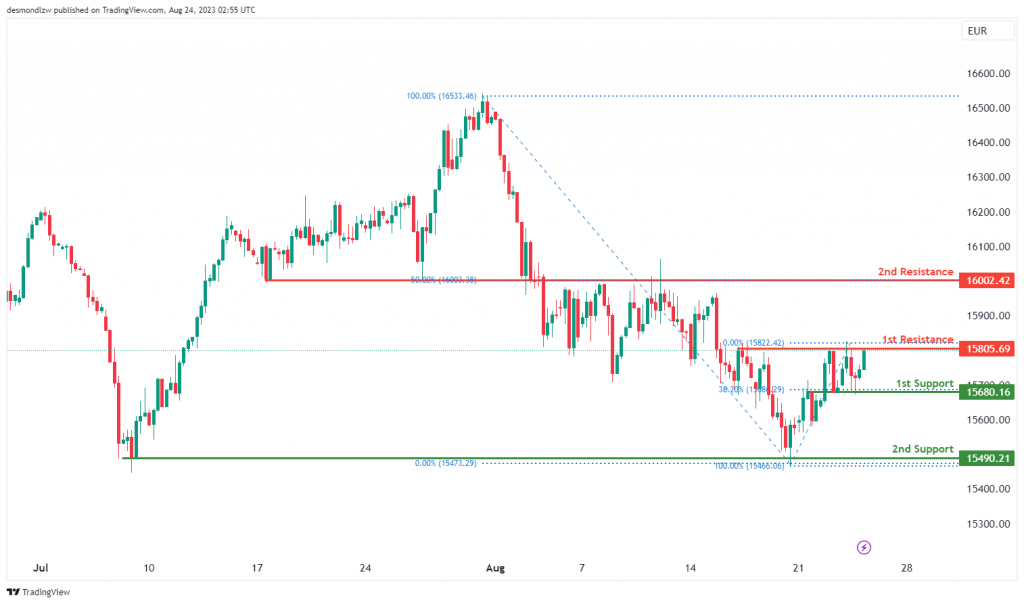
The GER30 (DAX 30) chart is currently showing a neutral momentum, indicating a lack of a definitive trend direction.
Within this context, it’s possible that the price could exhibit a pattern of fluctuation between the 1st support level at 15,680.16 and the 1st resistance level at 15,805.69.
The 1st support at 15,680.16 is identified as an overlap support and is also aligned with the 38.20% Fibonacci Retracement, which adds to its significance. The 2nd support at 15,490.21 holds importance as a multi-swing low support, indicating historical levels where price has found support.
As for resistance levels, the 1st resistance at 15,805.69 is designated as a multi-swing high resistance, indicating historical resistance levels. The 2nd resistance at 16,002.42 gains significance as an overlap resistance and is also aligned with the 50% Fibonacci Retracement.
US500
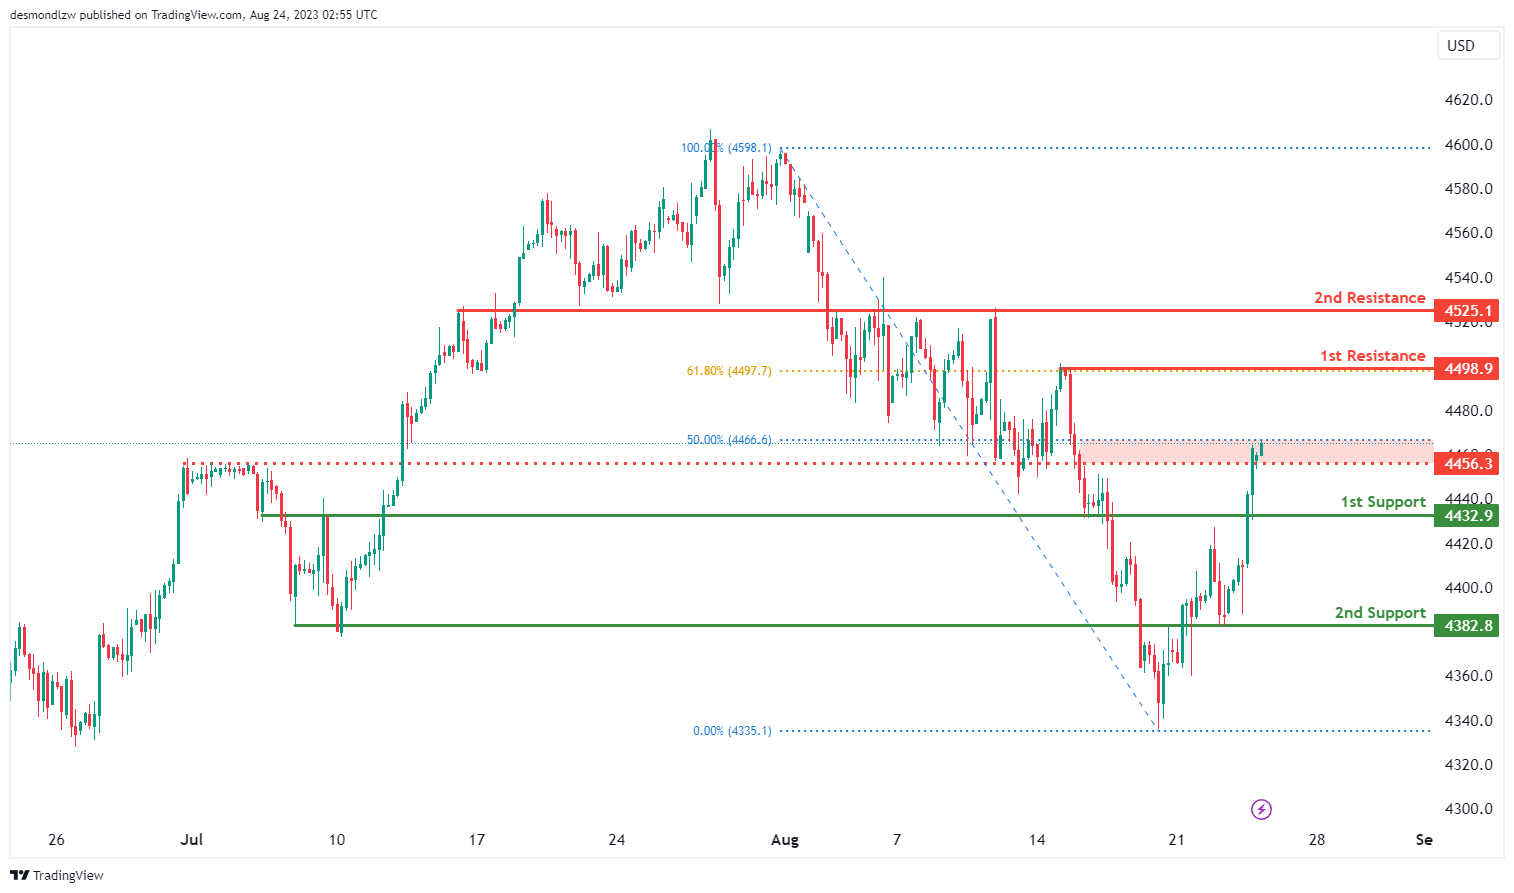
The US500 (S&P 500) chart is currently displaying a bullish momentum, indicating a prevailing upward trend.
In this context, there’s a potential scenario where the price could continue its bullish movement towards the 1st resistance level at 4498.9.
For support levels, the 1st support at 4432.9 and the 2nd support at 4382.8 are both identified as overlap supports, reinforcing their significance.
The 1st resistance at 4498.9 is noted as a swing high resistance, and it gains further importance due to aligning with the 61.80% Fibonacci Retracement level. The 2nd resistance at 4525.1 is designated as an overlap resistance.
Additionally, an intermediate resistance level at 4456.3 is identified as a pullback resistance, and it’s aligned with the 50% Fibonacci Retracement level.
BTC/USD:
Instrument: BTC/USD (Bitcoin to US Dollar)
Overall momentum of the chart: Bullish
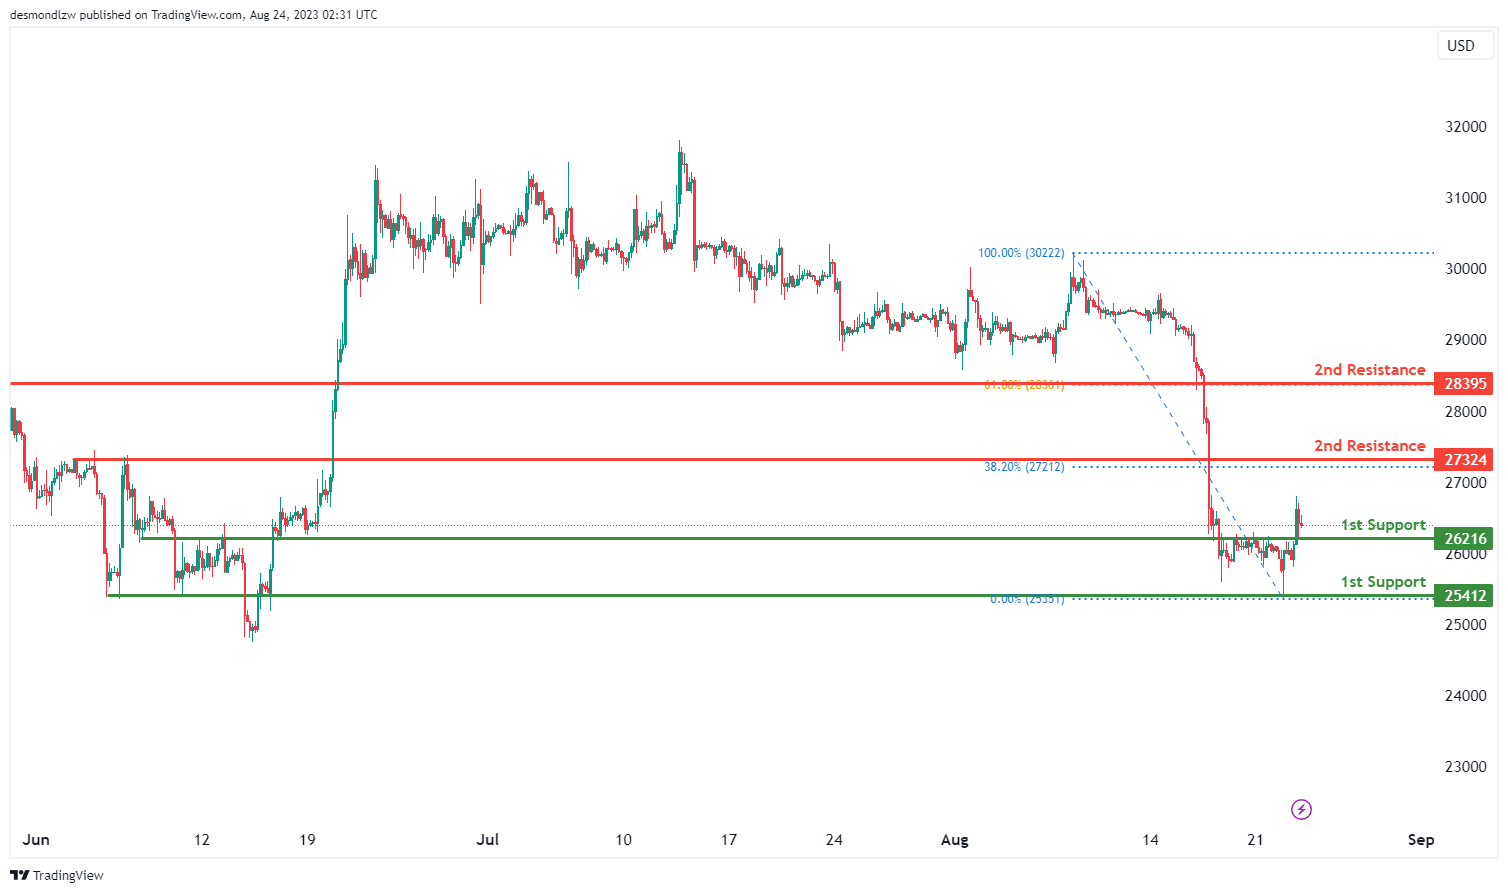
The BTC/USD (Bitcoin to US Dollar) chart is currently showing a bullish momentum, indicating a prevailing upward trend.
In this context, there’s a potential scenario where the price could continue its bullish movement towards the 1st resistance level at 27324.
For support levels, the 1st support at 26216 is identified as a pullback support, while the 2nd support at 25412 is designated as an overlap support, enhancing their significance.
The 1st resistance at 27324 gains importance due to its role as a pullback resistance and aligns with the 38.20% Fibonacci Retracement level. Similarly, the 2nd resistance at 28395 is noted as a pullback resistance and is associated with the 61.80% Fibonacci Retracement level.
ETH/USD:
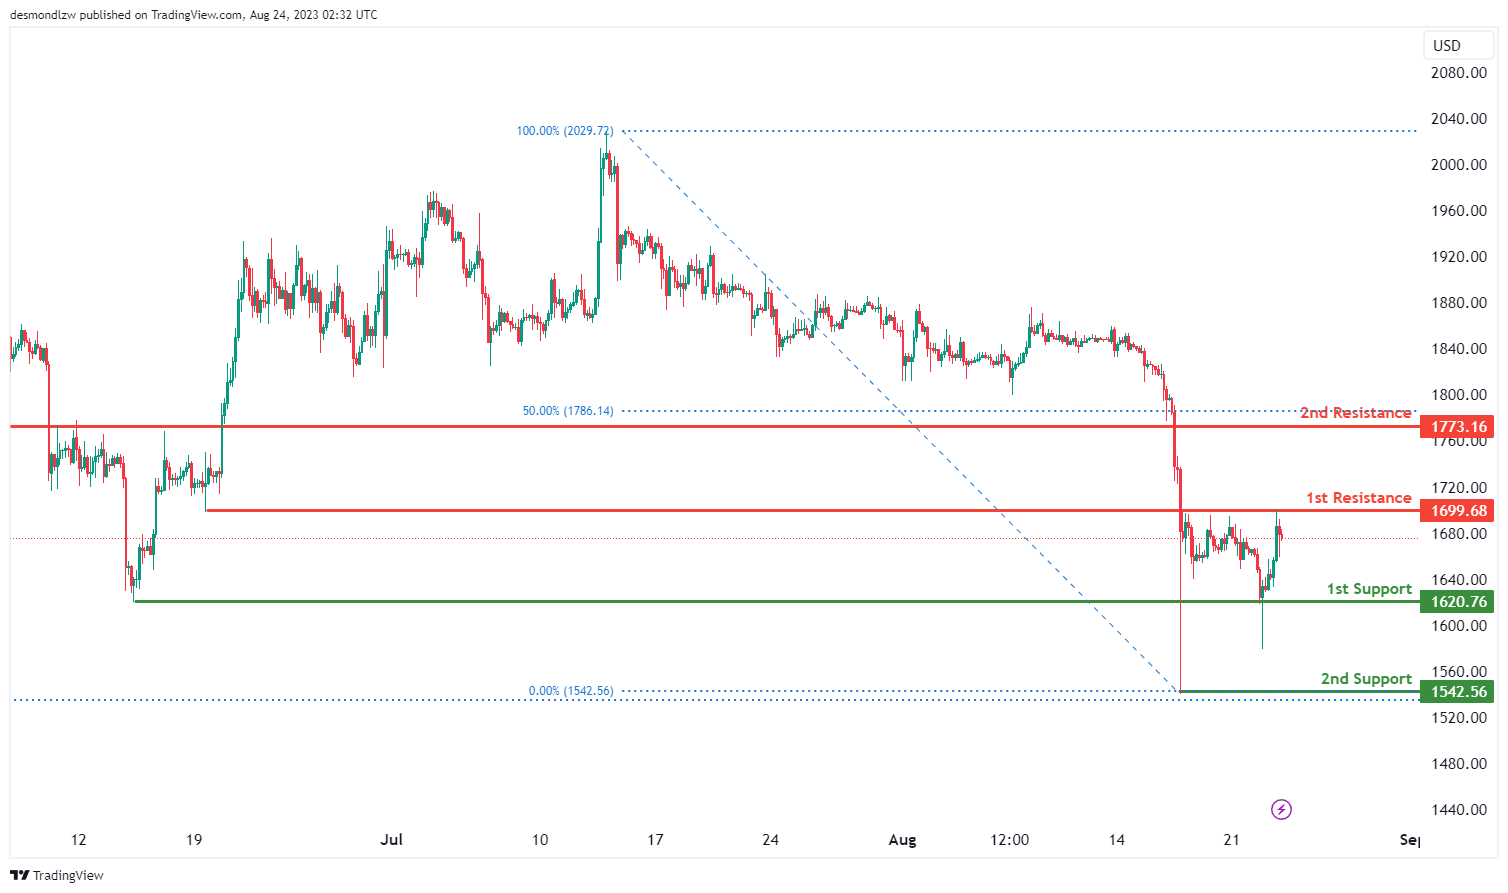
The ETH/USD (Ethereum to US Dollar) chart is currently exhibiting a neutral momentum, indicating a lack of strong directional bias.
In this context, there’s a potential scenario where the price could experience fluctuations within a range defined by the 1st support at 1620.76 and the 1st resistance at 1699.68.
The 1st support at 1620.76 is identified as a swing low support, emphasizing its potential significance in providing a foundation for price movements. Similarly, the 2nd support at 1542.56 is also categorized as a swing low support, further reinforcing its role in potential price reactions.
Conversely, the 1st resistance at 1699.68 is considered an overlap resistance, potentially acting as a barrier to upward movements. The 2nd resistance at 1773.16 holds importance as a pullback resistance and aligns with the 50% Fibonacci Retracement level, adding to its potential relevance.
WTI/USD:
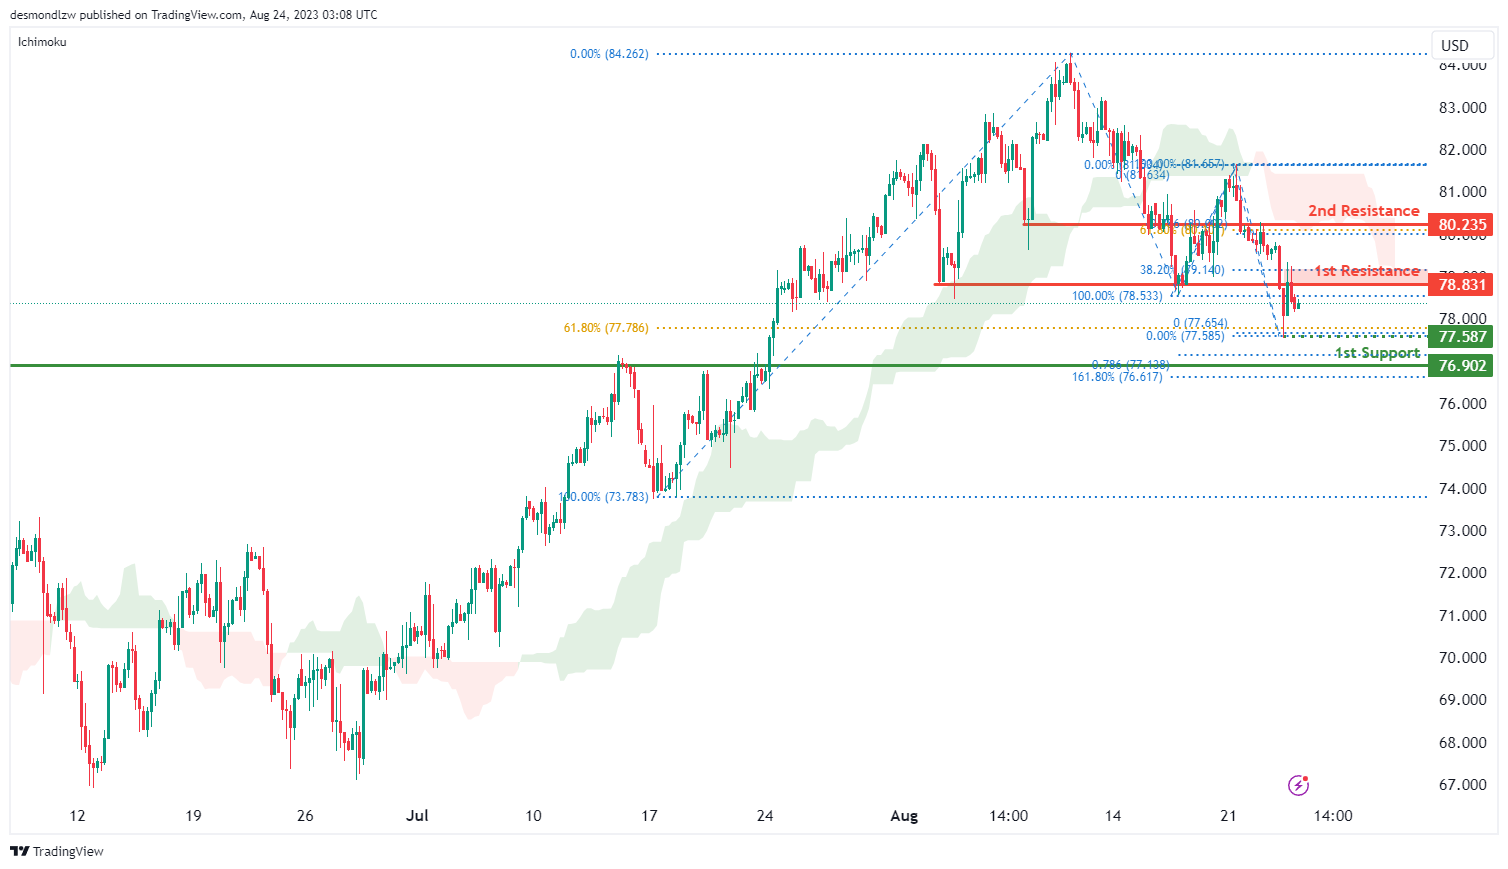
The WTI chart currently indicates a bearish momentum, suggesting a prevailing downward trend. There is potential for price to continue its downward movement towards the 1st support level at 76.90.
There is also an intermediate support level at 77.59 which is identified as a recent swing-low that aligns with the 61.80% Fibonacci retracement level. The 1st support level at 76.90 is identified as an overlap support that aligns with a confluence of Fibonacci levels i.e. the 161.80% extension and the 78.60% projection levels.
To the upside, the 1st resistance level at 78.83 is identified as an overlap resistance that aligns close to the 38.20% Fibonacci retracement level. The 2nd resistance level at 80.24 is also identified as an overlap resistance that aligns with the 61.80% Fibonacci retracement level.
XAU/USD (GOLD):
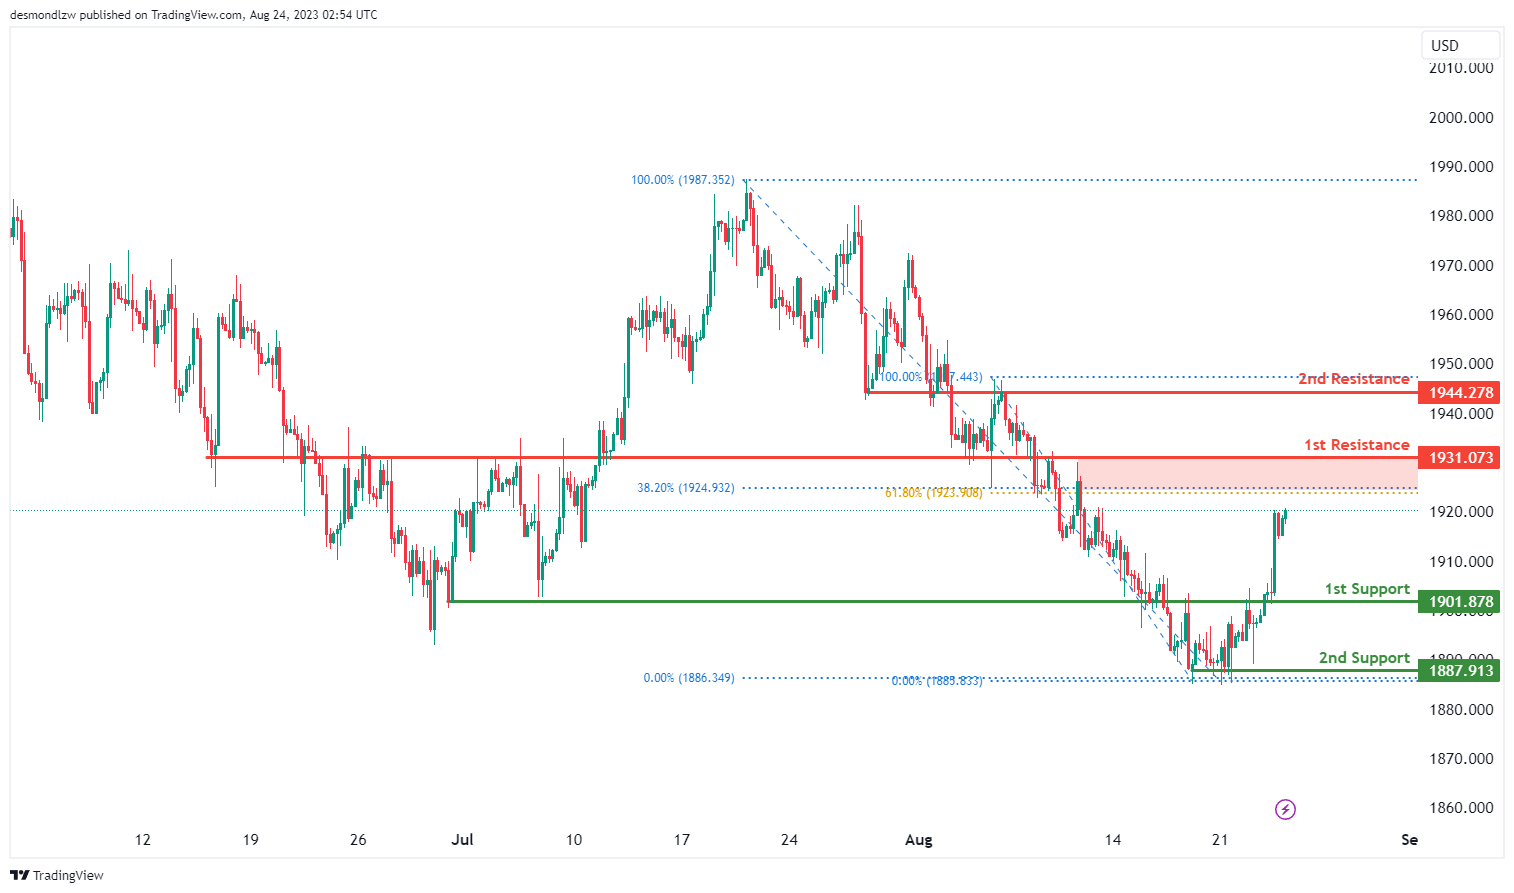
The XAU/USD (Gold to US Dollar) chart is currently showing a bullish momentum, suggesting a tendency for upward movement.
In this context, there’s a potential scenario where the price could experience a bullish continuation towards the 1st resistance at 1931.07.
The 1st support at 1901.87 is considered an overlap support, indicating its significance as a potential level where price might find stability or rebound. Similarly, the 2nd support at 1887.91 is identified as a multi-swing low support, further strengthening its potential role in providing a foundation for price movements.
Conversely, the 1st resistance at 1931.07 is categorized as an overlap resistance, which could act as a barrier to further upward movements. The 2nd resistance at 1944.27 is also recognized as an overlap resistance, adding to its potential importance in limiting upward price progress.
Silver accelerates up, taking Gold higher
Silver's impressive rally intensified yesterday, pulling Gold upwards in its wake. This surge seems to be a direct response to the retracement of benchmark treasury yields in both the US and Europe, which were affected by less-than-stellar PMI figures. Market sentiment is now swaying towards the belief that major central banks might be quickly approaching the finale of their tightening cycle. All eyes are set on upcoming Jackson Hole Symposium. While the spotlight is certainly on the speech by Fed Chair Jerome Powell, insights and comments from other prominent central bankers are also poised to influence market directions.
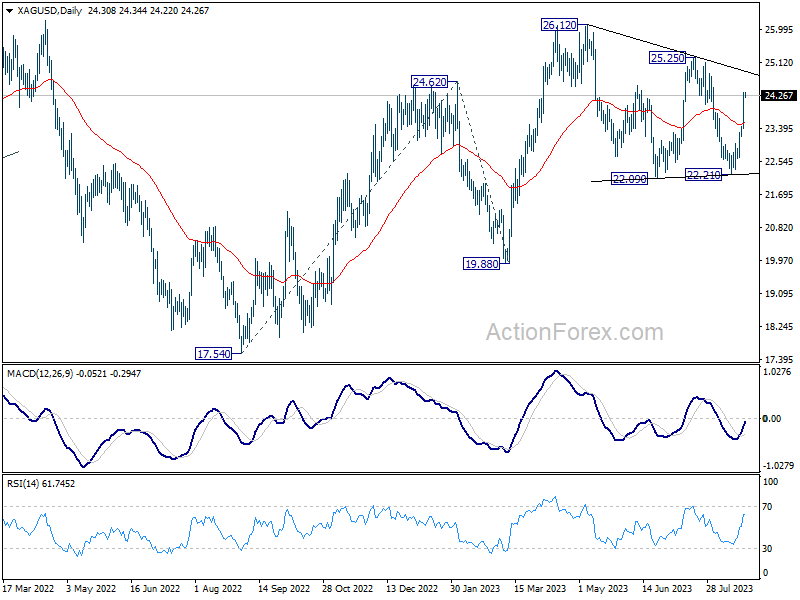
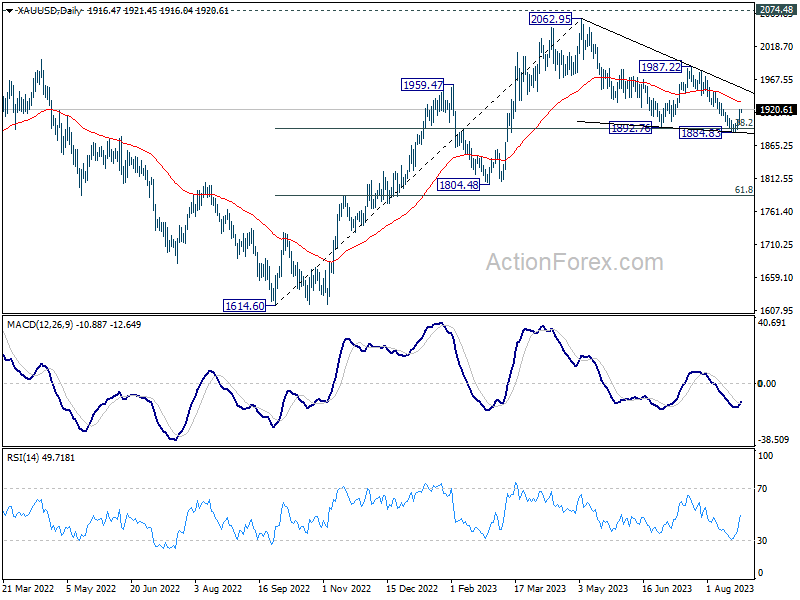
Technically, Silver's strong break of 55 D EMA affirms the case that consolidation pattern from 26.12 has completed with three waves to 22.21. Further rise is now expected as long as this 55 D EMA (now at 23.56) holds, to 25.25 resistance first. Decisive break there should confirm this bullish case, and should also resume whole up trend from 17.54 (2022 low). Next target would be 100% projection of 17.54 to 24.62 from 19.88 at 26.96.
As for Gold, a short term bottom is in place at 1884.83, with D MACD crossed above signal line. Further rebound is now in favor to 55 D EMA (now at 1932.52). Sustained break there will argue that whole corrective pattern from 2062.95 has completed with three waves down to 1884.83, after defending 38.2% retracement of 1614.60 to 2062.95 at 1891.68. Stronger rally would then be seen to 1987.22 resistance to confirm this bullish scenario.
Crude Oil Price Drops Below $80 And Might Extend Losses
Key Highlights
- Crude oil price declined below the $81.50 and $80.00 support levels.
- It traded below a major bullish trend line with support near $79.90 on the 4-hour chart.
- Gold prices recovered above $1,915 but might struggle near $1,930.
- EUR/USD is moving lower toward the 1.0800 support.
Crude Oil Price Technical Analysis
Crude oil price started a fresh decline after it settled below $82.00 against the US Dollar. The price traded below the $80.50 support to move into a bearish zone.
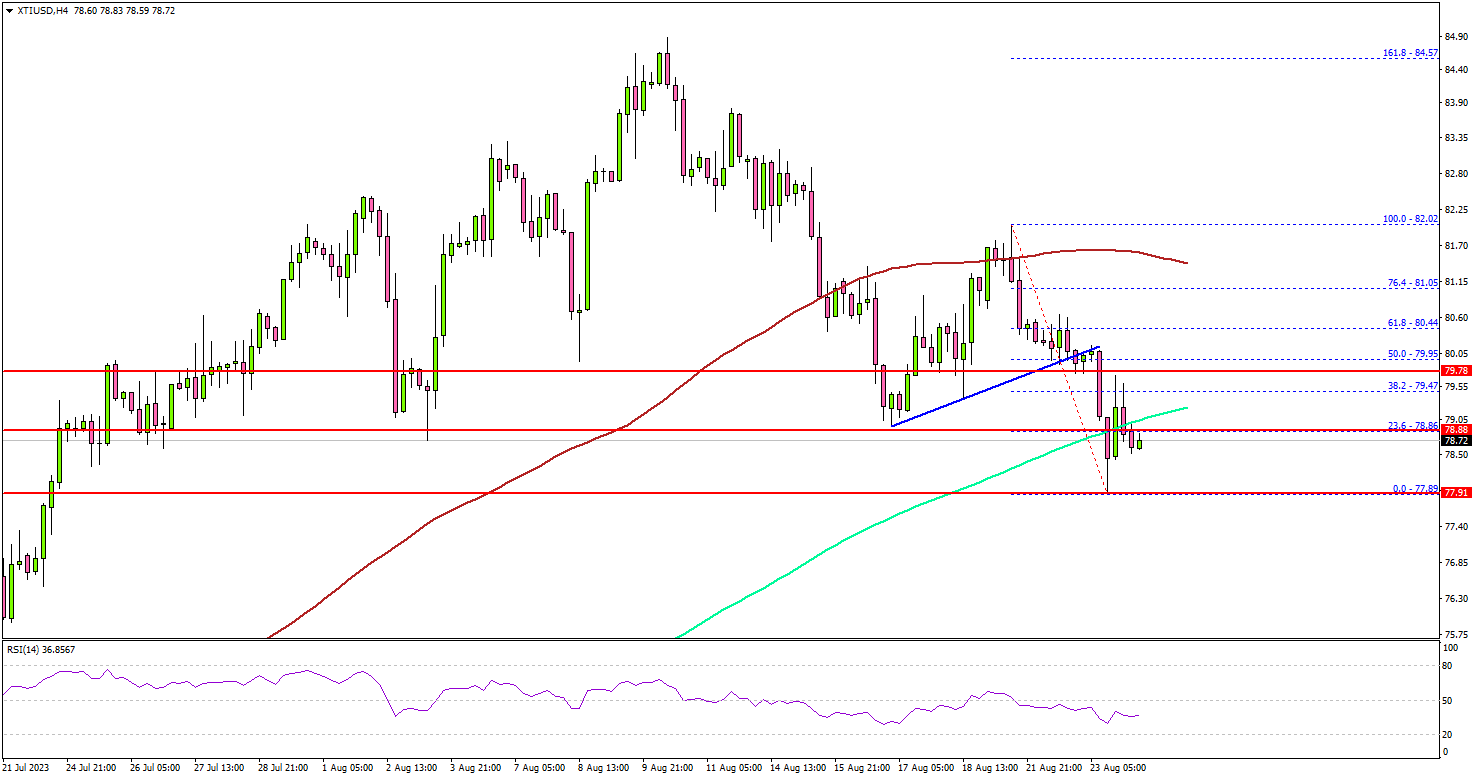
Looking at the 4-hour chart of XTI/USD, the price gained bearish momentum below the $80.00 support, the 100 simple moving average (red, 4-hour), and the 200 simple moving average (green, 4-hour).
It even tested the $77.80 zone. A low was formed near $77.89 before the price started a recovery wave. It retested the $79.00 resistance zone and the 23.6% Fib retracement level of the downward move from the $82.02 swing high to the $77.89 low.
The next major resistance is near the $80 level or the 50% Fib retracement level of the downward move from the $82.02 swing high to the $77.89 low, above which the price may perhaps accelerate higher. In the stated case, it could even visit the $82 resistance.
On the downside, initial support is near the $78.00 level. The next major support sits near the $77.80 level. Any more losses might call for a test of the $76.50 support zone in the coming days.
Looking at gold prices, there was a decent recovery wave above the $1,915 level but the bears might remain active near the $1,930 zone.
Economic Releases to Watch Today
- Jackson Hole Symposium
- US Initial Jobless Claims - Forecast 240K, versus 239K previous.
- US Durable Goods Orders for July 2023 – Forecast -4.0% versus +4.6% previous.
Eyes on NASDAQ’s next move after Nvidia’s earnings triumph boosts confidence
In a significant boost to investor sentiment, Nvidia's earnings report surpassed even the loftiest expectations, particularly spotlighting its thriving data center business. The company's A100 and H100 AI chips, integral to powering AI marvels like ChatGPT, stood out as key contributors to their success. In a forward-looking statement, Nvidia anticipates a fiscal third-quarter revenue of approximately USD 16B, hinting at a colossal 170% growth compared to the same quarter last year.
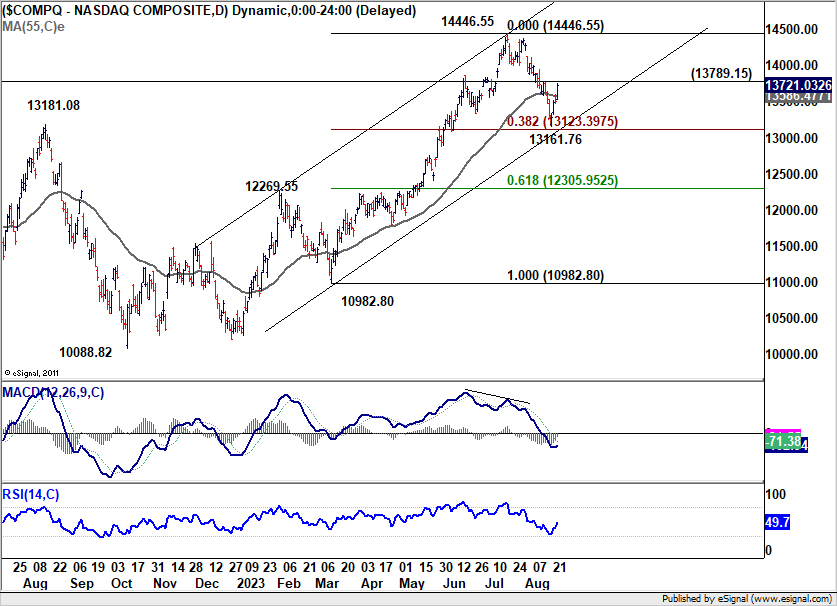
NASDAQ, seemingly anticipating this optimistic news, had already surged by 1.59% at the day's close, prior to Nvidia's earnings announcement. The development now argues that pull back from 14446.55 has completed at 13161.76, just ahead of the medium term channel support, as well as 38.2% retracement of 10982.80 to 14446.55 at 13123.39. More importantly, if this turn out to be true, rise from 10088.82 should then remain intact for another high above 14446.55.
Market watchers will now keenly focus on the momentum in the coming days, especially awaiting reactions post the much-anticipated speech by Fed Chair Jerome Powell at the Jackson Hole Symposium. This will likely shed light on the feasibility of this bullish prognosis.
AUDUSD Wave Analysis
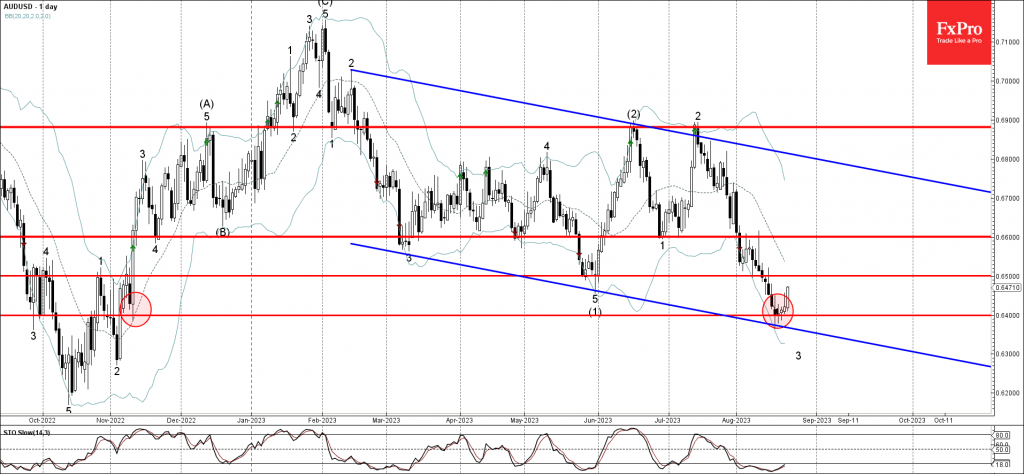
- AUDUSD reversed from support level 0.6400
- Likely to rise to resistance level 0.6500
AUDUSD currency pair recently reversed up from the key support level 0.6400, which also reversed the pair In November, standing near the lower daily Bollinger Band and the support trendline of the daily down channel from February.
The upward reversal from the support level 0.6400 stopped the earlier short-term impulse wave 3 from the middle of July.
Given the strength of the support level 0.6400 and the oversold daily Stochastic, AUDUSD can be expected to rise further toward the next resistance level 0.6500.
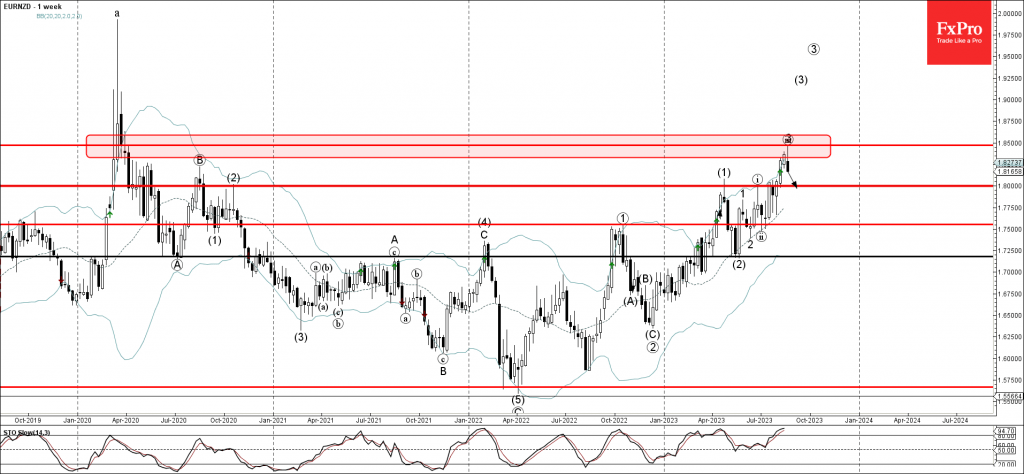
EURNZD Wave Analysis
- EURNZD reversed from resistance level 1.8500
- Likely to fall to support level 1.8000.
EURNZD recently reversed down from the key resistance level 1.8500 standing well above with the upper weekly and the daily Bollinger Bands.
The downward reversal from the support level 1.8500 stopped the earlier intermediate impulse wave (3) from June.
Given the strength of the resistance level 1.8500 and the overbought weekly Stochastic, EURNZD can be expected to fall further toward the next round support level 1.8000.
Sunset Market Commentary
Markets:
The preliminary August PMI’s showed business activity in EMU contracting at accelerating pace. The composite output declined from 48.6 to 47. After 14 consecutive sub 50 readings for the manufacturing sector (43.7 from 42.7), negative growth spread to the services sector (from 50.9 in July to 48.3, the lowest level in 30 months). Both manufacturing and the services reported falling output and orders, with the goods producing sector still recording the shaper rates of decline. The backlog of work declined in both sectors. According S&P/HCOB “hiring came close to stalling as companies grew more reluctant to expand capacity in the face of deteriorating demand and gloomier prospects for the year ahead’. Despite the contraction in activity, prices remain cause of concern. Inflationary pressures are weaker than seen on average during the previous two years, but average selling prices and input costs again accelerated in August. Especially the rise in the rate of input cost inflation caught the eye as a fall in manufacturers’ costs was counterbalanced by an upturn in input costs from the services sector, mainly attributed to rising wage pressures. On a country level, Germany registered the steepest decline (composite 44.7 from 48.5). The rate of contraction in France was unchanged at 46.6 after the steep drop last month. The rest of Europe recorded a more moderate decline in output. According the analysis of HCOB, July and August PMI’s point at a 0.2% GDP contraction in Q3. The sharp decline in EMU activity both hammered EMU yields and the single currency. German yields currently decline between 8 bps (2 & 30-y) and 10 bps (5-10y) (before the release of the US PMI’s). Markets understandably see the weaker activity as potentially triggering a pause in the ECB hiking cycle at the September meeting. However, higher wages still at risk of sustaining an upward wage price spiral, suggest quite a tense internal debate within the ECB. The poor EMU performance pushed EUR/USD below the 1.0834 support. However, the decline slowed in US dealings (currently 1.0825). EUR/GBP briefly tested the 0.85 area post the EMU PMI’s, but the negative surprise in the UK PMI (see below) was at least as big as in EMU, questioning the BoE’s anti-inflationary commitment. The UK 2-y yield currently declines 15 bps+. EUR/GBP rebounded to the 0.856 area. The recessionary narrative also blocked a modest further rise in European equities (Eurostoxx 50 -0.2%). US indices open marginally stronger (S&P 500 +0.3%).
US PMI’s are published as we finish this report. They also show a further deceleration in activity. However, the composite index at 50.4 (from 52.0) stays in positive territory. Both manufacturing (47.0) and services (51.0) fell more than expected. In a first reaction US yields fully catch up with the decline in EMU rates. The belly of the curve outperforms (5-y -13 bps). The dollar returns part of its intraday outperformance with the DXY index dropping from near 104 to 103.75.
News & Views:
The UK composite PMI crashed in August from 50.8 to 47.9 (vs 50.4 expected). It’s a return to bust-territory (< 50) following a spell from August 2022 until January 2023. Details showed a similar deterioration in both manufacturing (42.5 from 45.3 vs 45 expected) and services (48.7 from 51.5 vs 51 expected). S&P Global Market Intelligence, responsible for the release, said that details suggest that inflation should moderate further in the months ahead, but also indicate that the fight against inflation is carrying a heavy cost in terms of heightened recession risks. July and August PMI’s combined hint at a 0.2% Q/Q GDP contraction in Q3. Companies are reporting reduced orders for goods and services as demand is increasingly hit by the cost-of-loving crisis, higher interest rates, export losses and concerns about the economic outlook while a further pull-back in hiring indicates that the labour market is losing steam.
The Indian government is expected to impose a ban on sugar exports for the fiscal year 2023-2024 according to a Reuters report. It would be the first such restriction in seven years. A concerning dearth of rainfall has adversely impacted cane yields. The decision could put additional pressure on sugar prices. The UN Food and Agricultural World Sugar price index reached its highest level since 2011 as recently as May this year.
US PMI composite fell to 50.4, near stagnation
US PMI Manufacturing fell form 49.0 to 47.0 in August. PMI Services fell from 52.3 to 51.0. PMI Composite fell from 52.0 to 50.4.
Chris Williamson, Chief Business Economist at S&P Global Market Intelligence said:
"A near-stalling of business activity in August raises doubts over the strength of US economic growth in the third quarter. The survey shows that the service sector-led acceleration of growth in the second quarter has faded, accompanied by a further fall in factory output.
"Companies report that demand is looking increasingly lethargic in the face of high prices and rising interest rates. A resultant fall in new orders received by firms in August could tip output into contraction in September as firms adjust operating capacity in line with the deteriorating demand environment. Hiring could likewise soon turn into job shedding in the coming months after a near-stagnation of employment in August.
"Rising wage pressures as well as increased energy prices have meanwhile pushed input cost inflation higher, which will raise concerns over the stickiness of consumer price inflation in the months ahead. One upside is that weak demand is starting to limit pricing power, which should help keep a lid on inflation around the 3% mark."