Sample Category Title
Australian Dollar Steady After Lackluster PMIs
- Australia’s manufacturing and services PMIs ease in August
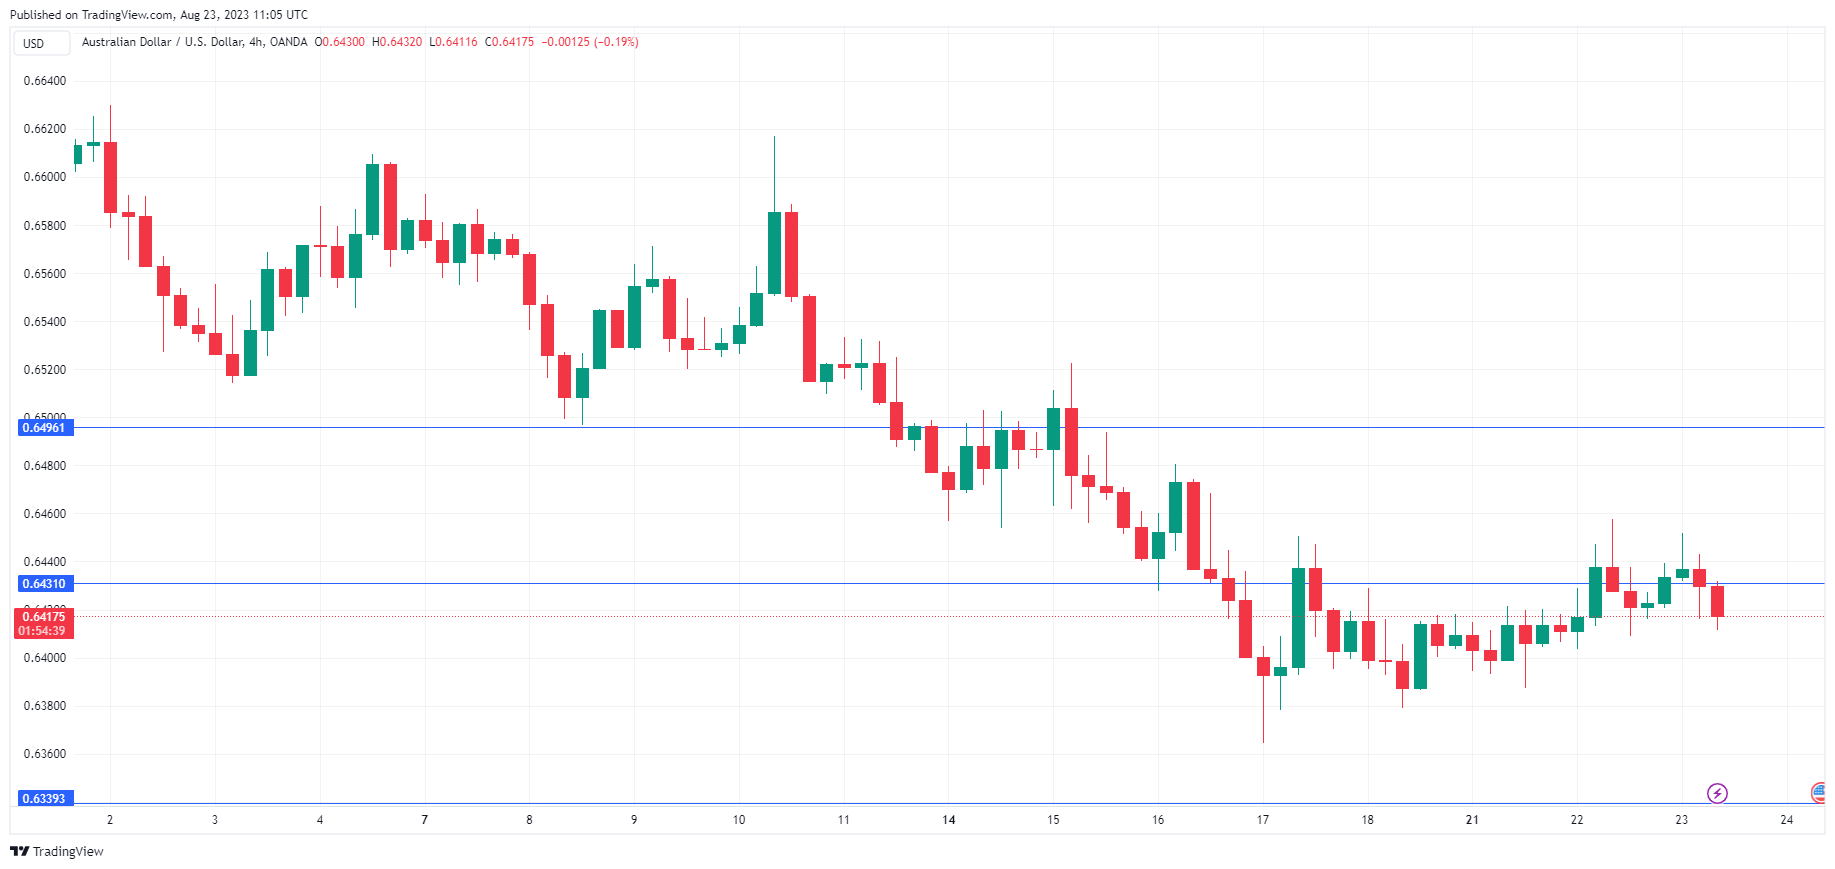
The Australian dollar is slightly lower on Wednesday. In the European session, AUD/USD is trading at 0.6416, down 0.07%. For a second straight day, the Australian dollar made some headway but then retreated.
There are no tier-1 events out of Australia this week, and not surprisingly, AUD/USD is having a sleepy week. On Wednesday, Australia released the August PMI reports which pointed to a contraction in manufacturing and services (the 50.0 line separates contraction from expansion).
Australia’s manufacturing sector continues to sputter and has declined for six consecutive months. The manufacturing PMI eased to 49.4 in August, down marginally from 49.6 in July. New orders are down which has led to less output, and there’s little room for optimism as there are no signs of global demand picking up. China, Australia’s largest trading partner, is experiencing deflation and a deteriorating economy, which will add to the manufacturing sector’s woes.
The services sector has also been struggling, although Services PMI reeled off three straight months of growth earlier in the year. In August, the PMI fell from 47.9 to 46.7 points. This marks the lowest level in 19 months. The PMI data is further proof of a slowdown in the Australian economy, which will lend support to the Reserve Bank of Australia easing up on interest rate hikes. The tricky task for the central bank is to follow a rate path that will cool the economy and guide it to a soft landing without causing a recession. The RBA took a pause in August and the futures markets are widely expecting a second pause at the September meeting.
AUD/USD Technical
- AUD/USD tested resistance at 0.6431 earlier. Next, there is resistance at 0.6496
- There is support at 0.6339 and 0.6274
EUR/USD Eyes Recovery While USD/JPY Corrects Lower
EUR/USD started a fresh decline from 1.0930. USD/JPY is correcting gains and might test the 144.90 support in the near term.
Important Takeaways for EUR/USD and USD/JPY Analysis Today
- The Euro started a fresh decline below the 1.0880 support.
- There was a break below a key bullish trend line with support at 1.0890 on the hourly chart of EUR/USD at FXOpen.
- USD/JPY struggled near 146.40 and recently started a downside correction.
- There is a major bearish trend line forming with resistance near 145.85 on the hourly chart at FXOpen.
EUR/USD Technical Analysis
On the hourly chart of EUR/USD at FXOpen, the pair started a fresh decline from the 1.0930 zone. The Euro declined below the 1.0910 support zone to enter a bearish zone against the US Dollar as mentioned in the previous analysis.
There was a break below a key bullish trend line with support at 1.0890. The pair even settled below the 1.0880 zone and the 50-hour simple moving average. A low is formed near 1.0832 and the pair is now correcting losses above the 23.6% Fib retracement level of the recent decline from the 1.0930 swing high to the 1.0832 low.
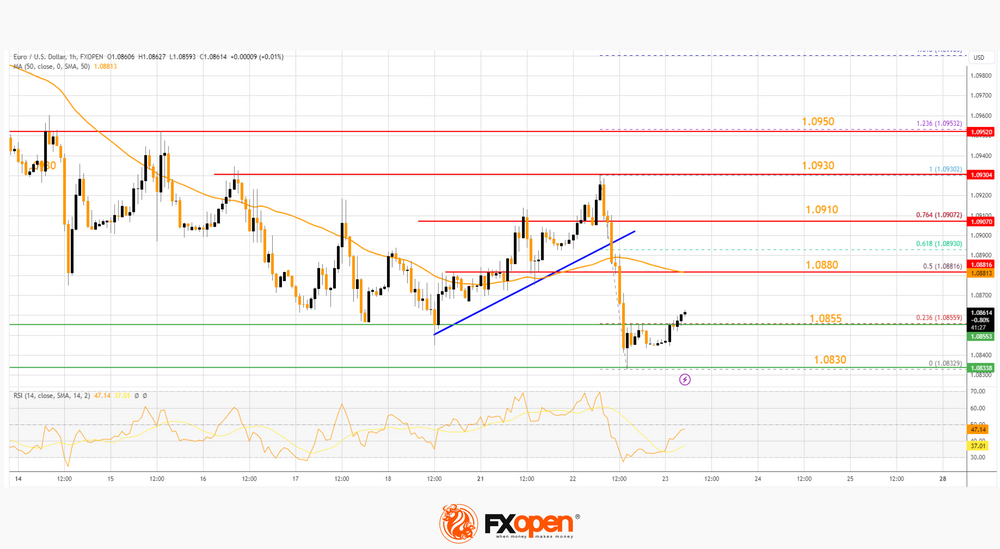
On the upside, the pair is now facing resistance near the 50-hour simple moving average at 1.0880. It is close to the 50% Fib retracement level of the recent decline from the 1.0930 swing high to the 1.0832 low.
The next major resistance is near 1.0910. The main resistance is still near 1.0930. An upside break above 1.0930 could set the pace for another increase. In the stated case, the pair might rise toward 1.1000.
If not, the pair might resume its decline. The first major support on the EUR/USD chart is near 1.0830. The next key support is near 1.0800. If there is a downside break below 1.0800, the pair could drop toward 1.0765. The next support is near 1.0750, below which the pair could start a major decline.
USD/JPY Technical Analysis
On the hourly chart of USD/JPY at FXOpen, the pair started a decent increase from the 145.00 zone. The US Dollar gained bullish momentum above 145.50 against the Japanese Yen.
The pair even climbed above 146.00 before the bears appeared near 146.40. As a result, the pair started a downside correction below the 50-hour simple moving average and 143.00. There was a move below the 50% Fib retracement level of the upward move from the 144.92 swing low to the 146.40 high.
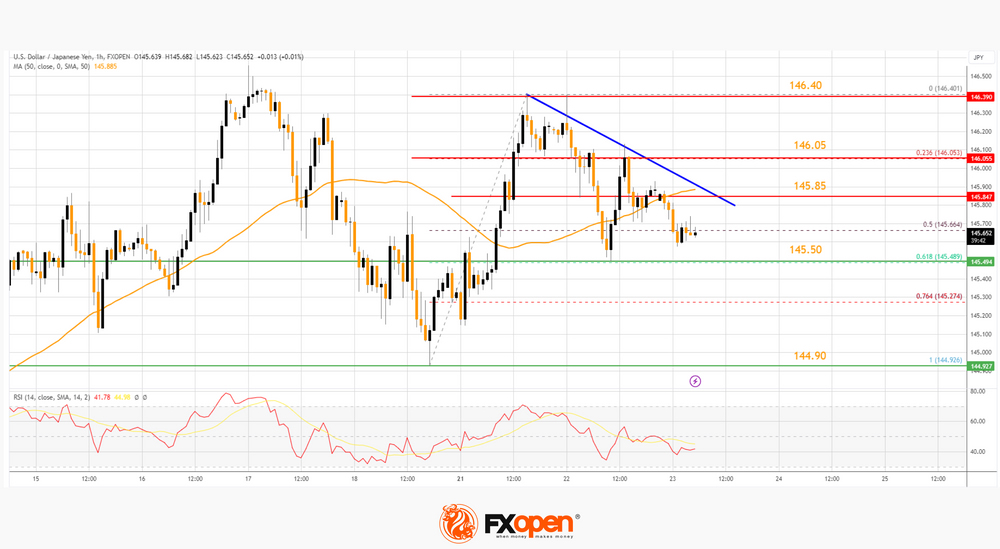
Besides, there is a major bearish trend line forming with resistance near 145.85. On the downside, the first major support is near the 61.8% Fib retracement level of the upward move from the 144.92 swing low to the 146.40 high at 145.50.
A downside break below the 145.50 support might spark strong bearish moves. The next major support is near 144.90. If there is a close below 144.90, the pair could decline steadily.
In the stated case, the pair might drop toward 144.20. The next stop for the bears may perhaps be near the 143.50 zone. Immediate resistance on the USD/JPY chart is near the 50-hour simple moving average and the trend line at 145.85.
If there is a close above the 145.85 level and RSI moves above 50, the pair could rise toward 146.05. The next major resistance is near 146.40, above which the pair could test 148.00 in the coming days.
This article represents the opinion of the Companies operating under the FXOpen brand only. It is not to be construed as an offer, solicitation, or recommendation with respect to products and services provided by the Companies operating under the FXOpen brand, nor is it to be considered financial advice.
BTC/USD Price Analysis: RSI Drops to Lowest Since March 2020
The last time this classic indicator dropped below the 20.0 level was in March 2020, when the world panicked due to the spread of the coronavirus.
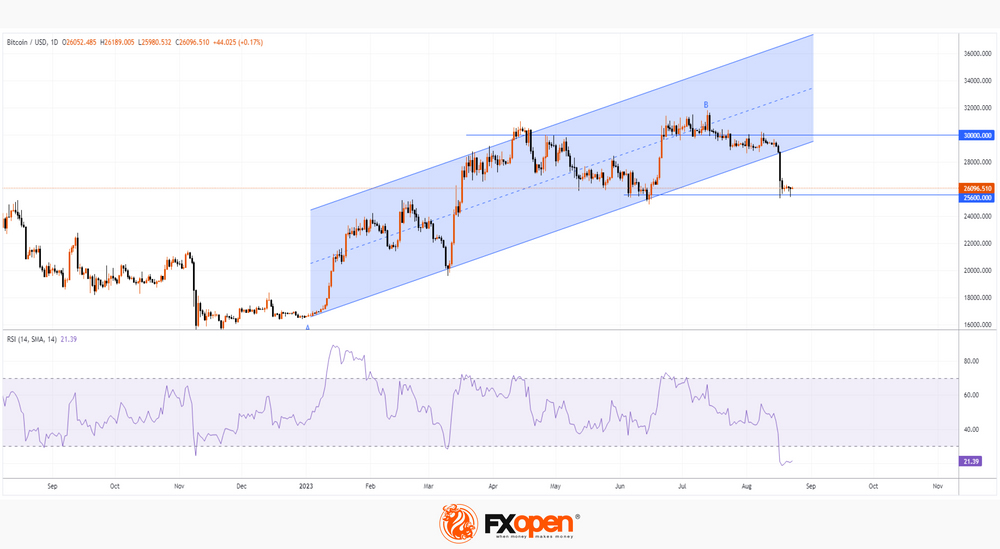
→ SpaceX's decision to sell bitcoins from its balance sheet;
→ high yields of US government bonds (10-year bonds are at a 14-year high);
→ the collapse of the Chinese developer Evergrande.
Be that as it may, the decline of RSI below the level of 20.0 should not be interpreted as a signal to open a long position, although there is evidence for this.
Bullish arguments:
→ a long lower shadow on yesterday's candle on the daily bitcoin price chart confirms the aggressiveness of the bulls defending the 25.6k level;
→ this level approximately coincides with the Fibo level at 0.38 for a rollback from the growth of A→B;
→ the bitcoin market may follow the stock market — after all, the S&P 500 is at the lower boundary of the rising channel, which operates in 2023.
Bearish arguments:
→ The price of bitcoin has broken through the upward channel of 2023, which may mean a radical change in sentiment. The USD 30,000 level proved to be a difficult barrier for the bulls.
→ Intraday charts show that bitcoin fell especially rapidly in the 26,800-27,500 range. Therefore, this area of seller dominance could become resistance to a recovery if it follows the RSI's spring 2020 lows.
This article represents the opinion of the Companies operating under the FXOpen brand only. It is not to be construed as an offer, solicitation, or recommendation with respect to products and services provided by the Companies operating under the FXOpen brand, nor is it to be considered financial advice.
D-day for the US Stock Market as Nvidia Earnings Loom
- The share price performance of Nvidia has been the main driver of Nasdaq 100 outperformance/premium against the rest of the world stock indices ex-US.
- Lofty expectations have been priced in for Nvidia ahead of its Q2 earnings release today.
- Several bearish technical elements have emerged in the share price of Nvidia.
In the past four weeks, the ongoing medium-term bullish trend in the US stock market has started to wobble due to rising longer-term “risk-free” US Treasury yields that increase the opportunity costs of owning riskier assets such as equities. The global benchmark for long-term interest rates, the 10-year US Treasury yield has staged a relentless up move since mid-July 2023 towards 4.34% on Monday, 21 August, surpassing last year’s October peak and reaching a 16-year high.
The worst hit so far in the rising US Treasuries yields environment is the “long-duration growth styled” US equities which comprises the “Magnificent Seven” group of mega-cap technology stocks that includes Apple, Microsoft, and Nvidia which in turn has a significant high combined weightage in Nasdaq 100, one of the major US benchmark stock indices.
The Nasdaq 100 has recorded a month-to-date loss of -5.4% as of 22 August, its worst monthly performance since December last year and it chalked up an impressive intra-year-to-date gain of +45.6% in July 2023 despite the US regional banking turmoil in March.
The leader of the “Magnificent Seven” is Nvidia, the graphics semiconductor chip marker where its share price soared by nearly three times in 2023, riding on the optimism of a generative artificial intelligence productivity boom.
Interestingly, after the release of Nvidia’s fiscal Q1 earnings report on 24 May 2023 that blew expectations and offered rosy revenue guidance which in turn triggered a further widening of Nasdaq 100’s outperformance/premium against the rest of the world stock indices excluding the US as represented by the MSCI All Country Index ex- US exchange-traded fund (see Fig 1. Chart).
Nvidia’s share price performance is the main contributor to Nasdaq 100 outperformance
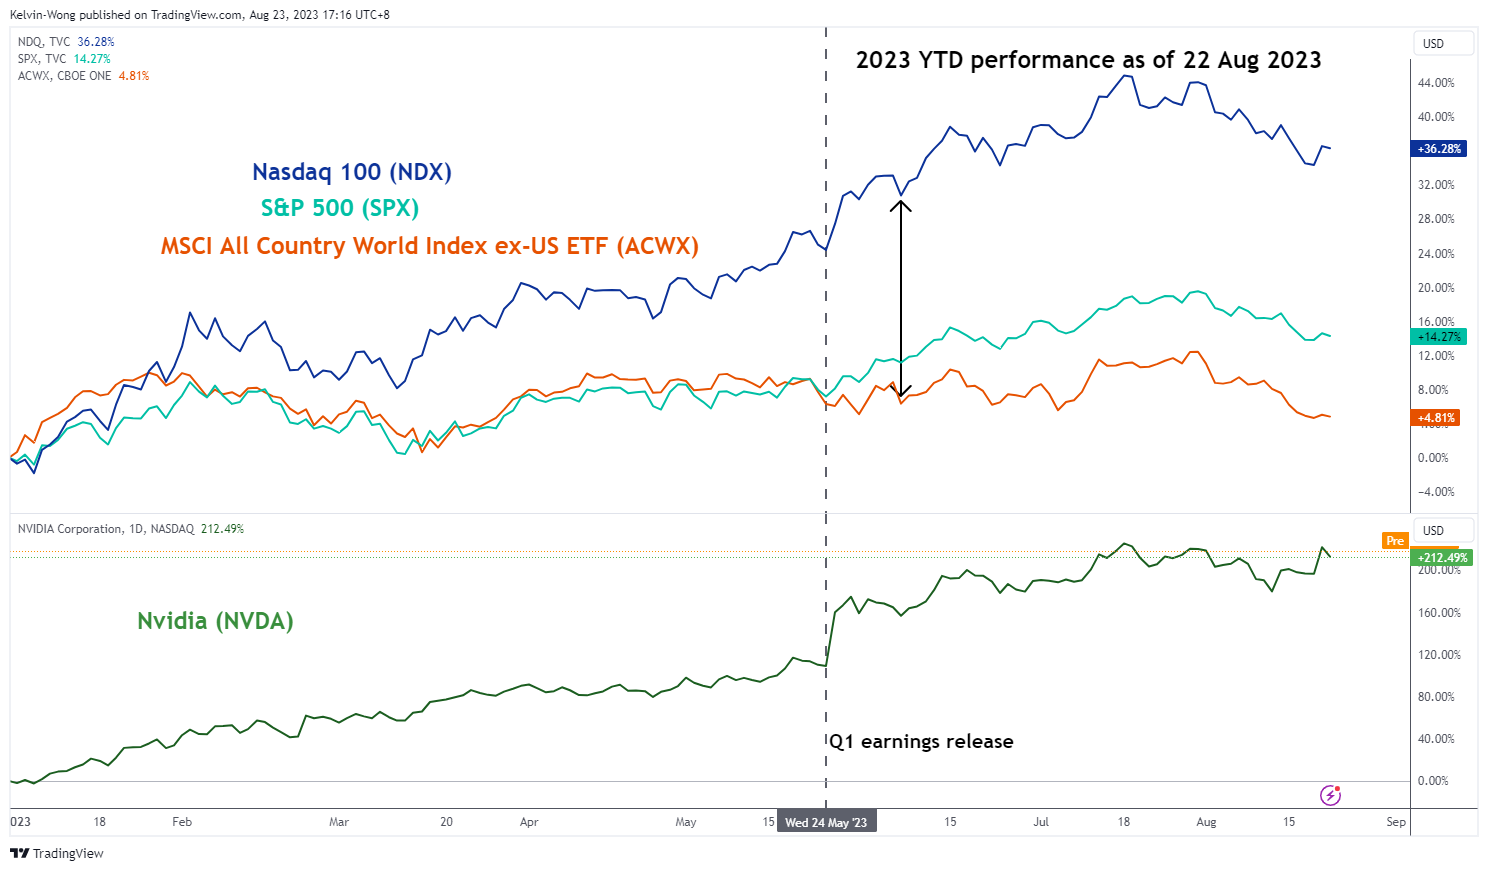
Fig 1: 2023 year-to-date performance of Nasdaq 100, S&P 500, Nvidia & MSCI All Country World Index ex-US ETF as of 22 Aug 2023
(Source: TradingView, click to enlarge chart)
So far, analysts on the aggregate have placed lofty expectations on Nvidia’s Q2 earnings where consensus for its Q2 earnings per share is set at $2.08, which translates to a whopping +308% year-on-year increase over the same period in 2022. Also, the relative valuation of Nvidia has expanded on the high side where its forward price-to-earnings ratio stands at 44 times versus 17.6 times seen in the S&P 500.
Based on the current pricing of such future accelerated earnings growth, Nvidia now faces a higher bar of overcoming such highly optimistic expectations than before during the prior May 2023 earnings release. Hence, any minuscule disappointment in Q2 earnings numbers and or outlook trend is likely to trigger a significant negative feedback loop in the share price of Nvidia that may jeopardize the current bullish trend of the Nasdaq 100.
Bearish technical elements have emerged in Nvidia
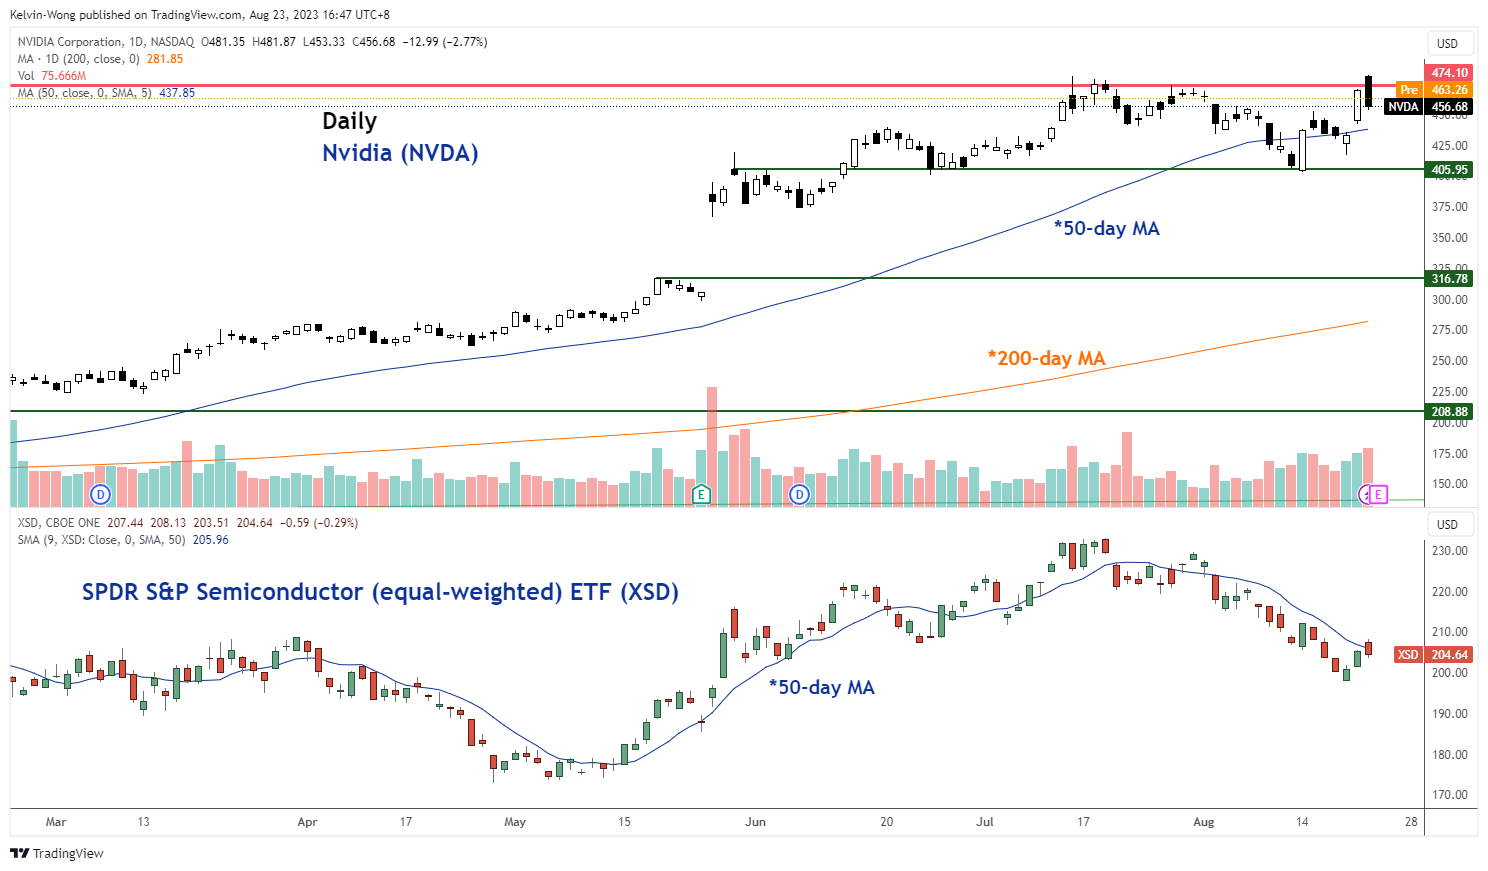
Fig 2: Medium-term trend of Nvidia & SPDR S&P Semiconductor ETF as of 22 Aug 2023 (Source: TradingView, click to enlarge chart)
In the lens of technical analysis, the current price actions of Nvidia (NVDA) have flashed out bullish exhaustion conditions which indicate an increased risk of a multi-week bearish reversal. Yesterday, 22 August, NVDA surged to print an intraday fresh all-time high of 481.87 but failed to maintain its bullish momentum. It closed lower at 456.68 below its key resistance of 474.10, and formed a daily bearish “Dark Cloud Cover” candlestick pattern with the highest volume reading since 21 July 2023.
Key medium-term support to watch will be at 405.95, a clear break with a daily close below it exposes the gap support region of 316.80 that has been formed ex-post Q1 earnings release on 24 May.
Also, the broader US semiconductor sector represented by the SPDR S&P Semiconductor equal-weighted exchange-traded fund (XSD) has continued to underperform against NVDA since 2 August 2023 as its price actions remained below its downward sloping 50-day moving average.
NZDUSD halts decline at 61.8% Fibonacci
NZDUSD has been in a steep decline after peaking at the five-month high of 0.6410 in July. However, the pair has managed to temporarily pause its retreat following its bounce off 0.5902, which is the 61.8% Fibonacci retracement of the 0.5510-0.6536 upleg.
The short-term oscillators currently suggest that positive momentum is picking up but bearish forces remain in control. Specifically, the MACD is strengthening but holds below both zero and its red signal line, while the RSI is hovering deep in the negative zone after rebounding from its 30-oversold mark.
If the pair manages to jump above the descending trendline that connects a series of lower highs since July, immediate resistance could be found at the 50.0% Fibo of 0.6023. Should that barricade fail, the 38.2% Fibo of 0.6144, which overlaps with the 50-day simple moving average (SMA), could prove to be the next obstacle for buyers to overcome. Surpassing that zone, the price could ascend towards the 23.6% Fibo of 0.6294 ahead of the five-month peak of 0.6410.
Alternatively, should the bears attempt to push the price lower, the 61.8% Fibo of 0.5902 could act as the first line of defence. Piercing through that zone, the pair could face the 78.6% Fibo of 0.5730. A break below that region could pave the way for the October 2022 bottom of 0.5510.
Overall, it seems that NZDUSD’s latest downtrend is running out of steam. However, a break above the downward sloping trendline is needed to validate the resumption of the pair’s recovery.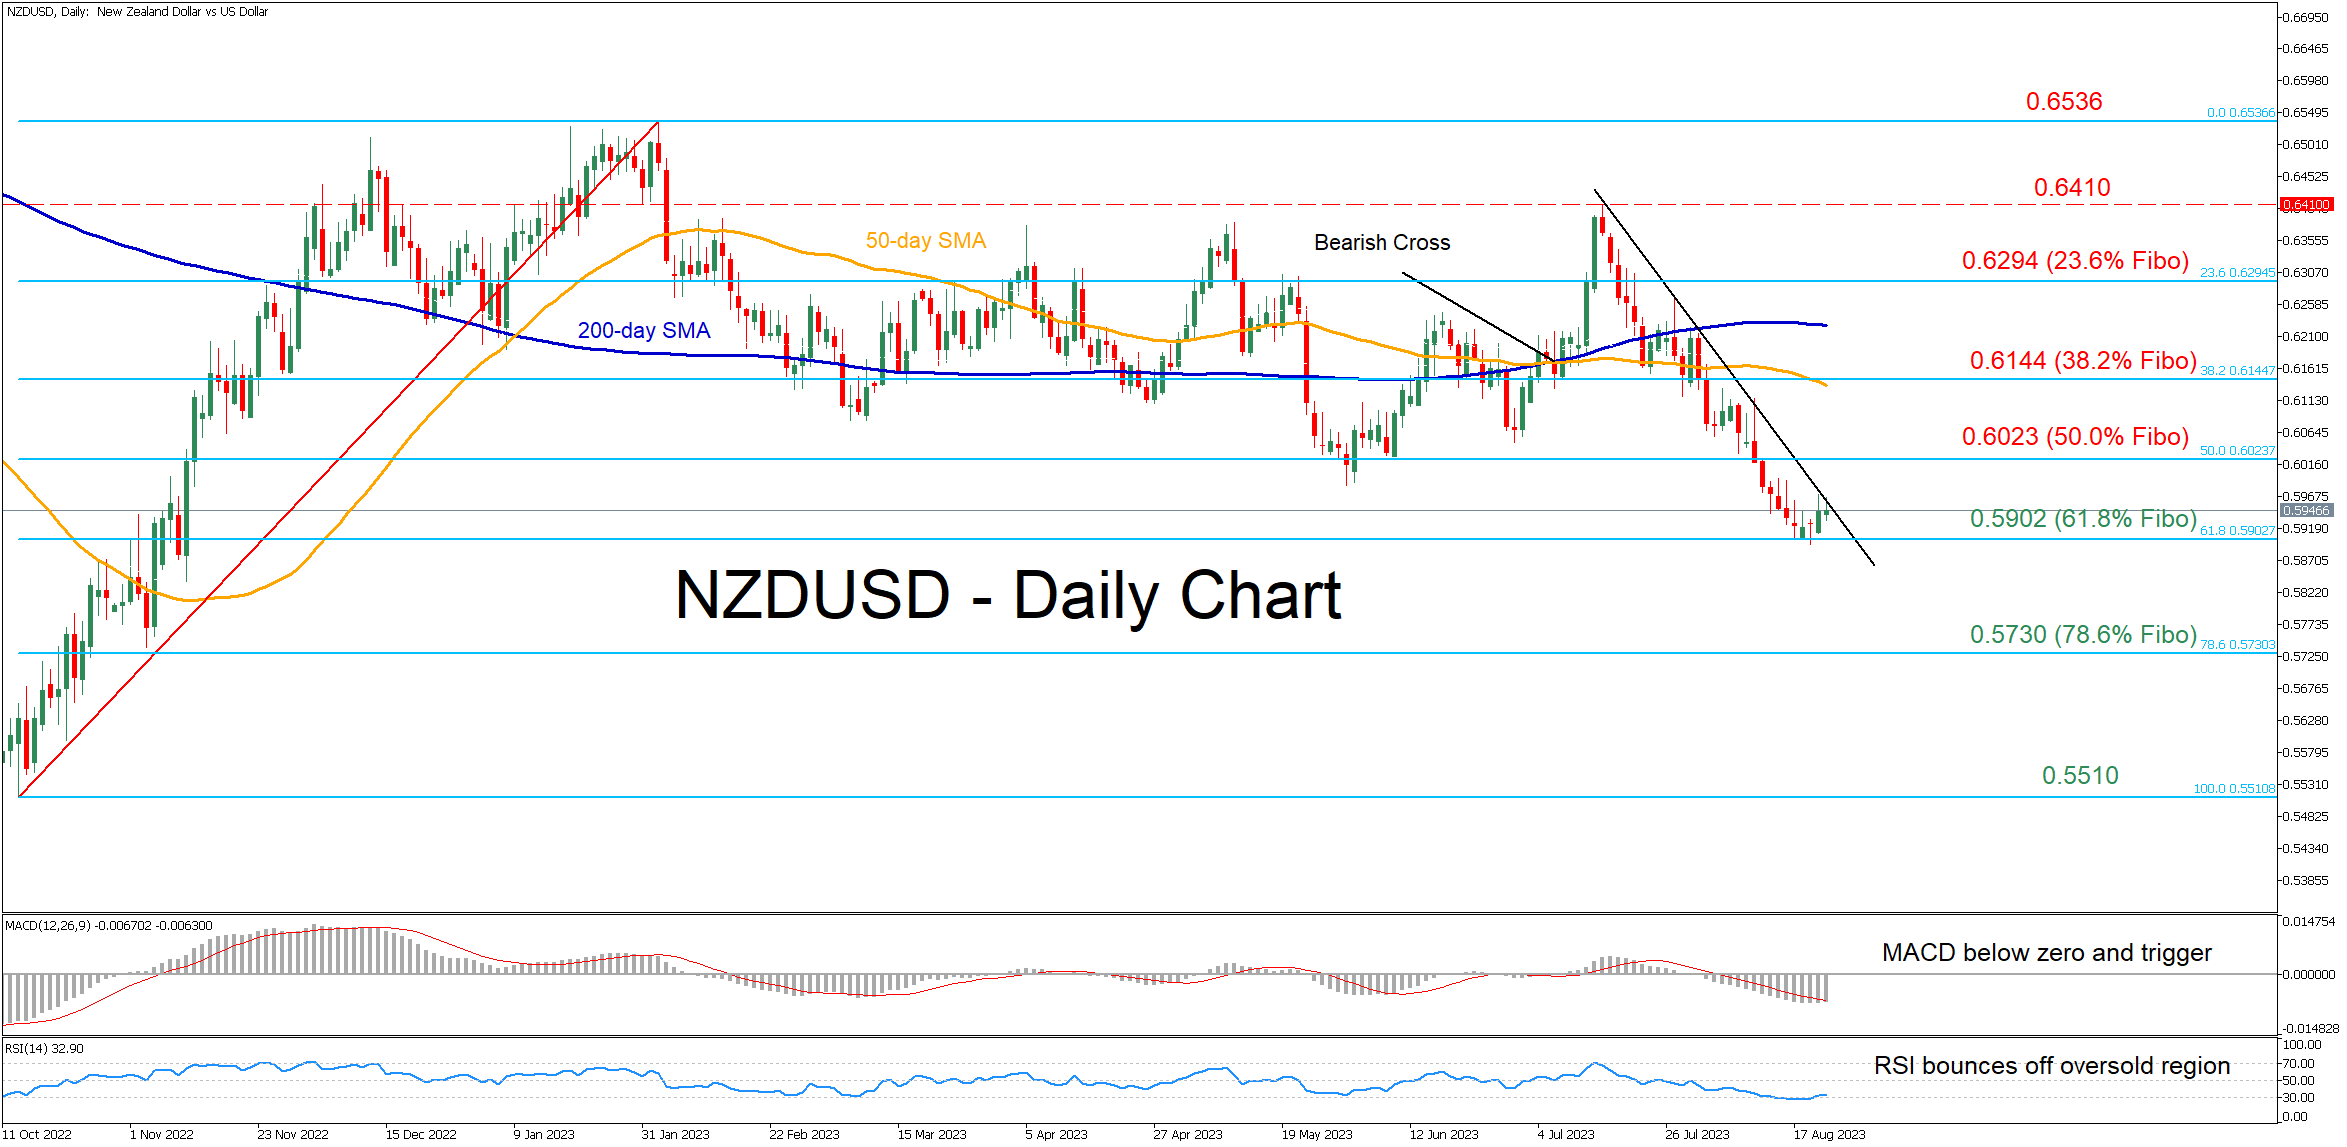
USD Holds onto Gains
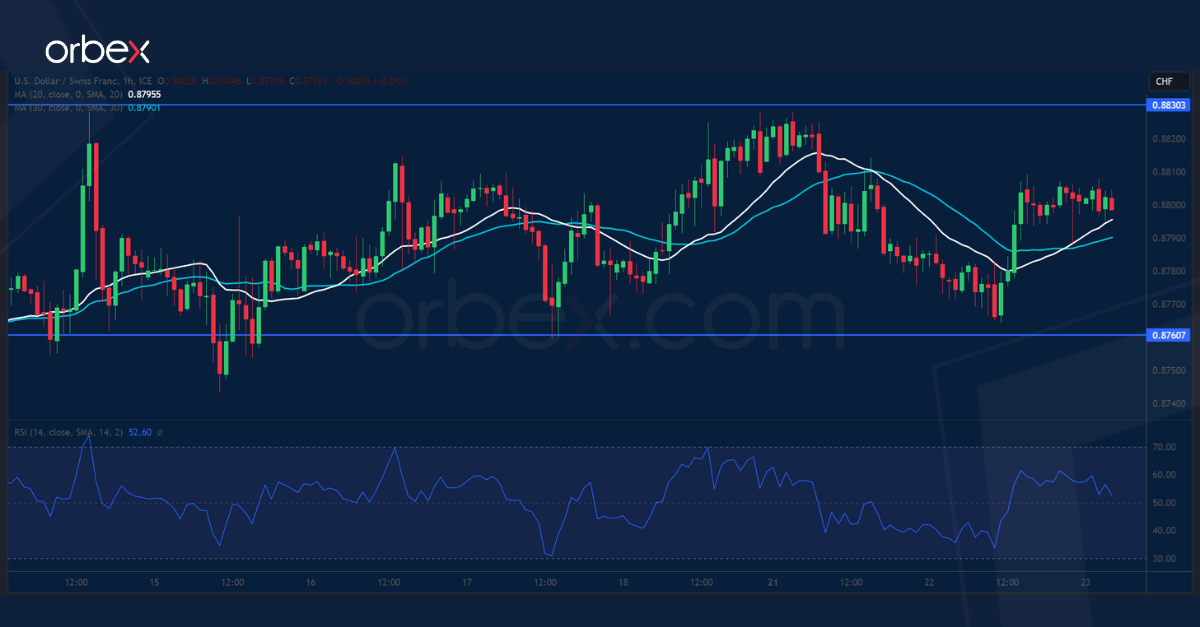
USD/CHF grinds support
The US dollar consolidates as market participants await the Jackson Hole Symposium on Thursday. In the wake of July’s sell-off profit-taking has been driving the bid up. Then the upward grind came to a halt at the support-turned-resistance of 0.8830 at May’s lows where the bears may be looking to double down. 0.8760 is the closest support to keep the upward slope intact and its breach would confirm that the path of least resistance is down. The bulls will need to lift offers around 0.8830 to extend the recovery above 0.8900.
NZD/USD tries to bottom out
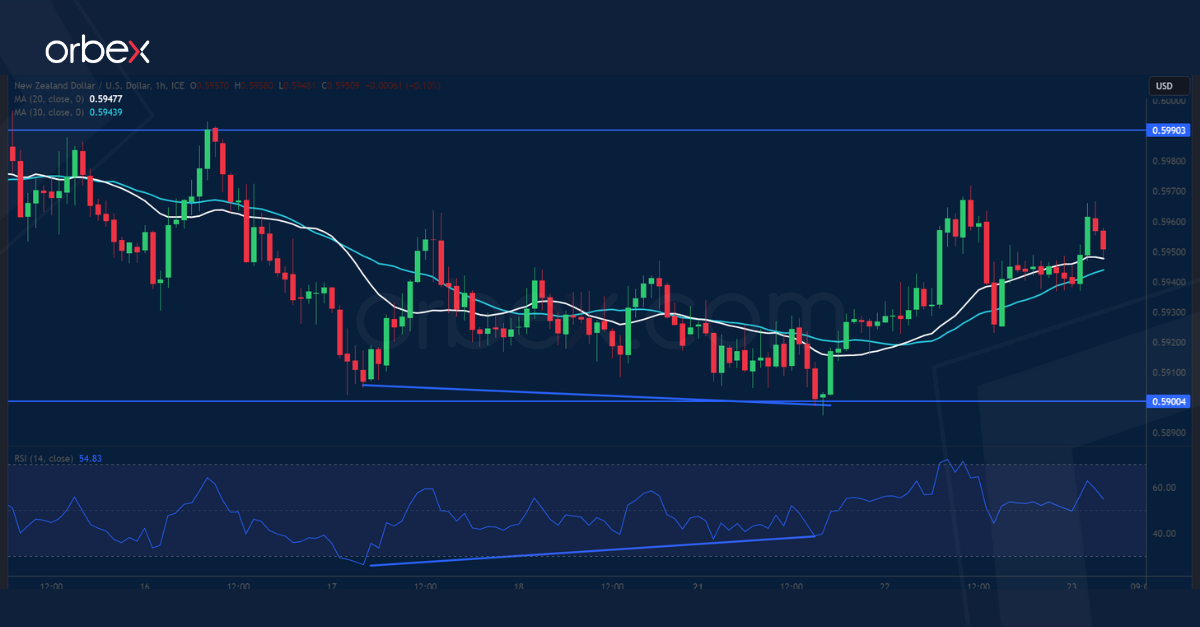
The New Zealand dollar edged higher as retail sales beat expectations in Q2. The pair is trying to stabilise above 0.5900 and a bullish RSI divergence indicates a slowdown in the sell-off momentum, opening the door to a potential bounce. The first supply zone between 0.5990 and the psychological level of 0.6000 is the first obstacle to clear to ease the selling pressure. Then the former daily support of 0.6100 would be within reach. On the downside, 0.5930 is a fresh support in case of a prolonged consolidation.
FTSE 100 tests critical floor
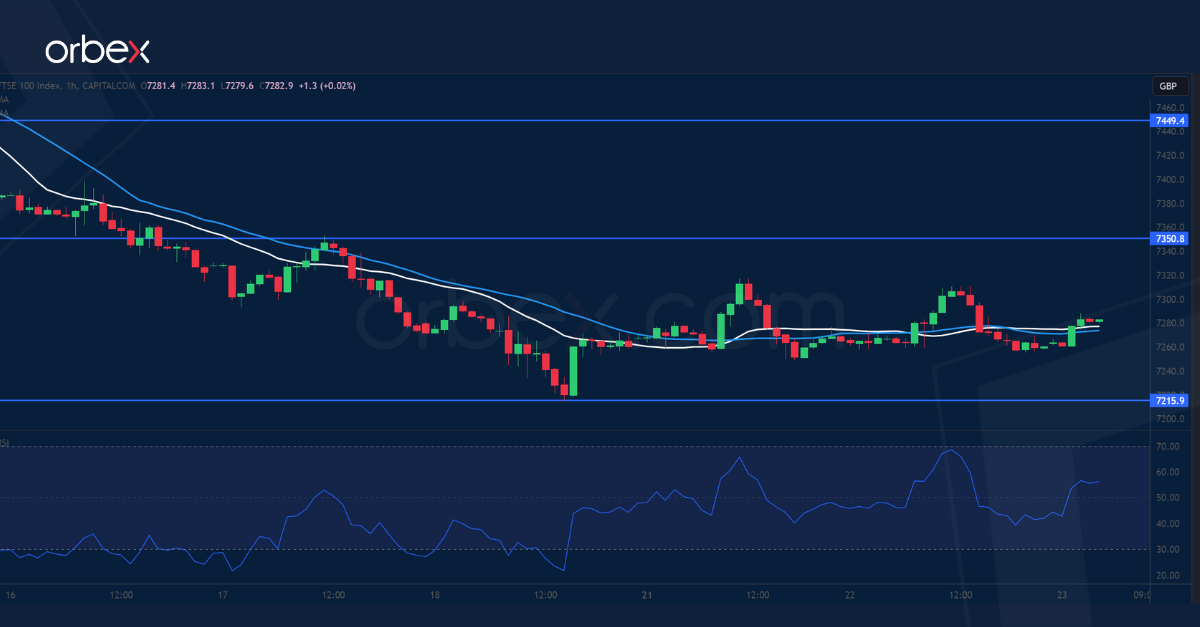
Global equities struggle over surging US Treasury yields amid renewed hike concerns. The FTSE 100’s close below July’s low of 7230 has invalidated last month’s rebound, putting the bulls under pressure. This critical demand zone extends all the way to March’s low of 7200 and a failure to stay above may trigger a fall to 7000. As the index steadies around 7215, 7350 on the hourly chart is the first resistance to clear to give the buy side a fighting chance but the support-turned-resistance of 7450 could be a tougher level to crack.
EUR/GBP Daily Outlook
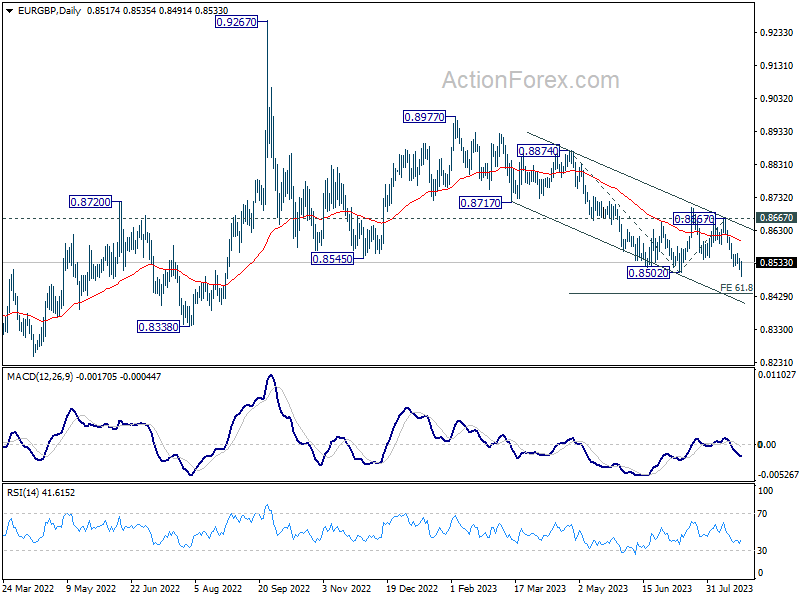
Daily Pivots: (S1) 0.8506; (P) 0.8526; (R1) 0.8538; More...
EUR/GBP breached 0.8502 support but quickly recovered. Intraday bias stays neutral first. On the downside, firm break of 0.8502 will resume larger down trend. Next target is 61.8% projection of 0.8874 to 0.8502 from 0.8667 at 0.8437. On the upside, above 0.8592 minor resistance turn bias back to the upside for stronger rebound instead.
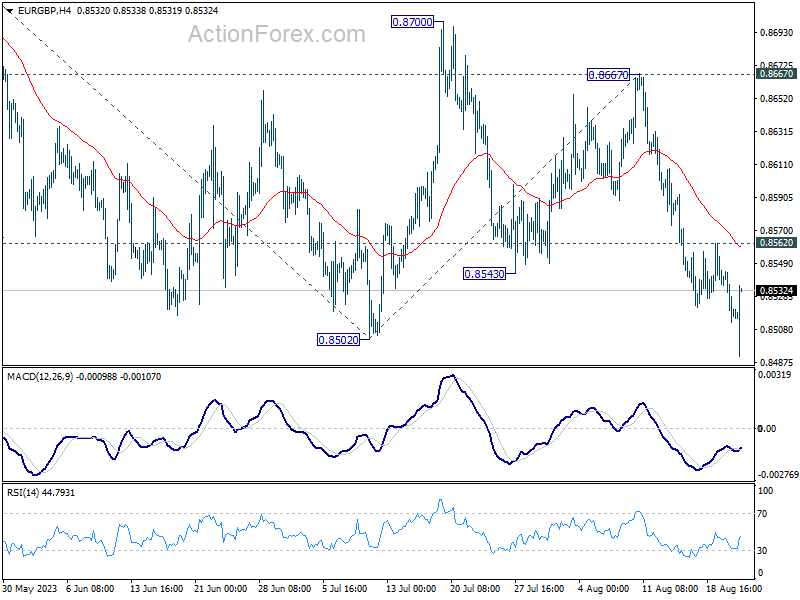
In the bigger picture, the down trend from 0.9267 (2022 high) is seen as part of the long term range pattern from 0.9499 (2020 high). Further decline is in favor as long as 0.8667 resistance holds. Break of 0.8502 will resume the fall towards 0.8201 (2022 low).
GBP/JPY Daily Outlook
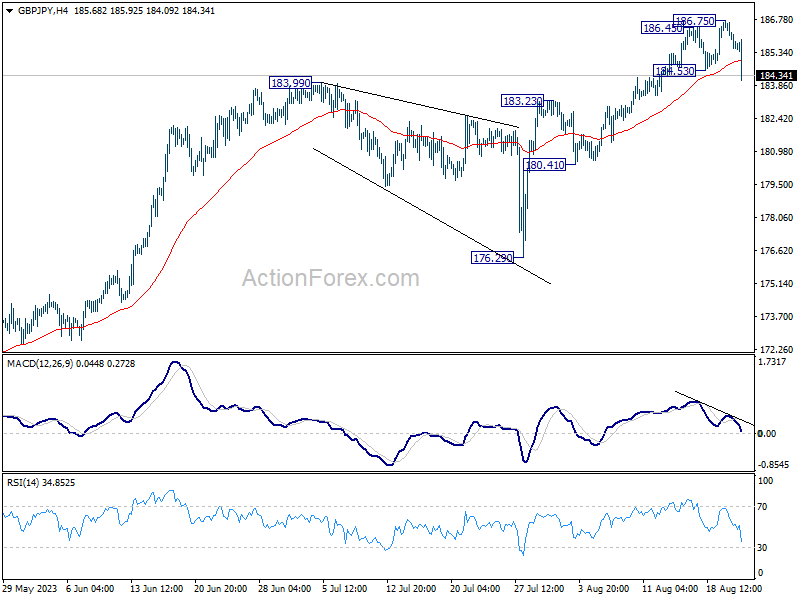
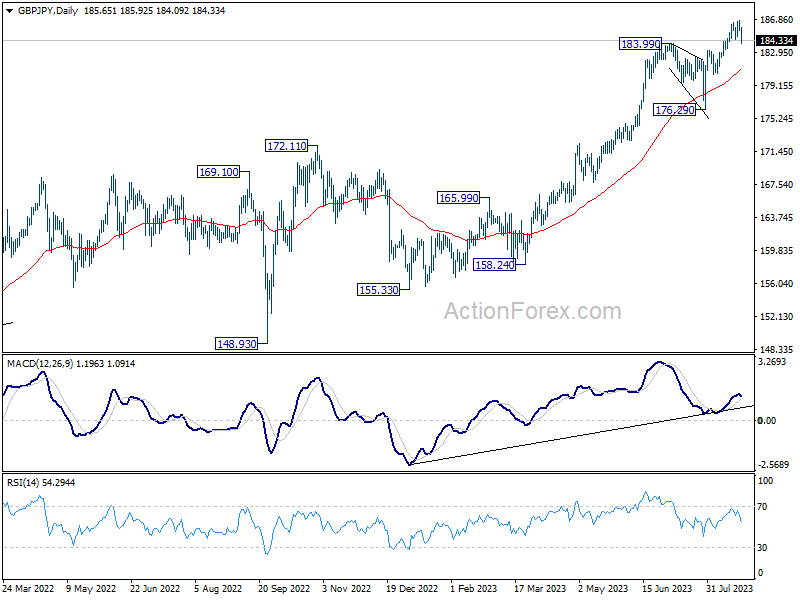
Daily Pivots: (S1) 185.27; (P) 186.02; (R1) 186.50; More...
GBP/JPY's steep fall and break of 184.53 minor support suggests that a short term top was in place at 186.75. Intraday bias is back on the downside for 55 D EMA (now at 180.84). For now, risk will remain on the downside as long as 186.75 resistance holds, in case of recovery.
In the bigger picture, up trend from 123.94 (2020 low) is in progress. Next target is 195.86 (2015 high). This will now remain the favored case as long as 176.29 support holds, even in case of deeper pull back.
UK PMI composite fell to 31-mth low, inflation fight carries a heavy cost
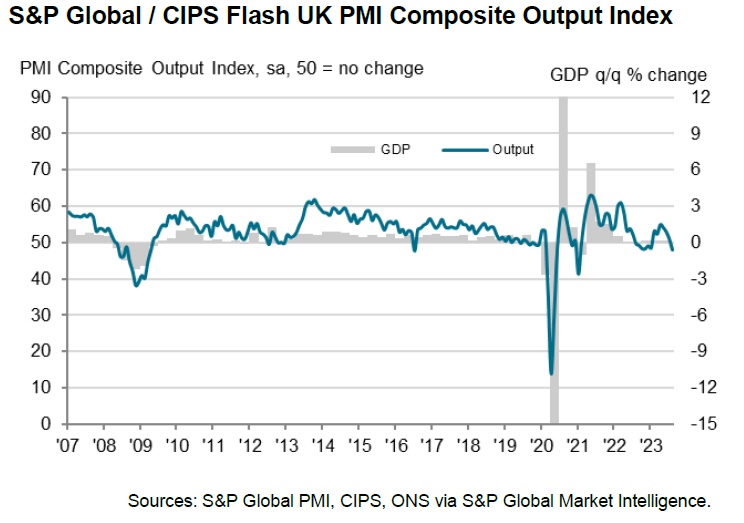
UK PMI Manufacturing fell from 45.3 to 41.5 in August, a 39-month low, and missed expectation of 45.1. PMI Services fell from 51.5 to 48.7, a 7-month low, below expectation of 50.8. PMI Composite fell from 50.8 to 47.9, a 31-month low, and first contraction since January.
Chris Williamson, S&P Global Market Intelligence's Chief Business Economist, commented on the data's implications: "The early PMI survey for August suggests that inflation should moderate further in the months ahead, but also indicates that the fight against inflation is carrying a heavy cost in terms of heightened recession risks.
The numbers tell a story of a stalling economy. The service sector's earlier signs of rejuvenation are waning, and the manufacturing sector's decline is becoming more pronounced. Williamson added that the data suggests a -0.2% contraction in GDP for Q3."
He also alluded to the broader monetary implications, noting, "While a further hike in interest rates in September looks to be on the cards, the August PMI data will add to speculation that rates could soon peak."
EUR/JPY Daily Outlook
Daily Pivots: (S1) 157.72; (P) 158.60; (R1) 159.12; More....
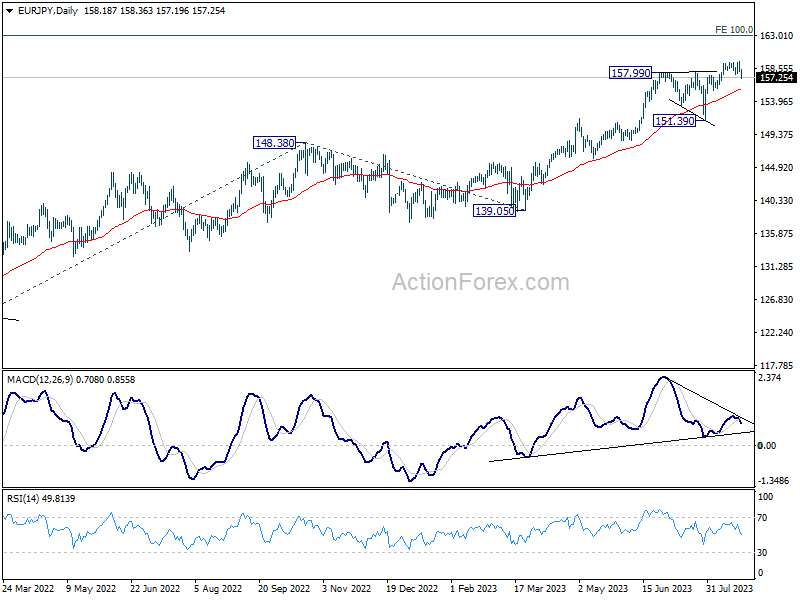
EUR/JPY's steep fall and break of 157.64 minor support indicates short term topping at 159.47, on bearish divergence condition in 4H MACD. Intraday bias is back on the downside for 55 D EMA (now at 155.62) first. For now, risk will stay mildly on the downside as long as 159.47 holds, in case of recovery.
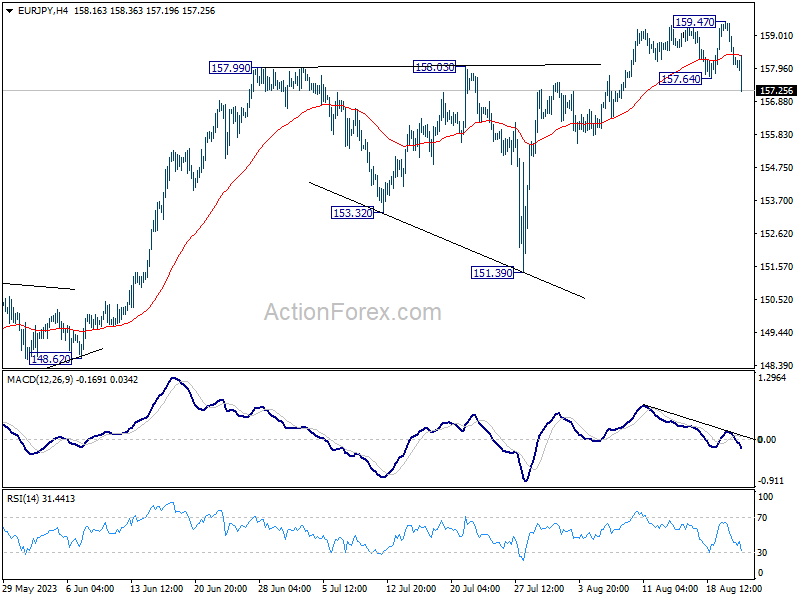
In the bigger picture, rise from 114.42 (2020 low) is in progress. Next target is 100% projection of 124.37 to 148.38 from 139.05 at 163.06. Sustained break there will pave the way to retest long term resistance at 169.96. This will now remain the favored case as long as 151.39 support holds, even in case of deep pull back.