Sample Category Title
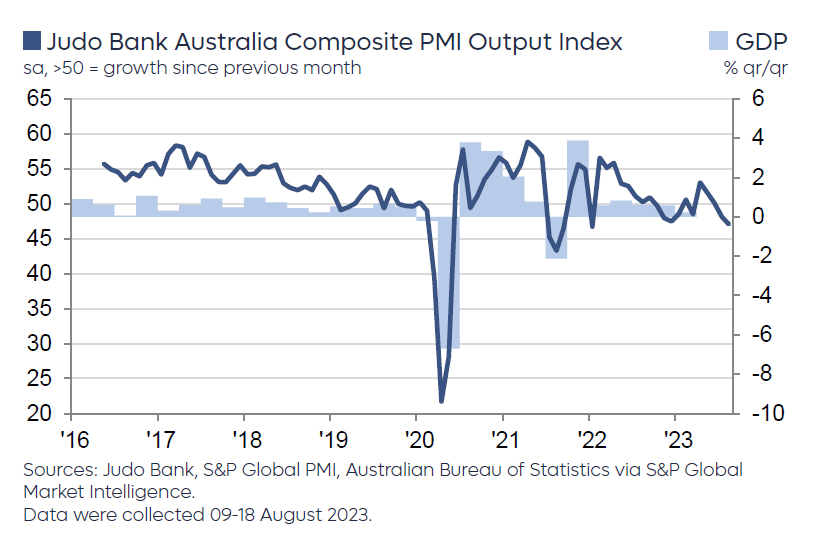
Australian PMI composite hits 19-month low, but concerns on inflation and strong employment rise
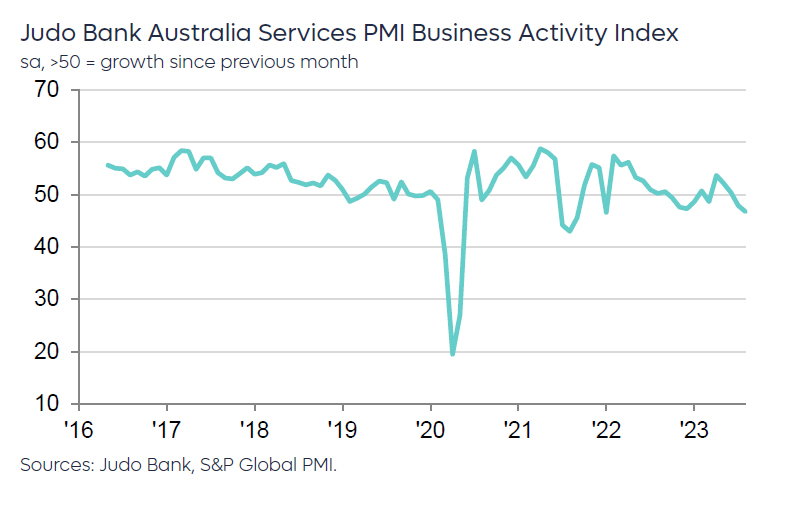
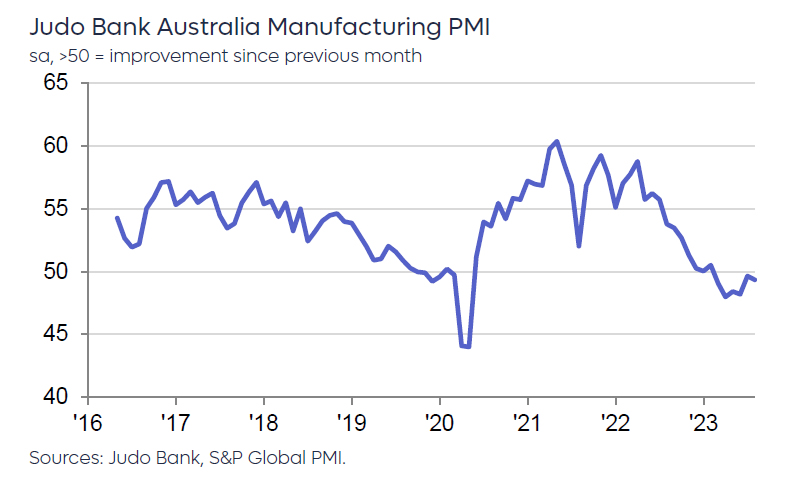
Australia's August PMI data showed a concerning decline across sectors. The Manufacturing PMI slightly decreased from 49.6 to 49.4, while Services PMI dropped to a 19-month low of 46.7. Composite PMI, reflecting both sectors, also declined to a 19-month low of 47.1.
Warren Hogan, Chief Economic Advisor at Judo Bank, drew attention to the employment sector's resilience. He noted, "Despite weakening PMI figures, the employment index remains positive, indicating robust labour demand across both manufacturing and services."
With businesses maintaining optimism, they might resist workforce reductions even amidst economic slowdowns. "As aggregate demand is supported by ongoing employment growth... it might mean a further substantial lift in interest rates could be required at some stage in the next 6-12 months," he added.
Inflation remains a key concern. After 2022 disinflation trend, 2023 has shown a halt in the falling price indexes. The current data suggests an inflation rate of about 4%, overshooting the RBA's 2-3% target range.
Hogan also noted wage growth concerns. Even with modest official growth figures, he cautioned that wage pressures might exceed RBA's forecasted 4% annual growth for 2023. "This may mean firm tightening bias to the RBA's policy deliberations for the rest of the year."
NZ retail sales volume down -1.0% qoq in Q2, value down -0.2% qoq
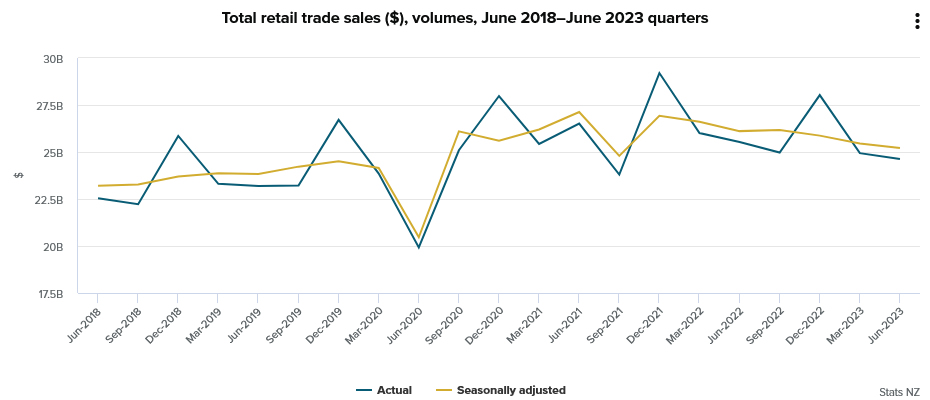
New Zealand's retail sales volume for Q2 plummeted by -1.0% qoq, settling at NZD 25B. This decline starkly contrasts with market forecasts which had anticipated a milder contraction of just -0.2% qoq. A broad-based slump was evident, as 11 out of 15 industries reported reduced seasonally adjusted sales volumes.
Highlighting the sectors that bore the brunt of this downturn, food and beverage services saw a sharp decline of -4.4%. Hardware, building, and garden supplies trailed closely, recording a -4.8% drop. These sectors emerged as the primary drags on the overall sales volume for the quarter.
While sales volume took a hit, retail sales value also showed signs of weakness, contracting -0.2% qoq to land at NZD 30B. Once again showcasing the breadth of the downturn, seven out of 15 industries registered a fall.
Is Gold Destined to Lose More of Its Shine?
With US Treasury yields and the dollar marching north, gold has come under selling interest, breaking last week below the key zone of $1,900. Although the short-term picture of the precious metal appears to have turned bearish, whether larger declines are in store will likely depend on Fed Chair Powell’s monetary policy remarks at Jackson Hole on Friday.
US economy fires on all cylinders
August appears to be a very hot month for US Treasury yields, with the 10-year climbing from a low of 3.25% to around 4.35%, a level last seen back in 2007. What likely added fuel to this rally was the Treasury’s decision to increase the size of its quarterly auction, focusing on longer-term bonds, which came hot on the heels of Fitch’s downgrade of America’s credit rating, as well as data suggesting that the US economy is faring much better than previously thought.
Just last week, retail sales for July well exceeded their forecasts, signaling that consumers’ purchasing power in the world’s largest economy remains strong, which combined with a still-tight labor market would make it difficult for inflation to further cool down.
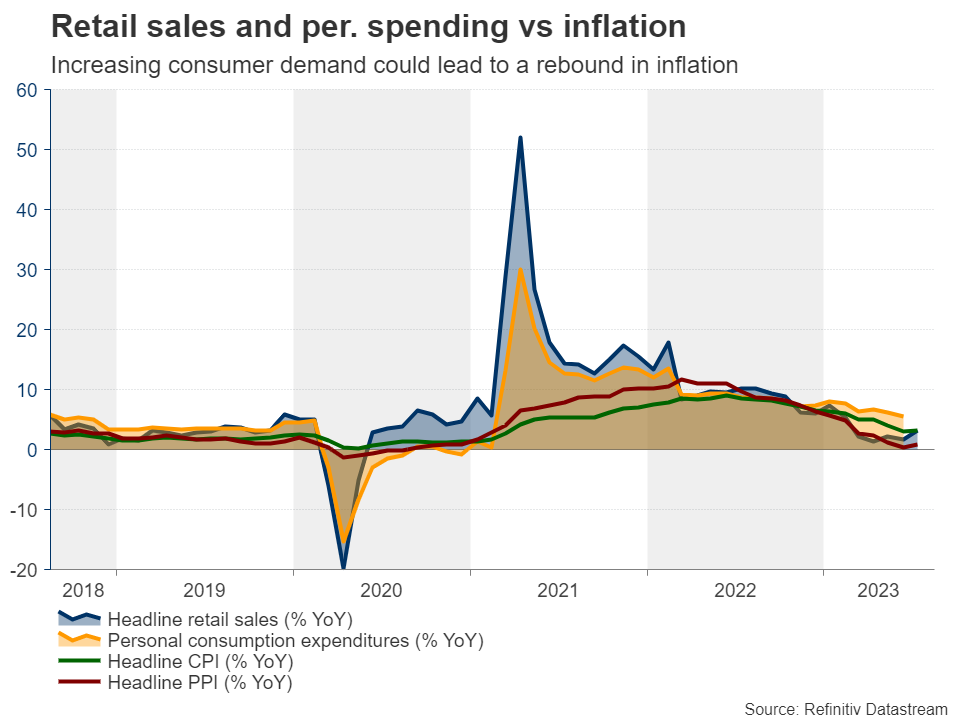
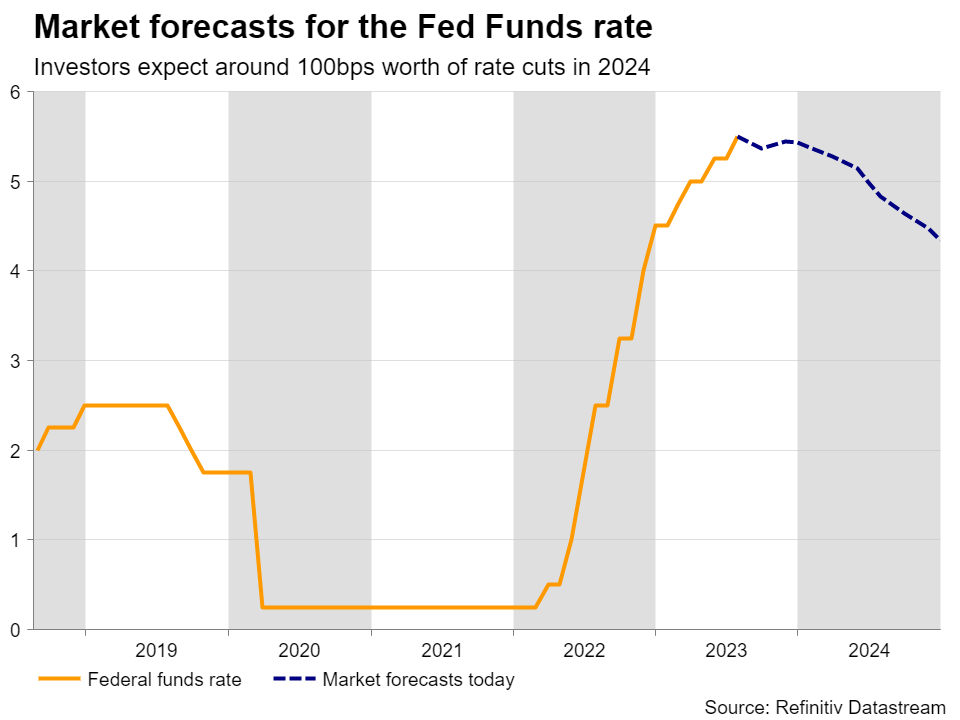
The retail sales data resulted in an upward revision to the Atlanta Fed GDP now model, which now suggests that the economy grew by an outstanding seasonally adjusted annual pace of 5.8%, and thereby prompted market participants to scale back some basis points worth of rate reductions by the Fed for next year. Now, there is also a nearly 45% probability for another Fed hike by November.
Rising yields and strong dollar weigh on gold
Apart from bond yields, the “higher for longer” narrative added more fuel to the dollar’s engines as well, which have been also charged by concerns surrounding the Chinese economy. The recovery in the world’s second largest economy has lost steam due to a deepening property crisis, softening consumer spending and worsening credit growth, with the latest stimulus measures by Chinese authorities and the People’s Bank of China (PBoC) failing to revive market sentiment.
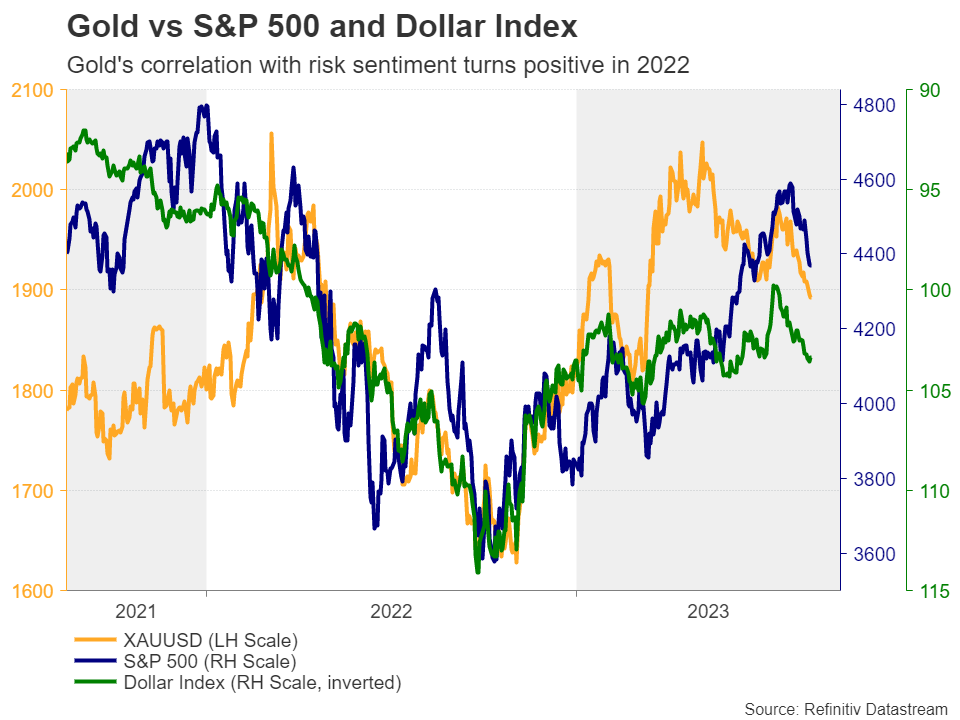
With Treasury yields soaring and the US dollar wearing its safe-haven suit, the non-yielding gold maintained a positive correlation with the stock market, seemingly not included on investors’ list of preferred safe havens, despite being considered a top choice before central banks began this tightening journey.
Jackson Hole enters the limelight
The next big challenge for traders of the precious metal may be a speech by Fed Chair Powell on Friday at the Jackson Hole economic symposium. At the press conference following the Committee’s last meeting, Powell said that the central bank will make decisions meeting by meeting, closely watching economic data, adding that they could hike again in September if the data suggests so, but also that they could choose to hold steady.
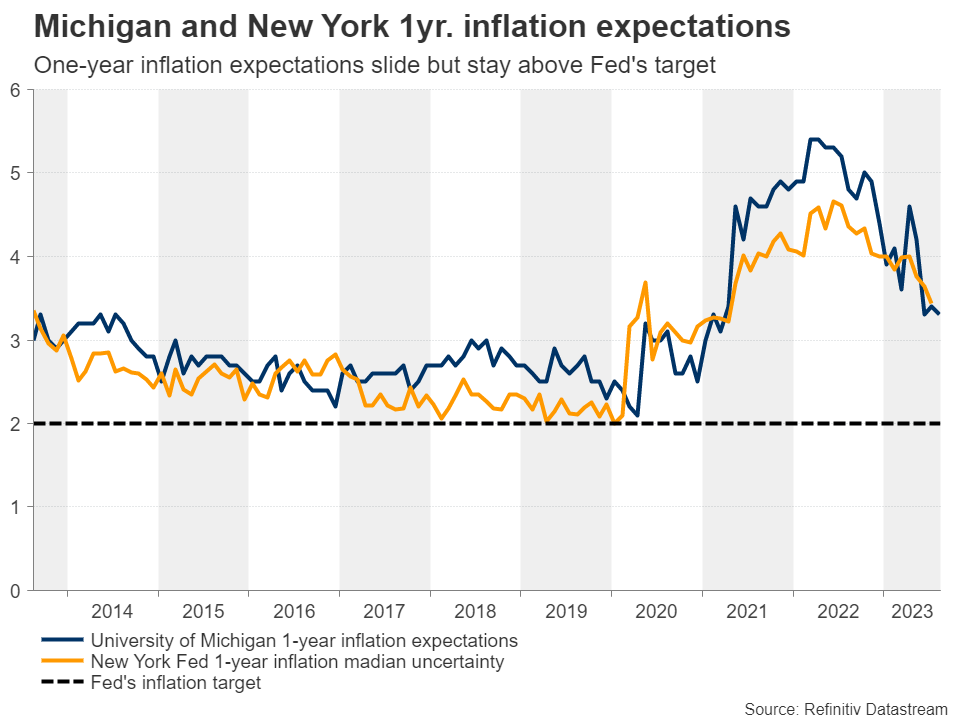
With data since then coming in better than expected and inflation expectations suggesting that inflation will still be above the Fed’s 2% objective even in 12 months, Powell may now tilt the scale towards another hike and/or highlight the need for interest rates to stay high for a longer period than the market currently anticipates. This could allow yields and the dollar to drift further north and thereby steal more of the gold’s shine. The opposite may be true if Powell appears less hawkish than expected.
Door to further declines remains wide open
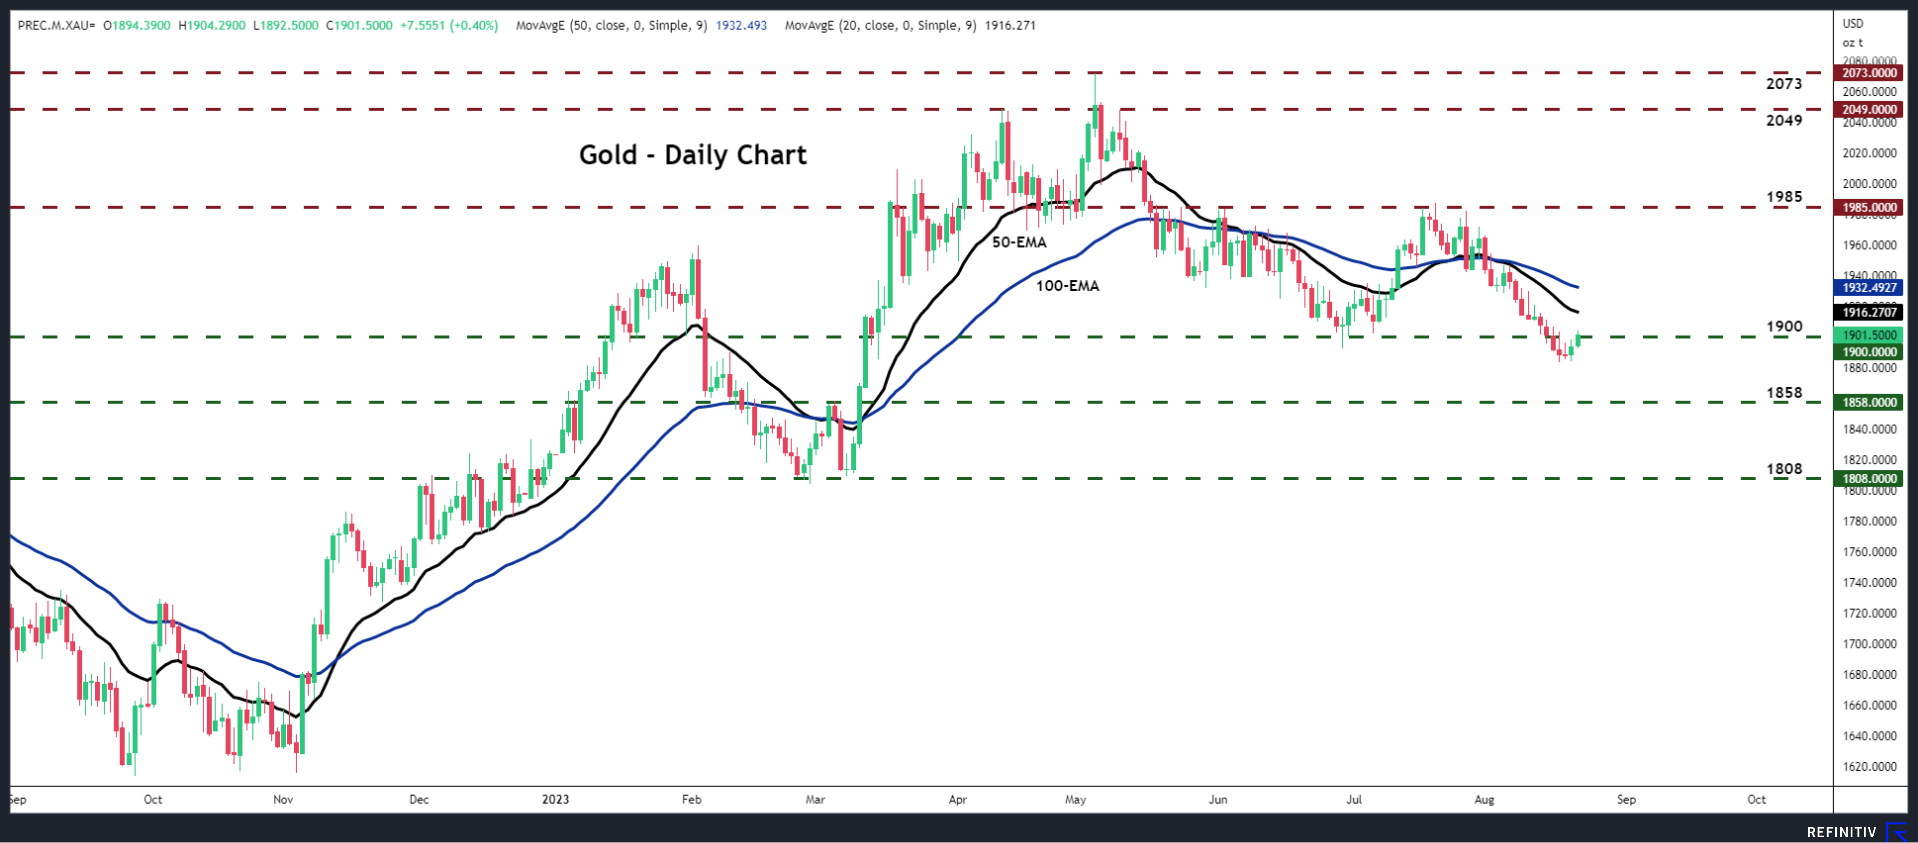
From a technical standpoint, gold fell below the 200-day exponential moving average (EMA) last Tuesday for the first time since November, while on Wednesday, it broke below the key territory of $1,900, confirming a lower low on the daily chart. Although it returned slightly above that barrier, the technical picture leaves the metal vulnerable to further declines, perhaps towards the inside swing high of March 6 at $1,858. For the outlook to brighten again, the bulls may need to drive the action all the way above the $1,985 zone.
NZ First Impressions: Retail Sales June Quarter 2023
Spending volumes are dropping sharply as rising prices squeeze households’ finances. Today’s result was well below both our forecast and market expectations.
Q2 real retail sales (volumes): -1.0% (Prev: -1.6%)
- Westpac f/c: -0.1%, Market -0.4%
Q2 nominal sales level: -0.2% (Prev: -0.9%)
Today’s retail spending report highlighted that financial pressures are continuing to eat away at households’ purchasing power, with the value of total spending also declining despite very strong population growth and a recovering tourism sector. Indeed, excluding the pandemic period, per capita spending fell to its lowest level in four years.
Nominal spending fell 0.2% in the June quarter. With a 5% increase in spending on motor vehicles broadly offset by a 7% decline in spending on fuel, spending in the more stable ‘core’ categories (which exclude vehicle-related purchases) fell by a similar 0.3%. This marks the first decline in core nominal spending since the September 2021 quarter, when spending was curtailed by the Delta Covid-19 outbreak.
The picture looks even weaker when taking into account changing prices, which at the core level increased 1.5% over the quarter. Core retail volumes declined 1.8% in the June quarter and now sit 5.1% lower than a year earlier. Discretionary spending has borne the brunt of the slowdown with volumes in the restaurant/bar and recreational goods sectors down more than 4%. Spending at hardware and garden stores and clothing and footwear stores fell almost 5%.
Looking ahead, with around $15bn of fixed mortgages repricing at higher interest rates each month, the pressure on households’ finances will continue to build. Together with ongoing increases in consumer prices – albeit hopefully moderating over time – and falling rural sector incomes, this will be a persistent drag on spending levels going forward. Unfortunately for households, as the Reserve Bank made clear last week, interest rates are likely to remain at or above current levels for some time yet, and certainly until inflation is much closer to returning to the midpoint of the 1-3% target range.
Implications for GDP growth
While we had anticipated a soft result, today’s figures are weaker than we had expected. Nonetheless, after two quarters of contraction, we continue to estimate that the economy rebounded somewhat in the June quarter, led by what is likely to be a short-lived lift in export volumes. Even so, annual growth in the economy is very likely to have continued to slow in the June quarter and will almost certainly slow further in the September quarter.
Gold Price Signals Bearish Breakdown, PMI’s Next
Key Highlights
- Gold price is moving lower below the $1,900 zone.
- A major bearish trend line is forming with resistance near $1,900 on the 4-hour chart.
- Crude oil prices corrected gains and traded below $82.00.
- The US Manufacturing PMI could rise from 49 to 49.3 in August 2023 (Preliminary).
Gold Price Technical Analysis
Gold price struggled to stay above $1,950 and started a fresh decline against the US Dollar. The price traded below the $1,932 support to move into a bearish zone.
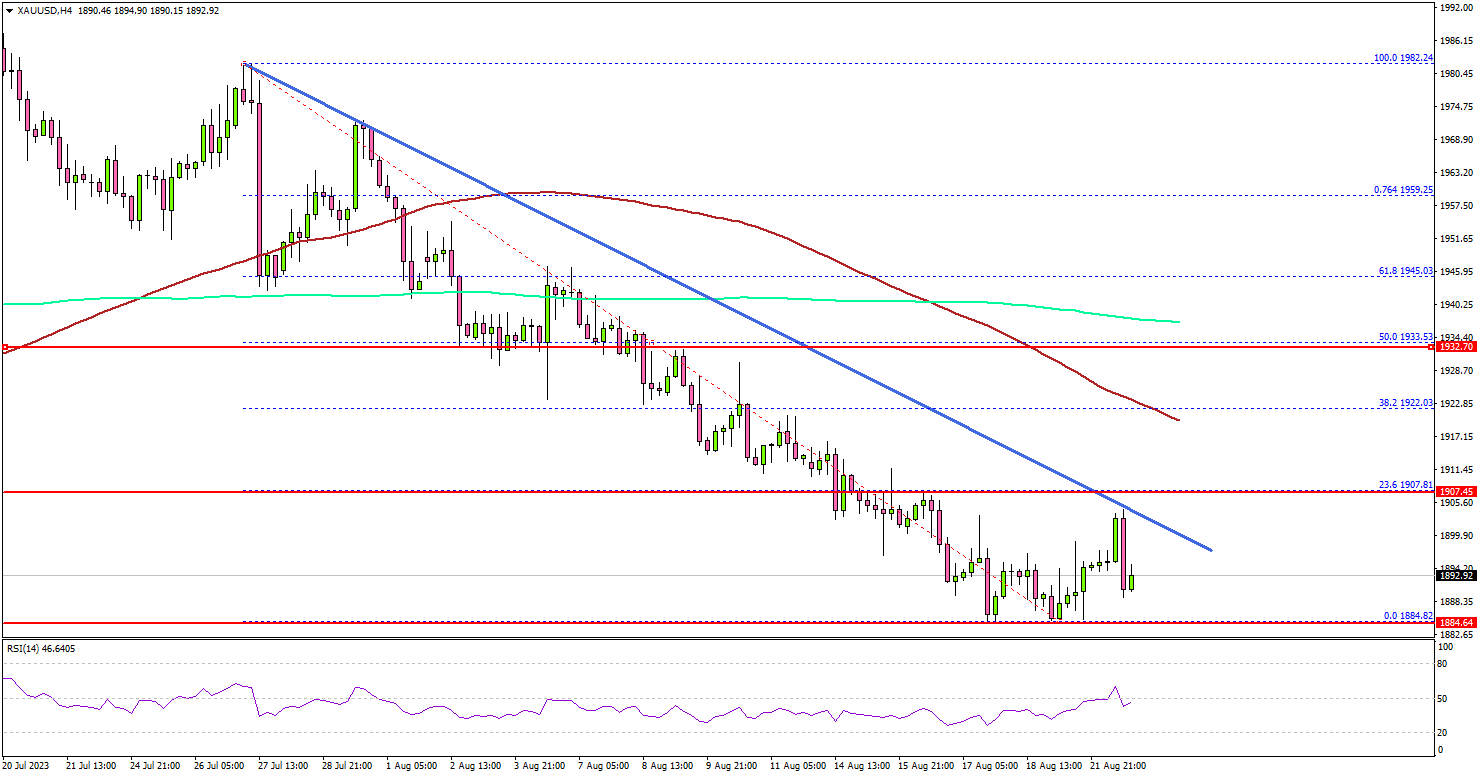
The 4-hour chart of XAU/USD indicates that the price settled below $1,920, the 100 Simple Moving Average (red, 4 hours), and the 200 Simple Moving Average (green, 4 hours).
The price even declined below the $1,900 level and tested the $1,885 zone. A low is formed near $1,884 and the price is now consolidating losses. Immediate resistance is near the $1,900 zone. There is also a major bearish trend line forming with resistance near $1,900 on the same chart.
The trend line is just below the 23.6% Fib retracement level of the downward move from the $1,982 swing high to the $1,884 low.
The next major resistance is near the $1,920 level or the 100 Simple Moving Average (red, 4 hours), above which the price could test the 50% Fib retracement level of the downward move from the $1,982 swing high to the $1,884 low.
Conversely, the price might decline further. Initial support is near the $1,884 level. The next major support is near $1,875.
If the bulls fail to protect the $1,875 support, there is a risk of a major decline. In the stated case, the price could decline toward the $1,860 level.
Looking at crude oil prices, there was a downside correction below the $82.00 support and there is a risk of more downsides.
Economic Releases to Watch Today
- Germany’s Manufacturing PMI for August 2023 (Preliminary) - Forecast 38.7, versus 38.8 previous.
- Germany’s Services PMI for August 2023 (Preliminary) - Forecast 51.5, versus 52.3 previous.
- Euro Zone Manufacturing PMI for August 2023 (Preliminary) – Forecast 42.6, versus 42.7 previous.
- Euro Zone Services PMI for August 2023 (Preliminary) – Forecast 50.5, versus 50.9 previous.
- UK Manufacturing PMI for August 2023 (Preliminary) – Forecast 45.0, versus 45.3 previous.
- UK Services PMI for August 2023 (Preliminary) – Forecast 50.8, versus 51.5 previous.
- US Manufacturing PMI for August 2023 (Preliminary) – Forecast 49.3, versus 49.0 previous.
- US Services PMI for August 2023 (Preliminary) – Forecast 52.2, versus 52.3 previous.
China’s Crisis of Confidence
China’s economy needs active intervention by policy makers. If timely and articulated well, growth can outperform.
China’s economy continues to make daily headlines for all the wrong reasons. Alternating between plunging exports, stagnant domestic demand, and the potential collapse of its shadow banking system, risks opined on in the press are wide ranging and acute. Authorities meanwhile have continued to focus on their structural reform agenda, remaining passive in their support, in stark contrast to prior cycles. Why do authorities remain sanguine as the market roils? Are they justified in doing so?
Exports to the west have built China’s industrial capacity over decades. So the near 15% plunge in goods exports over the year to July raised significant concerns, particularly amid talk of foreign companies relocating production from China. However, what has been missed by the market is that the recurring goods trade surplus is still roughly twice the average of 2018 and 2019. The geographic exposure of Chinese exports also continues to broaden, with fast-growing Asia taking up the slack created by weak US and European demand.
While the 12% decline in imports over the year to July sparked concern over investment, the fixed asset investment data instead points to capacity renewal and expansion across manufacturing. Though property fixed asset investment was down 8.5% year-to-date at July, investment in manufacturing was up 5.7% having averaged a similar pace between 2019 and 2022. Underlying this result, key high-tech sub-industries continue to grow investment between 10% and 40% year-to-date thanks to demand related to Asia’s economic development and the global green transition.
These outcomes are important to highlight because, while many intently focus on the parts of China’s old economy that are wilting under the weight of debt and structural reform, China’s aggregate capacity and productivity continue to grow. Growing earnings for industry mean debt deflation and/or a balance sheet recession need not lay in wait for China, as long as gains from trade flow to consumers.
This is the first of two critical issues which require careful assessment. Very little detail is provided on the state of China’s labour market, particularly now the youth unemployment rate has been suspended. What we can see clearly from the NBS PMI detail however is that, while employment growth in the manufacturing sector is just below average, for services it is significantly below.
This is a major concern because services demand is the way in which trade gains filter through to the broader economy, building up household income and providing many University graduates an avenue to build fulfilling careers. But, in a developing economy, when momentum in manufacturing and investment does not flow to services, development is hamstrung. In such an environment, aggressive precautionary saving is an entirely rational response amongst consumers, as is avoiding risk taking with respect to career and investments.
The second critical concern for China is the structural state of China’s housing market and financial system which is amplifying the effect of labour market weakness. While new home prices are managed by authorities, existing home prices are not and currently show a much greater degree of weakness.
Simply put, if you are experiencing a decline in your wealth and are uncertain how long it will continue for, you are unlikely to spend freely on discretionary items. Households desiring a property also refrain from committing to a purchase in circumstances like these.
As we’ve seen over the past year, this is not only an issue for current momentum but also the economy’s structural health. Many private developers now find themselves with liquidity and reputational deficiencies, and some solvency concerns. Numerous local governments also lack the capacity to invest while land sales to property developers remain scarce. These developments are also mounting pressure on non-bank lenders whose investment products make up a material portion of middle-to-high income households’ financial wealth.
With financial risk having spread from private developers to local governments; non-bank lenders; and back to households, there is clearly an immediate need for authorities to act decisively to avoid all the good work by exports and investment being offset.
What form should this action take? To benefit both employment and confidence, demand for new property and household consumption needs to be encouraged via easier financing terms and a further push by local governments in utilities and other infrastructure spending.
At the same time, trust must be restored in the financial system. This will take liquidity provision to bank and non-bank lenders; the reorganization of local government debt wherever it is inhibiting essential services and investment; and liberal support from the banking sector for both state-owned and private developers to allow them to attract new commitments. This seems an immense and complex agenda; but with many components already in place and others used regularly in the past, once there is the will to engage actively with the economy, quick implementation will follow.
To be clear, success will allow Chinese growth to sustain a circa 5% pace for a few more years before easing slowly to around 4% near the decade’s end. Failing to act risks growth instead jolting down to 4% or below in 2024 and 2025, with demographics and debt weighing further from there. The lower growth path would likely prevent authorities’ medium-term prosperity goals being reached and, with youth unemployment as high as it is, also risks political instability in coming years. Clearly then, there is now a political as well as economic imperative for China’s central Government to act swiftly. The next few months will determine which path China takes.
EURJPY Wave Analysis
- EURJPY reversed from resistance level 159.50
- Likely to fall to support level 157.40
EURJPY currency pair recently reversed down from the resistance level 159.50 (top of the previous minor impulse wave i), coinciding with the upper daily Bollinger Band.
The downward reversal from the resistance level 159.50 is likely to form the daily Japanese candlesticks reversal pattern Dark Cloud Cover.
Given the overbought daily Stochastic, EURJPY currency pair can be expected to fall further toward the next support level 157.40 (former resistance from July).

Silver Wave Analysis
- Silver reversed from support level 159.50
- Likely to rise to resistance level 24.50
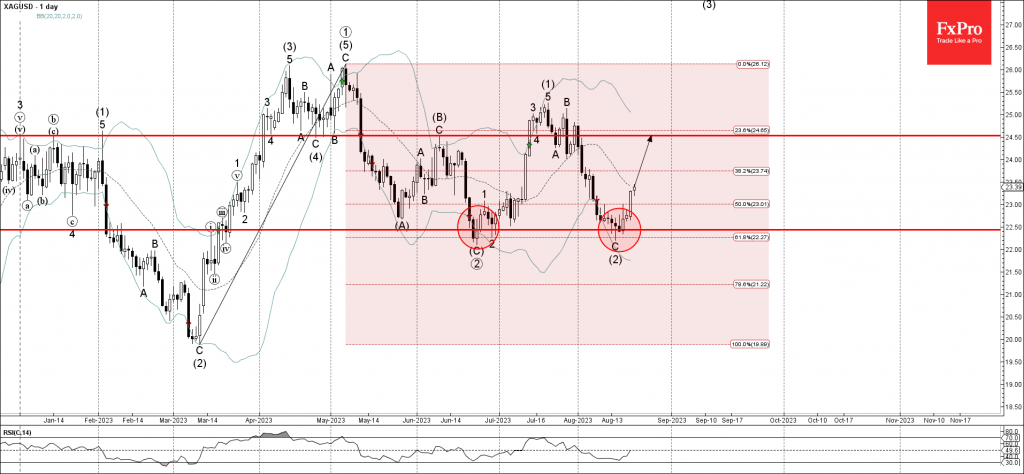
Silver recently reversed up from the pivotal support level 159.50 (which previously reversed the pair twice in June), coinciding with the lower daily Bollinger Band and the 61.8% Fibonacci correction of the upward impulse from March.
The upward reversal from the support level 159.50 started the active intermediate impulse wave (3).
Silver can be expected to rise further toward the next resistance level 24.50 (which has been reversing the price from June).
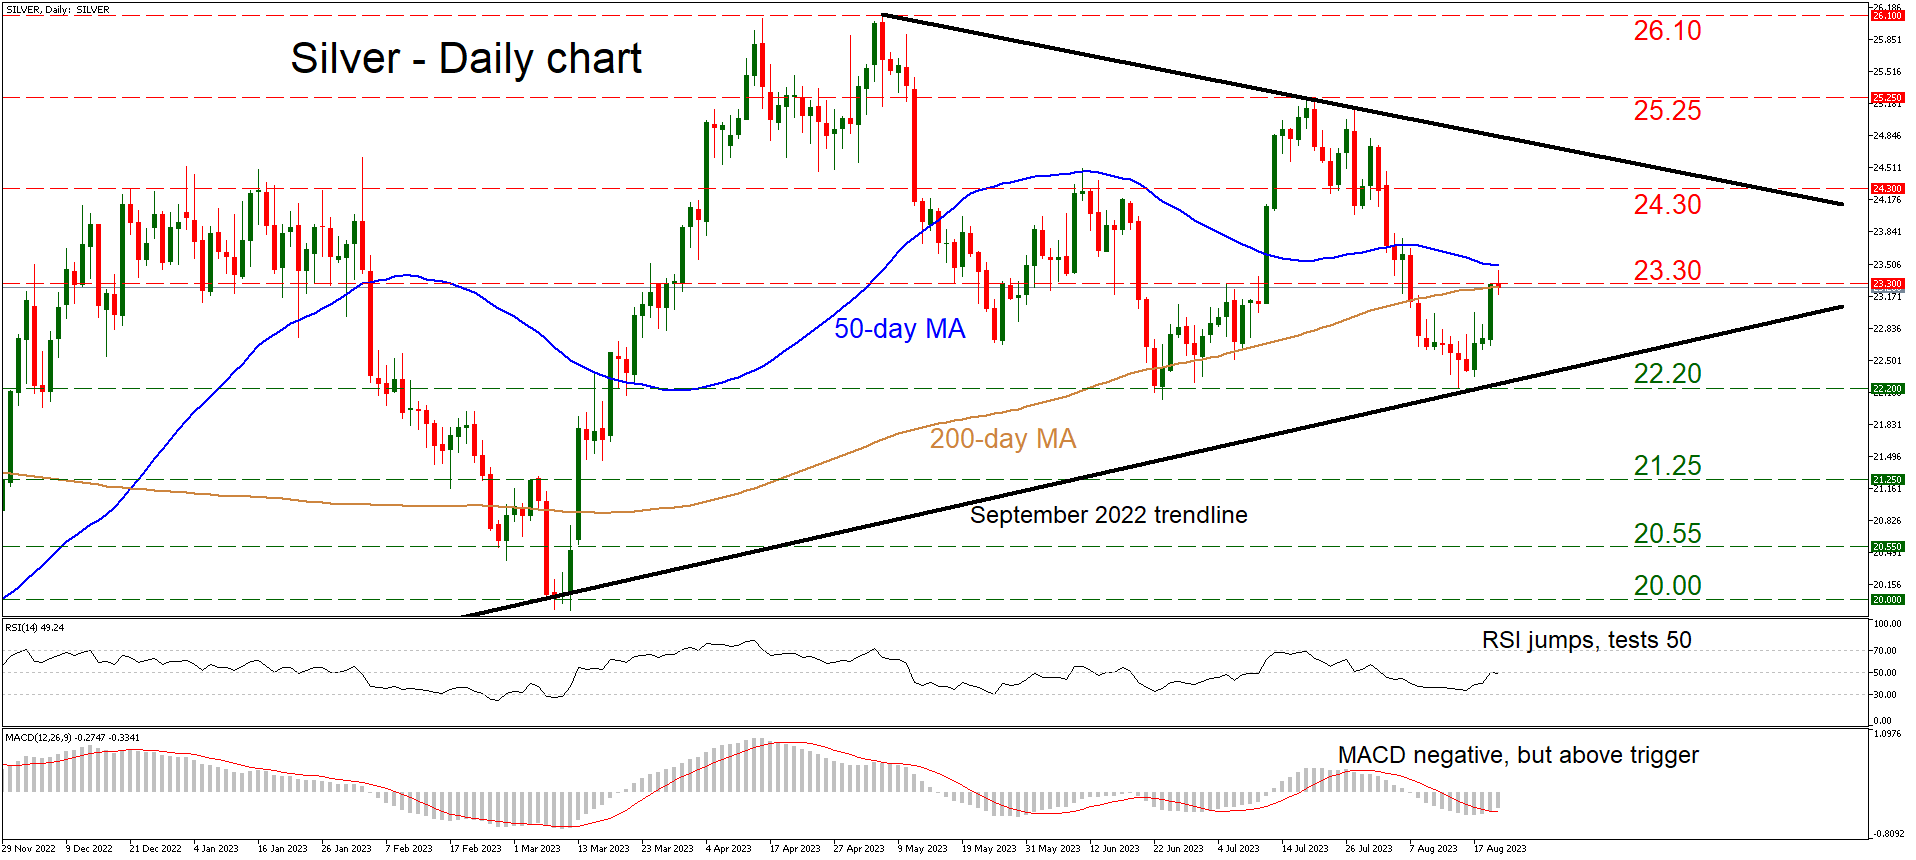
Silver Trapped Inside a Triangle Pattern
Silver prices are trading above a long-term uptrend line taken from the lows of September, but below a downtrend line drawn from the peaks in May. The combination suggests silver is locked inside a symmetrical triangle pattern, a break of which will likely reveal the next major directional wave.
Momentum oscillators paint a relatively neutral picture. The RSI is testing its 50 level, and although the MACD is negative, it has crossed above its red trigger line. Neither indicator is flashing any clear signals about what’s next in the market.
Buyers seized control this week and pushed prices higher towards the 23.30 region, which encompasses the 200-day moving average (MA). The 50-day MA is just above at 23.50 and could be considered part of the same region. If the bulls finally manage to slice above this congested area, the next target might be the 24.30 zone, which capped several advances back in January.
Now, in case sellers retake the wheel, the first major obstacle on the downside would be the 22.20 barrier. A decisive break below it would violate the long-term uptrend line and therefore shatter the triangle, turning the technical picture negative and opening the door for further declines towards the 21.25 area.
In a nutshell, silver seems neutral at this stage. A break at either side of the triangle is needed to signal the next significant directional move.