Sample Category Title
USD/CAD Daily Outlook
Daily Pivots: (S1) 1.3521; (P) 1.3543; (R1) 1.3573; More....
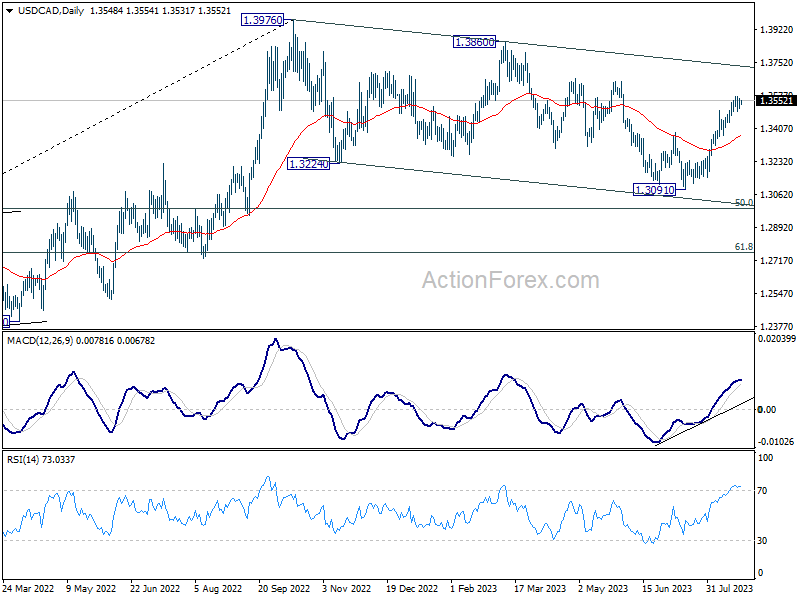
Intraday bias in USD/CAD stays neutral as consolidation from 1.3574 is extending. Downside of retreat should be contained by 0.3371 to bring another rally. Break of 1.3574 will target 1.3653 resistance first. Decisive break there will confirm that correction from 1.3976 has completed, a target a test on this high.
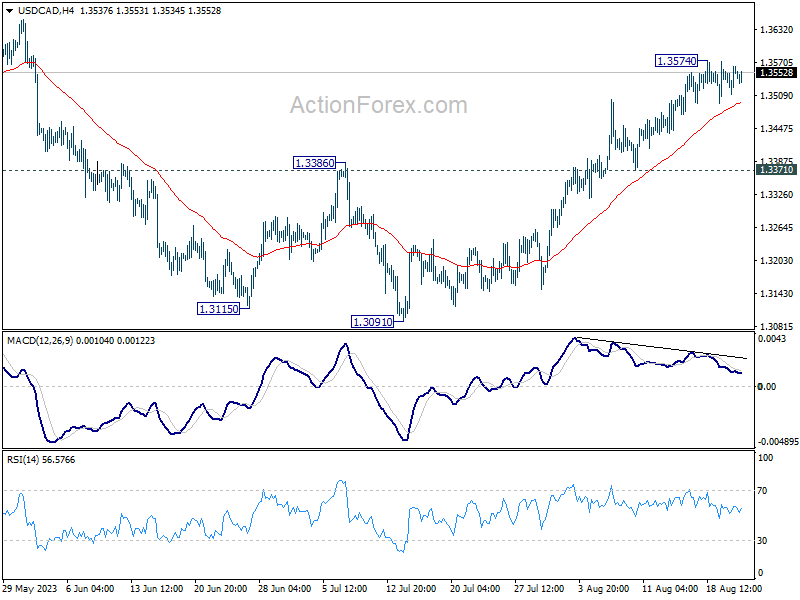
In the bigger picture, price actions from 1.3976 are viewed as a corrective fall only. Upon completion, rise from 1.2005 (2021 low) would resume through 1.3976. Next target is 61.8% projection of 1.2005 to 1.3976 from 1.3091 at 1.4309. In case of another fall, downside should be contained by 61.8% retracement of 1.2005 to 1.3976 at 1.2758.
AUD/USD Daily Report
Daily Pivots: (S1) 0.6399; (P) 0.6428; (R1) 0.6453; More...
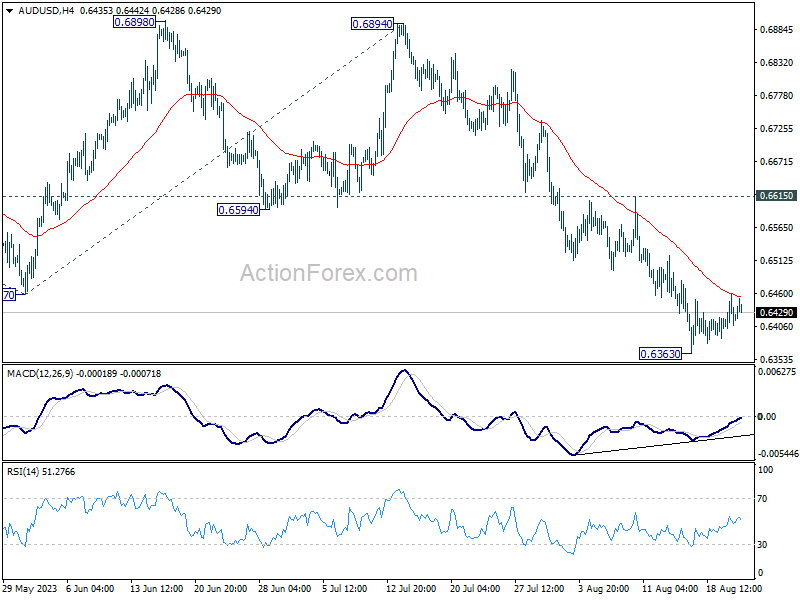
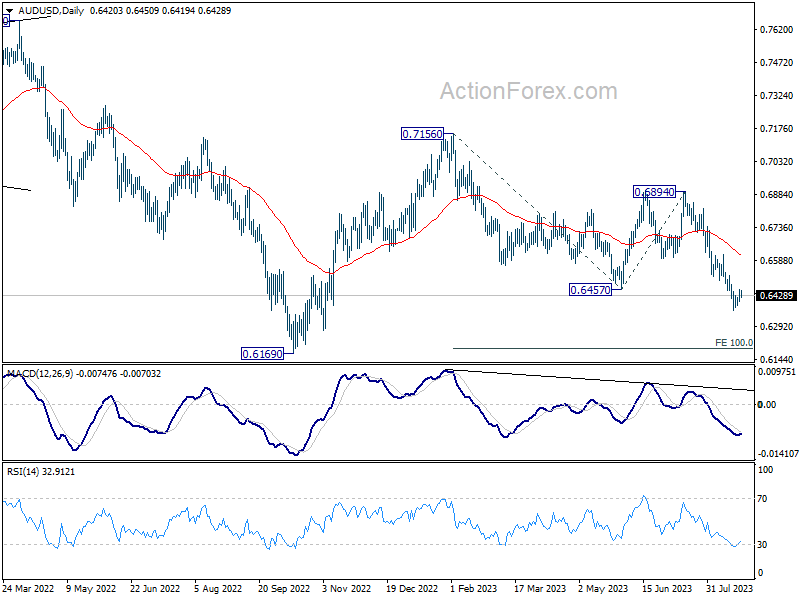
Intraday bias in AUD/USD remains neutral and consolidation from 0.6363 could extend further. While stronger recovery cannot be ruled out, upside should be limited by 0.6615 resistance. Break of 0.6363 will resume larger fall from 0.7156 to 100% projection of 0.7156 to 0.6457 from 0.6894 at 0.6195.
In the bigger picture, current development argues that the down trend from 0.8006 (2021 high) is still in progress. Decisive break of 0.6169 will target 61.8% projection of 0.8006 to 0.6169 to 0.7156 at 0.6021. This will now remain the favored case as long as 0.6894, in case of strong rebound.
USD/JPY Daily Outlook
Daily Pivots: (S1) 145.46; (P) 145.93; (R1) 146.36; More...
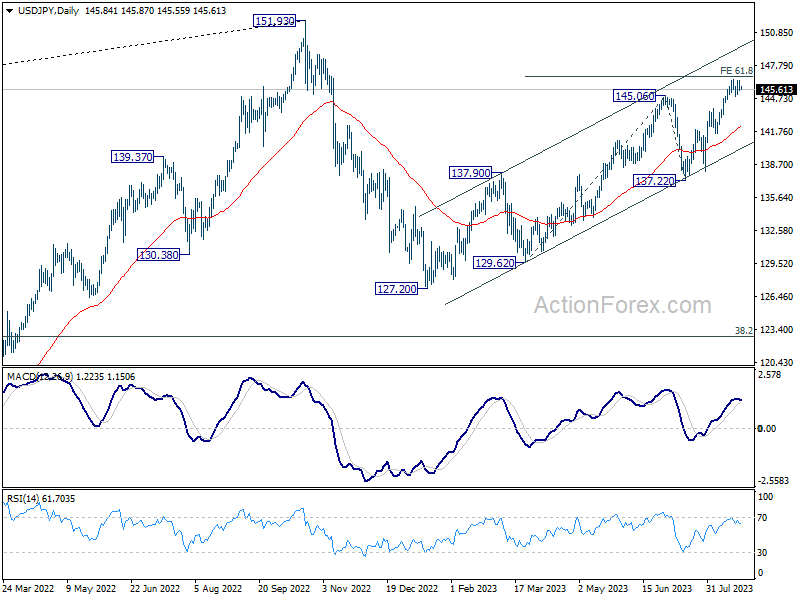
Range trading continues in USD/JPY and intraday bias bias stays neutral. On the upside, sustained break of 61.8% projection of 129.62 to 145.06 from 137.22 at 146.76 will pave the way to retest 151.93 high. However, considering bearish divergence condition in 4H MACD, firm break of 44.92 support will be a sign of reversal, and turn bias back to the downside for 55 D EMA (now at 142.09).
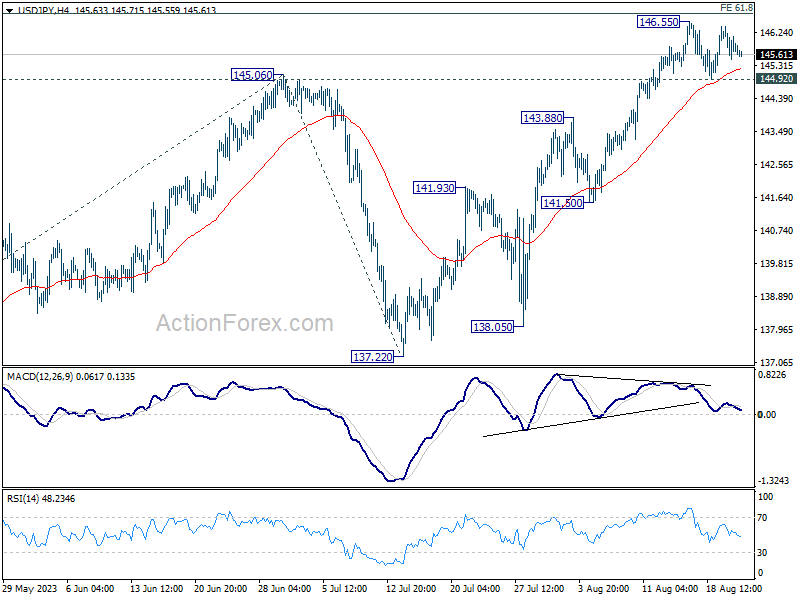
In the bigger picture, overall price actions from 151.93 (2022 high) are views as a corrective pattern. Rise from 127.20 is seen as the second leg of the pattern and could still be in progress. But even in case of extended rise, strong resistance should be seen from 151.93 to limit upside. Meanwhile, break of 137.22 support should confirm the start of the third leg to 127.20 (2023 low) and below.
USD/CHF Daily Outlook
Daily Pivots: (S1) 0.8777; (P) 0.8794; (R1) 0.8821; More....
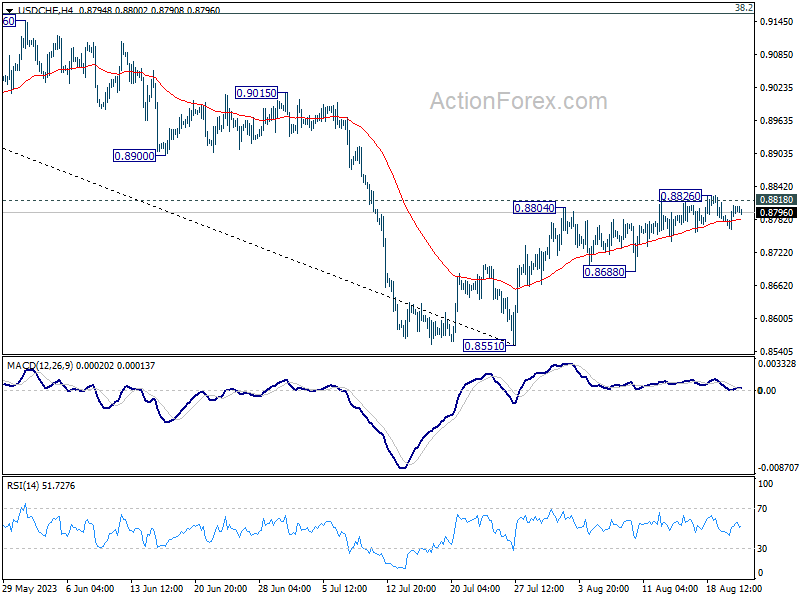
Range trading continues in USD/CHF and intraday bias remains neutral. On the upside, decisive break of 0.8818 will carry larger bullish implication, and target 0.9146 cluster resistance next. However, break of 0.8688 support will indicate rejection by 0.8818, and turn bias back to the downside for retesting 0.8551 low.
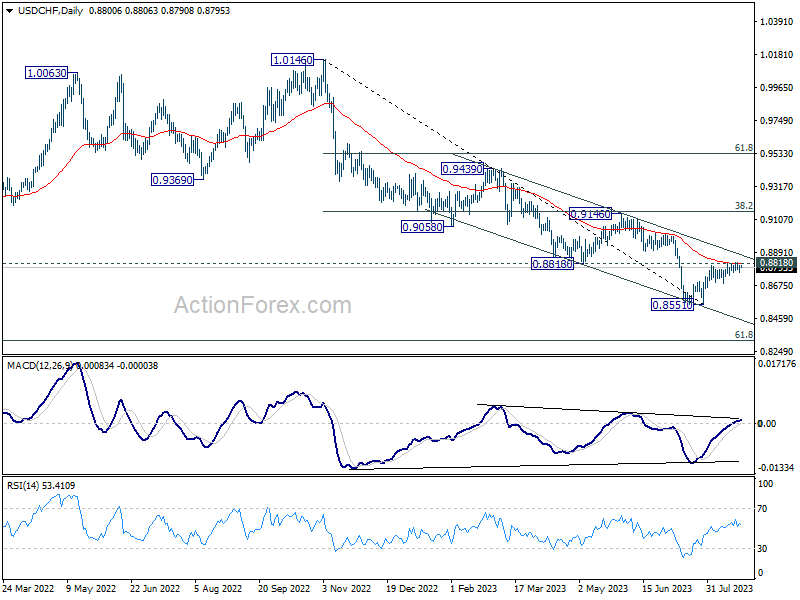
In the bigger picture, a medium term bottom could be in place at 0.8551 already, on bullish convergence condition in D MACD. Sustained trading above 0.8818 support turned resistance will bring further rise to 0.9146 cluster resistance (38.2% retracement of 1.0146 to 0.8551 at 0.9160), even as a correction. Nevertheless, break of 0.8851 will resume the down trend from 1.0146 instead.
GBP/USD Daily Outlook
Daily Pivots: (S1) 1.2701; (P) 1.2750; (R1) 1.2782; More...
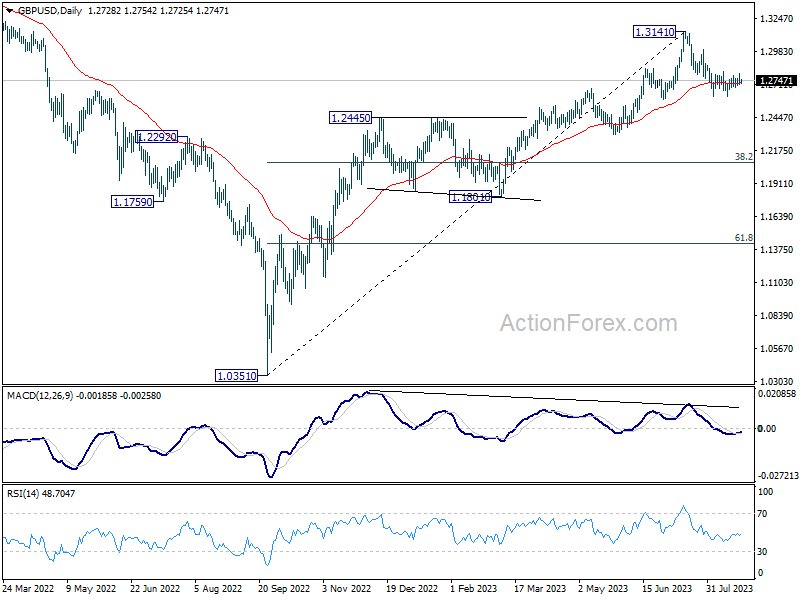
GBP/USD is still bounded in established range and intraday bias stays neutral for the moment. On the downside, firm break of 1.2615, and sustained trading below 1.2678 resistance turned support will argue that it's already in a larger correction. Deeper decline would then be seen to 1.2306 support next. Nevertheless, break of 1.2817 minor resistance will indicate that the pull back from 1.3141 has completed, and turn bias back to the upside for stronger rebound.
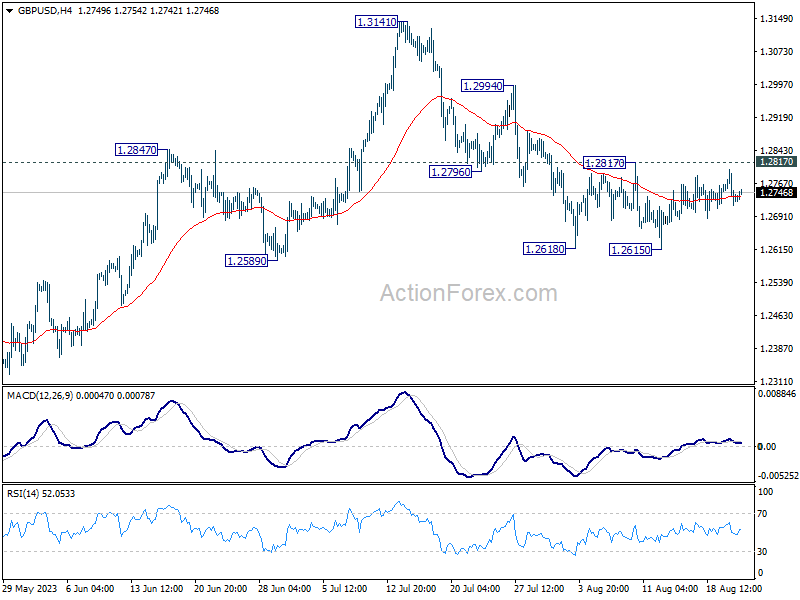
In the bigger picture, a medium term top could be in place at 1.3141 already, on bearish divergence condition in D MACD. Sustained trading below 55 D EMA (now at 1.2723) should confirm this case, and bring deeper fall to 38.2% retracement of 1.0351 to 1.3141 at 1.2075, as a correction to up trend from 1.0351 (2022 low). For now, rise will stay mildly on the downside as long as 1.3141 resistance holds, in case of strong rebound.
EUR/USD Daily Outlook
Daily Pivots: (S1) 1.0809; (P) 1.0870; (R1) 1.0907; More...
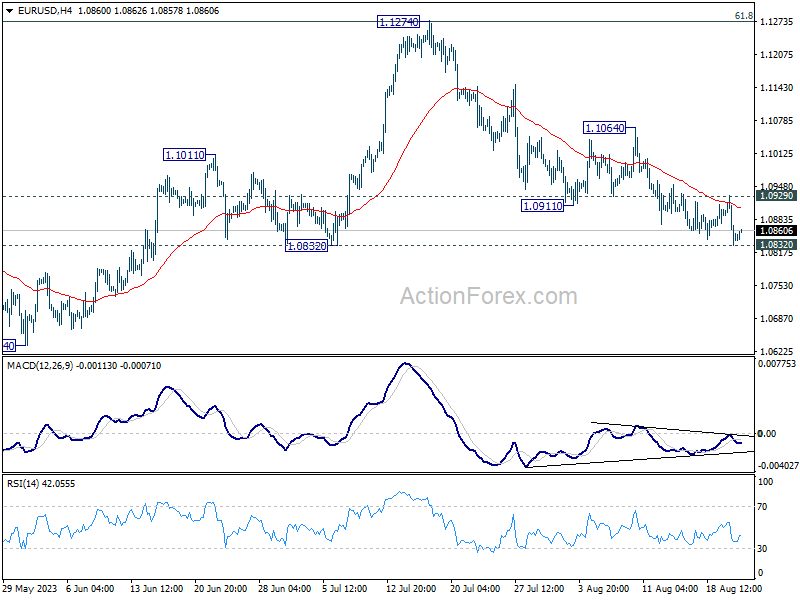
Immediate focus is now on 1.0832 support in EUR/USD. Firm break there will resume whole fall from 1.1274, and target target 1.0609/34 cluster support next. On the upside, however, break of 1.0929 resistance will turn intraday bias to the upside for stronger recovery.
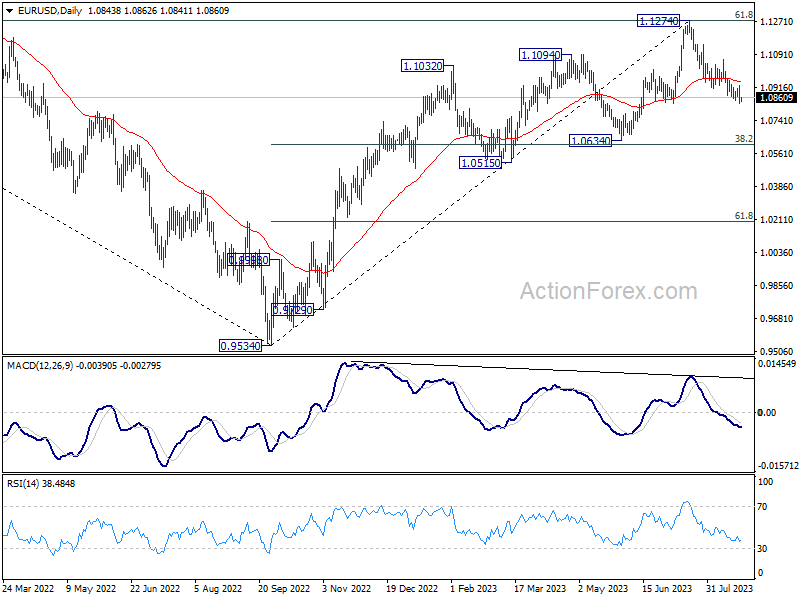
In the bigger picture, a medium term top should be formed at 1.1274, after failing to break through 61.8% retracement of 1.2348 (2021 high) to 0.9534 at 1.1273 decisively, on bearish divergence condition in D MACD. Fall from there is seen as a correction to the uptrend from 0.9534 (2022 low). Deeper decline would be seen to 1.0634 cluster support (38.2% retracement of 0.9534 to 1.1274 at 1.0609). Strong support could be seen there, at least on first attempt, to set the range for consolidation. Yet, medium term outlook will be neutral for now, as long as 1.1274 resistance holds.
Euro Under Pressure Ahead of PMIs from EZ, UK and US
Euro faces headwinds this week, emerging as one of the more subdued performers, with all eyes set on today's Eurozone PMI data. Its trajectory, when compared to Yen and Aussie, remains uncertain, as both showed minimal response to their respective PMI releases. Conversely, Dollar's movement, in anticipation of the PMI release, is expected to be constrained, with the market's primary focus shifting to Fed Chair Jerome Powell's upcoming speech at the Jackson Hole Symposium. Meanwhile, Canadian Dollar might witness some stirring due to release of its retail sales data.
For the ongoing week, Yen sits at the bottom of the performance chart, trailed by Euro and then Dollar. Conversely, Australian Dollar is leading the pack, with the New Zealand Dollar and Swiss Franc closely following. Both Sterling and Canadian Dollar hold neutral positions. Remarkably, except for EUR/GBP, majority of major pairs and crosses are treading within the previous week's range.
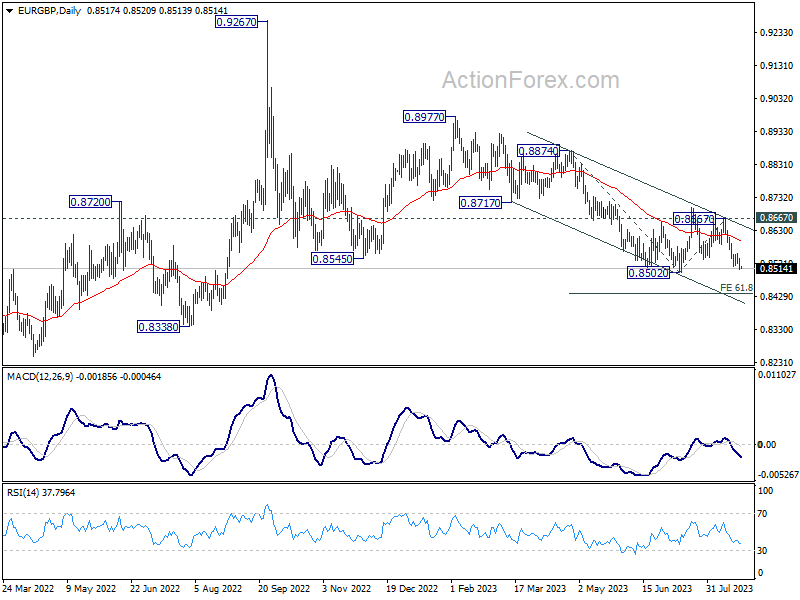
Zooming in on EUR/GBP, release of UK PMIs is anticipated to induce some movement. Immediate focus is now on 0.8502 support in the cross. Decisive break there will resume larger decline from 0.8977. Next target is 61.8% projection of 0.8874 to 0.8502 from 0.8667 at 0.8437. Downside breakout in EUR/GBP, especially with a simultaneous break of 0.9520 support in EUR/CHF, might intensify Euro's descent across the board.
In Asia, at the time of writing, Nikkei is up 0.34%. Hong Kong HSI is up 0.91%. China Shanghai SSE is down -0.62%. Singapore Strait Times is up 0.36%. Japan 10-year JGB yield is up 0.007 at 0.679. Overnight, DOW dropped -0.51%. S&P 500 dropped -0.28%. NASDAQ rose 0.06%. 10-year yield dropped -0.014 to 4.328.
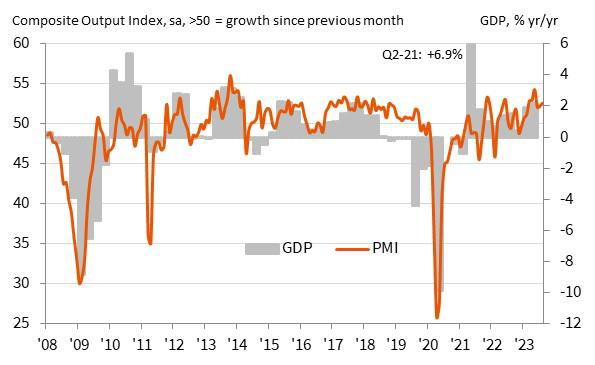
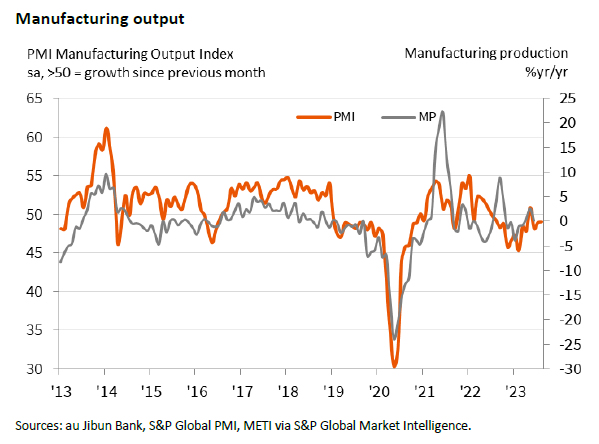
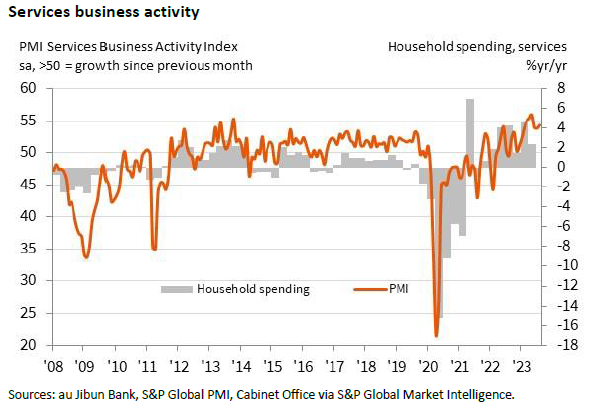
Japan PMI manufacturing ticked up to 49.7, services rose to 54.3
In August, Japan's Service PMI climbed from 53.8 to 54.3, while the Manufacturing PMI saw a slight increase from 49.6 to 49.7, just above anticipated figures. The Composite PMI also edged up from 52.2 to 52.6.
Andrew Harker, from S&P Global Market Intelligence, pointed out the robust performance of the service sector, driven by consistent new order growth. In contrast, manufacturing only marginally rebounded but remained below the growth threshold.
Despite the overall rise in new orders, manufacturing employment remained flat, ending its 28-month growth streak. Additionally, heightened oil prices impacted both sectors, causing the steepest rise in input costs in four months. Notably, business confidence dwindled in both domains due to longer-term economic uncertainties.
Australian PMI hits 19-month low, but concerns on inflation and strong employment rise
Australia's August PMI data showed a concerning decline across sectors. The Manufacturing PMI slightly decreased from 49.6 to 49.4, while Services PMI dropped to a 19-month low of 46.7. Composite PMI, reflecting both sectors, also declined to a 19-month low of 47.1.
Warren Hogan, Chief Economic Advisor at Judo Bank, drew attention to the employment sector's resilience. He noted, "Despite weakening PMI figures, the employment index remains positive, indicating robust labour demand across both manufacturing and services."
With businesses maintaining optimism, they might resist workforce reductions even amidst economic slowdowns. "As aggregate demand is supported by ongoing employment growth... it might mean a further substantial lift in interest rates could be required at some stage in the next 6-12 months," he added.
Inflation remains a key concern. After 2022 disinflation trend, 2023 has shown a halt in the falling price indexes. The current data suggests an inflation rate of about 4%, overshooting the RBA's 2-3% target range.
Hogan also noted wage growth concerns. Even with modest official growth figures, he cautioned that wage pressures might exceed RBA's forecasted 4% annual growth for 2023. "This may mean firm tightening bias to the RBA's policy deliberations for the rest of the year."
NZ retail sales volume down -1.0% qoq in Q2, value down -0.2% qoq
New Zealand's retail sales volume for Q2 plummeted by -1.0% qoq, settling at NZD 25B. This decline starkly contrasts with market forecasts which had anticipated a milder contraction of just -0.2% qoq. A broad-based slump was evident, as 11 out of 15 industries reported reduced seasonally adjusted sales volumes.
Highlighting the sectors that bore the brunt of this downturn, food and beverage services saw a sharp decline of -4.4%. Hardware, building, and garden supplies trailed closely, recording a -4.8% drop. These sectors emerged as the primary drags on the overall sales volume for the quarter.
While sales volume took a hit, retail sales value also showed signs of weakness, contracting -0.2% qoq to land at NZD 30B. Once again showcasing the breadth of the downturn, seven out of 15 industries registered a fall.
Looking ahead
Eurozone and UK PMIs will be the main focus in European session. Later in the day, Canada will release retail sales. US will release PMIs and new home sales.
EUR/USD Daily Outlook
Daily Pivots: (S1) 1.0809; (P) 1.0870; (R1) 1.0907; More...
Immediate focus is now on 1.0832 support in EUR/USD. Firm break there will resume whole fall from 1.1274, and target target 1.0609/34 cluster support next. On the upside, however, break of 1.0929 resistance will turn intraday bias to the upside for stronger recovery.
In the bigger picture, a medium term top should be formed at 1.1274, after failing to break through 61.8% retracement of 1.2348 (2021 high) to 0.9534 at 1.1273 decisively, on bearish divergence condition in D MACD. Fall from there is seen as a correction to the uptrend from 0.9534 (2022 low). Deeper decline would be seen to 1.0634 cluster support (38.2% retracement of 0.9534 to 1.1274 at 1.0609). Strong support could be seen there, at least on first attempt, to set the range for consolidation. Yet, medium term outlook will be neutral for now, as long as 1.1274 resistance holds.
Economic Indicators Update
| GMT | Ccy | Events | Actual | Forecast | Previous | Revised |
|---|---|---|---|---|---|---|
| 22:45 | NZD | Retail Sales Q/Q Q2 | -1.00% | -0.20% | -1.40% | -1.60% |
| 22:45 | NZD | Retail Sales ex Autos Q/Q Q2 | -1.80% | -0.10% | -1.10% | -1.60% |
| 23:00 | AUD | Manufacturing PMI Aug P | 49.4 | 49.6 | ||
| 23:00 | AUD | Services PMI Aug P | 46.7 | 47.9 | ||
| 00:30 | JPY | Manufacturing PMI Aug P | 49.7 | 49.6 | 49.6 | |
| 07:15 | EUR | France Manufacturing PMI Aug P | 45.2 | 45.1 | ||
| 07:15 | EUR | France Services PMI Aug P | 47.3 | 47.1 | ||
| 07:30 | EUR | Germany Manufacturing PMI Aug P | 38.7 | 38.8 | ||
| 07:30 | EUR | Germany Services PMI Aug P | 51.5 | 52.3 | ||
| 08:00 | EUR | Eurozone Manufacturing PMI Aug P | 42.8 | 42.7 | ||
| 08:00 | EUR | Eurozone Services PMI Aug P | 50.5 | 50.9 | ||
| 08:30 | GBP | Manufacturing PMI Aug P | 45.1 | 45.3 | ||
| 08:30 | GBP | Services PMI Aug P | 50.8 | 51.5 | ||
| 12:30 | CAD | Retail Sales M/M Jun | 0.00% | 0.20% | ||
| 12:30 | CAD | Retail Sales ex Autos M/M Jun | 0.30% | 0.00% | ||
| 13:45 | USD | Manufacturing PMI Aug P | 48.9 | 49 | ||
| 13:45 | USD | Services PMI Aug P | 52.4 | 52.3 | ||
| 14:00 | USD | New Home Sales Jul | 708K | 697K | ||
| 14:00 | EUR | Eurozone Consumer Confidence Aug P | -14 | -15 | ||
| 14:30 | USD | Crude Oil Inventories | -2.9M | -6.0M |
US Banks Fall on Fresh Rating Downgrades, Nvidia Earnings in Focus
The market mood turned sour again, and the S&P500 fell after a short relief. S&P’s bank rating downgrades – which came a few days after Moody’s downgraded some US small and mid-sized banks and Fitch downgraded the US’ rating, came as a reminder that the rising rates won’t be benign for banks as depositors move their funds into higher interest-bearing accounts, increasing banks’ funding costs. The decline in bank deposits squeezes liquidity, while the value of securities that they hold in their portfolios decline. Plus, regional banks continue to face the risk of a sharp decline in commercial real estate loans. As a result, the S&P500 fell 0.28% on Tuesday, Invesco’s KBW bank ETF dived more than 2.50%.
Elsewhere, the rising rates and declining purchasing power finally start showing in some retailers’ quarterly announcements. Macy’s for example sank 14% yesterday on rising credit card delinquencies and Dick’s Sporting Goods slumped more than 24% on ‘elevated inventory shrink – in particular theft. Both companies gave a morose outlook for consumer demand moving forward. Could that be a sign of potentially slower consumer spending in the next few months? We will see that. For now, the latest US data remains strong, the Fed expectations are hawkish, no one sees Jerome Powell back off with the Fed’s tightening policy, and the US yields are rising. The US 2-year yield pushes higher above the 5% mark, while the 10-year yield struggles near 4.30%, where it sees decent resistance. In one hand, there is a strong demand for US 10-year papers at these levels as many asset managers consider that the levels are good entre points. On the other hand, the hawkish Fed expectations, prospects of – maybe – higher rates, which will be held for a prolonged period of time continue pressuring the yields higher along with the US Treasury’s plan to issue more bonds in H2 – as they issued too many T-bills so far to fund their deficit.
And there is one more thing weighing on US treasuries and that’s China. Yes, the sluggish Chinese growth is tempering energy and commodity prices and doesn’t add to inflationary pressures. But Beijing adds on the US Treasury selloff as it fights against a softer yuan. The People’s Bank of China (PBoC) set its daily yuan fixing surprisingly higher than expected this week in a move that Bloomberg described as the most forceful on record.
When the USD/CNY rallies due to higher US and lower Chinese yields, the Chinese sell their US denominated assets to defend yuan. And doing so, they contribute to the further strengthening of the US yields, and the US dollar is pressured higher on the back of stronger yields. Then, the cycle starts all over again. A stronger Dollar and weaker yuan forces the PBoC to sell USD assets. The UST selloff pushes US yields higher and strengthens the dollar and the yields.
In the FX
The dollar index remains bid above its 200-DMA – though we see a slowing positive trend, and weakening trend and momentum indicators. While I believe that there is room for further USD recovery, we could well see a temporary downside correction in the next few days, depending on what Powell will say, and how the markets will react. The EURUSD is still on a decidedly bearish path. Trend and momentum indicators remain comfortably bearish, and the pair is not yet at the oversold market conditions; the actual selloff could extend toward the 200-DMA, near the 1.08 mark. The USDJPY is steady a touch above the 145 mark, as the possibility of a direct FX intervention holds many traders back from topping up their short yen positions. Cable on the other hand sees resistance at its 50-DMA, a touch below the 1.28 mark.
In energy, the US crude remains close to the $80pb psychological mark, lacking a clear short-term direction. Therefore, this week’s US inventories report could help traders decide whether they want to play the slow China demand rhetoric or continue backing the supply tightness narrative. In both cases, we shall see range-bound trading within the $75/85 range, including the 200-DMA and the August peak.
Nvidia goes to the earnings confessional
Today, all eyes are on Nvidia earnings due after the closing bell. Investors will focus on whether Nvidia’s Q2 sales meet the $11bn estimate. Anything less than absolutely fantastic could trigger a sharp downside correction in Nvidia’s stock price which rallied 345% since the October dip.
Technical Outlook and Review
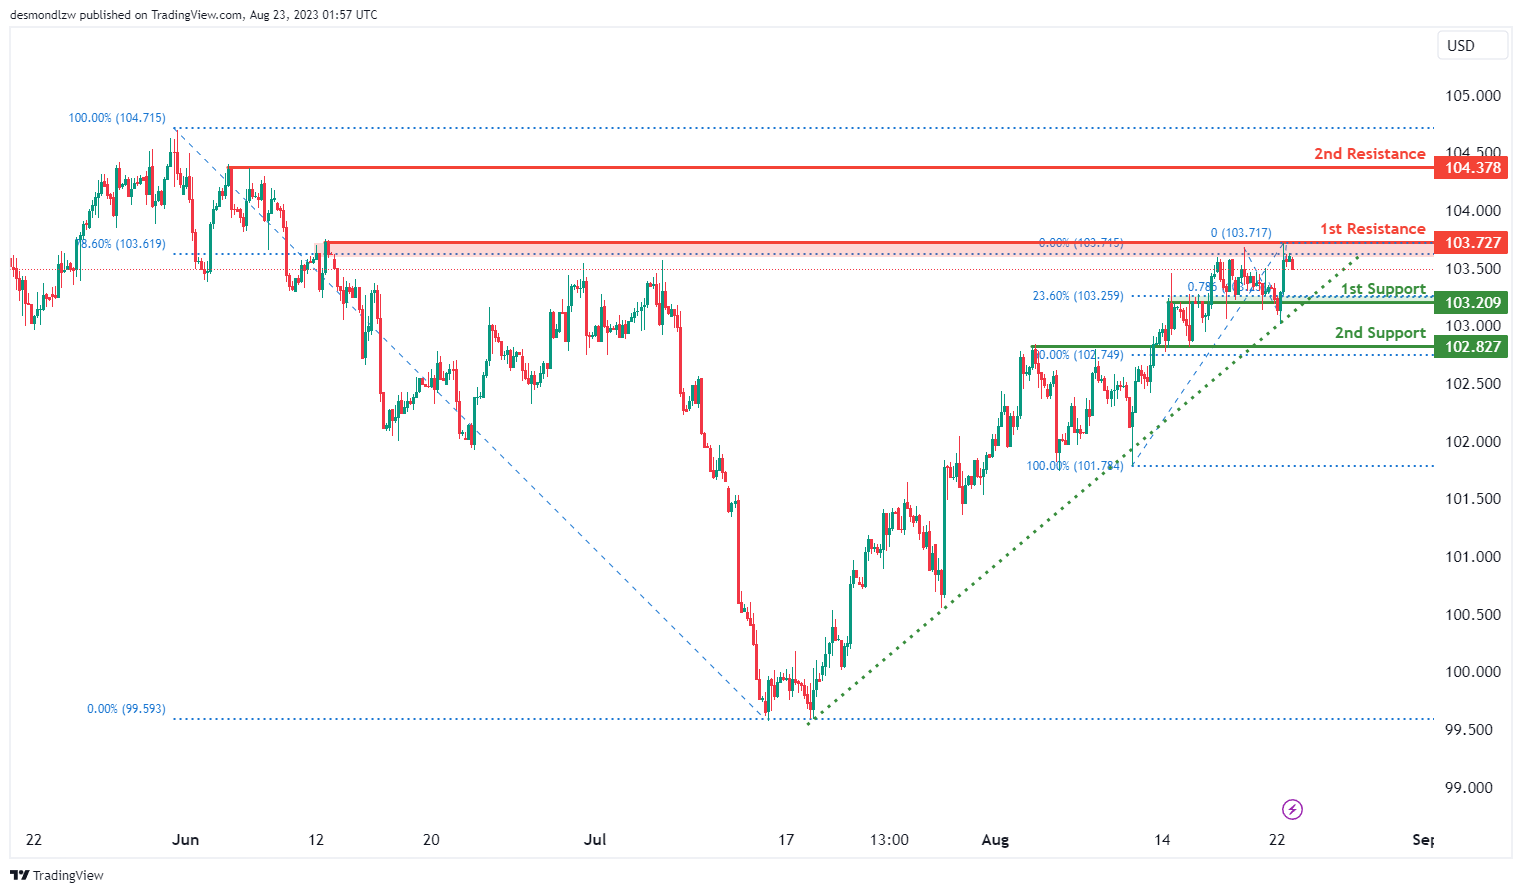
DXY:
The DXY chart currently displays a bullish momentum, supported by the price being above a major ascending trend line, suggesting the potential for further upward movement.
In this context, a short-term scenario could unfold where the price drops towards the 1st support level at 103.20 before rebounding from there and rising towards the 1st resistance at 103.72.
The 1st support at 103.20 holds significance as an overlap support and aligns with a 23.60% Fibonacci Retracement level. Similarly, the 2nd support at 102.82 is identified as an overlap support and coincides with a 50% Fibonacci Retracement level.
Conversely, the 1st resistance at 103.72 is notable due to its classification as a swing high resistance and its alignment with a 78.60% Fibonacci Retracement level. Additionally, the 2nd resistance at 104.37 is recognized as a multi-swing high resistance.
This analysis collectively points to the potential for a short-term drop to the 1st support before a bounce and subsequent rise towards the 1st resistance, aligned with the overall bullish momentum.
EUR/USD:
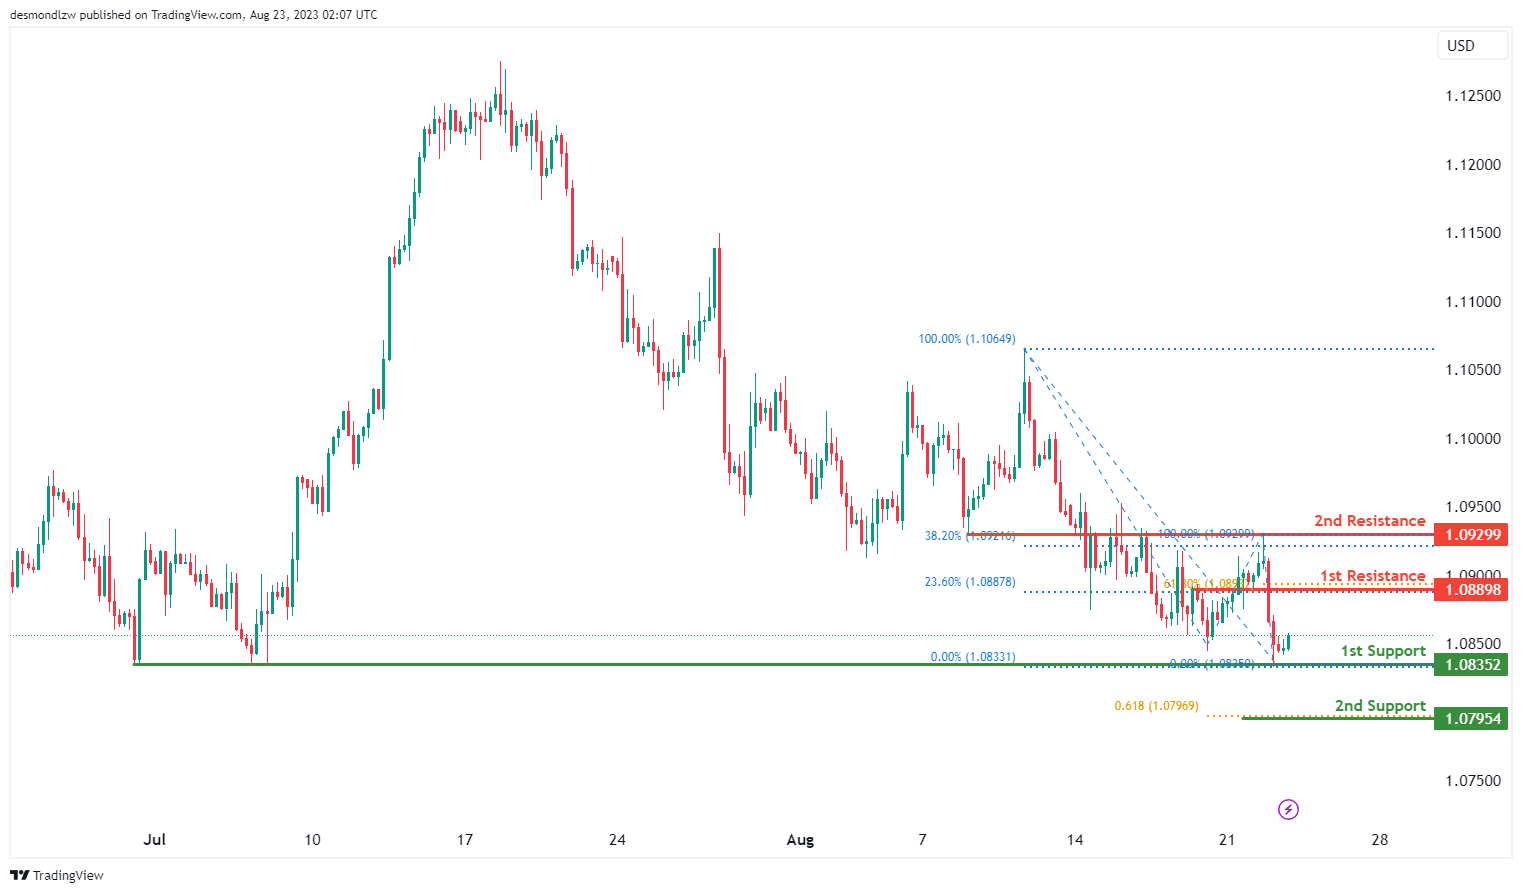
The current momentum on the EUR/USD chart suggests a bullish trend.
Within this context, there’s a potential scenario in which the price experiences a bullish rebound upon reaching the 1st support level at 1.0835, potentially leading to an upward movement towards the 1st resistance at 1.0890.
The 1st support at 1.0835 gains significance due to its identification as a multi-swing low support. Furthermore, the presence of the 2nd support at 1.0795 aligns with a 61.80% Fibonacci Projection, adding to its relevance.
On the resistance side, the 1st resistance at 1.0890 is notable as a pullback resistance, with the added confluence of a 61.80% Fibonacci Retracement and a 23.60% Fibonacci Retracement. Similarly, the 2nd resistance at 1.0929 is recognized as an overlap resistance, coinciding with a 38.20% Fibonacci Retracement.
These factors collectively contribute to the potential for a bullish bounce from the 1st support and a subsequent movement towards the 1st resistance, reflecting the overall bullish momentum on the chart.
EUR/JPY:
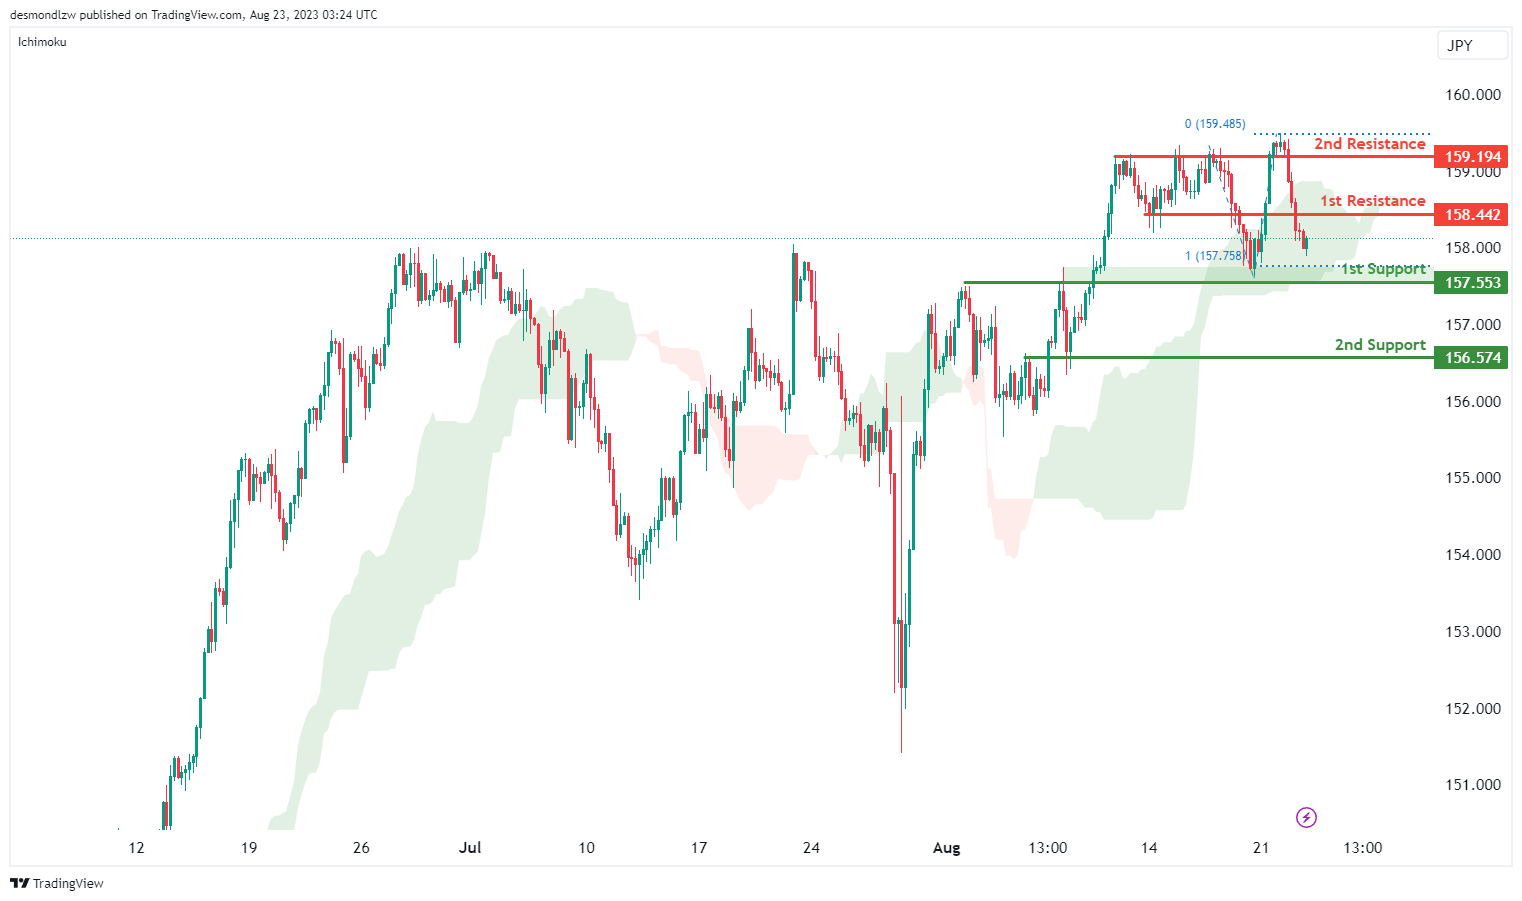
The EUR/JPY chart indicates a bullish overall momentum, and the fact that the price is within the bullish Ichimoku cloud contributes to this momentum. In this context, there’s potential for a bullish continuation towards the first resistance level.
The first support is located at 157.55 and is considered valuable due to its pullback support characteristics, as well as alignment with the 100% Fibonacci Projection.
Furthermore, the second support at 156.57 is also noteworthy as it represents a pullback support area.
On the resistance side, the first resistance level at 158.44 is significant due to its overlap resistance characteristics. Additionally, the second resistance at 159.19 is valuable as it represents another overlap resistance.
EUR/GBP:
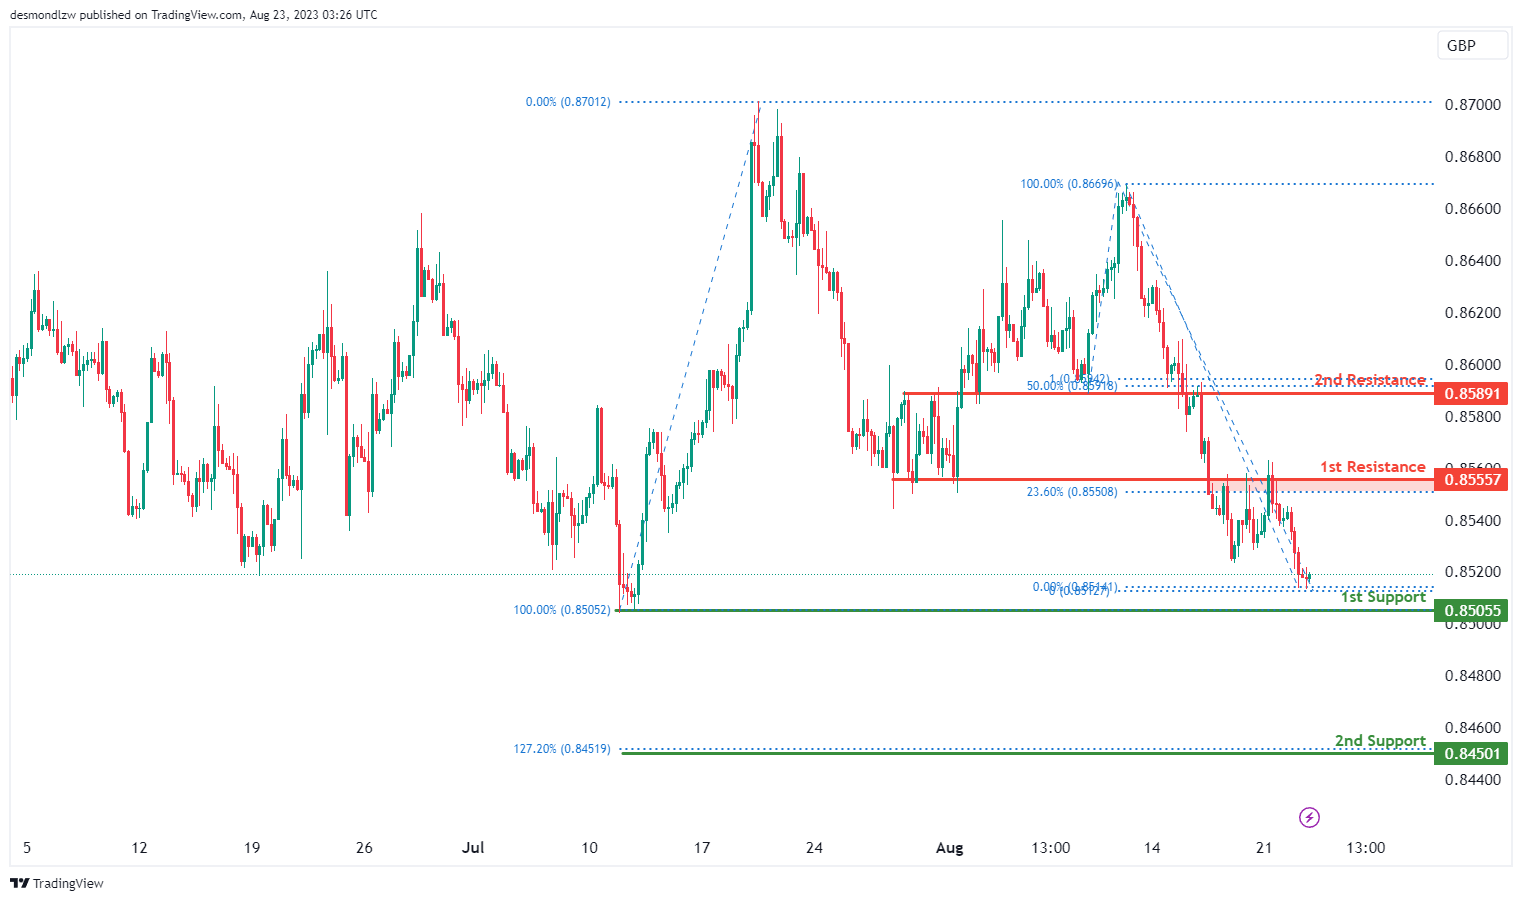
The EUR/GBP chart indicates a bullish overall momentum. This suggests a potential for a bullish continuation towards the first resistance level.
The first support at 0.8505 is seen as valuable due to its swing low support characteristics.
Furthermore, the second support at 0.8450 is noteworthy as it aligns with the 127.20% Fibonacci Extension, which can act as a potential support area.
On the resistance side, the first resistance level at 0.8555 is significant due to its pullback resistance characteristics, along with alignment to the 23.60% Fibonacci Retracement.
Additionally, the second resistance at 0.8594 is notable as it shows confluence between the 50% Fibonacci Retracement and the 100% Fibonacci Projection.
GBP/USD:
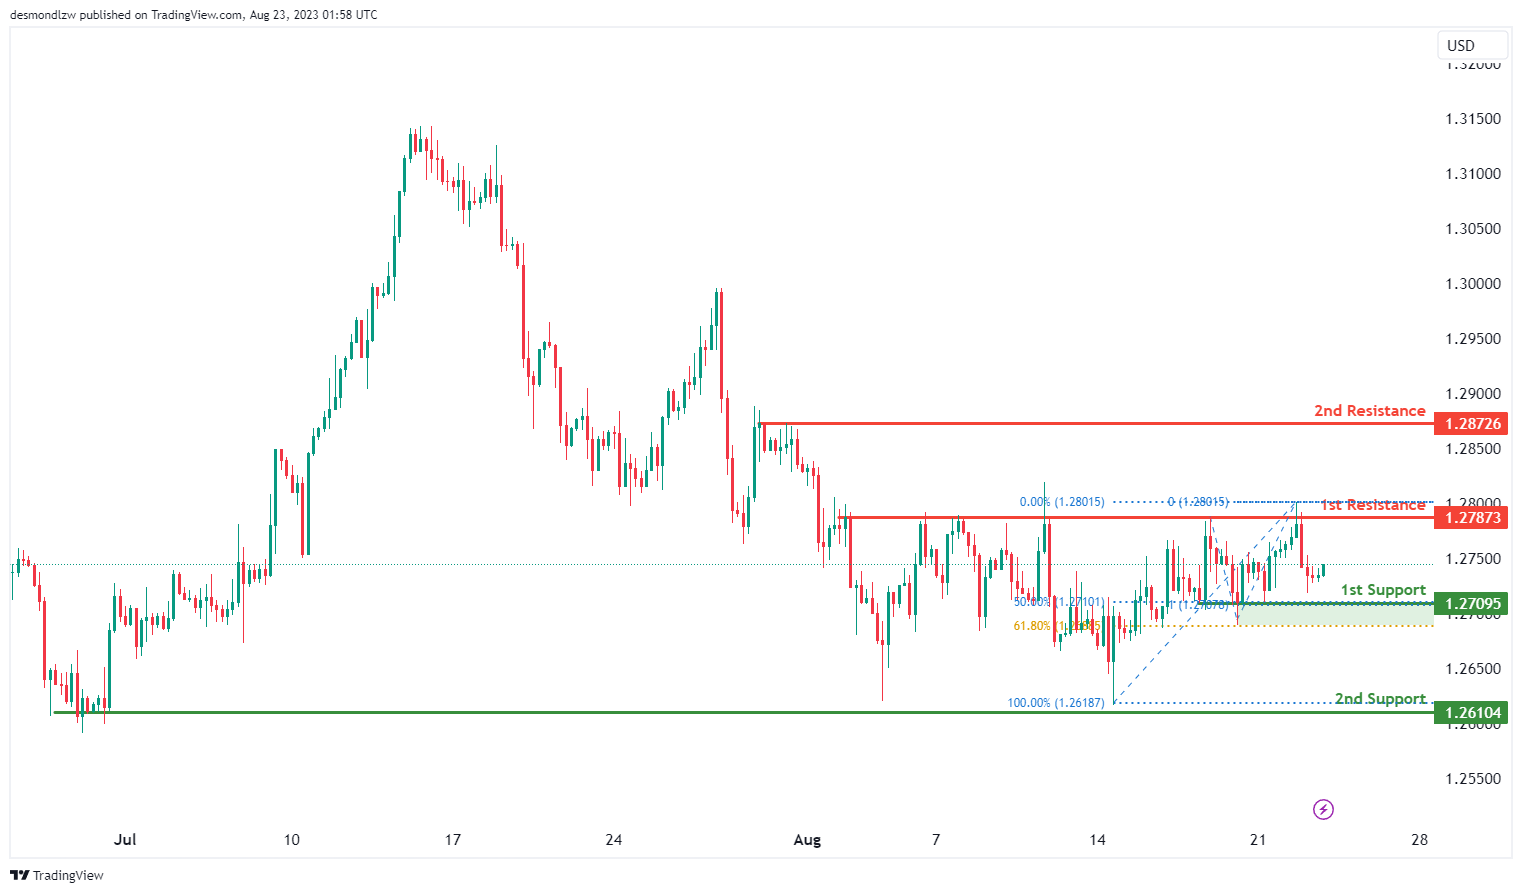
The current momentum of the GBP/USD chart indicates a bullish trend.
Within this momentum context, there’s a potential scenario where the price could continue its bullish movement towards the 1st resistance level.
The 1st support at 1.2709 is significant due to its identification as a multi-swing low support, and it aligns with a 50% Fibonacci Retracement. Additionally, the 2nd support at 1.2610 is noted as a swing low support, contributing to its importance.
On the resistance side, the 1st resistance at 1.2787 stands out as a swing high resistance, indicating a potential area where selling interest might arise. Similarly, the 2nd resistance at 1.2872 is recognized as a multi-swing high resistance.
These factors suggest the potential for a bullish continuation towards the 1st resistance level, in line with the overall bullish momentum observed on the chart.
GBP/JPY:
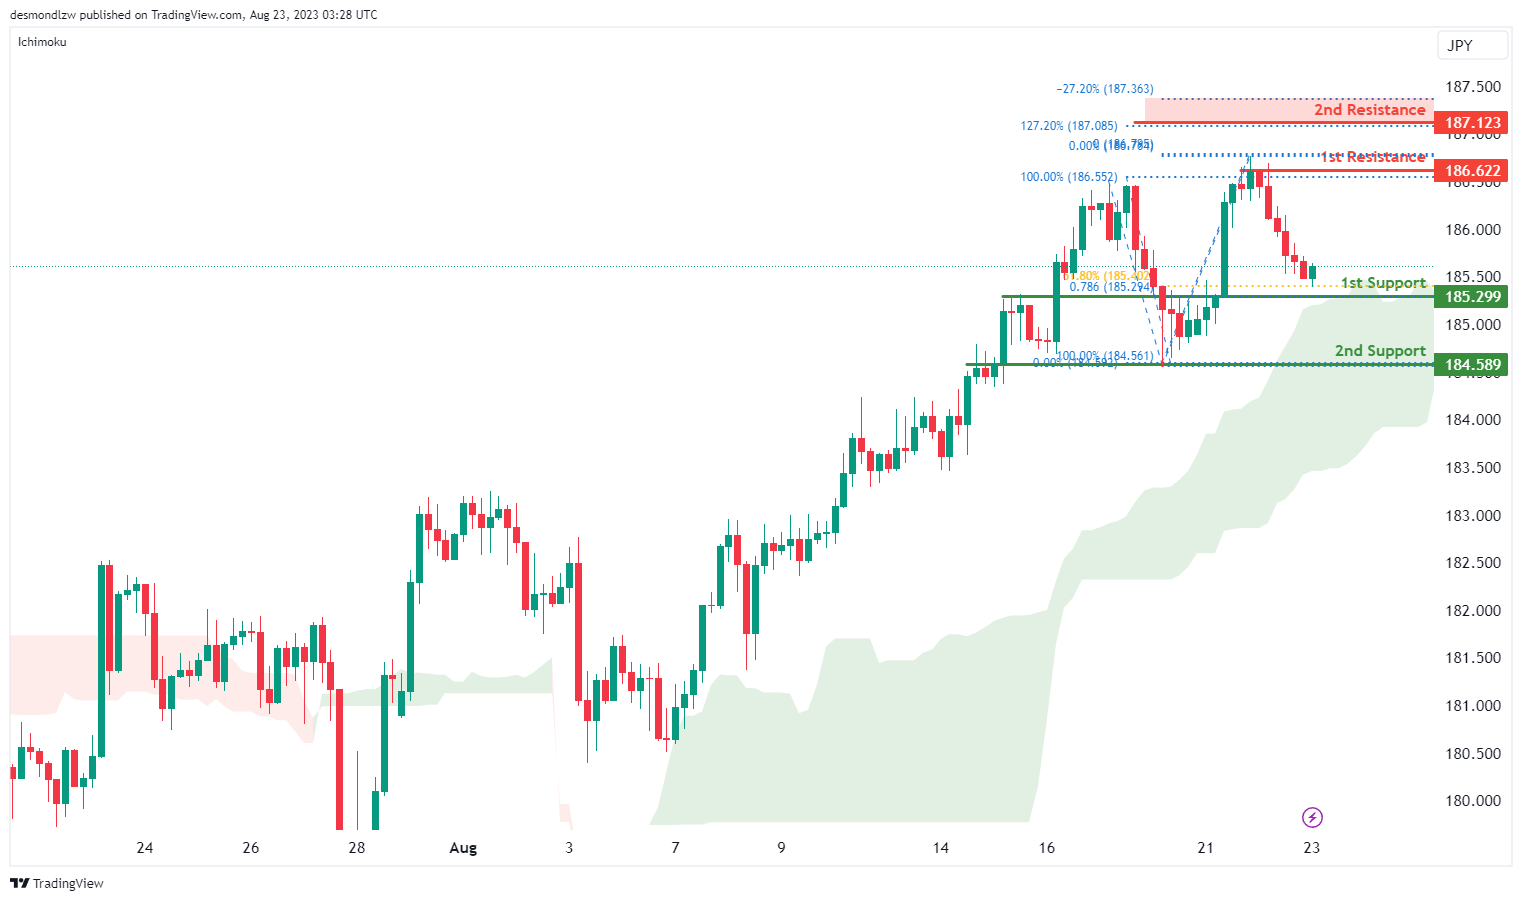
The GBP/JPY chart indicates a bullish overall momentum, supported by the fact that the price is above the bullish Ichimoku cloud. This suggests a potential for a bullish continuation towards the first resistance level.
The first support at 185.29 is significant due to its confluence between the 61.80% Fibonacci Retracement and the 78.60% Fibonacci Projection.
The second support at 184.58 is notable as it represents a pullback support, which can further contribute to the potential bullish momentum.
On the resistance side, the first resistance level at 186.62 is important as it represents a swing high resistance.
Additionally, the second resistance at 187.12 is noteworthy due to the confluence between the 127.20% Fibonacci Extension and the -27% Fibonacci Expansion.
USD/CHF:
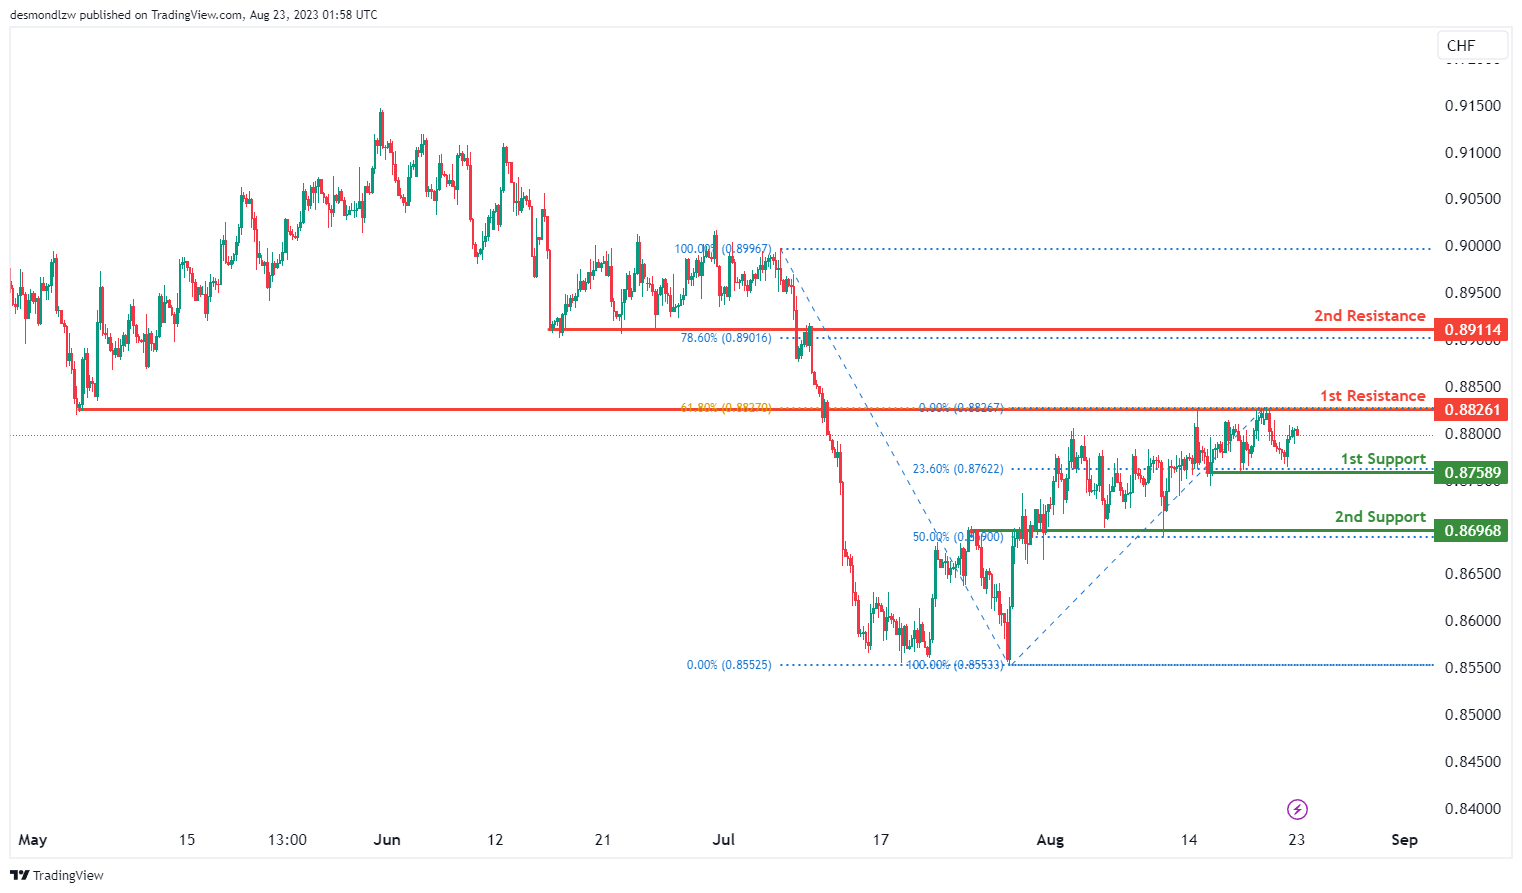
The USD/CHF chart currently reflects a bearish momentum, indicating a prevailing downward trend.
Given this bearish momentum, there’s a potential scenario in which the price could continue its bearish movement towards the 1st support level.
The 1st support at 0.8758 gains significance as a multi-swing low support and aligns with a 23.60% Fibonacci Retracement. Additionally, the 2nd support at 0.8696 is noted as an overlap support and corresponds to a 50% Fibonacci Retracement.
On the resistance side, the 1st resistance at 0.8826 is identified as an overlap resistance and aligns with a 61.80% Fibonacci Retracement. Similarly, the 2nd resistance at 0.8911 is recognized as a pullback resistance and corresponds to a 78.60% Fibonacci Retracement.
These factors support the potential for a bearish continuation towards the 1st support level, in line with the prevailing bearish momentum observed on the chart.
USD/JPY:
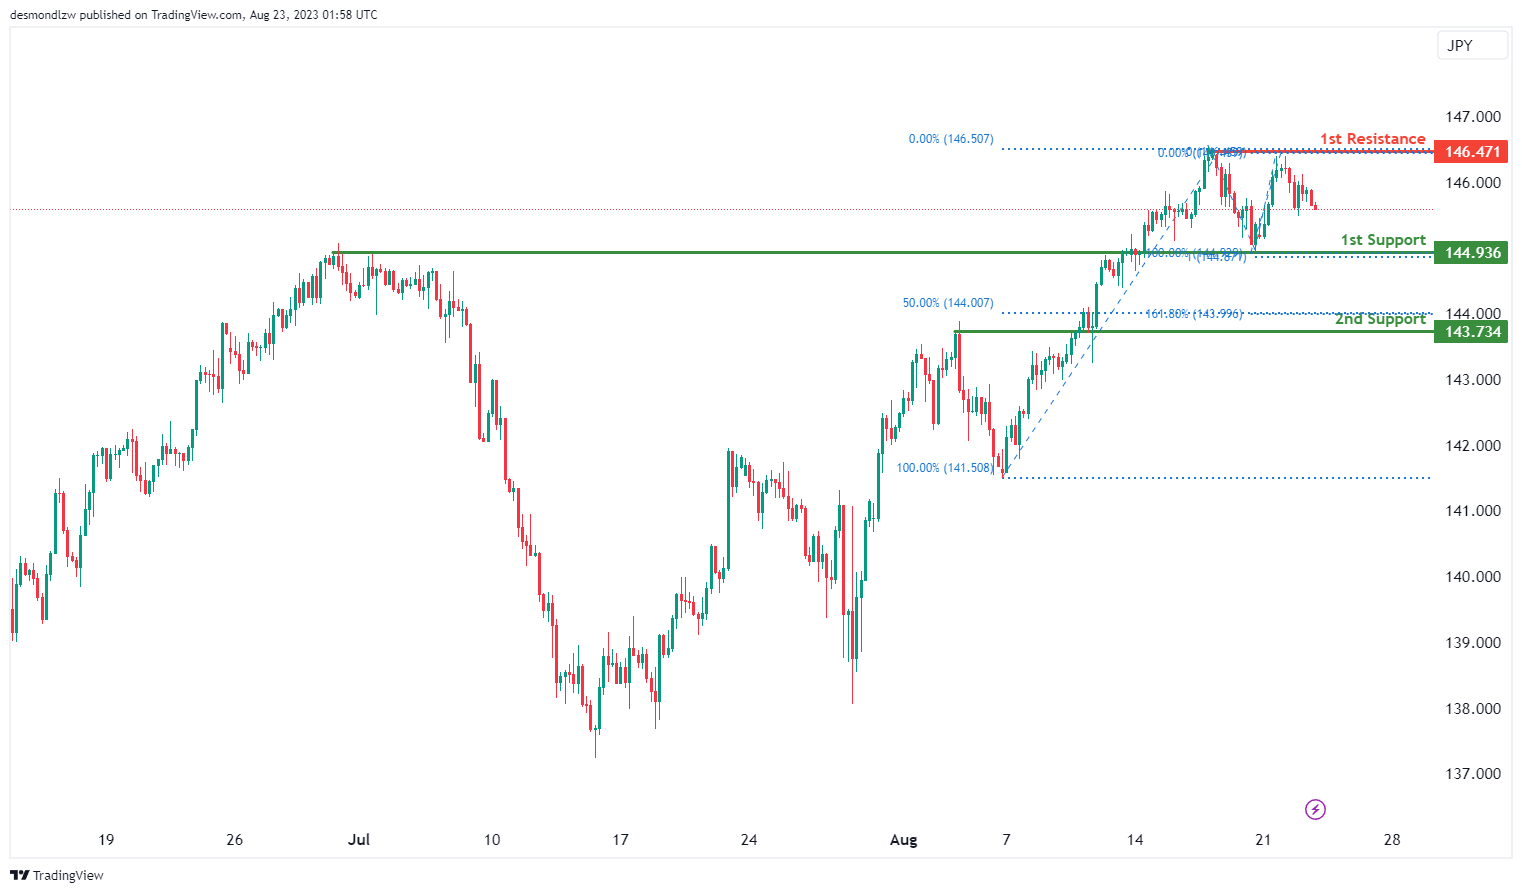
The USD/JPY chart indicates a bearish momentum, signaling a prevailing downward trend.
In this context, there’s a potential scenario where the price could extend its bearish movement towards the 1st support level.
The significance of the 1st support at 144.93 lies in its identification as an overlap support, suggesting a potential area where the price might find temporary stabilization.
Furthermore, the 2nd support at 143.73 aligns with a pullback support and corresponds to a 50% Fibonacci Retracement, adding to its importance as a potential level where the price could bounce.
On the resistance side, the 1st resistance at 146.47 is noted as a multi-swing high resistance, potentially acting as an obstacle to upward price movement.
These factors contribute to the potential for a bearish continuation towards the 1st support level, aligning with the overall bearish momentum observed on the chart.
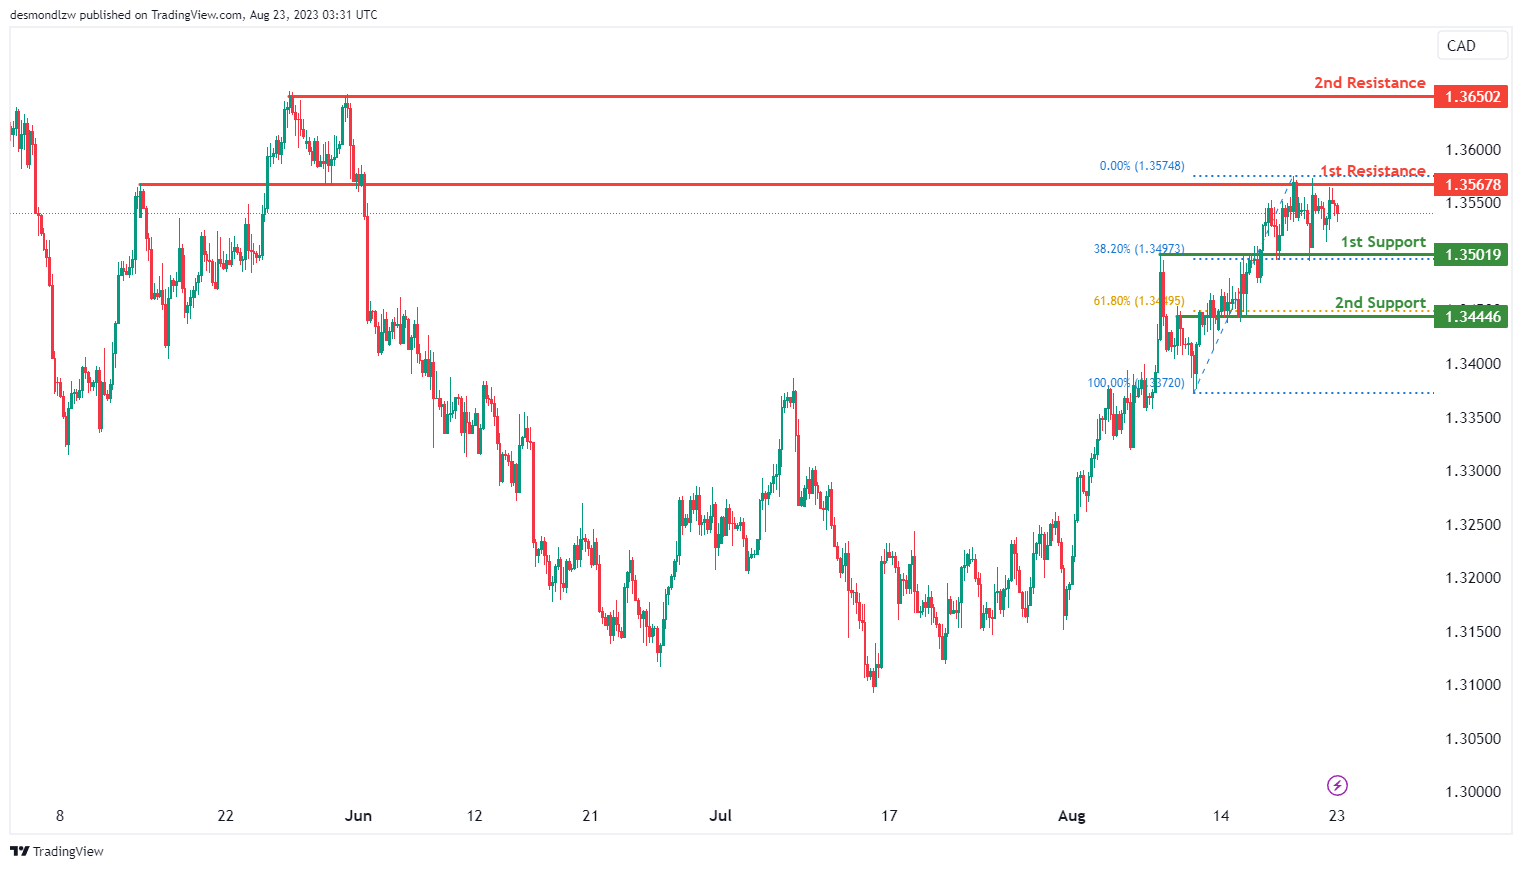
USD/CAD:
The USD/CAD chart currently exhibits a neutral momentum, indicating a lack of clear directional bias. There is a potential for price to fluctuate between the 1st resistance and the 1st support levels.
The 1st support at 1.3502 is considered significant due to its identification as an overlap support that aligns with the 38.20% Fibonacci retracement level. Similarly, the 2nd support at 1.3445 is also identified as an overlap support that aligns with the 61.80% Fibonacci retracement level.
To the upside, the 1st resistance at 1.3568 is identified as an overlap resistance. Furthermore, the 2nd resistance at 1.3650 is identified as a multiple swing-high resistance.
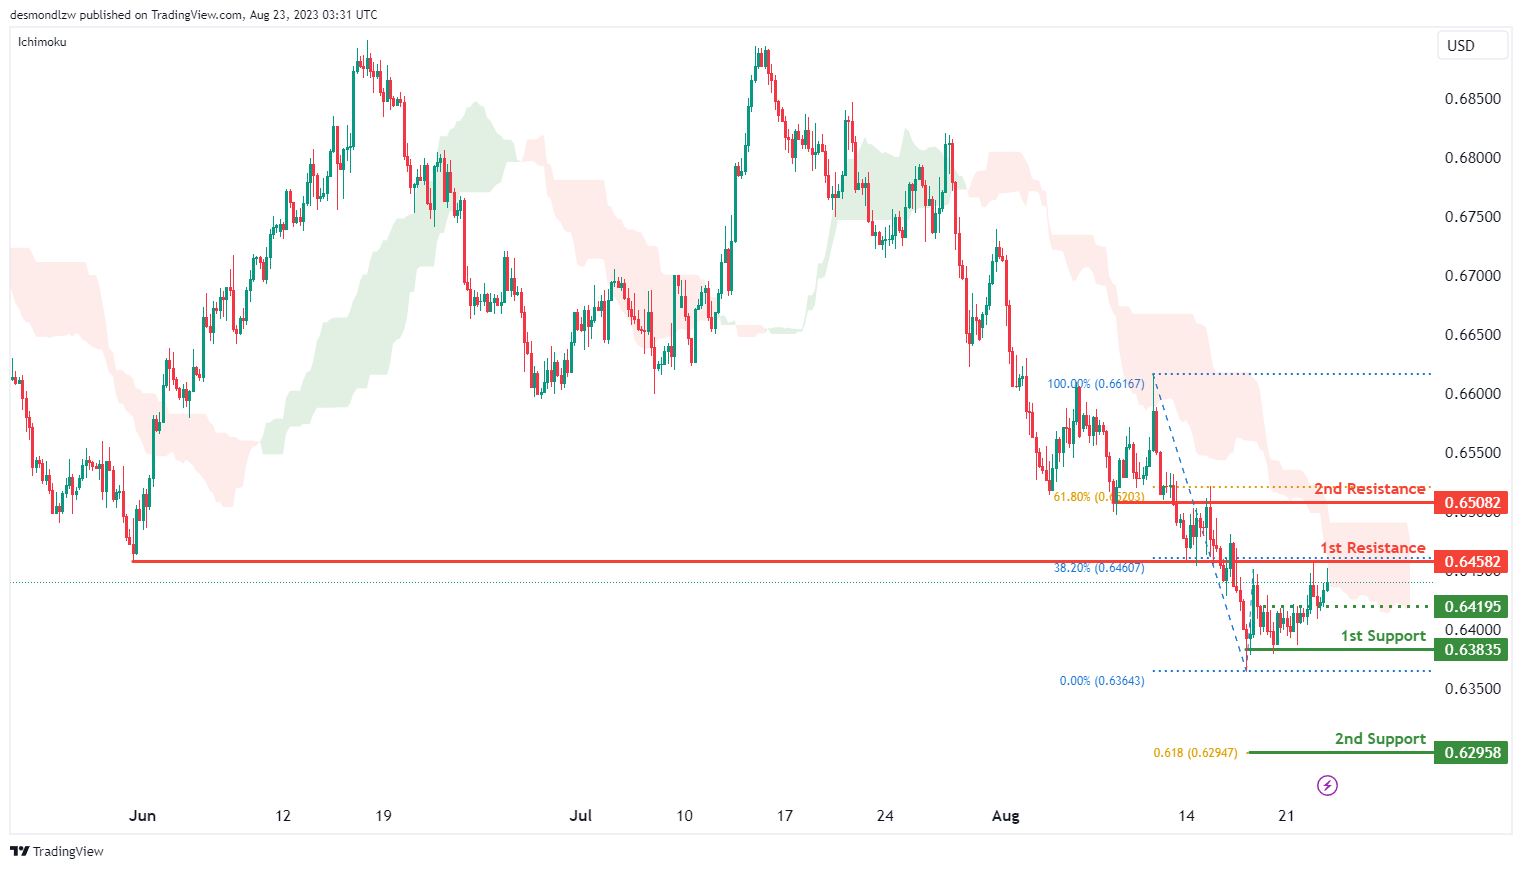
AUD/USD:
The AUD/USD chart indicates a bearish momentum, signifying a prevailing downward trend. There is a potential for price to experience a bearish reaction upon reaching the 1st resistance level at 0.6458 and subsequently drop towards the 1st support level at 0.6384.
The 1st resistance at 0.6458 is identified as a pullback resistance that aligns with the 38.20% Fibonacci retracement level. The 2nd resistance at 0.6508 is also identified as an overlap resistance that aligns with the 61.80% Fibonacci retracement level.
To the downside, the intermediate support level is found at 0.6419 while the 1st support at 0.6384 is identified as a swing-low support. Furthermore, the 2nd support at 0.6296 is identified as a pullback support that aligns with the 61.80% Fibonacci projection level.
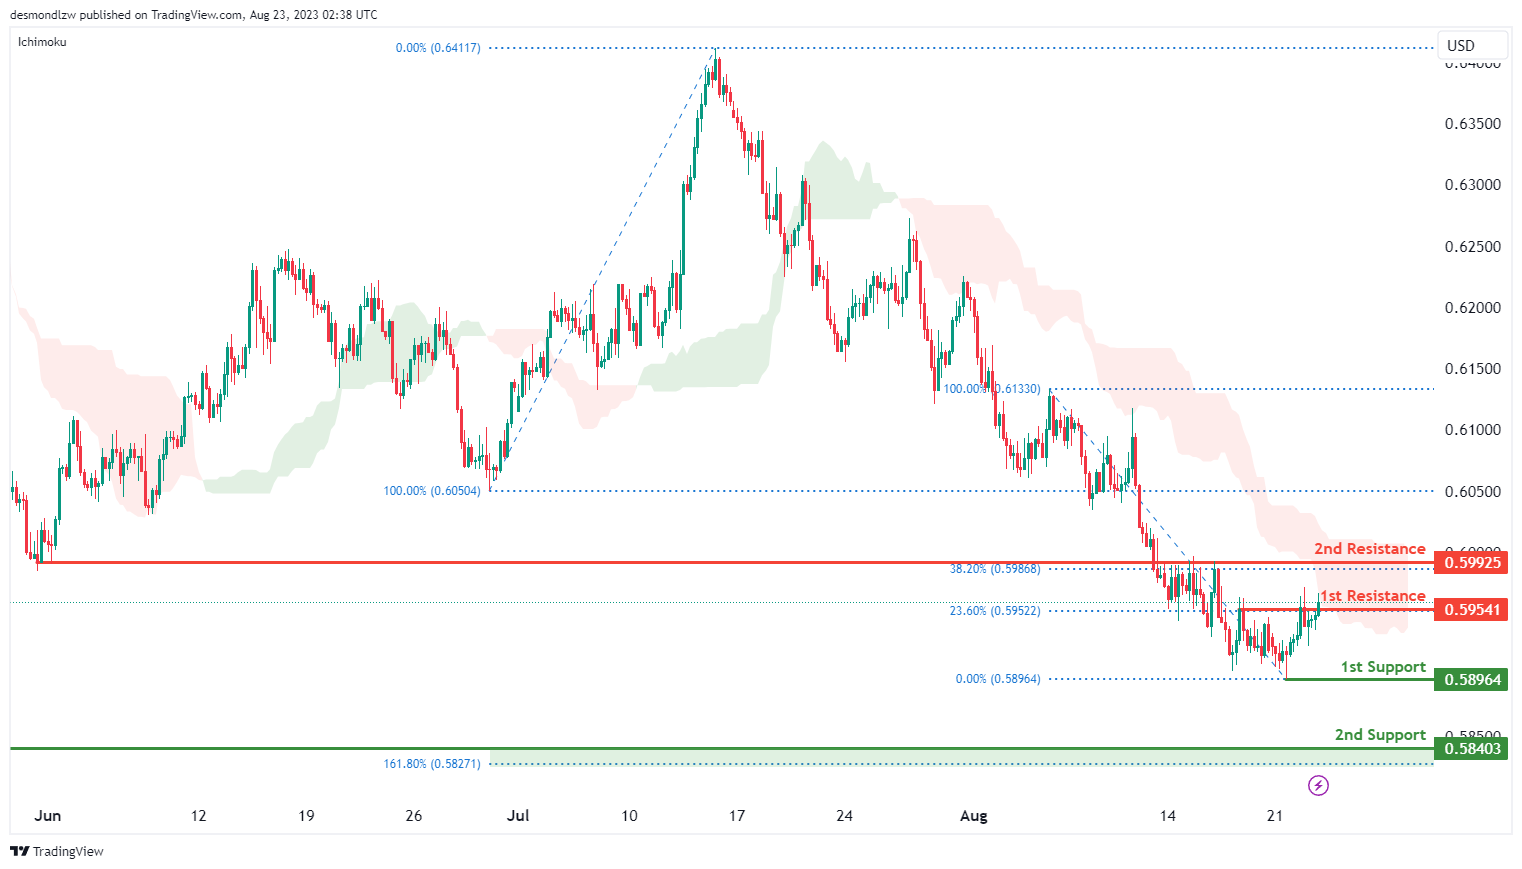
NZD/USD
The NZD/USD chart currently displays a bearish momentum, indicating a prevalent downward trend. There is potential for price to undergo a bearish reaction upon reaching the 1st resistance level at 0.5954 and subsequently decline towards the 1st support level at 0.5896.
The 1st resistance at 0.5954 is identified as a pullback resistance that aligns with the 23.60% Fibonacci retracement level. The 2nd resistance at 0.5993 is identified as an overlap resistance that aligns with the 38.20% Fibonacci retracement level.
To the downside, the 1st support at 0.5896 is identified as a swing-low support. Additionally, the 2nd support at 0.5840 is identified as a pullback support that aligns with the 161.80% Fibonacci extension level.
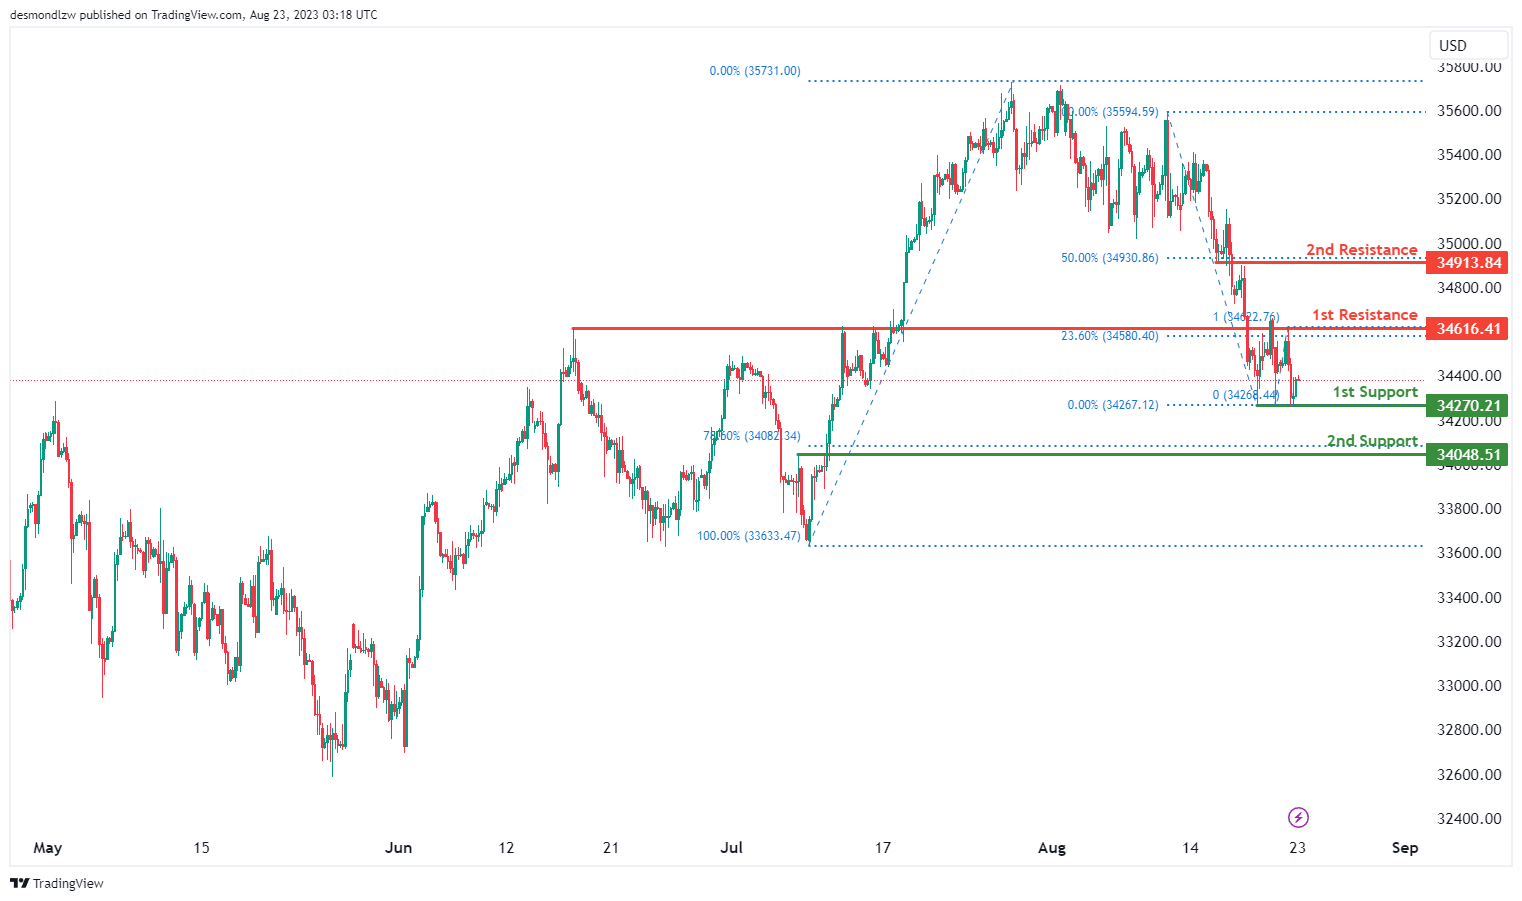
DJ30:
The DJ30 chart indicates a bullish overall momentum. There is a potential scenario where the price might continue in a bullish direction towards the first resistance level.
The first support is positioned at 34270.21 and is considered advantageous due to its multi-swing low support characteristics. Additionally, the second support at 34048.51 is valuable as it represents a pullback support and aligns with the 78.60% Fibonacci Retracement.
On the resistance side, the first resistance level at 34616.41 is noteworthy and is associated with an overlap resistance. This resistance level also coincides with the 23.60% Fibonacci Retracement and the 100% Fibonacci Projection, indicating a strong Fibonacci confluence. Furthermore, the second resistance at 34913.84 is significant as it represents a pullback resistance and aligns with the 50% Fibonacci Retracement.
GER30:
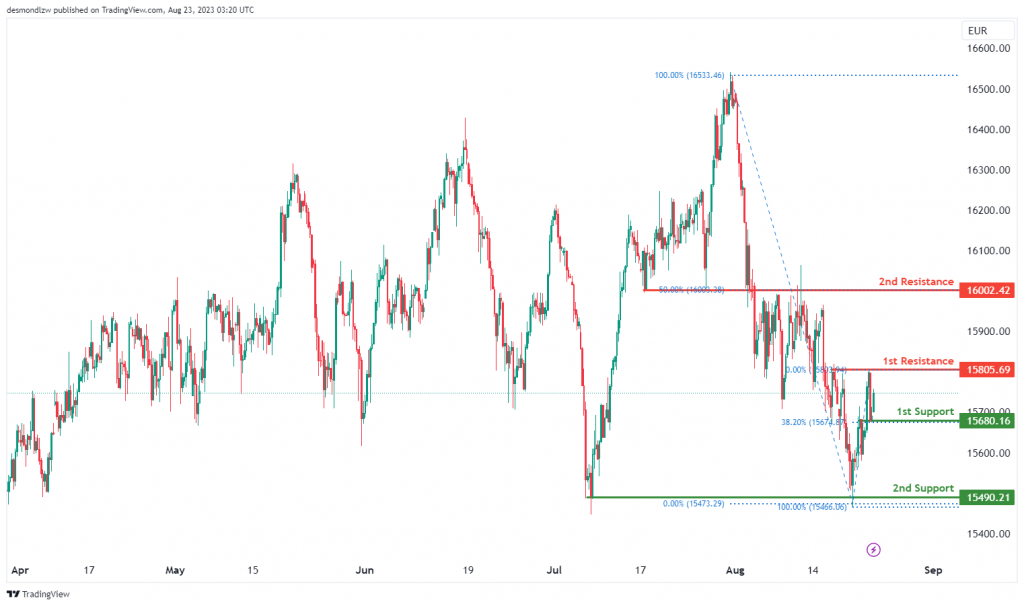
The GER30 chart indicates a bullish overall momentum. In this scenario, there’s a potential for a bullish continuation towards the first resistance level.
The first support is located at 15680.16 and is considered advantageous due to its pullback support characteristics, along with the alignment to the 38.20% Fibonacci Retracement.
Furthermore, the second support at 15490.21 is valuable as it represents a multi-swing low support area.
On the resistance side, the first resistance level at 15805.69 is significant due to its multi-swing high resistance characteristics. Additionally, the second resistance at 16002.42 is notable as it represents a pullback resistance and aligns with the 50% Fibonacci Retracement.
US500
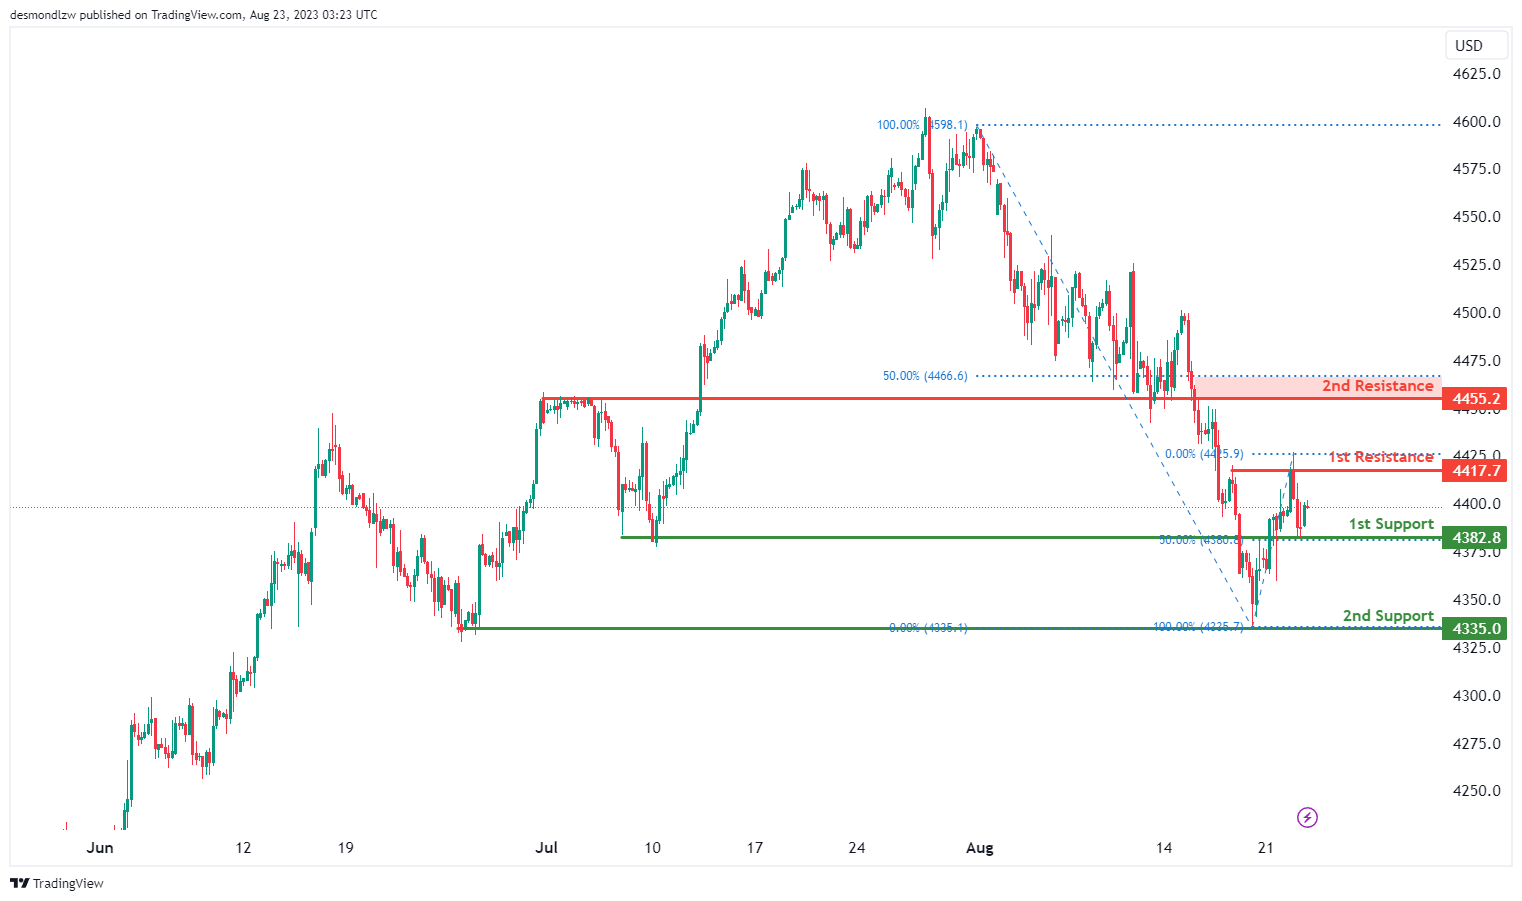
The US500 chart indicates a bearish overall momentum. In this context, there’s potential for a bearish continuation towards the first support level.
The first support is situated at 4382.8 and is considered significant due to its overlap support characteristics, along with the alignment to the 50% Fibonacci Retracement.
Additionally, the second support at 4335.0 is valuable as it represents a multi-swing low support area.
On the resistance side, the first resistance level at 4417.7 is noteworthy due to its multi-swing high resistance characteristics. Furthermore, the second resistance at 4455.2 is significant as it represents an overlap resistance and aligns with the 50% Fibonacci Retracement.
BTC/USD:
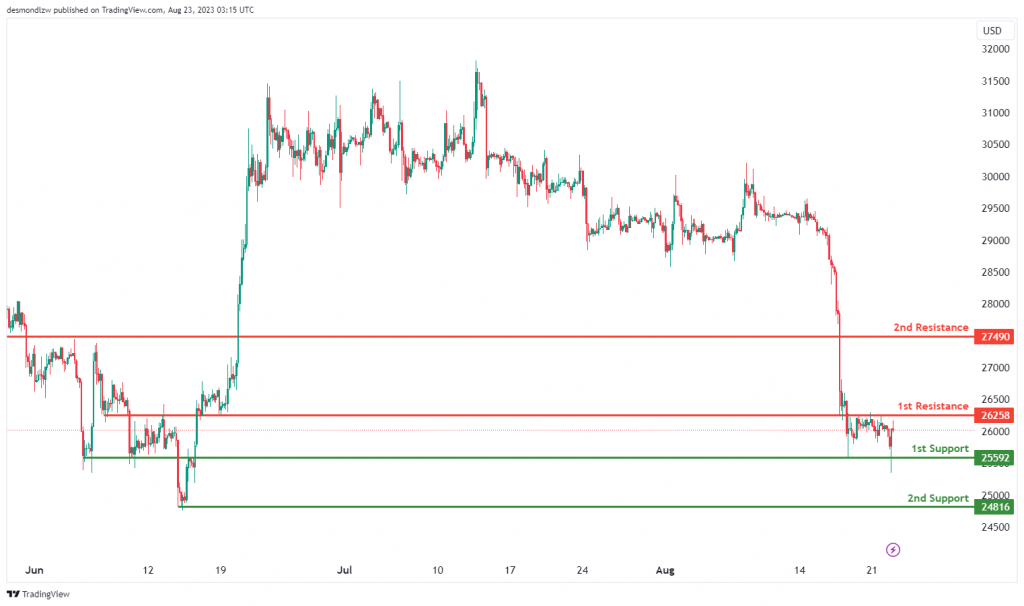
The BTC/USD chart indicates a bearish overall momentum. There is a potential scenario where the price might continue in a bearish direction towards the first support level.
The first support is positioned at 25592 and is considered advantageous due to its multi-swing low support characteristics. Additionally, the second support at 24816 is valuable as it represents a swing low support.
On the resistance side, the first resistance level at 26258 is noteworthy and is associated with an overlap resistance. Furthermore, the second resistance at 27490 is significant due to its overlap resistance attributes.
ETH/USD:
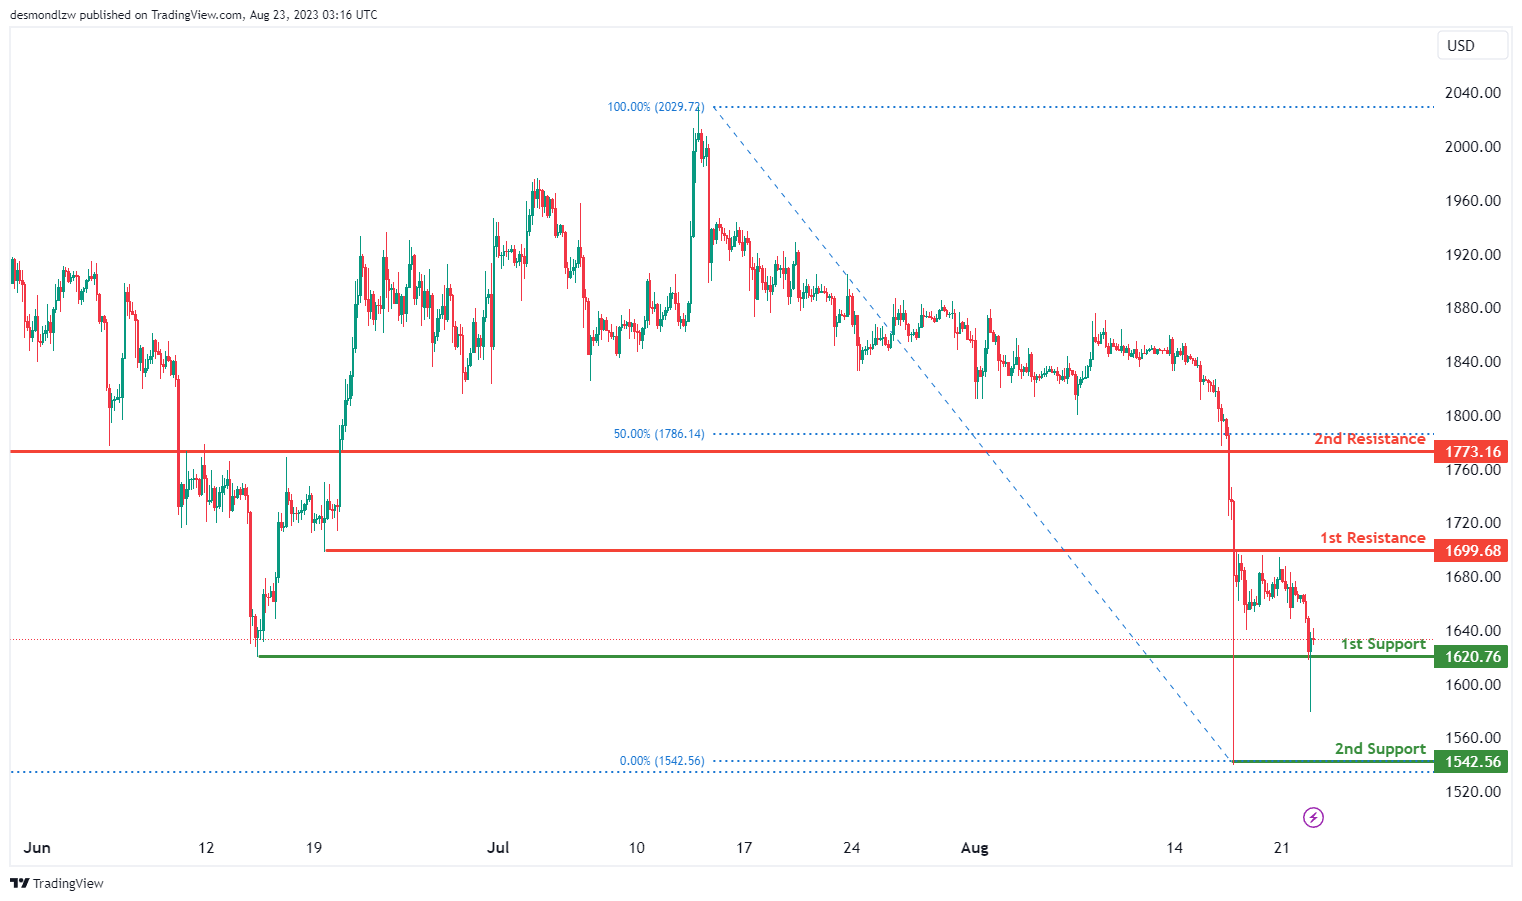
The ETH/USD chart indicates a bearish overall momentum. There is a potential scenario where the price might continue in a bearish direction towards the first support level.
The first support is positioned at 1620.76 and is considered advantageous due to its overlap support characteristics. Additionally, the second support at 1542.56 is valuable as it represents a swing low support.
On the resistance side, the first resistance level at 1699.68 is noteworthy and is associated with a pullback resistance. Furthermore, the second resistance at 1773.16 is significant due to its overlap resistance attributes and its association with the 50% Fibonacci Retracement.
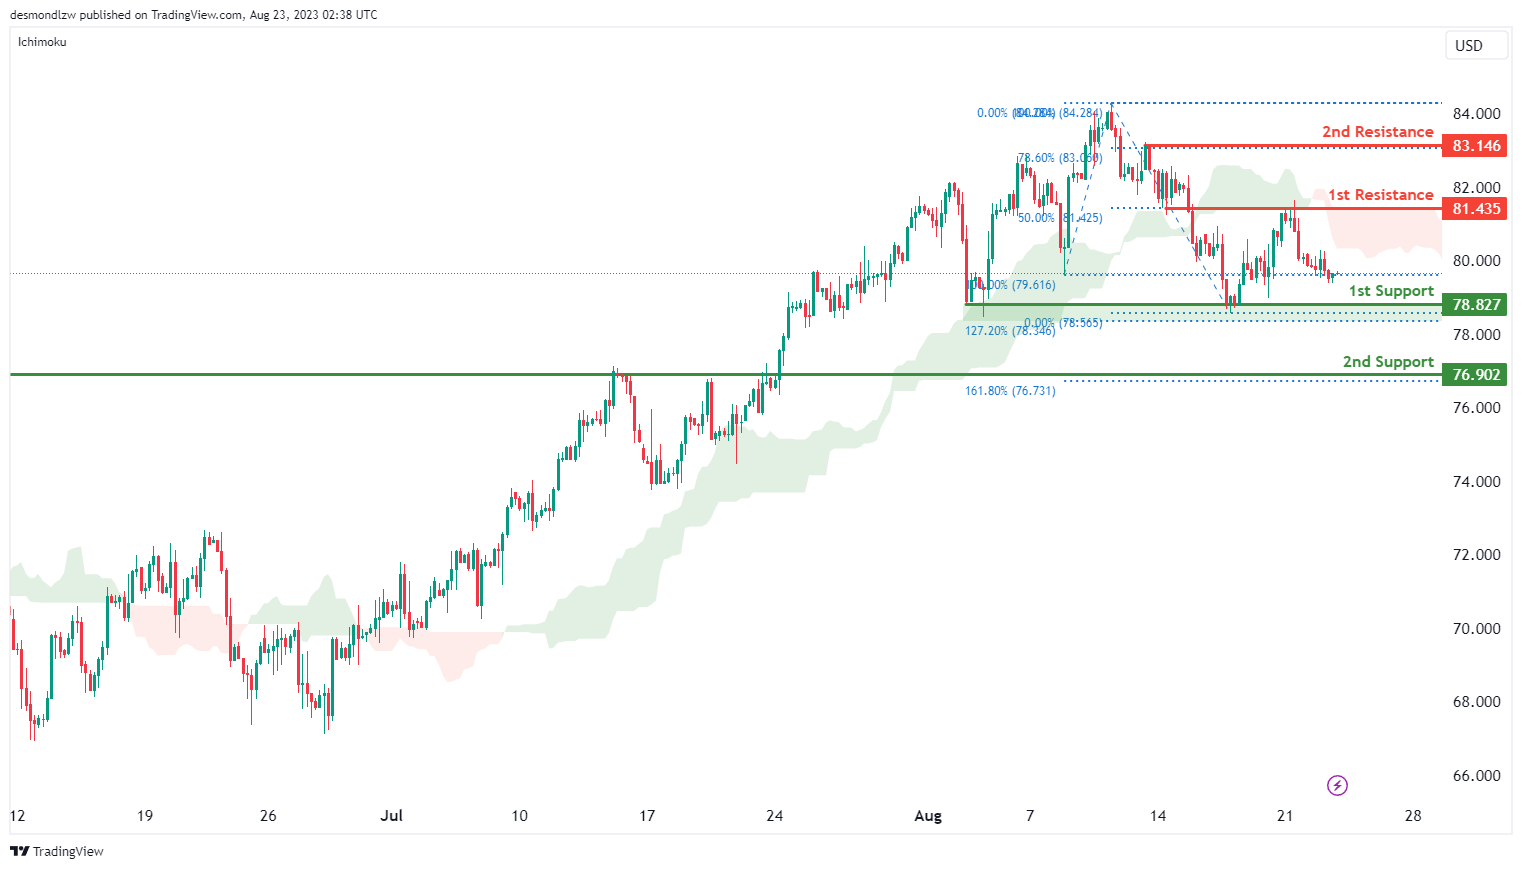
WTI/USD:
The WTI chart currently indicates a bearish momentum, suggesting a prevailing downward trend. There is potential for price to continue its downward movement towards the 1st support level at 78.83.
The significance of the 1st support at 78.83 lies in its identification as an overlap support that aligns with the 127.20% Fibonacci extension level. Similarly, the 2nd support at 76.90 is also identified as an overlap support that aligns with the 161.80% Fibonacci extension level.
To the upside, the 1st resistance level at 81.44 is noted as an overlap resistance that aligns with the 50.00% Fibonacci retracement level. The 2nd resistance at 83.15 is identified as a pullback resistance that aligns with the 78.60% Fibonacci retracement level.
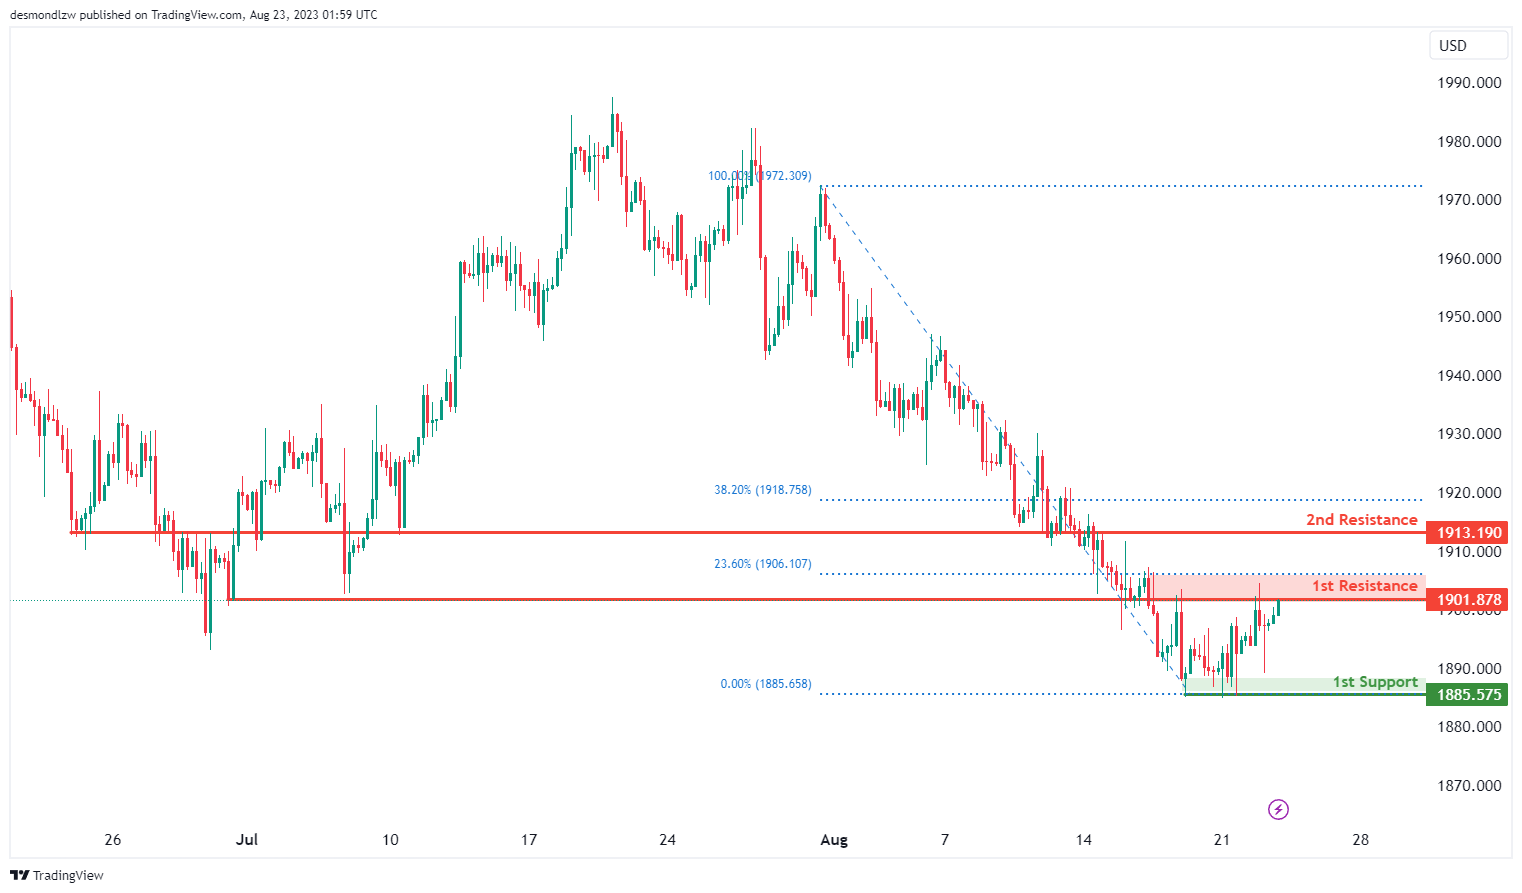
XAU/USD (GOLD):
The XAUUSD chart indicates a bullish momentum, suggesting a prevailing upward trend.
Within this context, a potential scenario arises in which the price might experience a bearish reaction at the 1st resistance level, followed by a drop to the 1st support in the short term, before eventually rising back towards the 1st resistance.
The significance of the 1st support at 1885.57 lies in its identification as a multi-swing low support, potentially providing a foundation for a temporary price recovery.
On the resistance side, the 1st resistance at 1901.87 is noteworthy due to its classification as an overlap resistance and its alignment with a 23.60% Fibonacci Retracement. Additionally, the 2nd resistance at 1913.19 is identified as an overlap resistance, adding to its potential impact on price movement.
These factors contribute to the potential scenario of a bearish reaction followed by a short-term drop to the 1st support, eventually leading to a rise back towards the 1st resistance level, in alignment with the overall bullish momentum observed on the chart.
Japan PMI manufacturing ticked up to 49.7, services rose to 54.3
In August, Japan's Service PMI climbed from 53.8 to 54.3, while the Manufacturing PMI saw a slight increase from 49.6 to 49.7, just above anticipated figures. Composite PMI also edged up from 52.2 to 52.6.
Andrew Harker, from S&P Global Market Intelligence, pointed out the robust performance of the service sector, driven by consistent new order growth. In contrast, manufacturing only marginally rebounded but remained below the growth threshold.
Despite the overall rise in new orders, manufacturing employment remained flat, ending its 28-month growth streak. Additionally, heightened oil prices impacted both sectors, causing the steepest rise in input costs in four months. Notably, business confidence dwindled in both domains due to longer-term economic uncertainties.