Sample Category Title
Technical Outlook and Review
DXY:
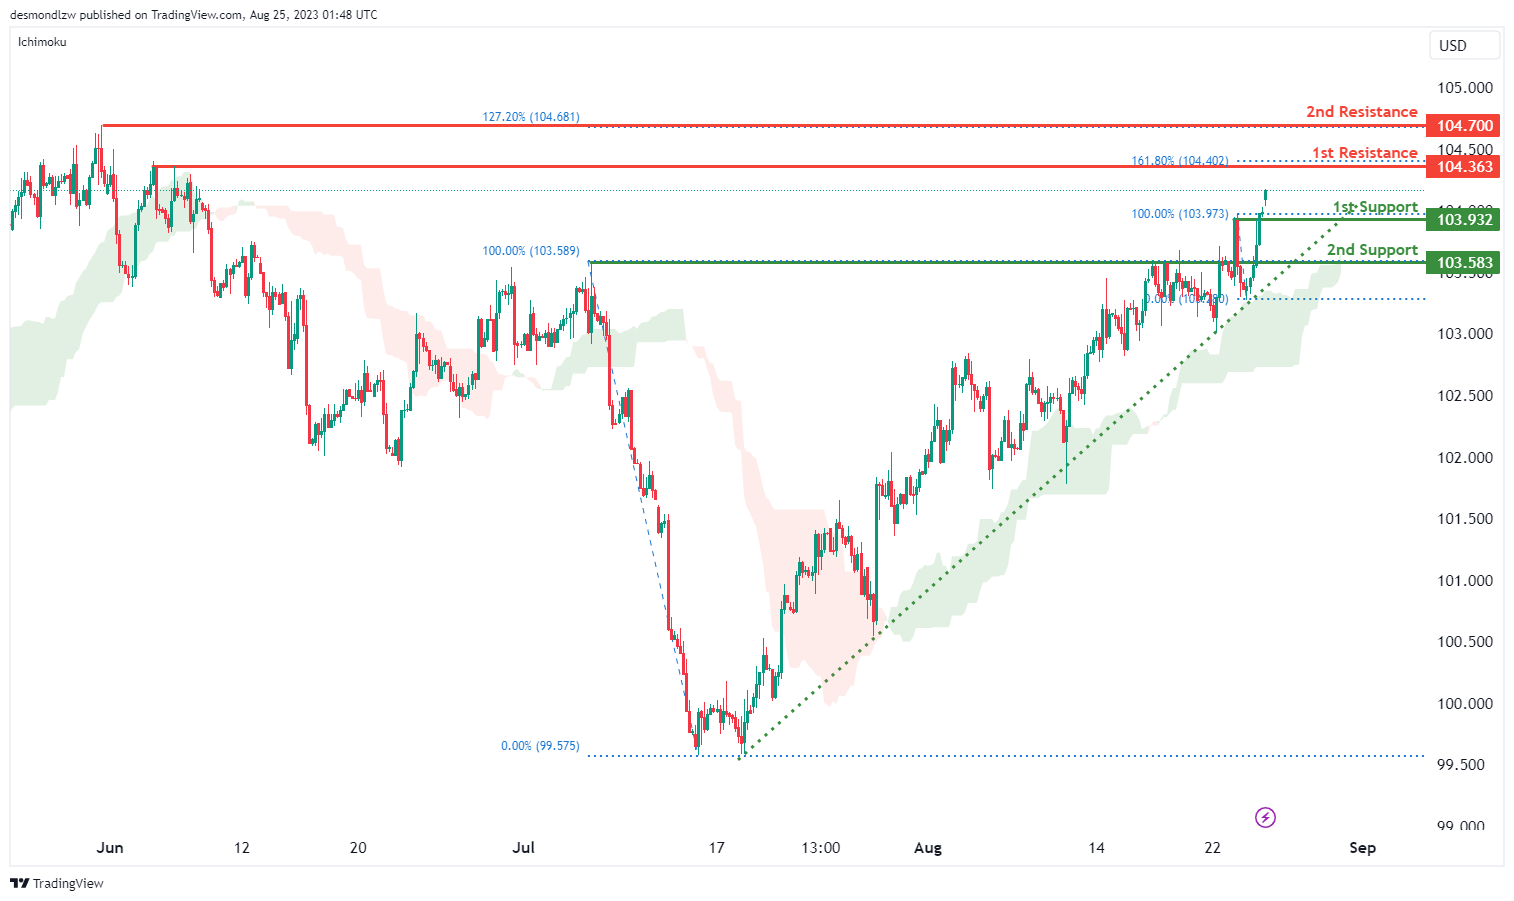
The DXY, which stands for the U.S. Dollar Index, is currently displaying a bullish momentum. One of the prominent indicators supporting this momentum is the fact that the price is maintaining a position above a significant ascending trend line. Such a trend line usually signals a continuation of the upward movement, suggesting that further bullish momentum is likely in the coming sessions.
Additionally, another key bullish indicator is the position of the price above the Ichimoku cloud. When the price is above this cloud, it usually confirms the ongoing positive momentum, offering more confidence to the bullish bias.
Given these technical indicators, there’s a strong case for the price to potentially continue its bullish trajectory, moving towards the 1st resistance level.
Speaking of levels, the 1st support level to watch out for is at 103.30, which serves as a pullback support. Should there be any downward movement, this is a level where the price might find some cushion. Following closely is the 2nd support level at 103.58, which also acts as a pullback support.
On the upside, the 1st resistance level stands at 104.36. This level is significant because it marks a swing high resistance and coincides with the 161.80% Fibonacci Extension. Breaking past this could pave the way for the next challenge at the 2nd resistance level of 104.70. This resistance is not only a swing high resistance but also aligns with the 127.20% Fibonacci Extension.
EUR/USD:
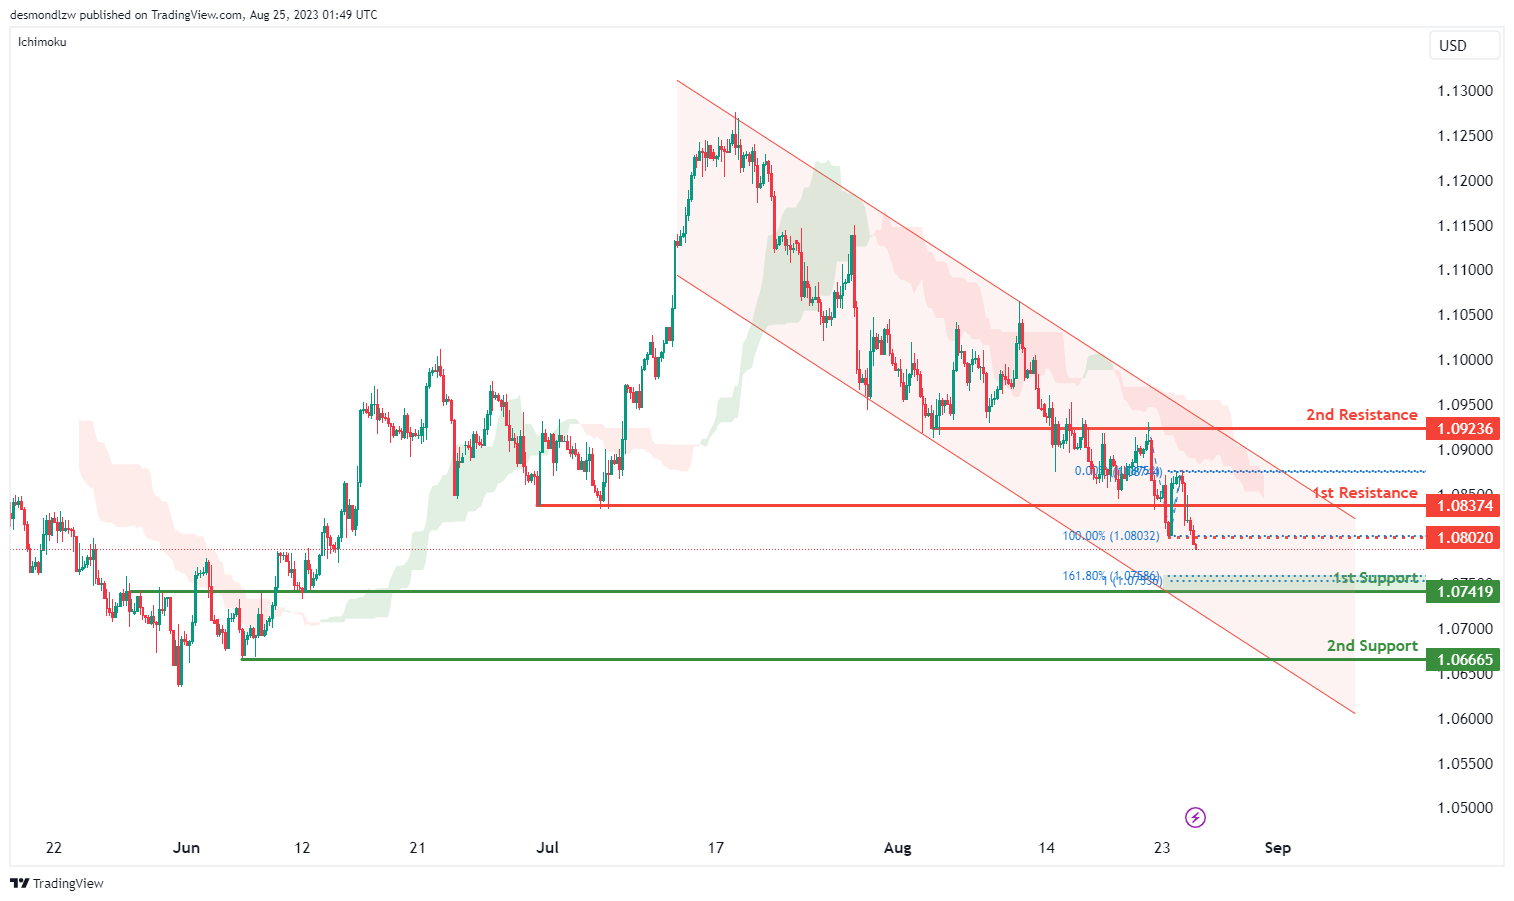
The EUR/USD pair is exhibiting a bearish momentum. Several factors underscore this trend: the price movement within a descending channel and its positioning right below the bearish Ichimoku cloud. The latter often suggests a potential price reversal.
Given this downward momentum, the anticipation is for a bearish continuation towards the 1st support.
The 1st support is situated at 1.0741. It stands out due to its classification as an overlap support, combined with its association with the 161.80% Fibonacci Extension and 100% level, showcasing a Fibonacci confluence.
The 2nd support for the pair is at 1.0666, characterized as a swing low support, indicating a past level where price found support.
On the potential upside, the 1st resistance is pinpointed at 1.0837, described as an overlap resistance. Such resistances represent levels where past price action might have encountered barriers.
Further, the 2nd resistance is at 1.0923, another overlap resistance, hinting at a previous zone of contention for price movements.
Additionally, an intermediate resistance is observed at 1.0802, acting as a pullback resistance. This suggests a temporary halt or resistance point in case of any short-term upward retracements.
EUR/JPY:
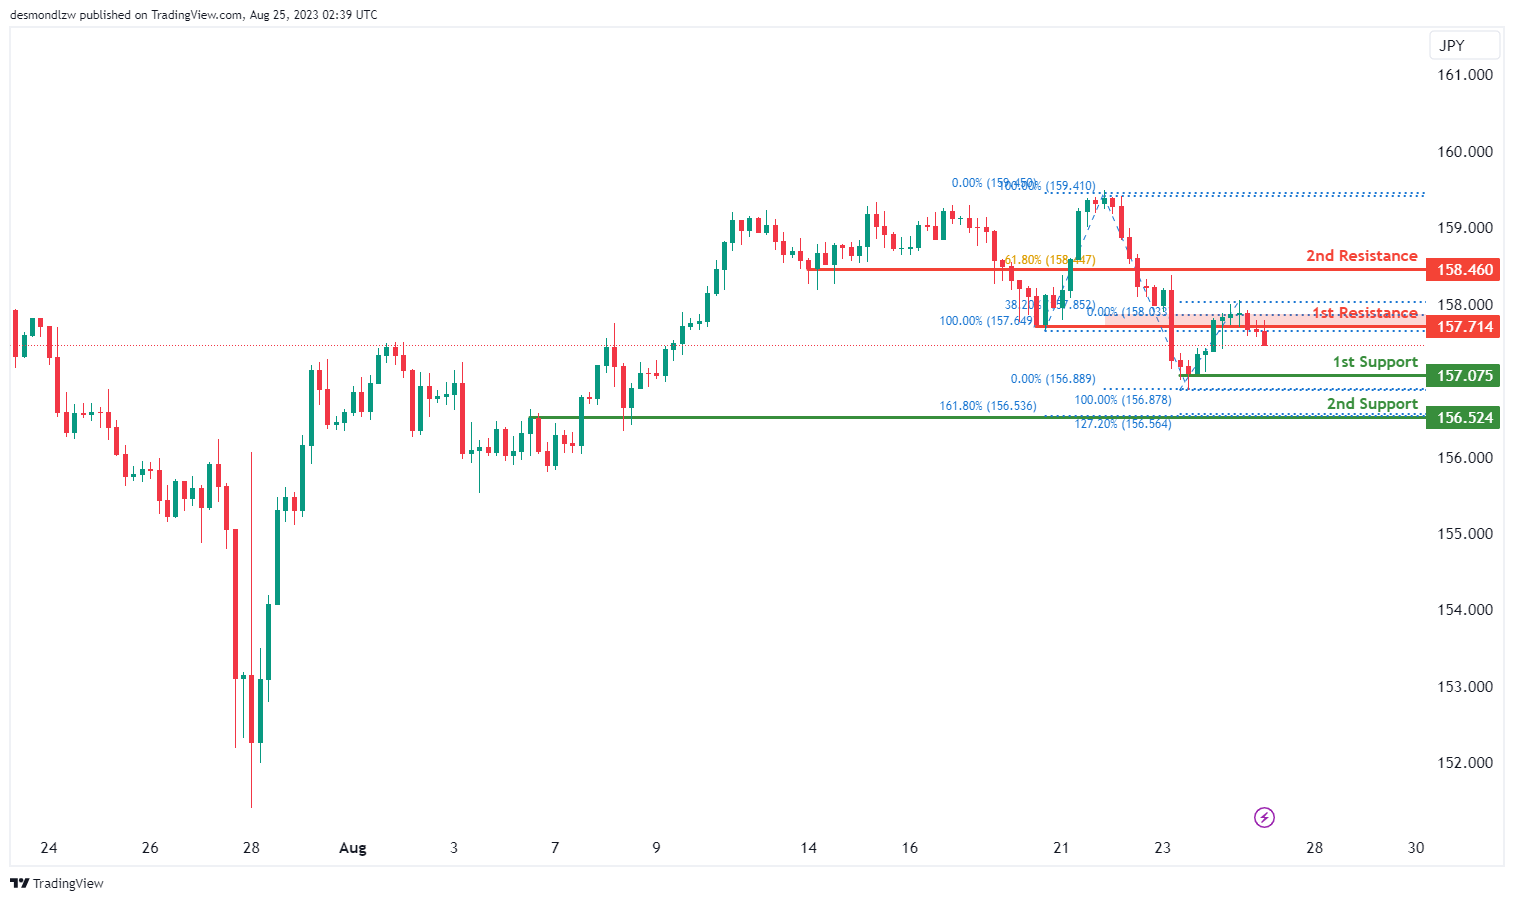
The EUR/JPY pair currently displays a bearish trend. With the prevailing downward momentum, there’s an expectation for a bearish continuation moving towards the 1st support.
The 1st support for the pair is positioned at 157.07, recognized primarily as a swing low support. This denotes a previous level where the price found significant support.
The 2nd support stands at 156.52. Its significance arises from its dual characteristic: it is identified as an overlap support, a level with historical price interactions, and aligns with Fibonacci extensions at both 161.80% and 127.20%. Such confluence often strengthens the validity of a support or resistance level.
On the potential upside, the 1st resistance is marked at 157.71. Acting as a pullback resistance, it also intersects with the 38.20% Fibonacci Retracement, suggesting it could be a potent barrier in case of any upward retracements.
Beyond this level, the 2nd resistance is located at 158.46. Like the previous resistance, it too is a pullback resistance but corresponds with the 61.80% Fibonacci Retracement, adding further weight to its potential as a significant resistance point.
EUR/GBP:
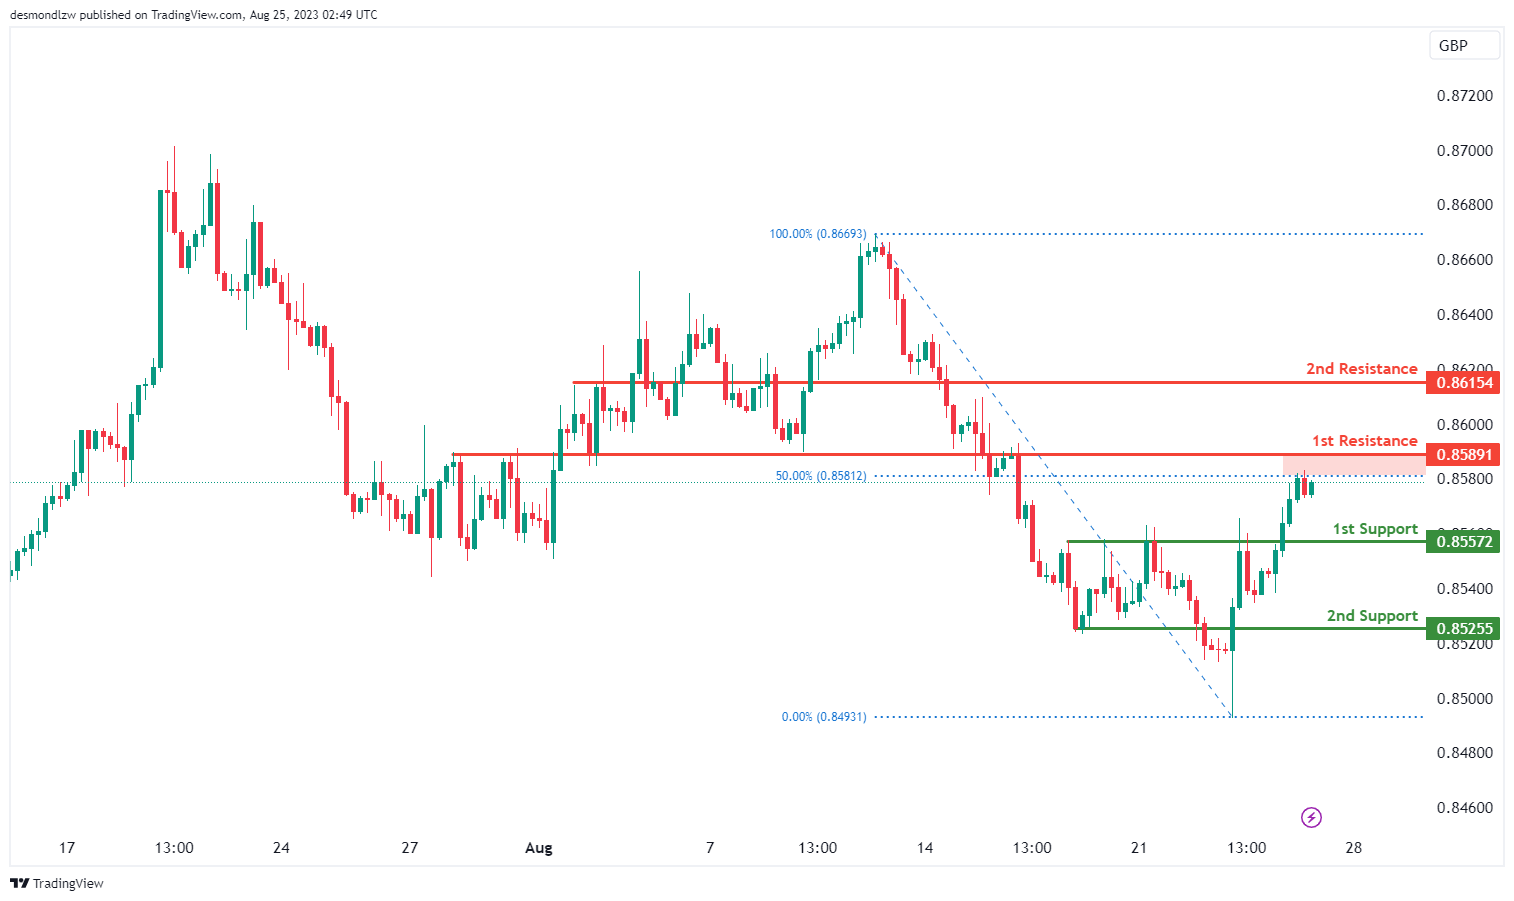
The EUR/GBP currency pair is currently exhibiting a bearish momentum. Given this prevailing downtrend, there’s a potential for a bearish reaction upon hitting the 1st resistance, following which the price might drop towards the 1st support.
The 1st support for the pair is set at 0.8557. This level is identified as a pullback support, suggesting it’s an area where the price could find a cushion or stabilization upon a retracement.
The 2nd support comes in slightly lower at 0.8525, and it too acts as a pullback support, indicating another probable zone of stability in case of further downward movement.
Interestingly, the 1st resistance level coincides with the 1st support, situated at 0.8557. It’s termed as an overlap resistance, highlighting its historical significance as a level where the price has shown previous interactions. This resistance is further emphasized due to its alignment with the 50% Fibonacci Retracement, which can act as a pivotal barrier for price actions.
The 2nd resistance is marked at 0.8615. It is identified as a pullback resistance, indicating a potential halt or slowdown in price upon an upward movement.
GBP/USD:
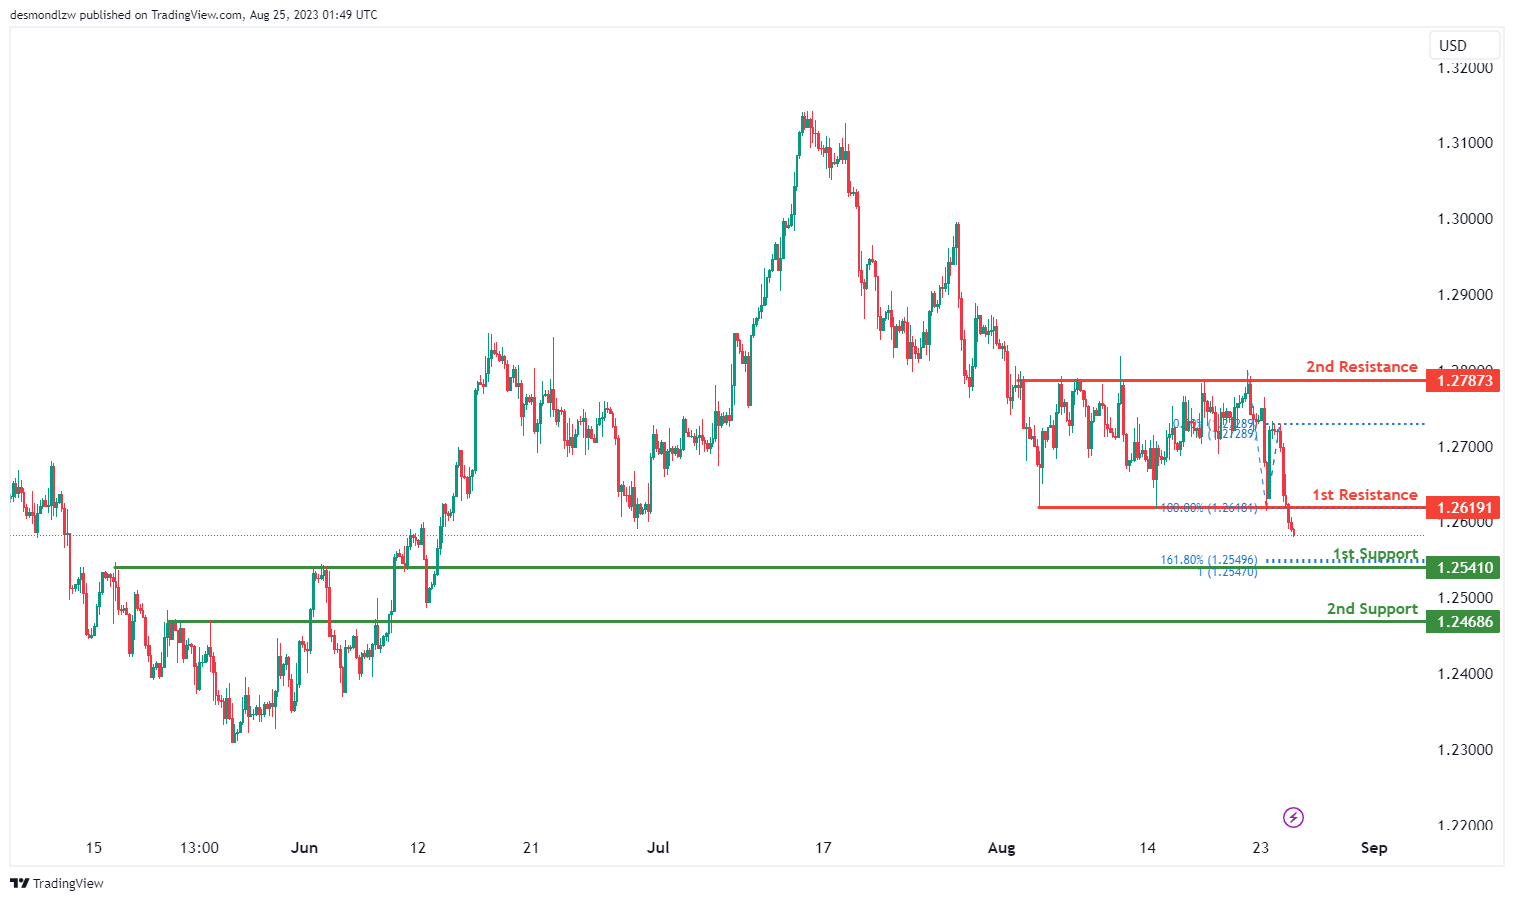
The overall momentum of the GBP/USD chart is bearish, indicating a trend of downward movement. This bearish momentum is supported by the fact that the price is currently positioned in a manner that suggests the potential for further declines.
In the given scenario, there is a possibility that the price could continue its bearish movement, targeting the 1st support level at 1.2541. This support level is notable for its association with a pullback support, as well as the presence of the 161.80% Fibonacci Extension and the 100% Fibonacci Projection. The convergence of these Fibonacci levels further strengthens the significance of this support.
For additional potential support, the 2nd support level at 1.2468 is identified. This level is characterized as a pullback support, which may contribute to a potential bounce in the price.
On the resistance side, the 1st resistance at 1.2619 is recognized as a point of interest. This resistance level is attributed to pullback resistance, suggesting potential hurdles for any upward movement.
Furthermore, the 2nd resistance at 1.2787 holds importance as it aligns with multi-swing high resistance, indicating a historically strong level of resistance.
GBP/JPY:
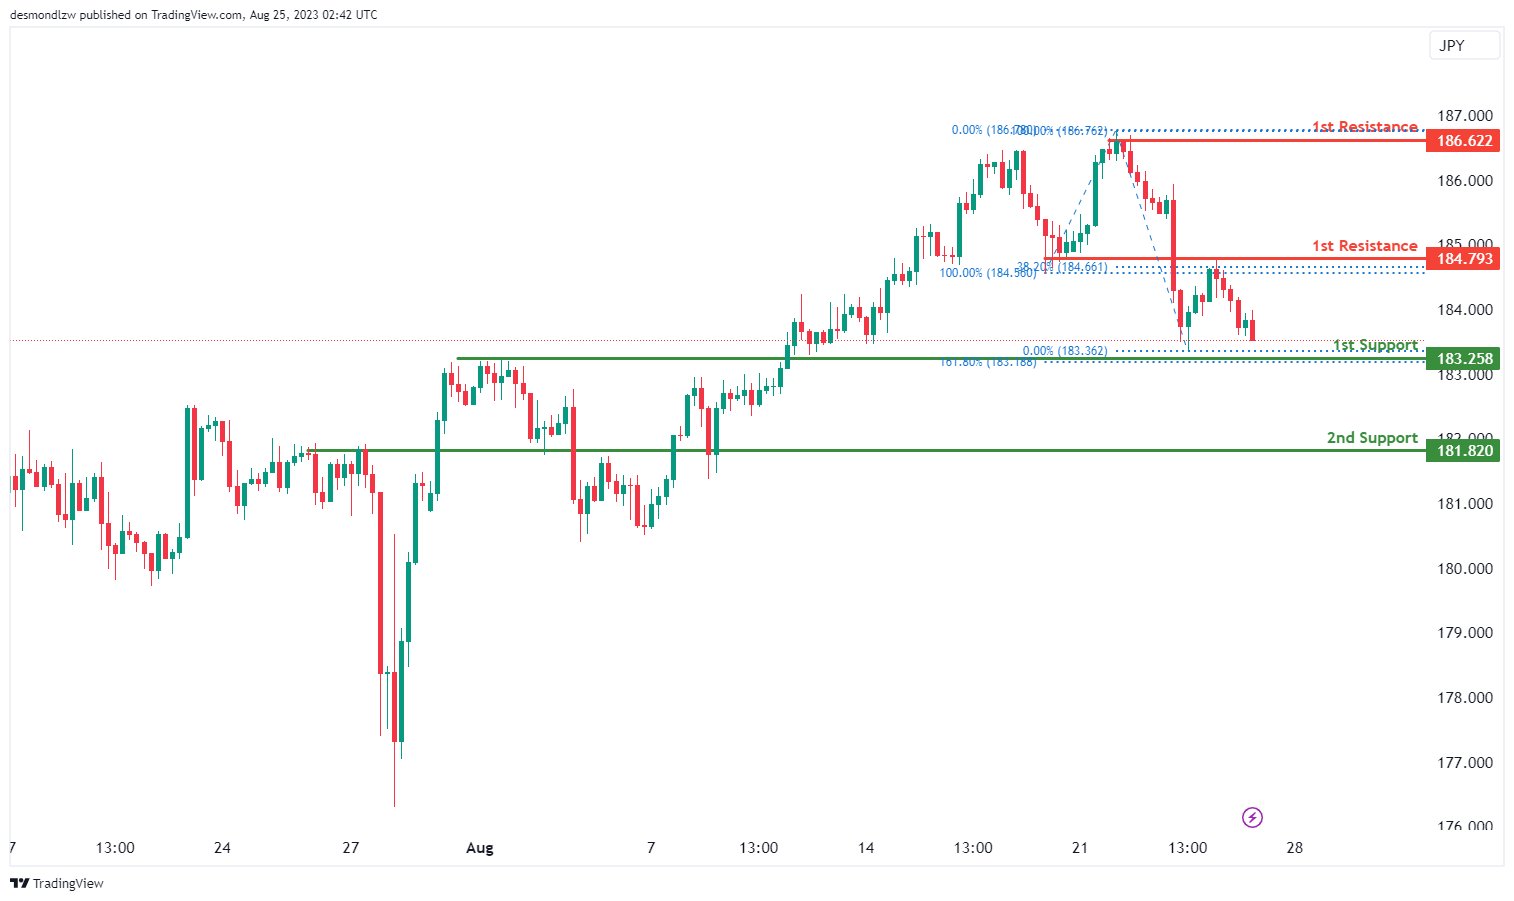
The GBP/JPY pair currently indicates a bearish momentum. However, there’s an expectation for some short-term bullish activity. This involves a potential bullish bounce off the 1st support, leading the price towards the 1st resistance. After reaching this point, there’s anticipation that the price could retract, falling back to the 1st support level.
The 1st support for the pair is anchored at 183.25. This level stands out as an overlap support, signifying its historical relevance where price has previously encountered support. Additionally, this support level is underscored by the 161.80% Fibonacci Extension, making it a potent level to watch.
A bit lower, the 2nd support is situated at 181.82. Similar to the previous one, this is also recognized as an overlap support, which is derived from past price interactions, reinforcing its significance.
On the potential upside, the 1st resistance is marked at 184.79. Acting as a pullback resistance, this level also intersects with the 38.20% Fibonacci Retracement. This indicates that in the event of an upward movement, this could be a strong point of contention for the price.
Further up, the 2nd resistance is located at 186.62. This level is characterized as a multi-swing high resistance, suggesting that it has been a significant barrier during multiple price swings in the past.
USD/CHF:
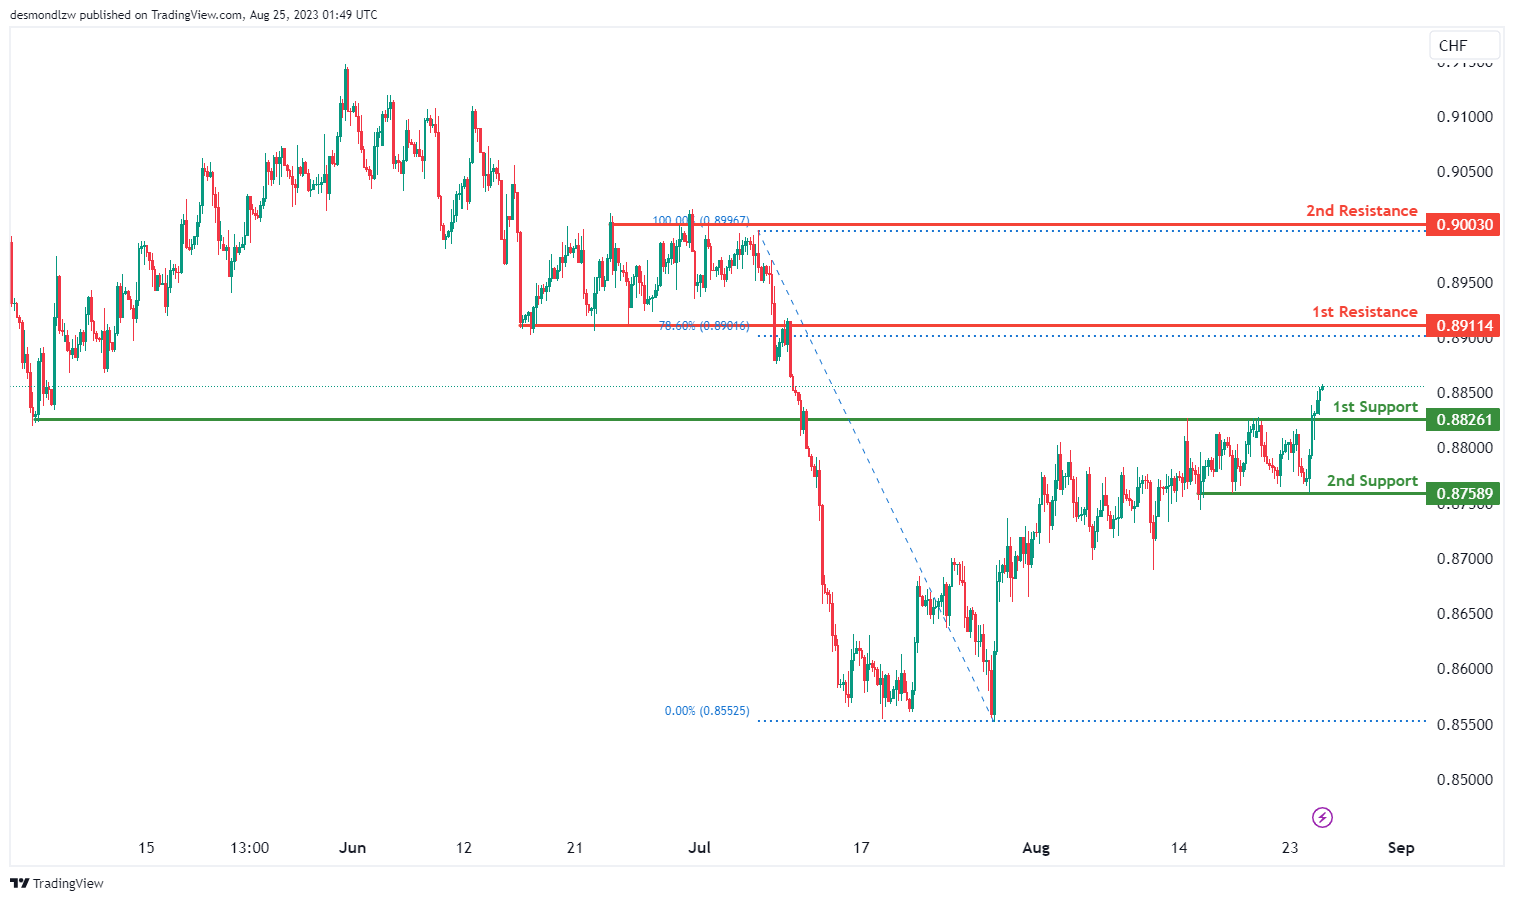
The USD/CHF pair currently showcases a bullish trend. Given this upward momentum, there’s a potential for a bullish continuation towards the specified resistances.
The 1st support for the pair lies at 0.8826, recognized as a pullback support. This indicates that should there be any minor retracements or downward movement, this level might act as a cushion.
Following this, the 2nd support is positioned at 0.8758. Its significance is accentuated by its history as a multi-swing low support, making it a potential region where the price could find substantial support.
On the upward trajectory, the 1st resistance is pinpointed at 0.8911. This level serves as an overlap resistance, suggesting that past price action has interacted with this level, potentially making it a challenging point for the price to surpass.
Above this, the 2nd resistance stands at 0.9003. Its importance stems from its designation as a multi-swing high resistance, marking it as a notable hurdle for any continued bullish moves.
USD/JPY:
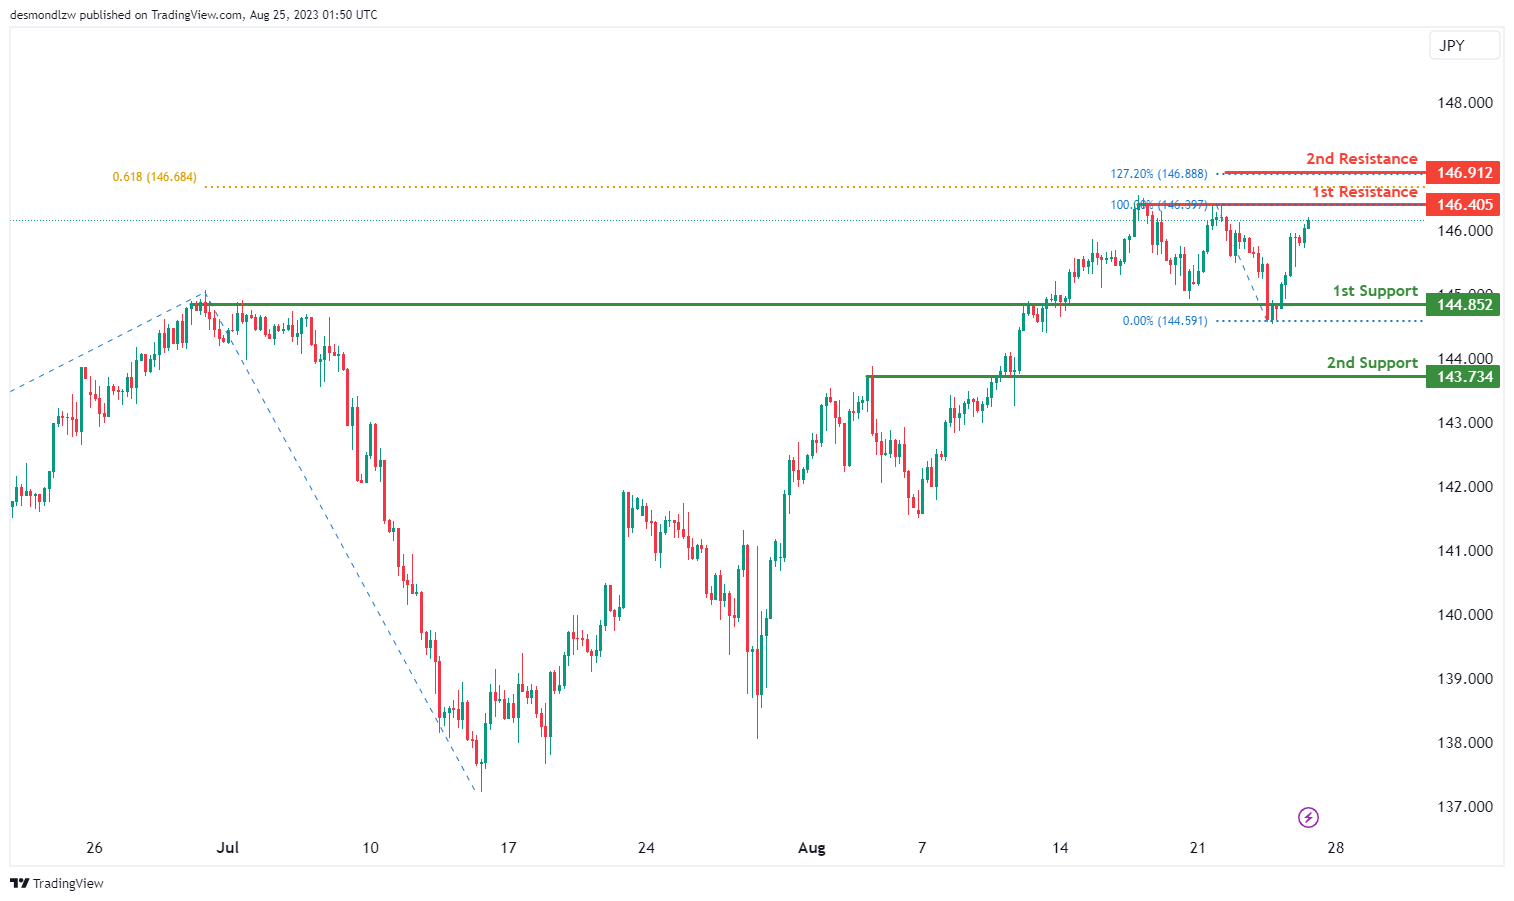
The USD/JPY is displaying a bullish momentum at present. Given this positive trend, there’s an anticipation for a continued upward move towards the identified resistance levels.
The 1st support for the pair is found at 144.85 and is characterized as a pullback support. This means in the event of any short-term retracements, this level could offer a significant point of stability.
The 2nd support comes in at 143.73 and is deemed an overlap support. Overlap supports often have historical significance where the price has interacted multiple times, providing a sturdy base for potential rebounds.
On the bullish front, the 1st resistance is set at 146.40, acting as a pullback resistance. This could be a point where the price might face some resistance, given the pullback characteristics.
Above this level, the 2nd resistance stands tall at 146.91. This resistance is especially notable due to its alignment with the 127.20% Fibonacci Extension, which often serves as crucial pivot points in the market.
USD/CAD:
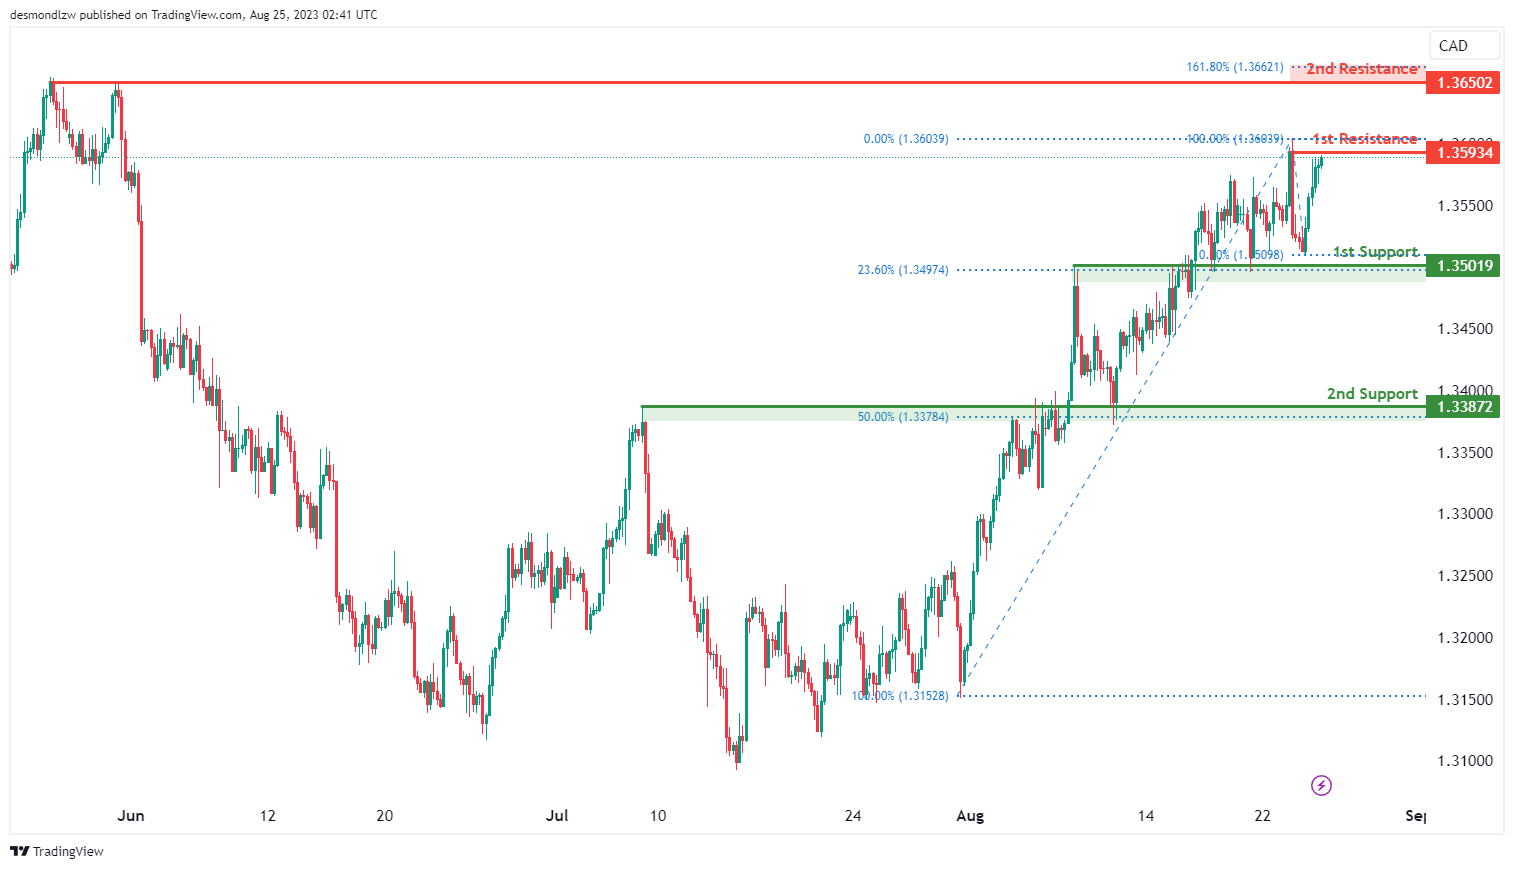
The USD/CAD chart is currently demonstrating a bullish momentum. One of the salient indicators reinforcing this trend is the potential for the price to not only approach but to break through the 1st resistance and then make its way towards the 2nd resistance.
The 1st resistance at 1.3593 is identified as a swing-high resistance while the 2nd resistance at 1.3650 is identified as a multiple swing-high resistance that aligns close to the 161.80% Fibonacci extension level, acting as a potential formidable upside barrier.
The 1st support level at 1.3502 is identified as an overlap support that aligns with the 23.60% Fibonacci retracement level. Furthermore, the 2nd support at 1.3387 is also identified as another overlap support that aligns with the 50.00% Fibonacci retracement level.
AUD/USD:
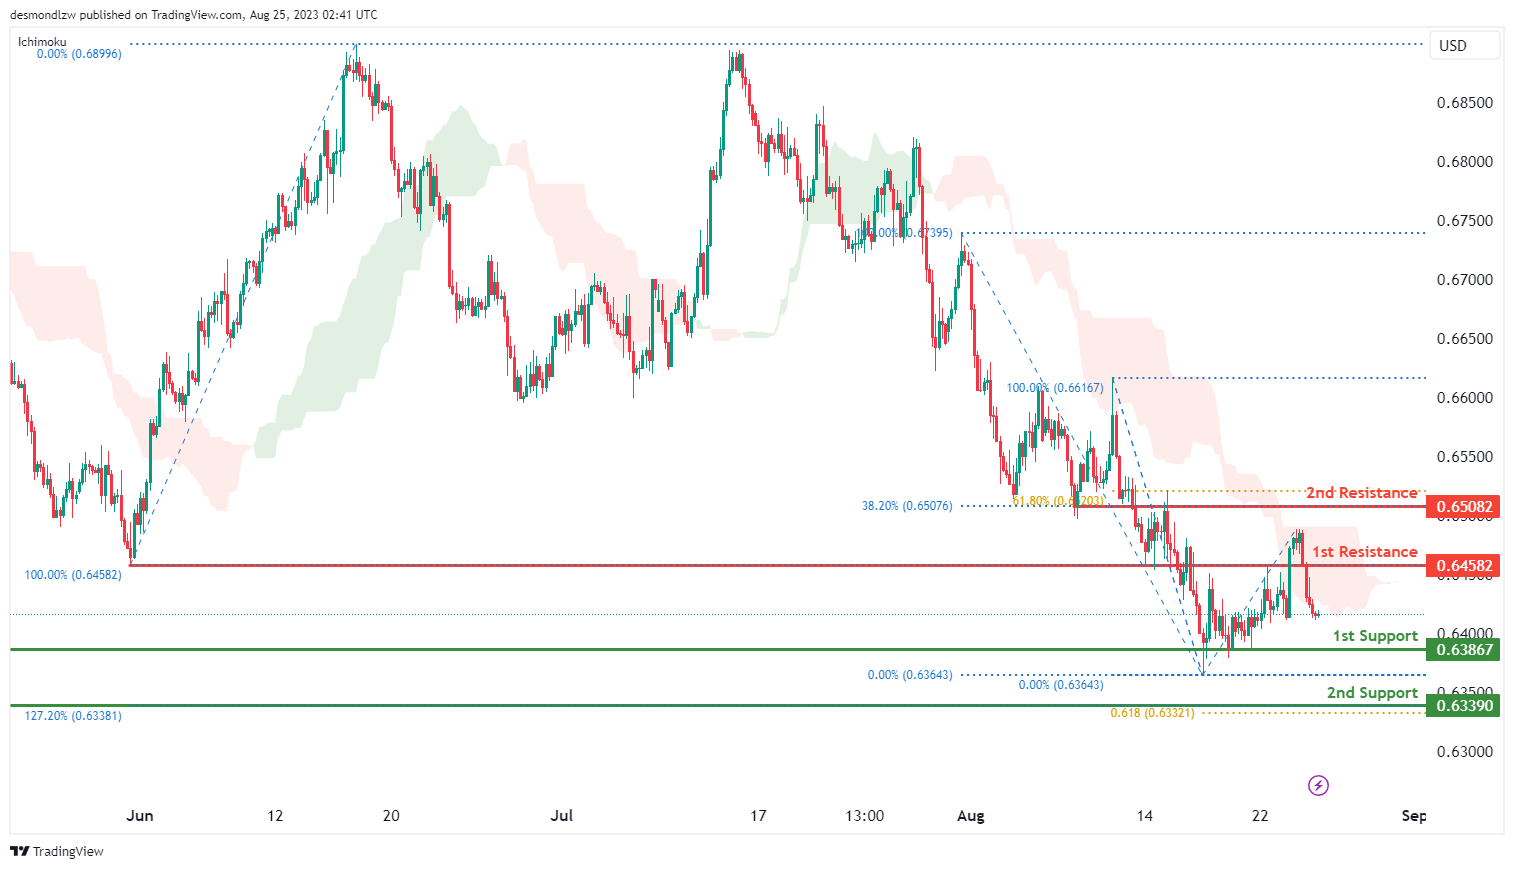
The AUD/USD chart is currently displaying a bearish trend, primarily driven by its position below the bearish Ichimoku cloud. This positioning usually indicates a potential for further downside movement.
The 1st support level at 0.6387 is identified as an overlap support. The 2nd support level at 0.6339 is identified as a pullback support that aligns with a confluence of Fibonacci levels i.e. the 61.80% projection and the 127.20% extension levels, bolstering the significance of this support level.
To the upside, the 1st resistance level at 0.6458 is identified as an overlap resistance. Furthermore, the 2nd resistance level at 0.6508 is also identified as an overlap resistance that aligns with a confluence of Fibonacci levels i.e. the 38.20% and 61.80% retracement levels, suggesting that this level could act as a significant resistance.
NZD/USD
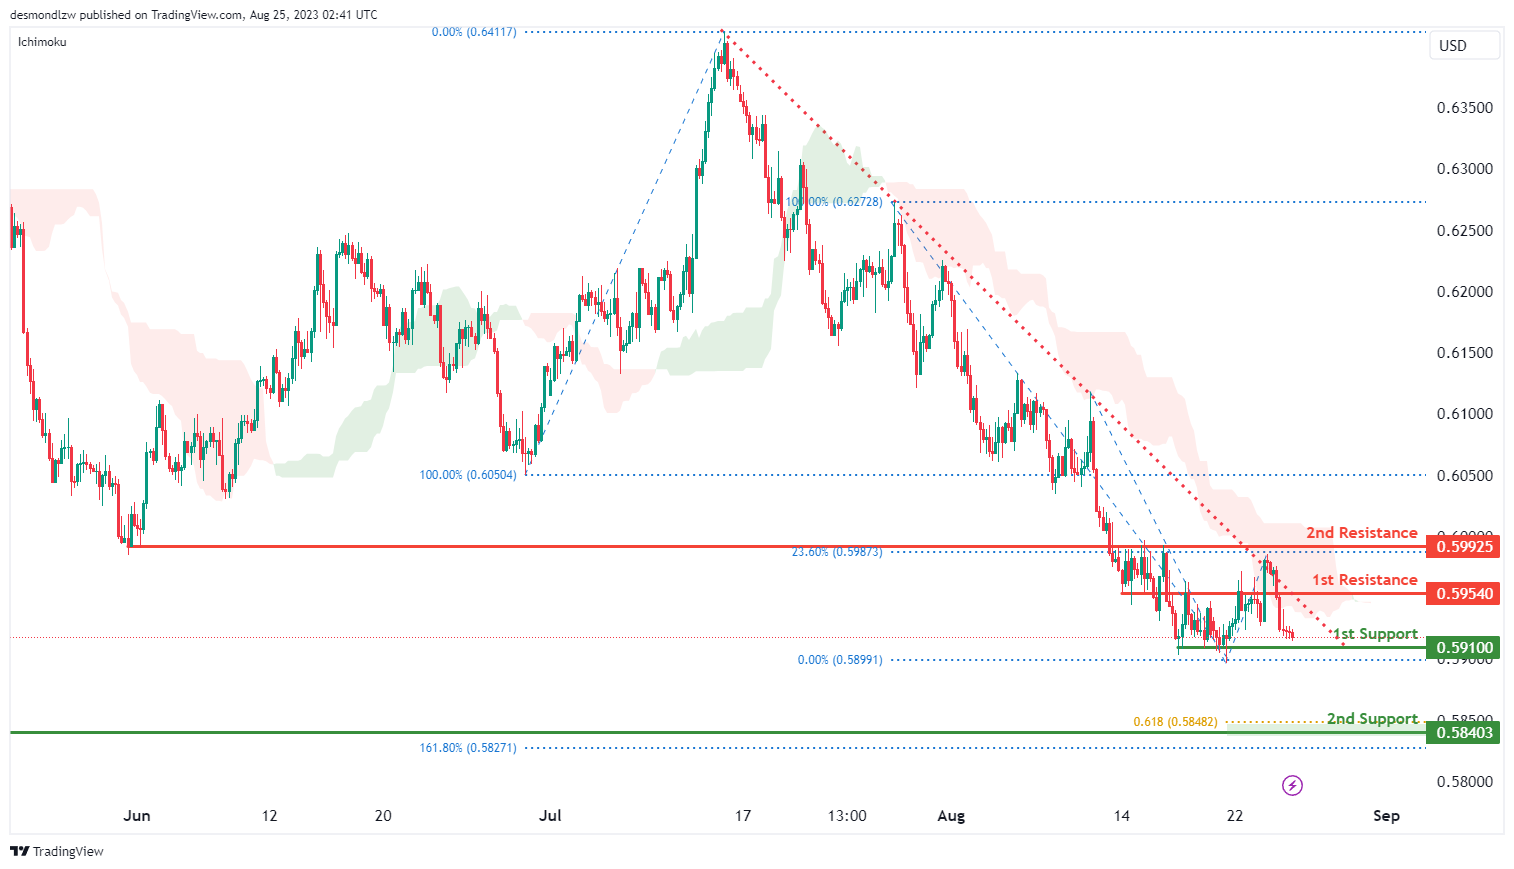
The NZD/USD chart currently demonstrates a bearish momentum. A significant factor underscoring this trend is its position below the bearish Ichimoku cloud, often indicative of further potential downside. There is potential for price to continue its downward trajectory towards the 1st support level.
The 1st support level at 0.5910 is identified as a multiple swing-low support. The 2nd support level at 0.5840 is identified as a pullback support that aligns with a confluence of Fibonacci levels i.e. the 61.80% projection and the 161.80% extension levels.
To the upside, the 1st resistance at 0.5954 is identified as an overlap resistance. Furthermore, the 2nd resistance at 0.5993 is also identified as an overlap resistance that aligns with the 23.60% Fibonacci retracement level.
DJ30:
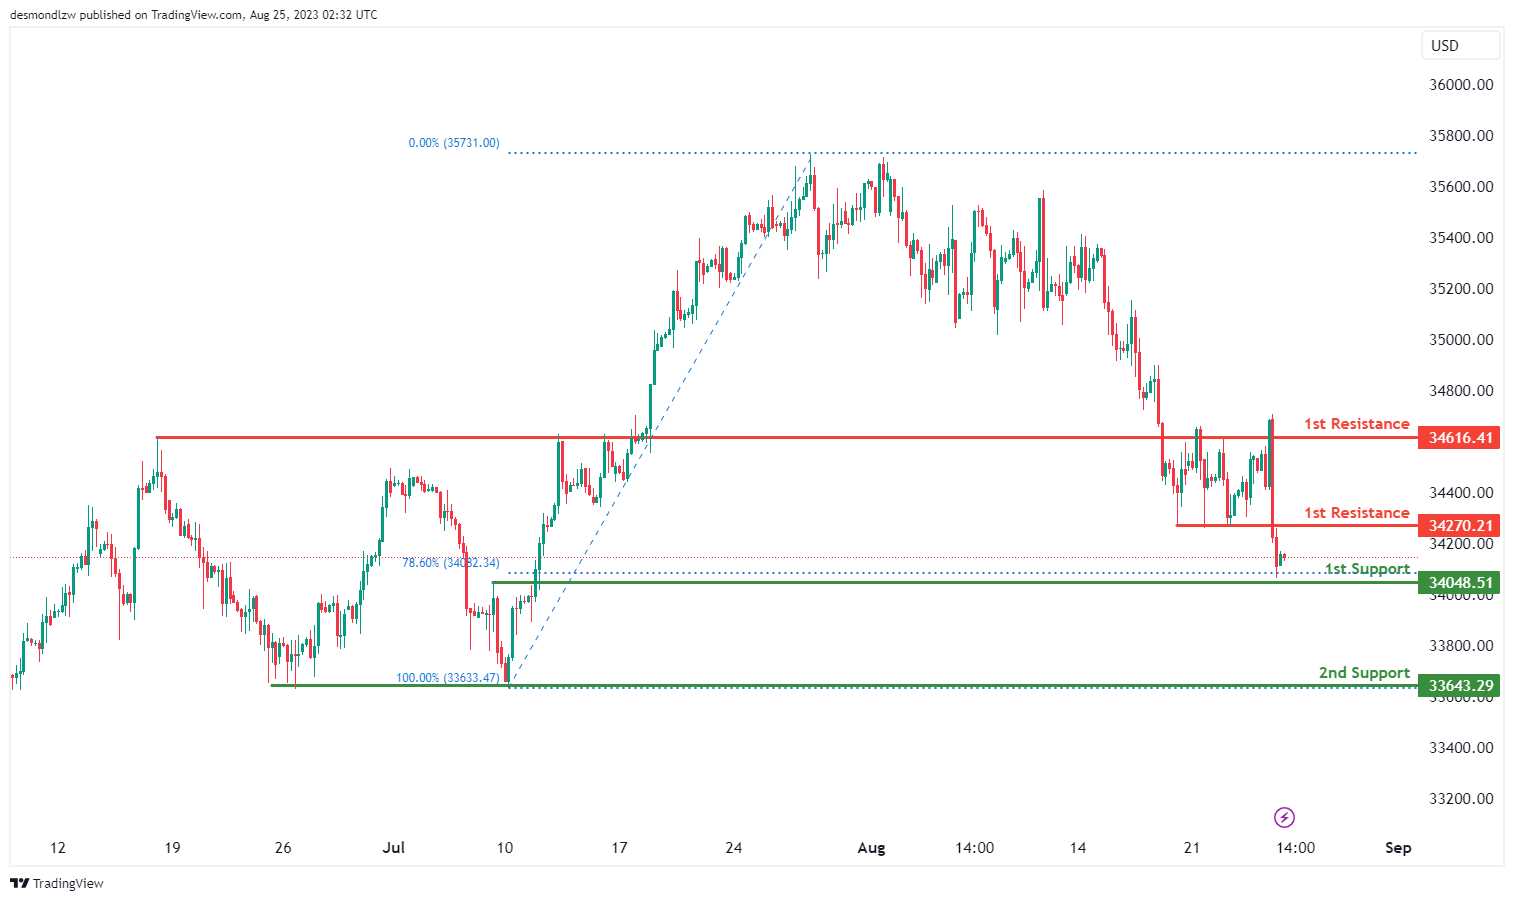
The DJ30 (often referred to as the Dow Jones Industrial Average) is demonstrating a bearish trend as per the given data. In the short-term, the market may react bearishly when it touches the 1st resistance, pushing prices to descend towards the 1st support.
The 1st support is identified at 34048.51. This particular level is characterized as an overlap support. Overlap supports are typically derived from previous areas where the price has found stability or a halt in its decline.
Further down, the 2nd support rests at 33643.29. This is recognized as a multi-swing low support, indicating that during several price actions in the past, this level has consistently acted as a strong foundation, preventing further price declines.
In terms of upward barriers, the 1st resistance is pegged at 34270.21. This level is marked as an overlap resistance, suggesting its historical significance in preventing an upward price movement.
Moving further up, the 2nd resistance is noted at 34616.41. Similarly, it’s highlighted as an overlap resistance, emphasizing its potential role in capping any significant bullish price actions.
GER30:
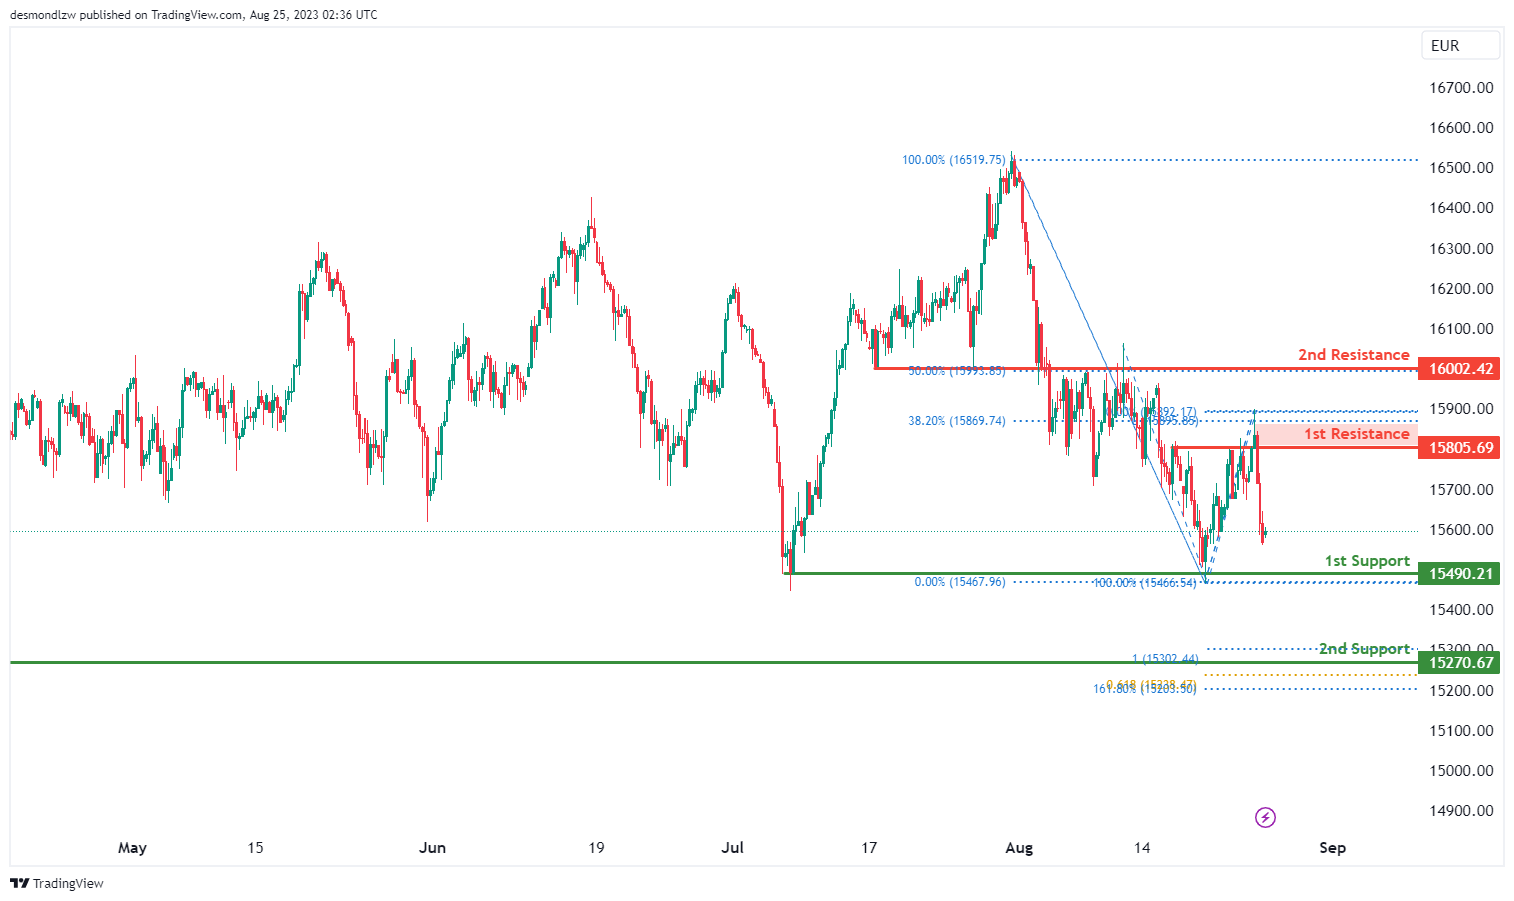
The GER30 (often known as the DAX 30) is exhibiting a bearish momentum based on the provided data. There’s an anticipation for a bearish continuation, which means the index might further decline towards its 1st support level in the near term.
The 1st support for GER30 is pinpointed at 15490.21. This support level has been identified as a multi-swing low support. Such supports are derived from multiple past instances where the price halted its downward movement and even reversed, signaling its crucial role in preventing further declines.
A bit deeper, the 2nd support stands at 15270.67. It’s recognized as a swing low support. Furthermore, it aligns with the 100% Fibonacci Projection, adding more weight to its importance as a potential floor for price declines.
On the potential upward trajectory, the 1st resistance is observed at 15805.69. This resistance point is seen as a multi-swing high resistance, which means it has acted as a ceiling in several past price movements. Additionally, it’s highlighted by the 38.20% Fibonacci Retracement, which indicates a possible retracement level from a previous price movement.
Moving higher, the 2nd resistance is marked at 16002.42. It’s identified as an overlap resistance. This kind of resistance is derived from areas where the price previously encountered hurdles. Further reinforcing its importance is the 50% Fibonacci Retracement, which can act as a key level of interest for traders.
US500
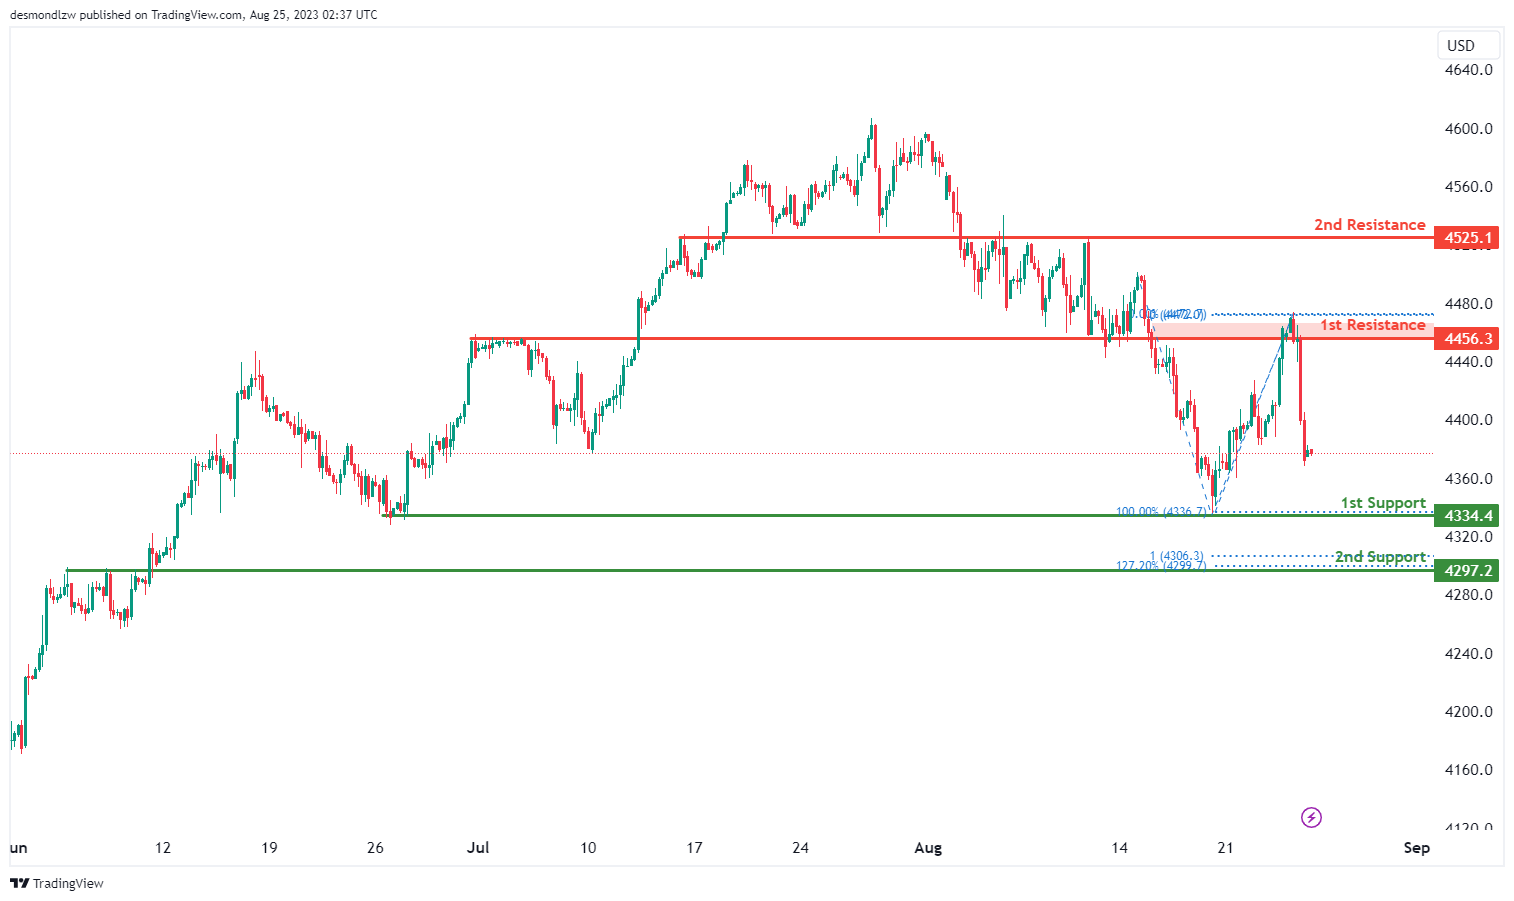
The overall momentum of the US500 (S&P 500) chart is currently bearish, indicating a prevailing trend of downward movement. In this context, there is a possibility that the price could continue its bearish trajectory, with potential levels of support and resistance highlighted for consideration.
The 1st support level at 4334.4 is identified as a point where the price might find some stabilization. This support level is significant due to its association with an overlap support, suggesting that historical price action has demonstrated strength around this level.
Additionally, the 2nd support at 4297.2 holds importance, as it coincides with an overlap support and the 127.20% Fibonacci Extension. The presence of the Fibonacci Extension further reinforces the potential significance of this support level.
On the resistance side, the 1st resistance level at 4456.3 is recognized as an area where the price may encounter obstacles. This resistance level is characterized by an overlap resistance, indicating that historical price action has shown resistance around this level.
Furthermore, the 2nd resistance at 4525.1 is noted as another potential barrier for upward movement. This resistance level is categorized as an overlap resistance, further emphasizing its potential significance.
BTC/USD:
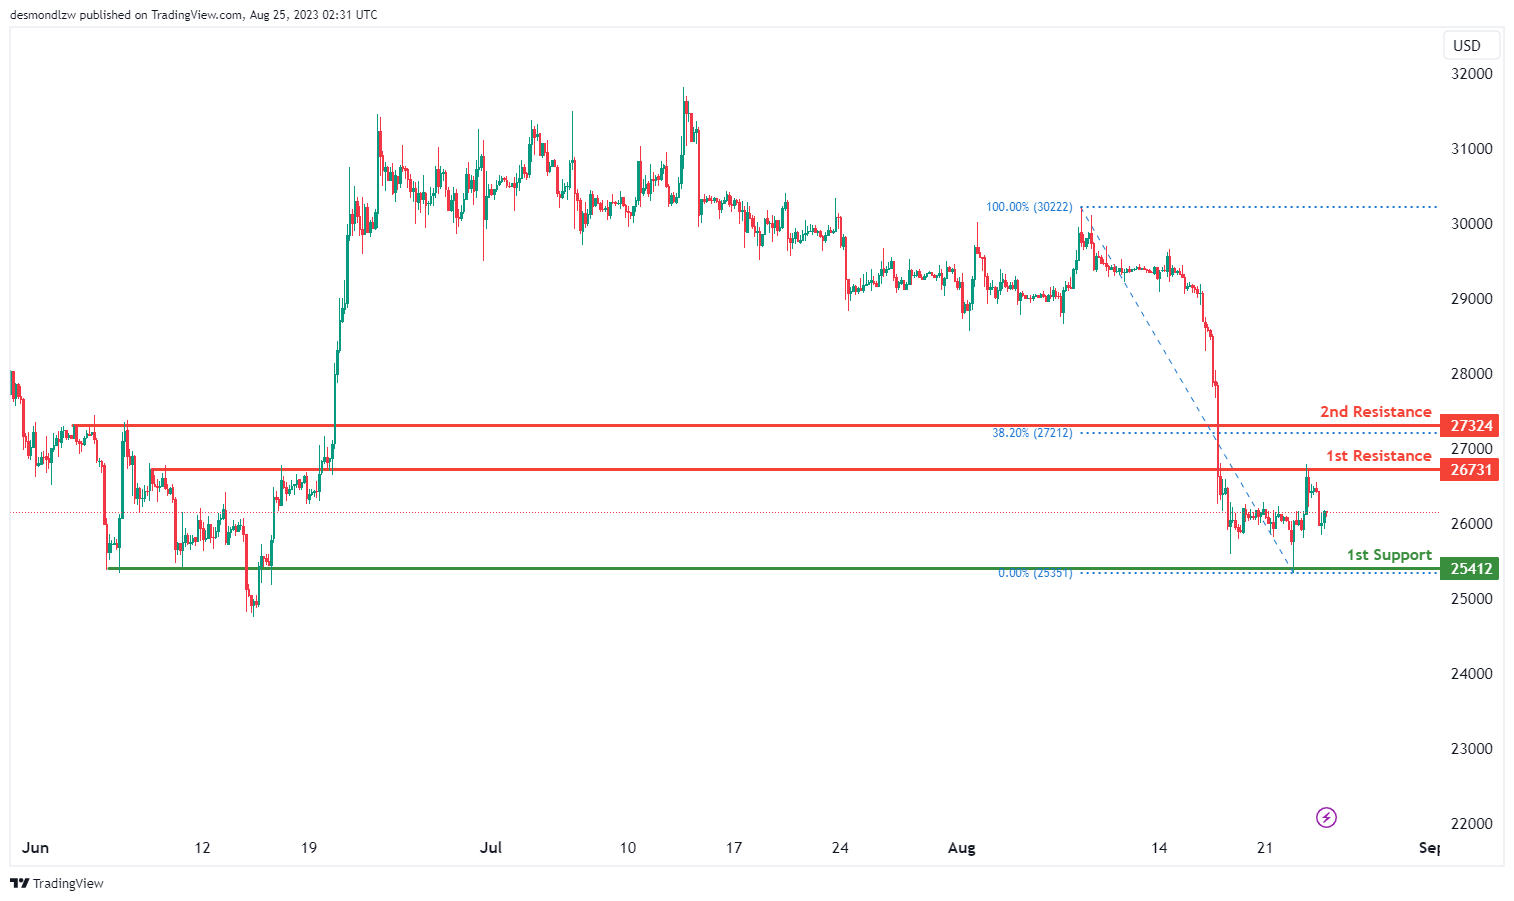
The BTC/USD chart is currently demonstrating a neutral trend. It is anticipated that the price might fluctuate between the 1st resistance and 1st support levels.
The 1st support level at 25,412 is identified as a pullback support, suggesting it’s a key point at which price could find support once more.
To the upside, the 1st resistance at 26,731 is identified as a pullback resistance while the 2nd resistance at 27,324 is also identified as a pullback resistance that aligns with the 38.20% Fibonacci retracement level.
ETH/USD:
The ETH/USD chart is currently exhibiting a neutral trend and price is projected to fluctuate between the 1st resistance and 1st support levels.
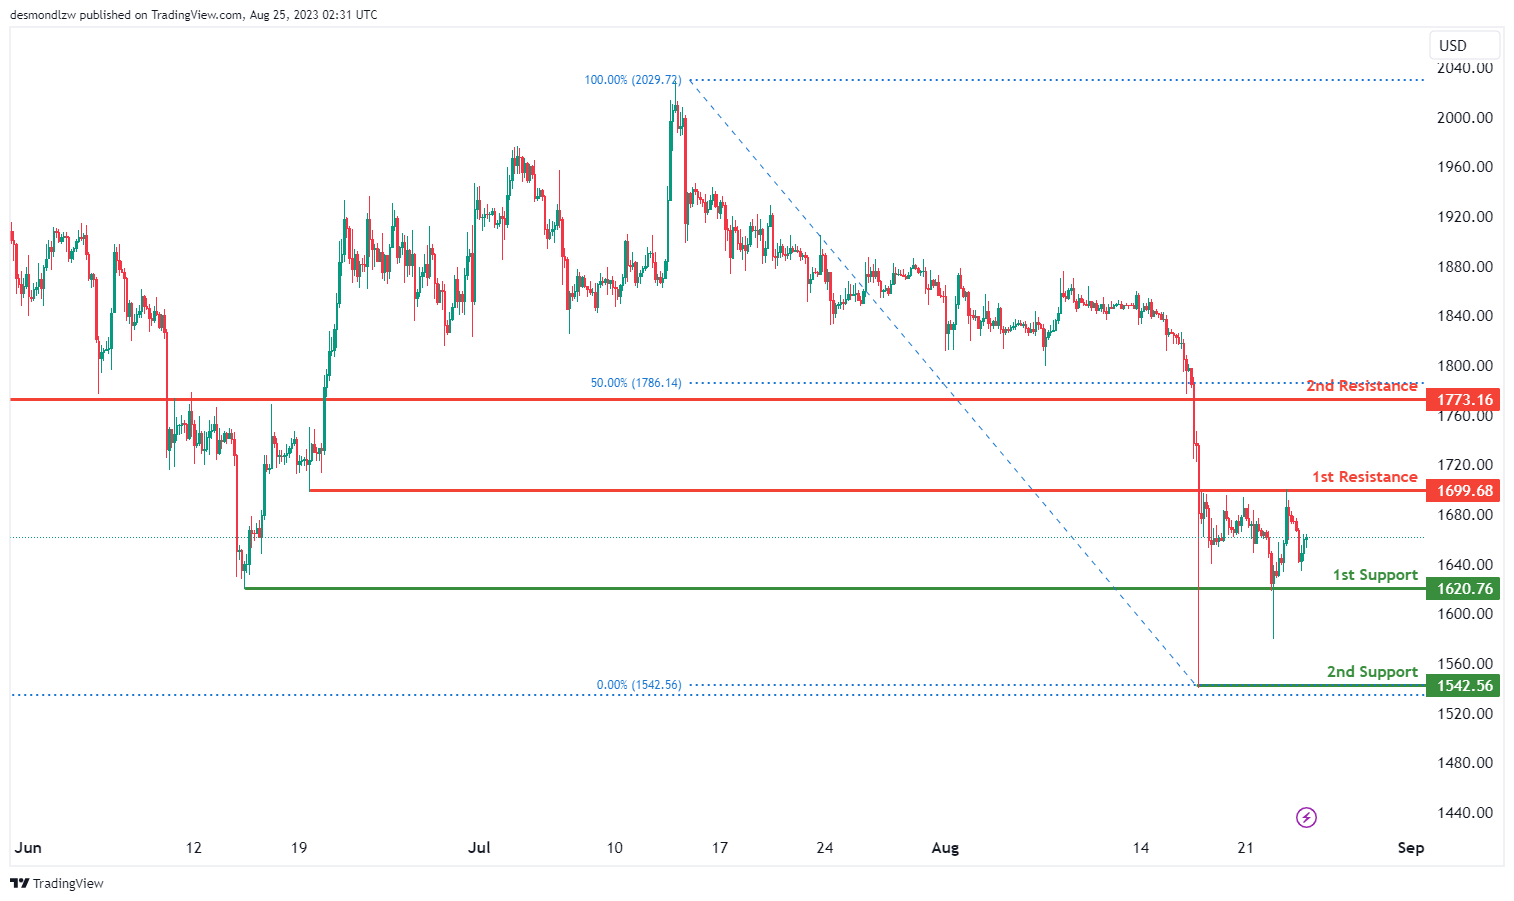
The 1st support level at 1,620.76 is identified as a multiple swing-low support while the 2nd support at 1,542.56 is identified as a swing low support. This indicates it is another historically significant level where price has found support in the past.
To the upside, the 1st resistance at 1,699.68 is identified as an overlap resistance while the 2nd resistance at 1,773.16 is also identified as an overlap resistance that aligns with the 50.00% Fibonacci retracement level.
WTI/USD:
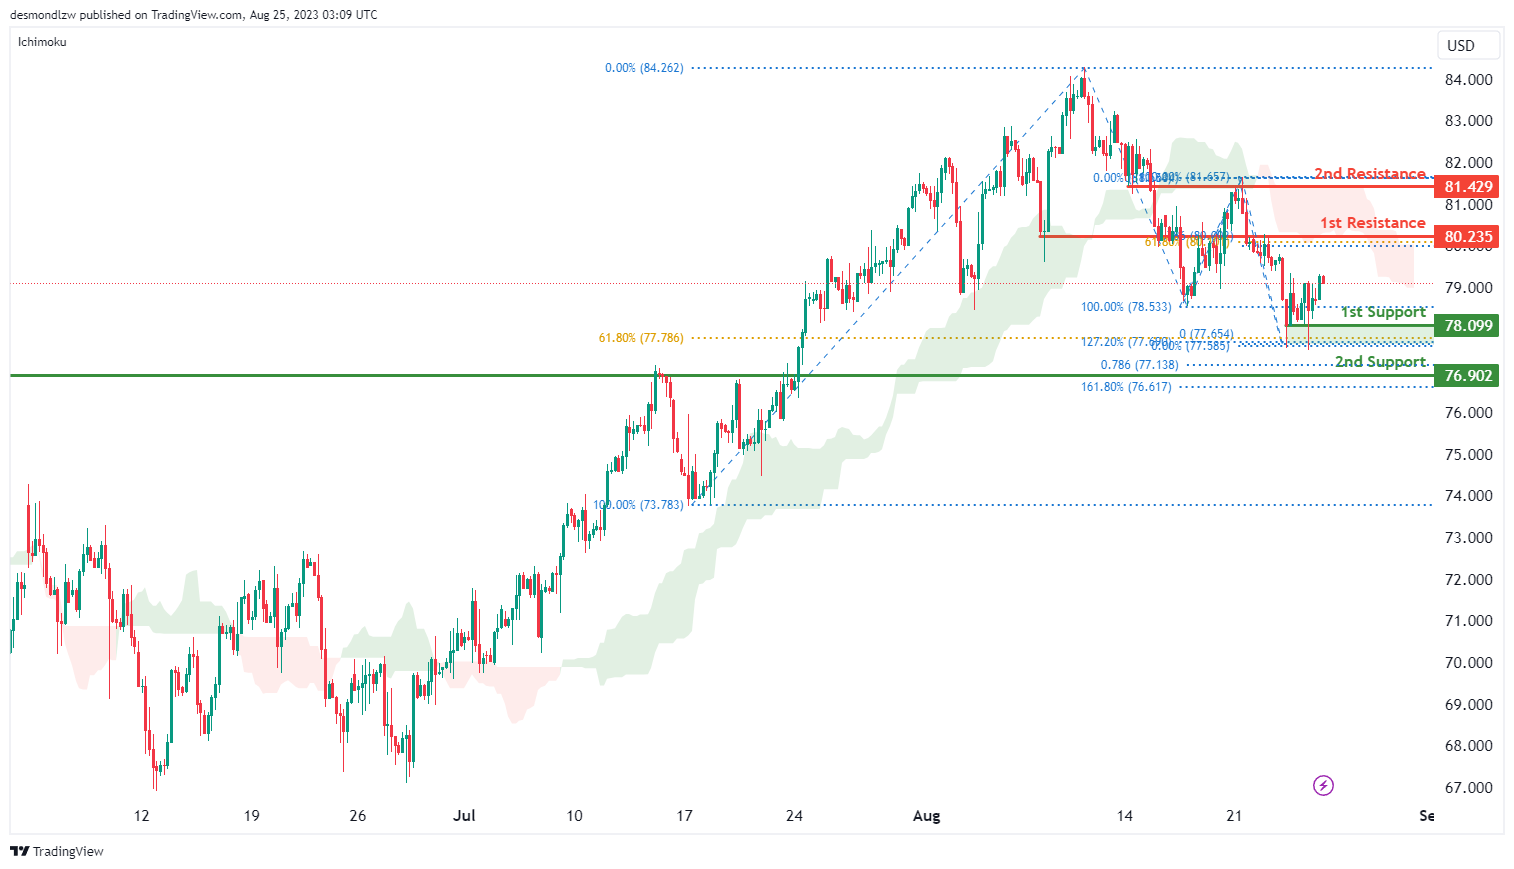
The WTI (West Texas Intermediate) chart is currently displaying a bearish momentum. One significant factor contributing to this trend is the price positioning below the bearish Ichimoku cloud, often suggesting potential further downside. There is potential for price to make a continued downward movement towards the identified support levels.
The 1st support level at 78.10 is identified as a multiple swing-low support that coincides with a confluence of Fibonacci levels i.e. the 61.80% retracement and the 127.20% extension levels, offering a stronger foundation as a potential support zone.
In addition, the 2nd support level at 76.90 is identified as an overlap support that also aligns with a confluence of Fibonacci levels i.e. the 161.80% extension and the 78.60% projection levels.
To the upside, the 1st resistance at 80.24 is identified as an overlap resistance characteristic that aligns with the 61.80% Fibonacci retracement level. Furthermore, the 2nd resistance level at 81.43 is also identified as an overlap resistance.
XAU/USD (GOLD):
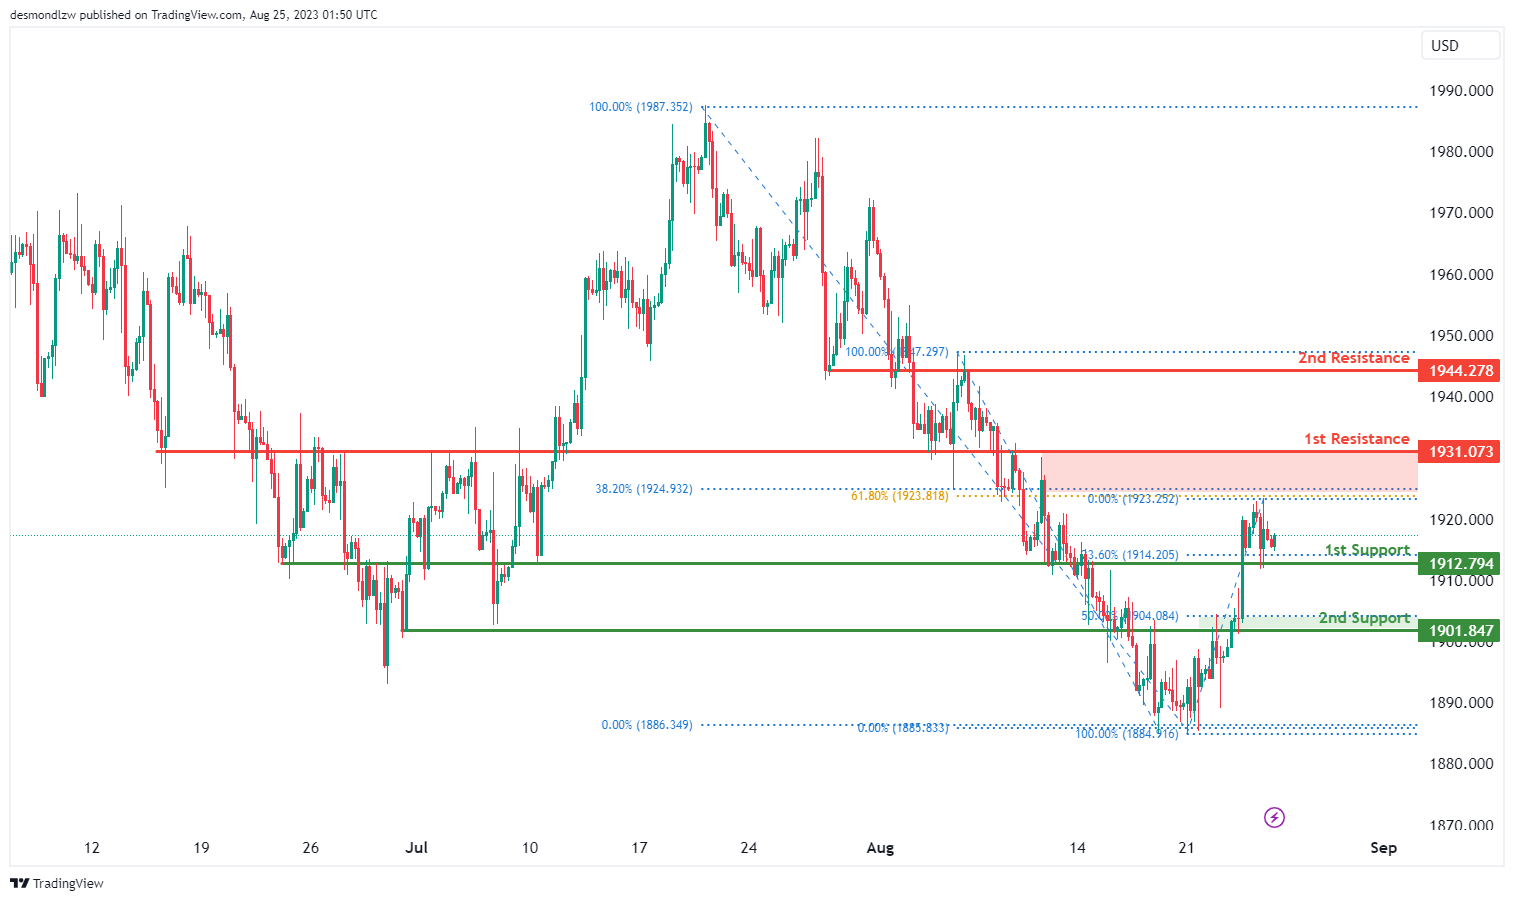
The XAUUSD, which represents the Gold spot price in US Dollars, currently indicates a bullish trend. Given this upward momentum, there’s a strong possibility of a bullish continuation towards the specified resistance levels.
The 1st support for XAUUSD lies at 1912.79. This level is significant due to its classification as an overlap support, coupled with its alignment with the 23.60% Fibonacci Retracement. Overlap supports often represent levels where the price has shown historical interactions, and in conjunction with a Fibonacci level, its significance is further enhanced.
The 2nd support is pegged at 1901.84. This level stands out not only as a multi-swing low support but also coincides with the 50% Fibonacci Retracement, adding to its importance as a potential stabilization point in case of a pullback.
On the upside, the 1st resistance is set at 1931.07. This level acts as an overlap resistance and also shows a Fibonacci confluence, specifically with the 61.80% and 38.20% Fibonacci Retracements. Such confluences often act as robust barriers or pivot points in the market, suggesting a potential area of contention for the upward price movement.
Further ahead, the 2nd resistance is positioned at 1944.27, which also serves as an overlap resistance, indicating another potential challenge for the bullish momentum.
GBP/USD Daily Outlook
Daily Pivots: (S1) 1.2551; (P) 1.2640; (R1) 1.2689; More...
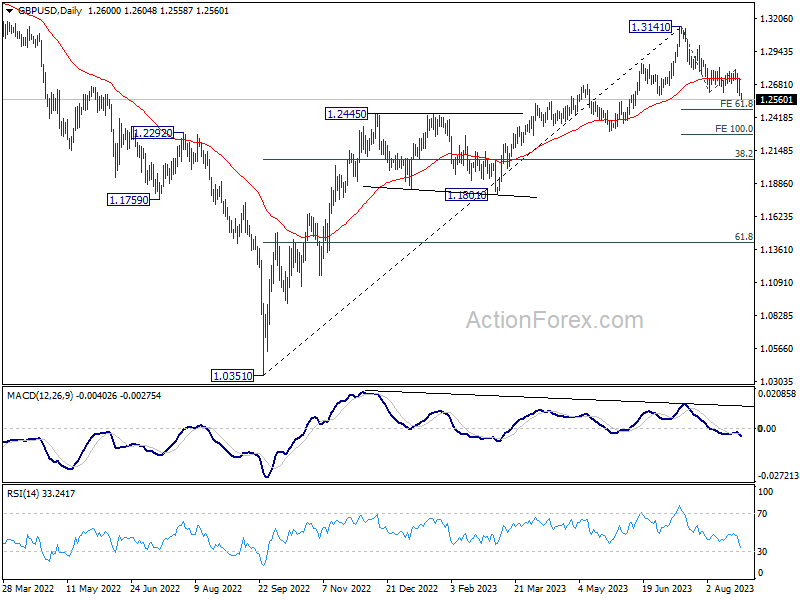
GBP/USD's fall from 1.3141 resumed and intraday bias is back on the downside. Next target is 61.8% projection of 1.3141 to 1.2618 from 1.2799 at 1.2476. Firm break there could prompt downside acceleration to 100% projection at 1.2276. On the upside, break of 1.2799 resistance is needed to confirm completion of the decline. Otherwise, near term outlook will stay bearish in case of recovery.
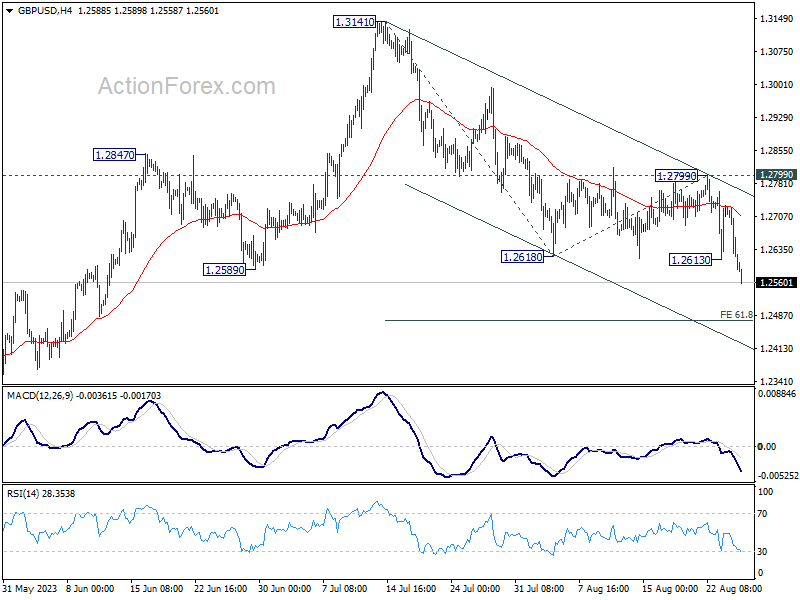
In the bigger picture, for now, fall from 1.3141 medium term top is seen as a correction to up trend from 1.0351 (2022 low). Deeper decline would be seen to 38.2% retracement of 1.0351 to 1.3141 at 1.2075. Strong support would be seen there to bring rebound on first attempt. But outlook will be neutral at best as long as 1.3141 resistance holds, and consolidation from there is set to extend, until further development.
Dollar Soars Amidst Market Jitters; Fed Powell and ECB Lagarde Remarks to Shape Market Outlook
A shift in market sentiment rattled investors as the optimism spurred by Nvidia was short-lived. DOW experienced its most severe daily slump since March overnight, while S&P 500 and NASDAQ posted their largest one-day drops since early August. This change in market dynamics played into the hands of Dollar, which surged, hitting weekly highs against major European currencies due to heightened risk aversion.
Attention is now pivoting to Jackson Hole Symposium, where Fed Chair Jerome Powell's introductory remarks are eagerly anticipated. While no explicit insights are expected concerning Fed's upcoming September meeting, stakeholders are keen on gauging how Powell will straddle discussions about diverging trends in easing prices and wages, versus strong consumer spending and services inflation. Following Powell's address, the financial community will be tuning into ECB President Christine Lagarde's luncheon address, as well as the panel discussion that features luminaries like BoE Deputy Governor Ben Broadbent and BoJ Governor Kazuo Ueda.
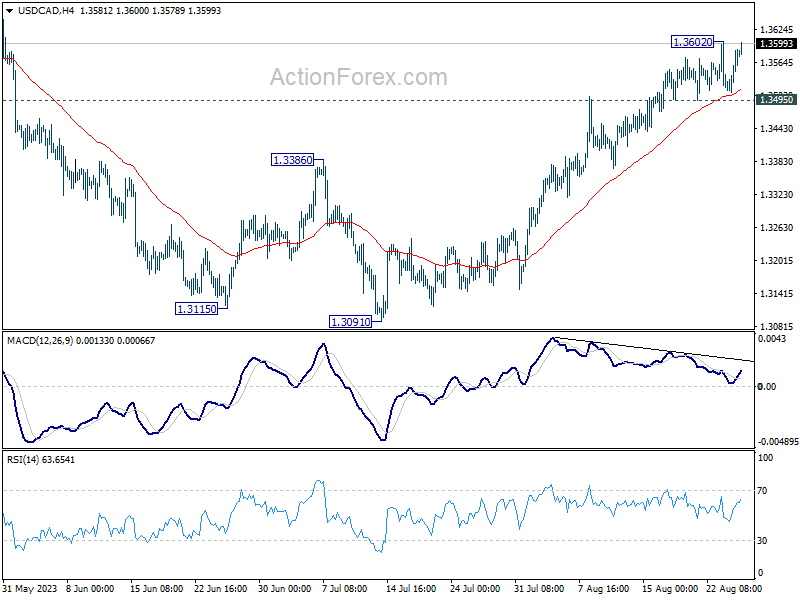
Technically, Dollar displayed notable strength in breaking firmly through 1.0801 temporary low in EUR/USD and 1.2613 temporary low in GBP/USD. Now, focuses will be on 146.55 temporary top in USD/JPY, 1.3602 temporary top in USD/CAD, and 0.6363 support in AUD/USD. Decisive break of there level will confirm the underlying bullish momentum in the greenback.
In Asia, at the time of writing, Nikkei is down -1.97%. Hong Kong HSI is down -1.12%. China Shanghai SSE is down -0.45%. Singapore Strait Times is up 0.04%. Japan 10-year JGB yield is down -0.0284 at 0.649. Overnight, DOW dropped -1.08%. S&P 500 dropped -1.35%. NASDAQ dropped -1.87%. 10-year yield rose 0.037 to 4.235.
Fed Collins: Be patient and not get ahead of data
Boston Fed President, Susan Collins, offered a cautionary stance on the current monetary policy trajectory in her latest remarks. Addressing the possibility of further rate hikes, Collins noted yesterday, "We may be near, we could even be at a place where we would hold" and not lift rates further.
While not ruling out the possibility of future hikes, Collins emphasized a measured approach, stating, "But certainly additional increments are possible, and we need to look holistically and be really patient right now and not try to get ahead of what the data will tell us as it unfolds."
On the topic of inflation, Collins expressed her confidence in the Federal Reserve's capabilities, saying she is "hopeful Fed can bring inflation back to 2% in a reasonable amount of time."
However, she cautioned against making premature judgments about potential rate cuts, remarking it's "premature to send a clear signal about the timing of rate cuts."
Fed Harker: We've probably done enough
Philadelphia Fed President, Patrick Harker, shared his insights on the current stance of Fed's monetary policy. Addressing the topic of monetary tightening, Harker said yesterday, "Right now, I think that we've probably done enough because we have two things going on."
Elaborating further, Harker mentioned the twin pillars that have influenced his perspective: "The Fed funds rate increases — they are at a restrictive level, so let's keep them there for a while. And also we are continuing to shrink our balance sheet that is also removing accommodation."
Looking to the future, Harker emphasized a data-driven approach, noting, "I see us staying steady throughout the rest of this year, next year is data driven." When prompted about the potential timing of a rate cut, he candidly stated, "Can't predict when Fed will cut rates."
ECB's Nagel: Too early to think about a pause
ECB Governing Council member Joachim Nagel, in remarks made yesterday, reinforced his stance on the ongoing monetary tightening efforts of the central bank. Addressing speculations around a potential pause, he firmly stated, "It's for me much too early to think about a pause," emphasizing the significant gap between the current inflation rate and ECB's target.
Nagel pointed out the glaring disparity between the present inflation situation and ECB's benchmark, saying, "We shouldn't forget inflation is still around 5%. So this is much too high. Our target is 2%. So there's some way to go."
Despite the overarching concern regarding a slowdown in economic activity in Eurozone, Nagel highlighted the persistence of core inflation and characterized the labor market as being "really pretty good."
Dismissing prevalent narratives surrounding Germany's economic health, he countered, "I hear a lot of talk about Germany, the sick man of Europe. This is definitely not the case." Concluding on an optimistic note, Nagel added, "I'm still pretty optimistic that we will have a soft landing."
ECB's Vujcic: Whether we are in a restrictive-enough territory remains to be seen
ECB Governing Council member Boris Vujcic acknowledged the restrictive nature of the ECB's present stance. However, he tempered this by highlighting the uncertainty that remains, suggesting that the real test of the bank's approach lies ahead.
"Whether we are in a restrictive-enough territory remains to be seen. And this is something that you will only see from the inflation data that will come in the next prints," he emphasized.
Despite indications of a cooling economic activity, Vujcic pointed out that this deceleration is not as evident in the current inflation rates. The upcoming months, according to him, will be crucial in discerning the direction of services inflation and in understanding "whether we will feel the consequences of the slowdown in the labor market."
While ECB expects to reach its 2% inflation target in 2025, Vujcic said that "by spring next year, we will have a clearer picture of whether we are firmly on the path toward achieving that or we will have to do more."
ECB's Centeno: Downside risks have materialized
ECB Governing Council member Mario Centeno, indicated yesterday that the transmission of ECB's policy is "up and running" and pointed out the rapidity with which inflation has decelerated, noting its descent has outpaced its ascent.
However, he urged prudence, stating, "We have to be cautious this time around because downside risks that we identified in June in our forecast have materialized." This marks a shift from the pattern observed throughout the pandemic recovery, where, as Centeno highlighted, "usually we have been surprised on the upside."
Centeno also hinted at the uncertainty ahead, observing, "There's plenty of data still to be made available until the September decision." He further emphasized the significance of the upcoming forecast, mentioning, "We have a new forecast. That forecast will tell us precisely how we see this transmission of our decisions into inflation and the economy."
On the data front
Japan Tokyo CPI core slowed from 3.0% yoy to 2.8% yoy in August, below expectation of 2.9% yoy. Corporate services price index rose 1.7% yoy in July, above expectation of 1.2% yoy.
Looking ahead, Germany GDP final will be released in European session. Ifo business climate will also be published too.
GBP/USD Daily Outlook
Daily Pivots: (S1) 1.2551; (P) 1.2640; (R1) 1.2689; More...
GBP/USD's fall from 1.3141 resumed and intraday bias is back on the downside. Next target is 61.8% projection of 1.3141 to 1.2618 from 1.2799 at 1.2476. Firm break there could prompt downside acceleration to 100% projection at 1.2276. On the upside, break of 1.2799 resistance is needed to confirm completion of the decline. Otherwise, near term outlook will stay bearish in case of recovery.
In the bigger picture, for now, fall from 1.3141 medium term top is seen as a correction to up trend from 1.0351 (2022 low). Deeper decline would be seen to 38.2% retracement of 1.0351 to 1.3141 at 1.2075. Strong support would be seen there to bring rebound on first attempt. But outlook will be neutral at best as long as 1.3141 resistance holds, and consolidation from there is set to extend, until further development.
Economic Indicators Update
| GMT | Ccy | Events | Actual | Forecast | Previous | Revised |
|---|---|---|---|---|---|---|
| 23:30 | JPY | Tokyo CPI Y/Y Aug | 2.90% | 3.00% | 3.20% | |
| 23:30 | JPY | Tokyo CPI ex Fresh Food Y/Y Aug | 2.80% | 2.90% | 3.00% | |
| 23:30 | JPY | Tokyo CPI ex Food Energy Y/Y Aug | 4.00% | 4.00% | ||
| 23:50 | JPY | Corporate Service Price Index Y/Y Jul | 1.70% | 1.20% | 1.20% | 1.40% |
| 06:00 | EUR | Germany GDP Q/Q Q2 F | 0.00% | 0.00% | ||
| 08:00 | EUR | Germany IFO Business Climate Aug | 86.6 | 87.3 | ||
| 08:00 | EUR | Germany IFO Current Assessment Aug | 89.8 | 91.3 | ||
| 08:00 | EUR | Germany IFO Expectations Aug | 83.8 | 83.5 | ||
| 14:00 | USD | Michigan Consumer Sentiment Index Aug F | 71.2 | 71.2 |
ECB’s Vujcic: Whether we are in a restrictive-enough territory remains to be seen
ECB Governing Council member Boris Vujcic acknowledged the restrictive nature of the ECB's present stance. However, he tempered this by highlighting the uncertainty that remains, suggesting that the real test of the bank's approach lies ahead.
"Whether we are in a restrictive-enough territory remains to be seen. And this is something that you will only see from the inflation data that will come in the next prints," he emphasized.
Despite indications of a cooling economic activity, Vujcic pointed out that this deceleration is not as evident in the current inflation rates. The upcoming months, according to him, will be crucial in discerning the direction of services inflation and in understanding "whether we will feel the consequences of the slowdown in the labor market."
While ECB expects to reach its 2% inflation target in 2025, Vujcic said that "by spring next year, we will have a clearer picture of whether we are firmly on the path toward achieving that or we will have to do more."
ECB’s Nagel: Too early to think about a pause
ECB Governing Council member Joachim Nagel, in remarks made yesterday, reinforced his stance on the ongoing monetary tightening efforts of the central bank. Addressing speculations around a potential pause, he firmly stated, "It's for me much too early to think about a pause," emphasizing the significant gap between the current inflation rate and ECB's target.
Nagel pointed out the glaring disparity between the present inflation situation and ECB's benchmark, saying, "We shouldn't forget inflation is still around 5%. So this is much too high. Our target is 2%. So there's some way to go."
Despite the overarching concern regarding a slowdown in economic activity in Eurozone, Nagel highlighted the persistence of core inflation and characterized the labor market as being "really pretty good."
Dismissing prevalent narratives surrounding Germany's economic health, he countered, "I hear a lot of talk about Germany, the sick man of Europe. This is definitely not the case." Concluding on an optimistic note, Nagel added, "I'm still pretty optimistic that we will have a soft landing."
ECB’s Centeno: Downside risks have materialized
ECB Governing Council member Mario Centeno, indicated yesterday that the transmission of ECB's policy is "up and running" and pointed out the rapidity with which inflation has decelerated, noting its descent has outpaced its ascent.
However, he urged prudence, stating, "We have to be cautious this time around because downside risks that we identified in June in our forecast have materialized." This marks a shift from the pattern observed throughout the pandemic recovery, where, as Centeno highlighted, "usually we have been surprised on the upside."
Centeno also hinted at the uncertainty ahead, observing, "There's plenty of data still to be made available until the September decision." He further emphasized the significance of the upcoming forecast, mentioning, "We have a new forecast. That forecast will tell us precisely how we see this transmission of our decisions into inflation and the economy."
Cliff Notes: Eagerly Awaiting Chair Powell at Jackson Hole
Key insights from the week that was.
Following last week’s update on aggregate wage inflation, Westpac revised its profile for wages growth over 2023 and 2024. In essence, the update speaks to a broad-based moderation in the pace of wage inflation. This is certainly highlighted by the softer-than-expected outcome for the headline figure in June, up 0.8% (3.6%yr), but is also witnessed to by the detail. The moderation is evident across most components of the data, not only in the breakdowns by sector and by bargaining arrangement, but also if bonuses are included or only those who received a pay increase are considered. The next update for September quarter 2023 will capture an above-average increase in the minimum wage (5.9% in 2023 vs. 4.7% in 2022) in addition to the 15% pay raise for aged care workers. Still, factoring in that strength – a forecast 1.3% gain – is still not enough to offset the broader moderation at play, leading us to revise down our year-end forecast for wages growth from 4.1%yr to 3.8%yr.
The August edition of Westpac’s Housing Pulse provided an in-depth update on the current drivers and outlook for Australia’s housing market. The upturn has gradually gained traction over recent months, but with turnover rising slowly, the recovery remains characterised as ‘price-led’. The nature of the recovery to date highlights the importance of affordability constraints, a factor which we believe will play a key role in guiding house price outcomes over the next few years. This is most aptly highlighted by the sub-indexes in the Westpac-MI Consumer Sentiment survey. At 72.1, the ‘time to buy a dwelling’ index remains near extreme cyclical lows; at 151.2, the House Price Expectations Index is meanwhile at a new cycle high, in strongly optimistic territory. Westpac expects house prices to rise by 7% in 2023; then, as affordability acts as a drag on buyer sentiment and demand, house price growth is expected to slow to 4% in both 2024 and 2025.
Before moving offshore, a quick note on Australia’s goods exports. This sector has become an increasingly important driver of growth over the last three years, with its share of the national economy up from 19% in 2019 to 27% in 2022. However, this strength was inherently built upon a fragile base, effectively being the consequence of a surge in global commodity prices, up 52.8% since 2019. Meanwhile, goods export volumes have declined by 2.1% over the last three years, the weakest result on record dating back to 1960. This largely speaks to the emerging weakness in resource exports, namely the “Big 3” of metal ores, coal and other fuels which together account for nearly two-thirds of Australia’s goods export volumes. The “Big 3” have suffered from a sustained period of underinvestment in capacity and repeat instances of disruptions to production, an environment that is clearly unable to foster quality growth in real export volumes. While the near-to-medium term outlook should benefit from fewer disruptions and some semblance of an investment response, the longer-term outlook for resource exports appears more uncertain. The transition to net-zero necessitates a restructuring of energy production globally, weakening global appetite for Australia’s fossil fuel exports. However, it also requires rapid investment in infrastructure and the replacement of transport fleets globally. The transition is therefore a constraint for some producers, but a great opportunity for others.
Offshore, the August flash PMIs for Europe, UK, US and Japan were instructive, pointing to a further deterioration in manufacturing and emerging weakness in services.
In the US, the manufacturing PMI ticked down to 47.0 from 49.0 led by declines in output and new orders. Services also ticked down from 52.3 to 51.0, likely attributable to softening consumer spending. The employment sub-index for both showed an incremental increase in employment, the slowest through this cycle, with declining new orders and rising wage costs arguably prompting some firms to consider cutting staff. Input price inflation was positive again after a brief trip below 50. This was supported by larger wage bills and an increase in raw material prices. However, output prices are now under pressure as firms discount their goods and services given constrained consumer spending power.
In the UK, the services PMI fell into contraction for the first time since January, 48.7. Both new orders and output declined while jobs rose marginally. A moderation in input costs came from lower energy and material prices, but wages continue to worry many firms. Output prices eased for the fourth month in a row, though this is yet to show up in the CPI. Manufacturing meanwhile fell deeper into contraction to 42.5, the thirteenth sub-50 reading in a row. New order and production both decelerated, signalling a bleak outlook.
Europe's services PMI saw a sizeable decline to 48.3, a 30-month low, while manufacturing improved to a still deeply contractionary 43.7. Employment in manufacturing was weak while services employment softened but remained expansionary. Manufacturers' costs declined, likely thanks to easing energy prices, as strong wage growth supported services input costs. Manufacturer output prices fell, continuing along their trend, while services prices rose slowly.
Japan's manufacturing PMI was little changed at 49, and services held up at 54.3. Optimism in services is likely driven by strong tourism spending versus domestic demand. Employment continued to show promise, a constructive development for next year's spring wage negotiations which the BoJ will keenly assess. Input prices also increased in Japan, though the detail suggests passthrough to services is more probable than manufacturing.
While there was no new data of significance for China this week, market participants remained focused on possible outcomes there in coming months. A quiet data week allowed us to take a deep dive into the recent detail for trade, investment and consumption, with a view to assess both the strengths and weaknesses of China’s economy and consequently the most probable evolution of growth with/ without further support from authorities. In our view, clear, active support from authorities can sustain growth around the current 5% target for a few more years. However, inaction is likely to entrench current pessimism amongst consumers and small business, weakening growth prospects to the extent that authorities medium-term development ambitions are unlikely to come to pass. Which path China takes will be determined in the next few months.
USD/JPY Remains In Strong Uptrend As Dollar Gains Strength
Key Highlights
- USD/JPY climbed above the 146.00 level before it corrected lower.
- A key bearish trend line is forming with resistance near 146.15 on the 4-hour chart.
- EUR/USD could extend losses below the 1.0800 level.
- GBP/USD could dive and trade toward 1.2550.
USD/JPY Technical Analysis
The US Dollar started a strong increase above the 143.20 level against the Japanese Yen. USD/JPY even before the 144.50 resistance and climbed above 145.50.
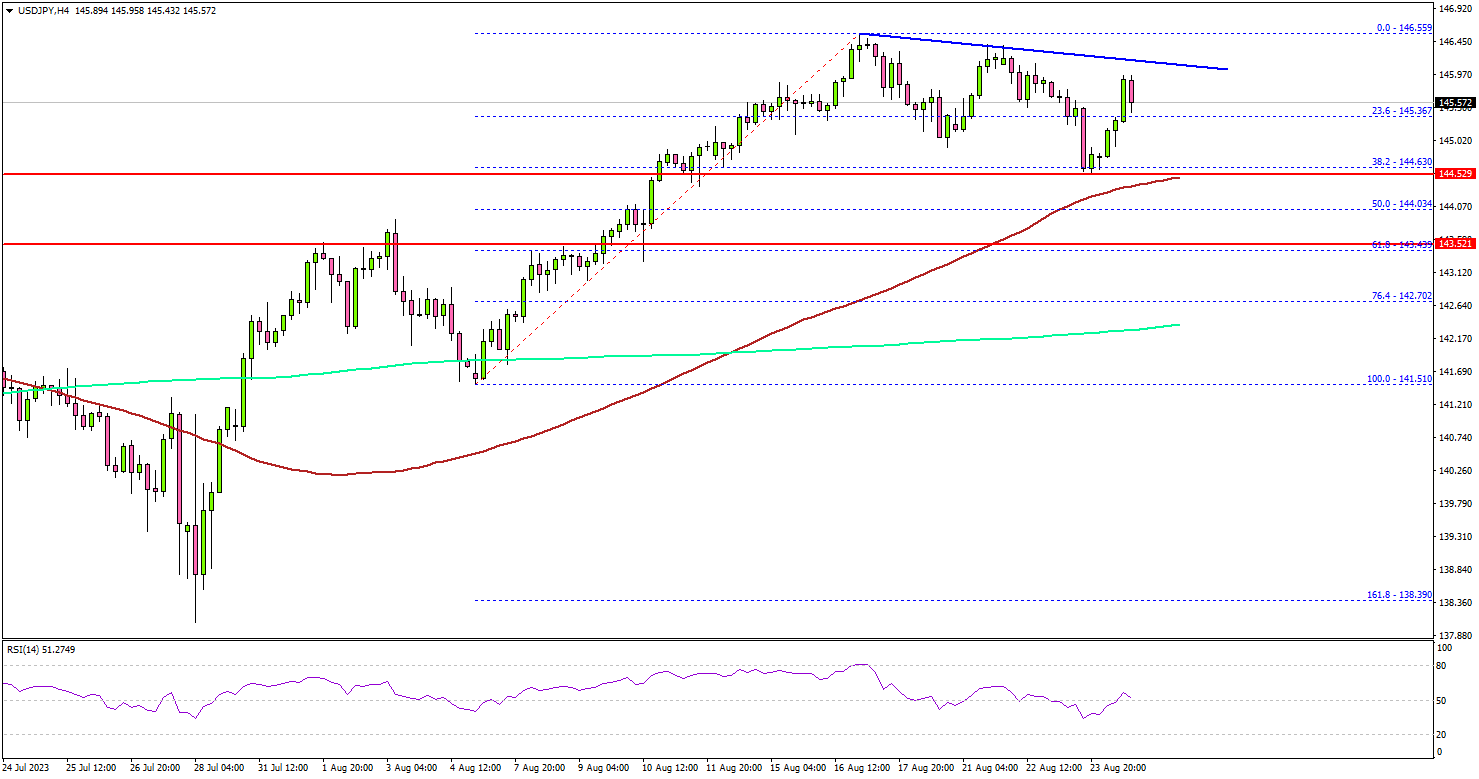
Looking at the 4-hour chart, the pair traded toward the 146.50 level and settled above the 100 simple moving average (red, 4 hours) and the 200 simple moving average (green, 4 hours).
A high was formed near 146.55 before there was a minor downside correction. The pair traded below the 145.50 level and tested the 38.2% Fib retracement level of the upward move from the 141.51 swing low to the 146.55 high.
The pair stayed above 144.60 and the 100 simple moving average (red, 4 hours). It is now attempting a fresh increase above 145.20. On the upside, an initial resistance is near the 146.20 level. There is also a key bearish trend line forming with resistance near 146.15 on the same chart.
A close above 146.20 could start a decent increase. In the stated case, the pair could rise toward the 146.55 level. Any more gains could start a fresh increase toward the 148.00 level.
If not, the pair might react to the downside toward the 144.60 support. The next key support is seen near the 144.00 level or the 50% Fib retracement level of the upward move from the 141.51 swing low to the 146.55 high.
If there is a move below 144.00, the pair could dive toward 142.50. Any more gains might open the doors for a test of 141.50.
Looking at EUR/USD, the pair is still trading in a bearish zone and there is a risk of more downsides below the 1.0800 level.
Economic Releases
- German IFO Business Climate Index for August 2023 – Forecast 86.7, versus 87.3 previous.
- Jackson Hole Symposium.
- Federal Reserve Chair Jerome Powell’s Speech.
EURGBP Wave Analysis
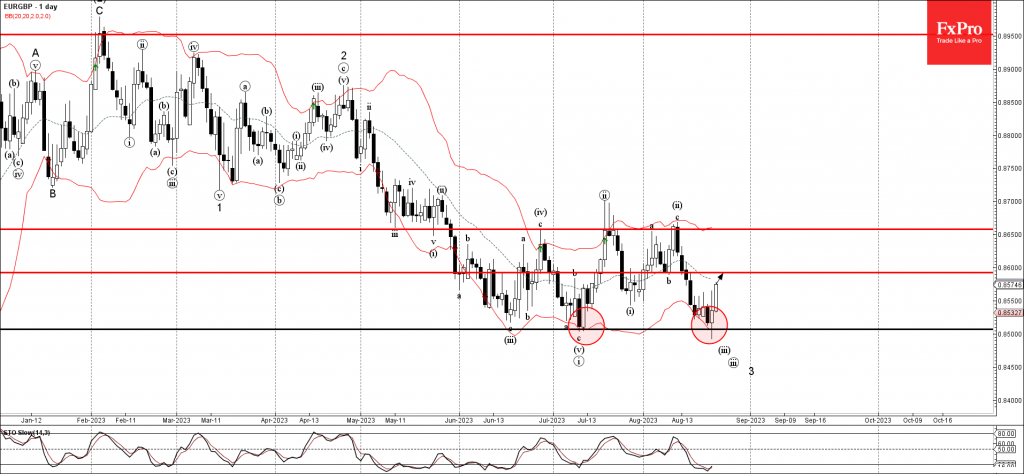
- EURGBP reversed from support level 0.8500
- Likely to rise to resistance level 0.8600
EURGBP currency pair recently reversed up from the key support level 0.8500 (previous monthly low from July) and the lower daily Bollinger Band.
The upward reversal from the support level 0.8500 stopped the earlier short-term impulse waves iii and 3 of the impulse wave (3) from February.
Given the strength of the support level 0.8500 and the oversold daily Stochastic, EURGBP can be expected to rise further toward the next support level 0.8600.
GBPCAD Wave Analysis
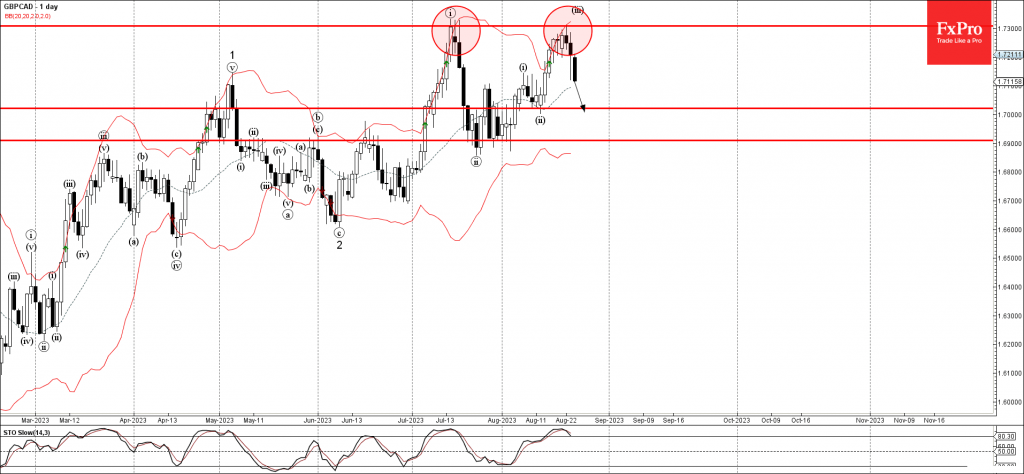
- GBPCAD reversed from resistance level 1.7300
- Likely to fall to support level 1.7020
GBPCAD currency pair recently reversed down from the pivotal resistance level 1.7300 (previous monthly high from July) intersecting with the upper daily Bollinger Band.
The downward reversal from the resistance level 1.7300 started the active short-term correction ii.
Given the still overbought daily Stochastic and strong sterling sales, GBPCAD can be expected to fall further toward the next support level 1.7020 (low of the previous correction ii).