Sample Category Title
USDCAD Wave Analysis
- USDCAD broke resistance level 1.3470
- Likely to rise to resistance level 1.3635
USDCAD currency pair recently broke the key resistance level 1.3470 (which stopped the previous impulse wave 3 at the start of August).
The breakout of the resistance level 1.3470 coincided with the breakout of the 50% Fibonacci correction of the previous ABC correction (B) from the start of March.
Given the strength of the active impulse wave 5, USDCAD can be expected to rise further toward the next resistance level 1.3635 (which stopped the previous waves B and ii).

Will Japan Intervene to Rescue the Battered Yen?
The Japanese yen has resumed its meltdown, falling victim to widening rate differentials and rising energy costs. Despite the currency trading at levels that prompted FX intervention last year, Japanese authorities don’t appear so concerned this time, which suggests that another round of intervention is some distance away. For this dynamic to change, USD/JPY would need to approach the 150 region in a hurry.
Yen feels the blues
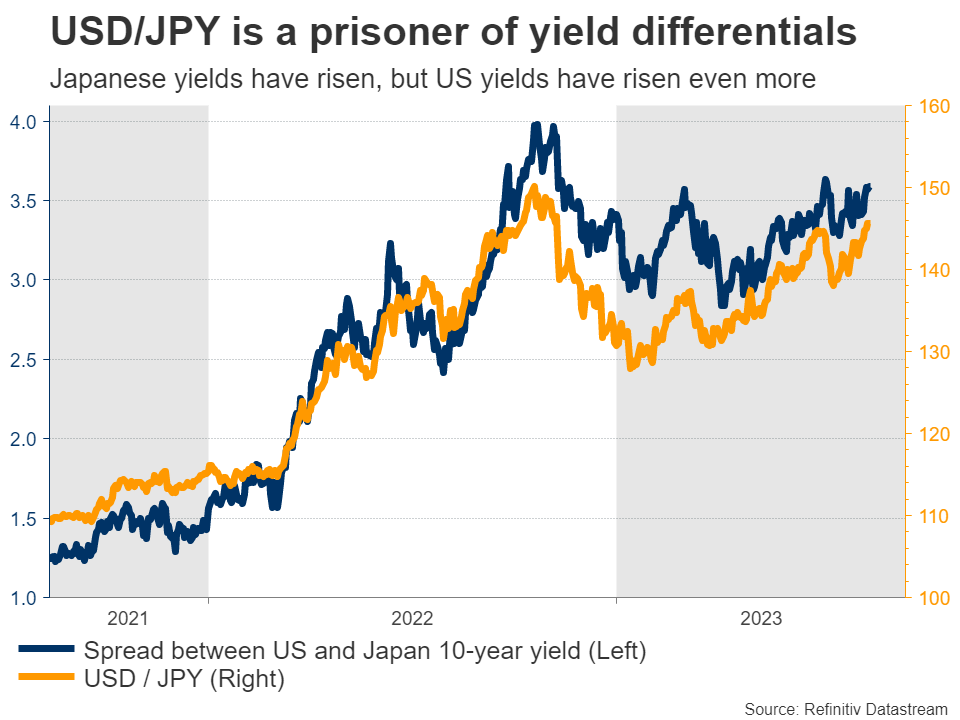
It has been another bruising year for the Japanese yen, as the forces that devastated the currency after the pandemic came back into play. Interest rate differentials have been the primary driver. In sharp contrast to other major central banks, the Bank of Japan has still not raised rates.
Over time, this gap in rates incentivizes capital to flow out of Japan and search for higher returns abroad, putting downward pressure on the currency. While the BoJ did tweak its yield control strategy lately to allow long-dated Japanese yields to rise as high as 1%, the move has not stopped the yen’s bleeding.
That’s partly because the BoJ intervened in the bond market to prevent a rapid rise in yields, and partly because foreign yields have risen even more lately, resulting in yield differentials widening further.
Soaring energy prices have also inflicted damage on the yen through the trade channel. Japan imports nearly all of its oil and gas, so higher energy prices have deprived the nation from its trade surplus. Although this negative effect dissipated earlier this year as a weaker yen boosted exports and oil prices fell, it might become more pronounced again following the latest rally in oil prices, which started in late June and therefore hasn't been captured in the data yet.
In other words, capital and trade flows have both moved against the yen recently, and the fallout is reflected in the charts.
So why is FX intervention unlikely?
The main argument against FX intervention is that Japanese authorities have not threatened it lately. There haven’t been many concerned comments about exchange rates from government officials in recent weeks, even as the yen fell to the ‘danger zone’ that the government decided to defend last year.
Tokyo has been relatively silent, and sometimes silence can speak volumes. Before real intervention takes place, there will be several verbal warnings from various officials. It’s a cost-free method to discourage speculators from attacking the yen.
Speed matters a lot in this calculation. One reason why Tokyo seems more relaxed this time is that the pace of the yen’s depreciation is not as severe as last year. A slow and orderly drop is very different from a rapid breakdown in the currency. Policymakers ultimately want to preserve stability.
Another reason is the latest policy tweak by the Bank of Japan. With the central bank finally taking the first steps towards normalizing policy, there is less concern about a chaotic yen collapse that requires intervention.
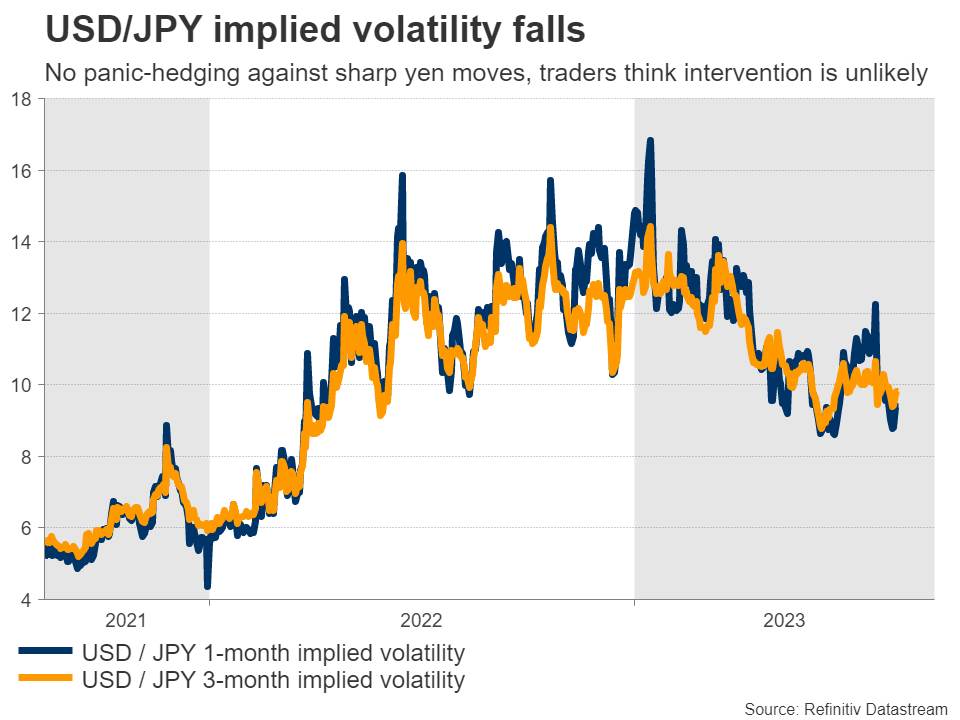
Of course, this narrative could change if the yen continues to sink, especially if the decline accelerates in speed. But for now, the risk of actual intervention is low and investors appear to agree, judging by the decline in USD/JPY implied volatility. This means the big players are not really hedging against any massive moves in the yen.
The buzzwords that would suggest Tokyo is ready to take action would be government officials describing FX moves as ‘disorderly’ or ‘one-sided’. The minister of finance - Shunichi Suzuki - is the final authority in intervention matters, so hearing those words from him would be the tell.
Suzuki made some comments this week, but he only said that the government would respond to “excessive” moves. The fact that he hasn’t ramped up his warnings suggests we are still some distance away from actual FX intervention.
What’s the line in the sand?
It’s difficult to say exactly where Tokyo might draw the line and step in, because that line is a moving target, which changes depending on the speed of FX moves. A slow decline might not be very concerning, but a sharp and violent drop would be.
Looking at the USD/JPY chart, the most important area to watch is 150, which is where the second round of intervention took place last year. The tone of Japanese officials as we approach this region will reveal whether they intend to defend it again.
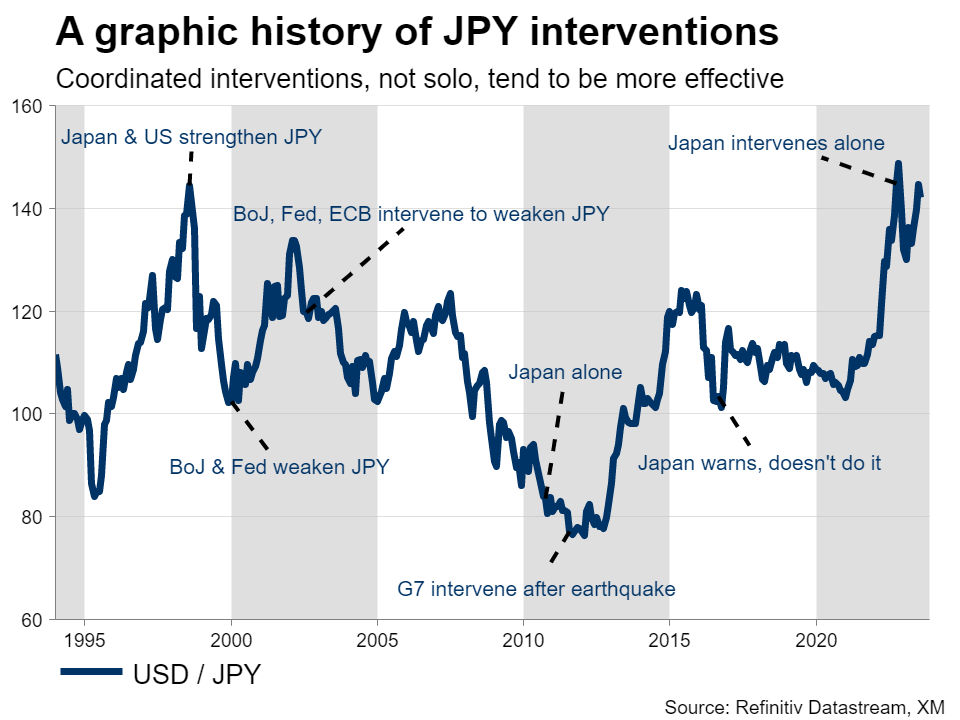
All told, for the yen to mount a lasting recovery, it would probably need some crisis or recession in foreign economies that fuels bets for rate cuts abroad, helping to compress yield differentials. Europe and China are certainly losing steam, although the United States economy remains resilient.
Solo intervention can slow the depreciation, but is unlikely to change the yen’s trend by itself. And since the Bank of Japan doesn’t seem to have much appetite for a continued tightening campaign, the yen is once again left in the hands of external forces - namely how global yields perform.
GBP/AUD: Bullish Run Extends as England Ends Matildas Mania
- UK core inflation remains elevated at 6.9% and above the consensus estimate of 6.8%
- BOE expected to raise rates another by almost 75 bps more in this tightening cycle
- Aussie downside extends over China’s economic struggles
World Cup Final Match Set
England has advanced to its first Women’s World Cup final with a 3-1 victory over co-host Australia. Soccer mania was embraced in Australia as the women’s soccer team’s put up an impressive run that fell two wins short of becoming champions. The Matildas dream run might be over, but the pain for the Australian dollar seems like it might be poised to continue. England will play Spain in the Women’s World Cup Final on Sunday.
UK CPI refuses to cool
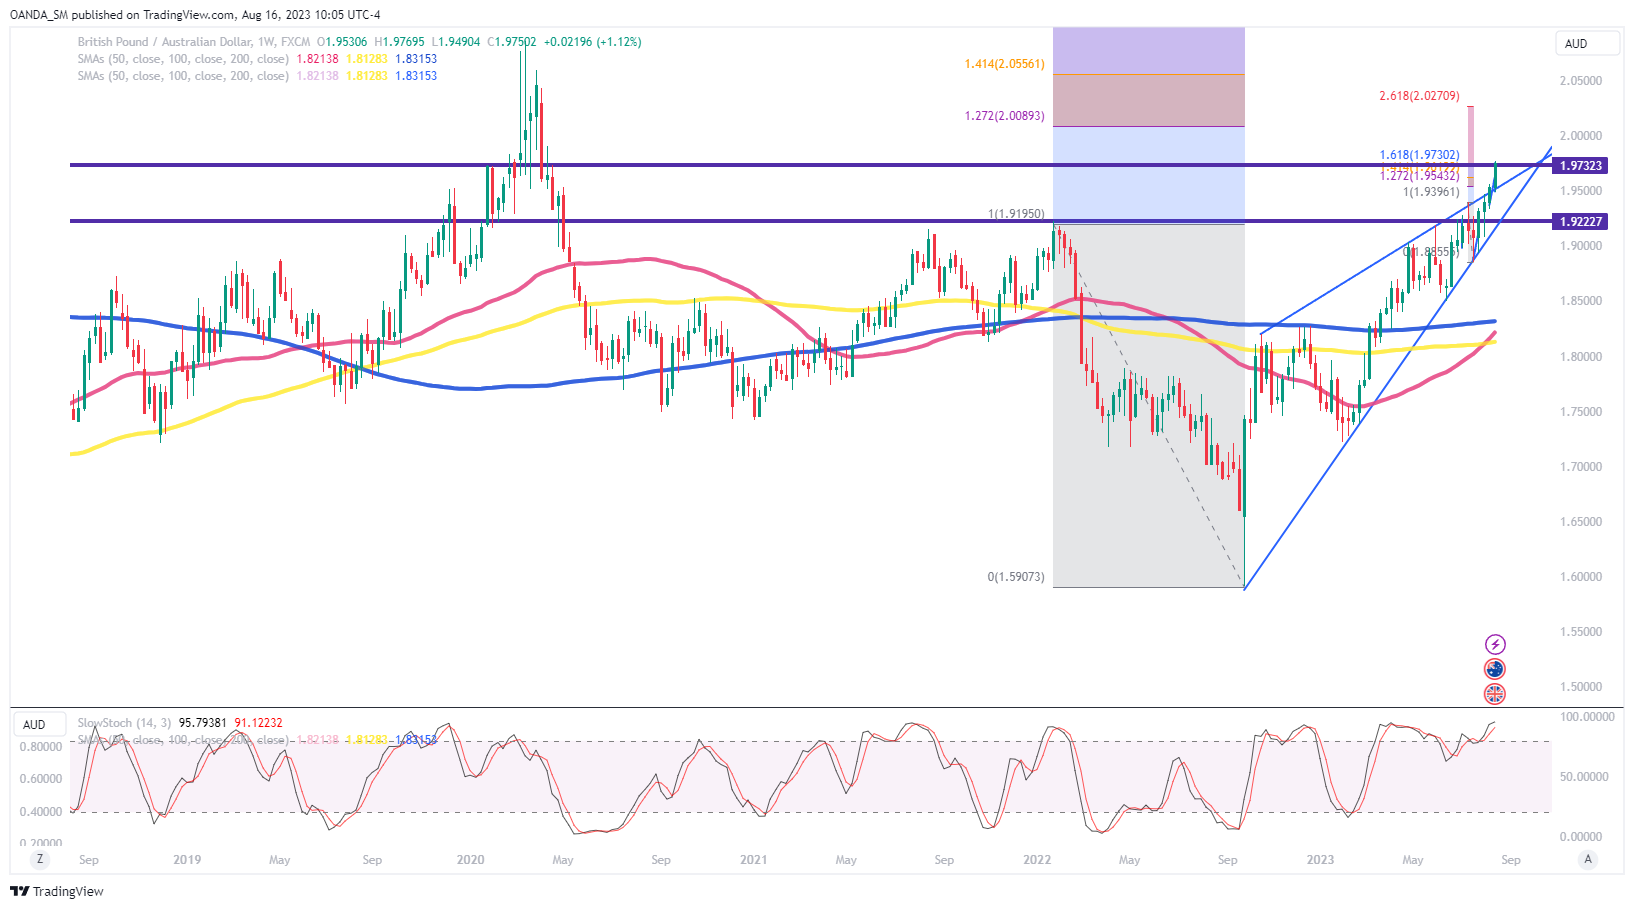
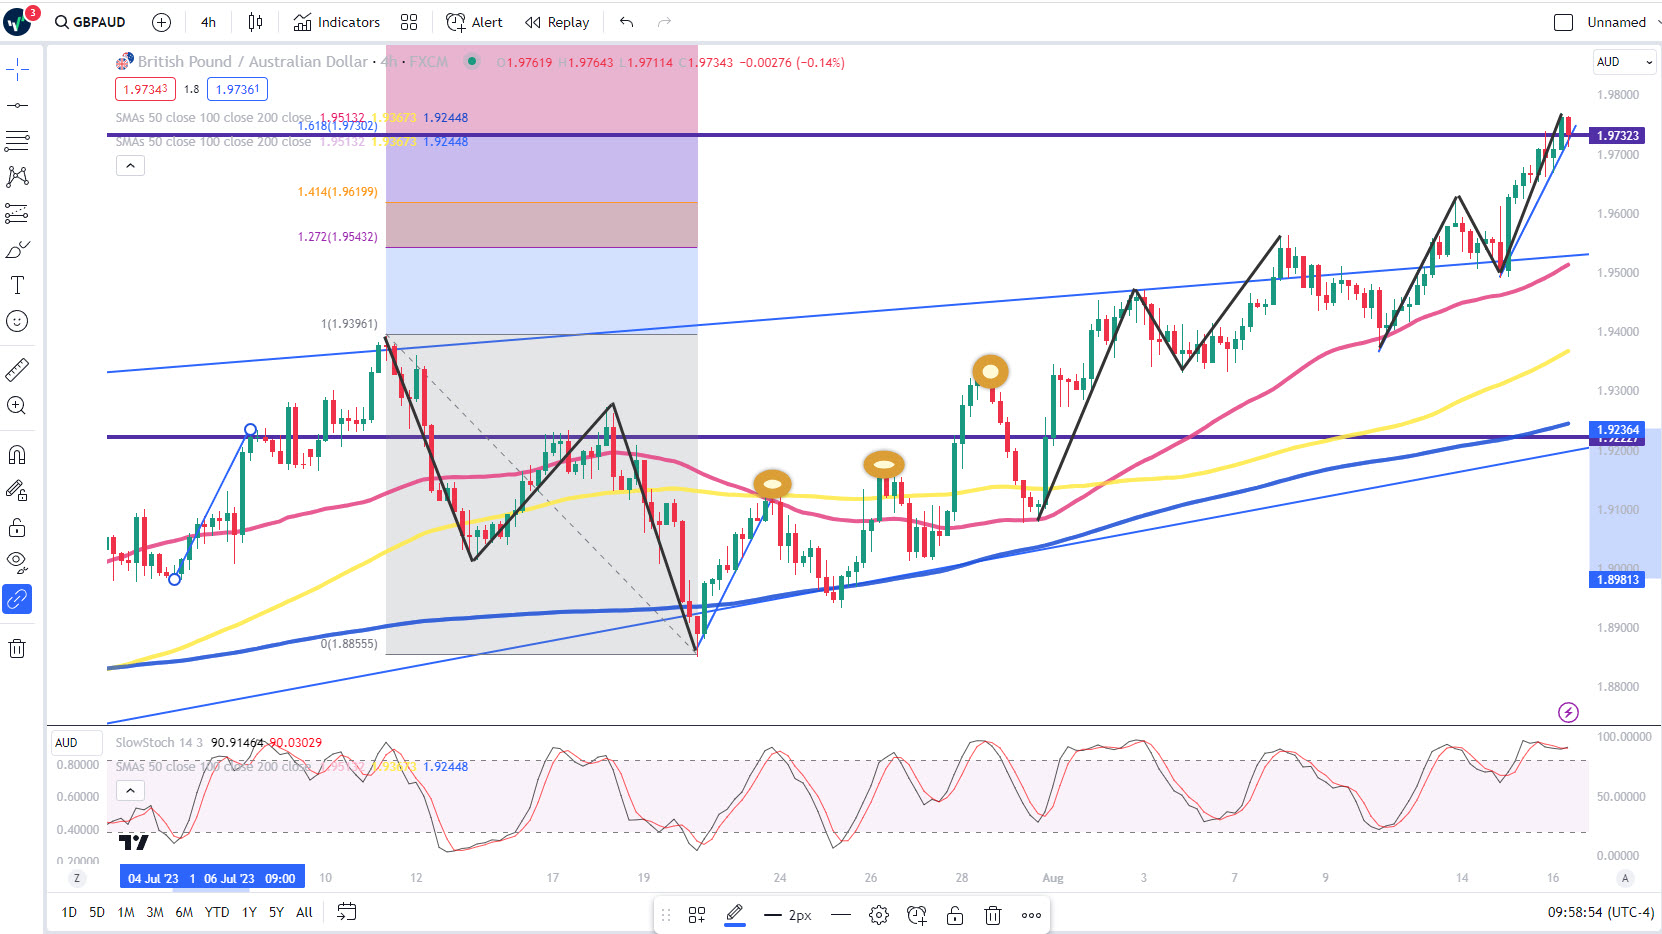
The British pound rallied earlier in London after the July inflation report showed core and services pricing pressures are proving to be sticky. Inflation is slowly coming down and this will not let the BOE ease up on tightening. With the risk of a few more rate hikes on the table, the pound could still remain in overbought territory a while longer against the Australian dollar. The macro backdrop supports further GBP strength, but most traders might have a tight leash on that trade.
GBP/AUD Weekly Chart
Source: Trading View
GBP/AUD 4-four Chart
Source: Trading View
We haven’t seen a substantial correction since May, so some technical traders might be concerned with how overbought GBP/AUD has become across multiple time frames. If exhaustion starts to settle for the bullish rally, initial support lies at the 1.9620 level. If bearish momentum begins, long-term downside targets include the 1.9220 level, followed by the 1.9105 level. Eventually, Chinese officials will be more aggressive with stimulus, with the timing likely happening before the end of September. If China can ease global growth concerns that should be Aussie dollar positive.
Kiwi Dollar Tries to Fly Despite RBNZ’s ‘Wait-and-See Approach
The Reserve Bank of New Zealand left its key rate unchanged for the second time at 5.5%. Most analysts predicted this decision, but it created positive momentum in the NZDUSD, which at one point added about 1% to the day’s lows set before publication.
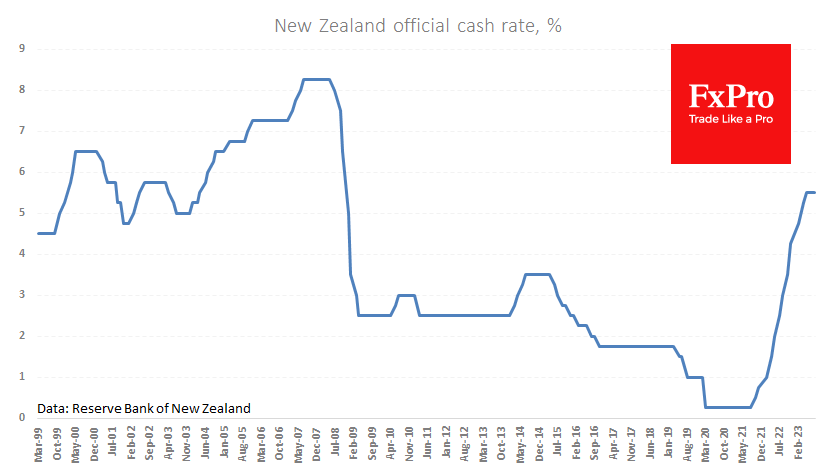
The RBNZ’s mood has clearly shifted from raising the rate to keeping it at the current restrictive level for an extended period of time. The Central Bank notes a decline in activity in the sectors most sensitive to interest rates. In addition, they emphasise the reduction of labour shortage due to migrants and softening demand.
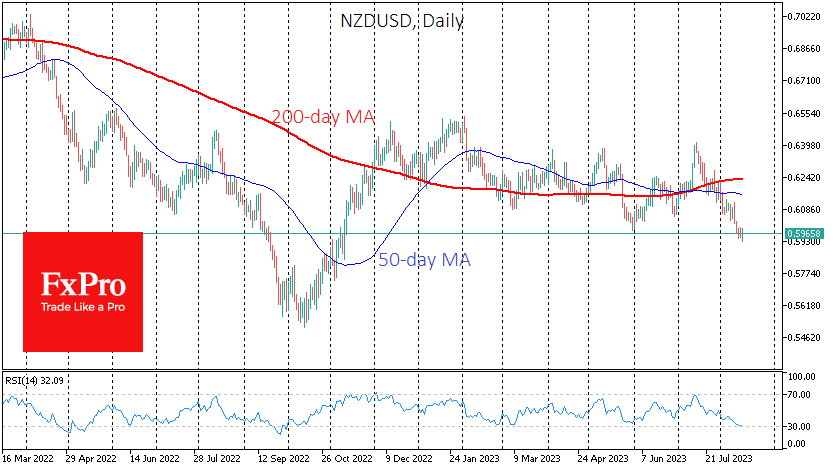
The positive reaction of the currency market to the Central Bank’s comments has a chance to be the starting point for a corrective recovery or even the beginning of the growth of NZD, which by mid-August was at historic lows against CHF and multi-year lows against EUR & GBP.
NZDUSD lost about 7.4% in about a month, and the intraday dip was at its lowest since last November at 0.5930. On the daily timeframes, the RSI flirted with oversold territory the day before, which hasn’t been seen since October 2022. A rise out of this area is a bullish signal, which was also well worked out by NZDUSD, adding over 15% in the last two months.
Sunset Market Commentary
Markets:
UK July inflation numbers grabbed most attention this morning. Headline CPI fell slightly less than expected (-0.4% M/M vs -0.5%) with the Y/Y-figure dropping from 7.9% to 6.8%, the lowest level since February of last year. The biggest contributor were gas and electricity prices following the UK regulator’s announcement that the average annual bill would drop from £2500 to slightly over £2000. Core CPI accelerated again on a monthly basis, from 0.2% M/M in June to 0.3% with the Y/Y-number stable at 6.9%. Services inflation even accelerated from 7.2% Y/Y to 7.4% suggesting that the Bank of England’s work is far from done, even if the UK central bank slowed down its tightening pace from 50 bps rate hikes to 25 bps at the early August meeting. UK gilts underperform today with UK yields rising by 2.4 bps to 3.7 bps across the curve. Sterling holds a small advantage over the euro, with EUR/GBP down at 0.8565 from an open at 0.8585. US eco data were decent today with housing starts up by 3.9% M/M in July (vs 1.1% expected), building permits rising a gently 0.1% M/M (vs 1.5%) and industrial production increasing by 1% M/M (vs 0.3%). They help explain the underperformance of US Treasuries vs German Bunds. The long end of the US curve underperforms again, rising by up to 2.7 bps for the 30-yr tenor. Yesterday, a first attempt to push through the YTD high (10y 4.2%) on stronger retail sales failed. Real yields are driving the move with the US 10y real yield approaching 1.9% for the first time since June 2009! FOMC Minutes can tonight give more ammunition given the divergence between June FOMC dots (5.5%-5.75% EoY policy rate) and market expectations of a 5.25%-5.5% policy rate peak. EUR/USD holds steady again between 1.09 and 1.0950. The Japanese yen remains on the weak side (USD/JPY 146) following last week’s rise in core yields. The market is also stepping up pressure on the BoJ to really start normalizing its policy instead of just widening the band around the 0% target around the 10y yield (from 50 bps to 100 bps end of July). Back in September, the Japanese Ministry of Finance did its first FX interventions since 1998 at the current spot rate. They later stepped it up as USD/JPY briefly passed 150 in October. (More) verbal intervention threats will follow.
News & Views:
The Reserve Bank of New Zealand (RBNZ) kept its policy rate (OCR) unchanged at 5.5% this morning. The Committee agreed that the OCR needs to stay at restrictive levels for the foreseeable future to ensure annual consumer price inflation returns to the 1 to 3% target range, while supporting maximum sustainable employment. A prolonged period of subdued spending growth is still required to better match the supply capacity of the economy and reduce inflation pressure. In the near term, there is a risk that activity and inflation measures do not slow as much as expected. This is reflected in the updated projection path for the policy rate which slightly raised the odds of a final rate hike and pushes forward the potential start of the rate cut cycle. The expected policy rate peak was raised from 5.5% to 5.59% mid next year with end of 2024 and end of 2025 projections increased from 5.3% to 5.5% and from 4.09% to 4.51% respectively. Headline inflation isn’t expected to fall in the 1%-3% range before Q3 2024. The RBNZ also increased its neutral rate prognosis from 2% to 2.25%. NZD swap rates rose slightly at the front end of the curve (+2 bps) with NZD/USD temporary halting a month-long decline, hopelessly trying to regain lost support at NZD/USD 0.60 (previous YTD low).
Hungarian GDP shrank by 0.3% Q/Q in Q3 with YoY growth 2.4% lower. YTD, YoY GDP fell by 1.7%. The largest contributors to the decrease in the economic performance were industry and market services, within which mainly transportation and storage as well as wholesale and retail trade. The good performance of agriculture lowered the reduction. The decrease in the value added of services was partly offset by a significant growth in human health and social work activities, the performance of which approximated the level before the Covid-19 pandemic. The Hungarian forint is better bid today, ignoring the outdated numbers and core bonds yields finally relax after a week of significant increases. EUR/HUF drop back from 388 to 385. Polish GDP decreased by 3.7% Q/Q in Q2 (-0.5% Y/Y). The outcome was weaker than forecast (-2.3% Q/Q) with details being provided on August 31. Today’s Polish zloty rebound is similar to the HUF move with EUR/PLN currently trading at 4.45 from 4.48.
EUR/USD Mid-Day Outlook
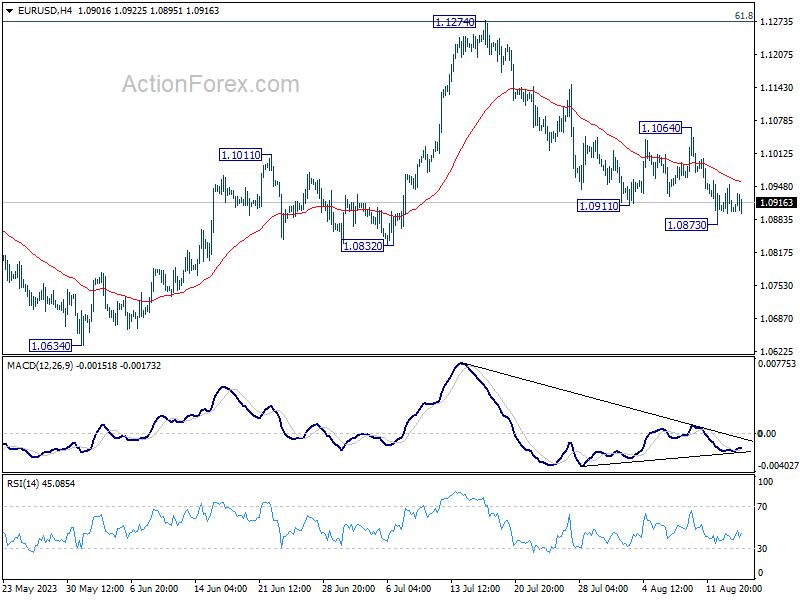
Daily Pivots: (S1) 1.0884; (P) 1.0919; (R1) 1.0939; More...
A temporary low is formed at 1.0873 in EUR/USD and intraday bias is turned neutral first. But outlook stays bearish with 1.1064 resistance intact. On the downside, below 1.0873 will target 1.0832 support first. Decisive break there will extend the decline from 1.1274 to 1.0609/34 cluster support.
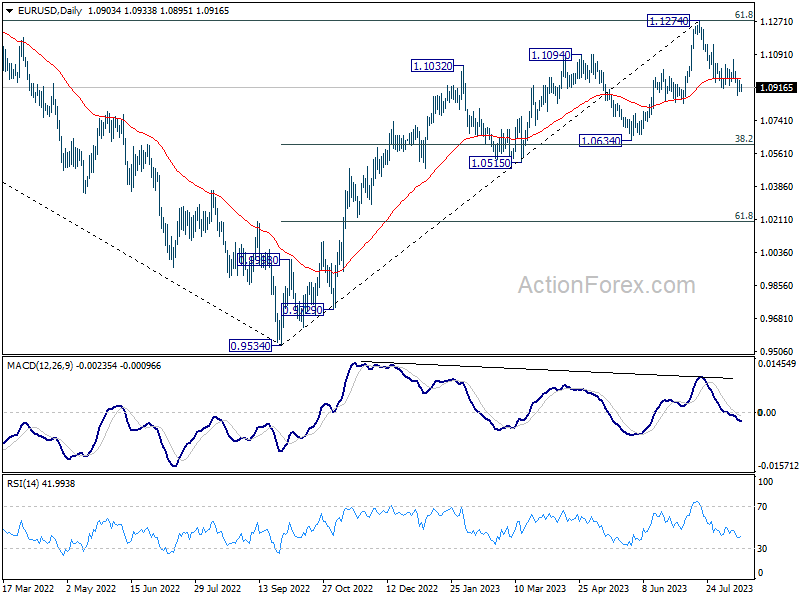
In the bigger picture, a medium term top could be formed at 1.1274, after failing to break through 61.8% retracement of 1.2348 (2021 high) to 0.9534 at 1.1273 decisively, on bearish divergence condition in D MACD. Sustained trading below 55 D EMA (now at 1.0966) will bring deeper correction to 1.0634 cluster support (38.2% retracement of 0.9534 to 1.1274 at 1.0609). Strong support could be seen there, at least on first attempt, to set the range for consolidation.
GBP/USD Mid-Day Outlook
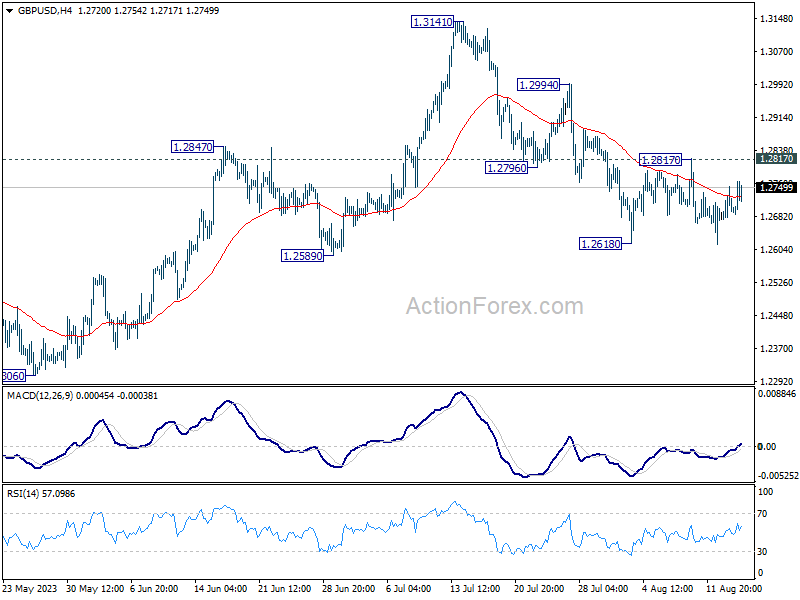
Daily Pivots: (S1) 1.2668; (P) 1.2711; (R1) 1.2746; More...
Range trading continues in GBP/USD and intraday bias remains neutral. On the downside, firm break of 1.2618, and sustained trading below 1.2678 resistance turned support will argue that it's already in a larger correction. Deeper decline would then be seen to 1.2306 support next. Nevertheless, break of 1.2817 minor resistance will indicate that the pull back has completed, and turn bias back to the upside for stronger rebound.
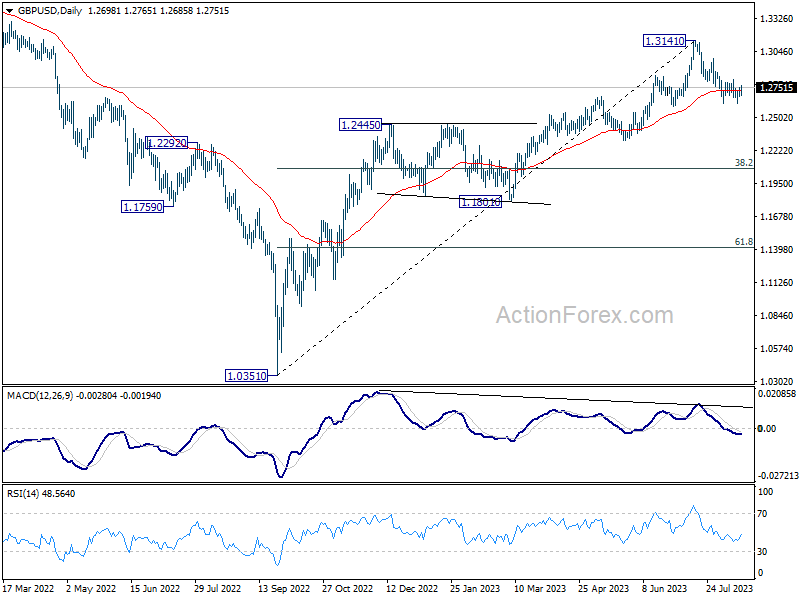
In the bigger picture, a medium term top could be in place at 1.3141 already, on bearish divergence condition in D MACD. Sustained trading below 55 D EMA (now at 1.2723) should confirm this case, and bring deeper fall to 38.2% retracement of 1.0351 to 1.3141 at 1.2075, as a correction to up trend from 1.0351 (2022 low). For now, rise will stay mildly on the downside as long as 1.3141 resistance holds, in case of strong rebound.
USD/CHF Mid-Day Outlook
Daily Pivots: (S1) 0.8754; (P) 0.8775; (R1) 0.8807; More....
Range trading in USD/CHF continues today and intraday bias remains neutral. On the upside, sustained trading above 0.8818 support turned resistance will carry larger bullish implication. Further rally should then be seen to 0.9146 cluster resistance next. However, break of 0.8688 support will indicate rejection by 0.8818, and turn bias back to the downside for retesting 0.8551 low.
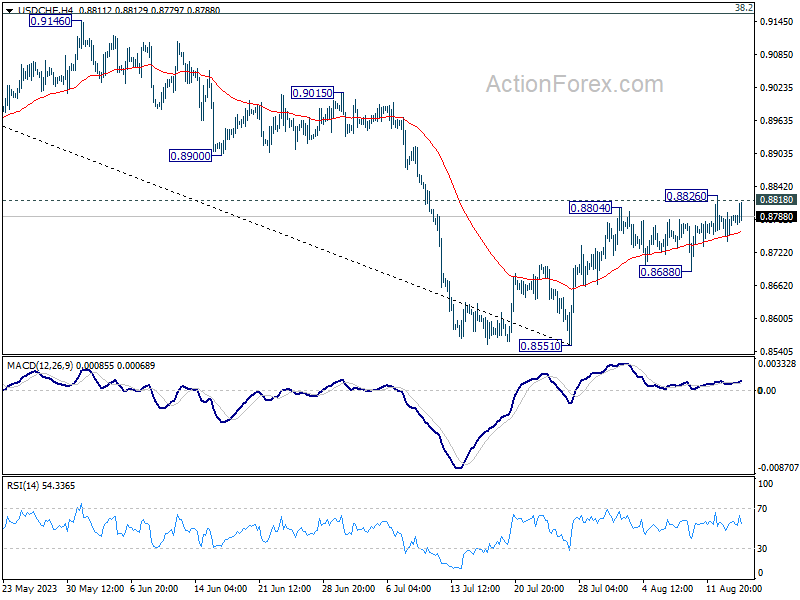
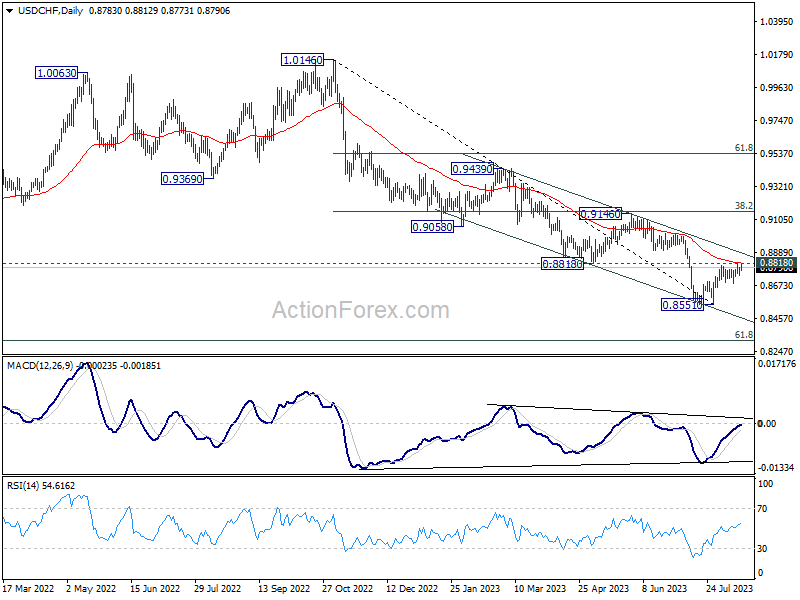
In the bigger picture, a medium term bottom could be in place at 0.8551 already, on bullish convergence condition in D MACD. Sustained trading above 0.8818 will bring further rise to 0.9146 cluster resistance (38.2% retracement of 1.0146 to 0.8551 at 0.9160), even as a correction. Nevertheless, break of 0.8851 will resume the down trend from 1.0146 instead.
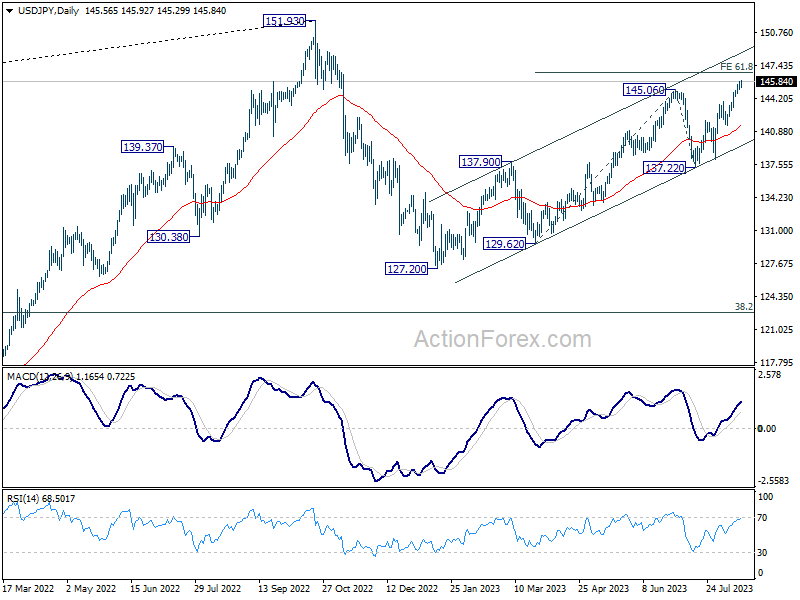
USD/JPY Mid-Day Outlook
Daily Pivots: (S1) 145.17; (P) 145.52; (R1) 145.93; More...
Intraday bias in USD/JPY remains on the upside at this point, despite some loss of momentum. Current rally from 127.20 is in progress for 61.8% projection of 129.62 to 145.06 from 137.22 at 146.76. On the downside, below 144.62 minor support will turn intraday bias neutral and bring consolidations first, before staging another rally.
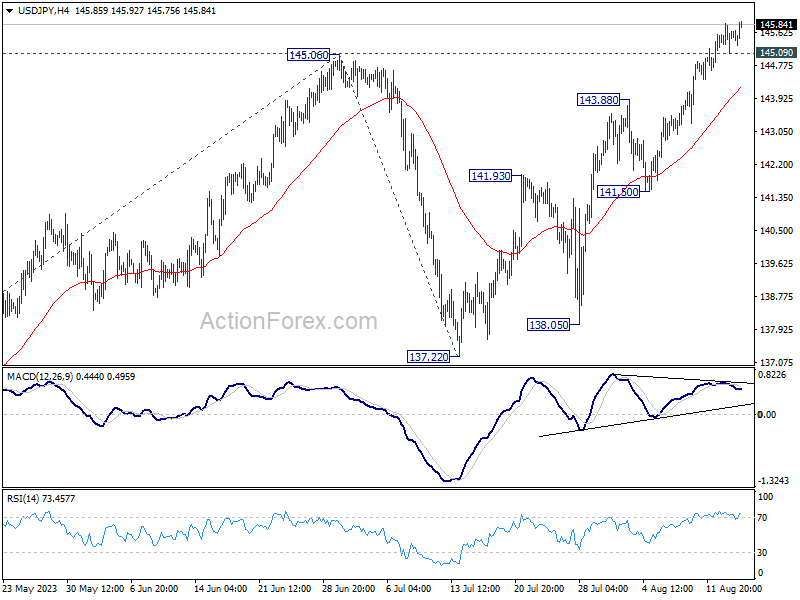
In the bigger picture, overall price actions from 151.93 (2022 high) are views as a corrective pattern. Rise from 127.20 is seen as the second leg of the pattern and could still be in progress. But even in case of extended rise, strong resistance should be seen from 151.93 to limit upside. Meanwhile, break of 137.22 support should confirm the start of the third leg to 127.20 (2023 low) and below.