

Sample Category Title
USD/CHF Daily Outlook
Daily Pivots: (S1) 0.8754; (P) 0.8775; (R1) 0.8807; More....
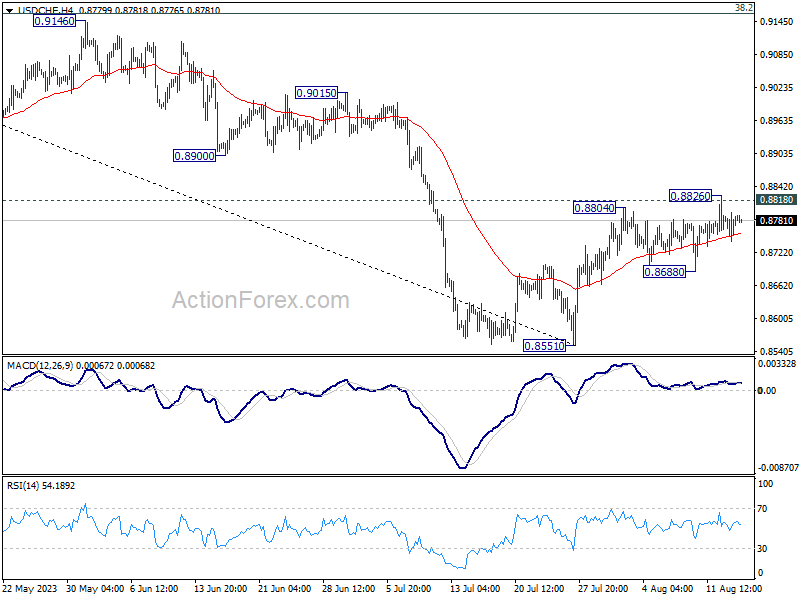
Intraday bias in USD/CHF remains neutral and outlook is unchanged. On the upside, sustained trading above 0.8818 support turned resistance will carry larger bullish implication. Further rally should then be seen to 0.9146 cluster resistance next. However, break of 0.8688 support will indicate rejection by 0.8818, and turn bias back to the downside for retesting 0.8551 low.
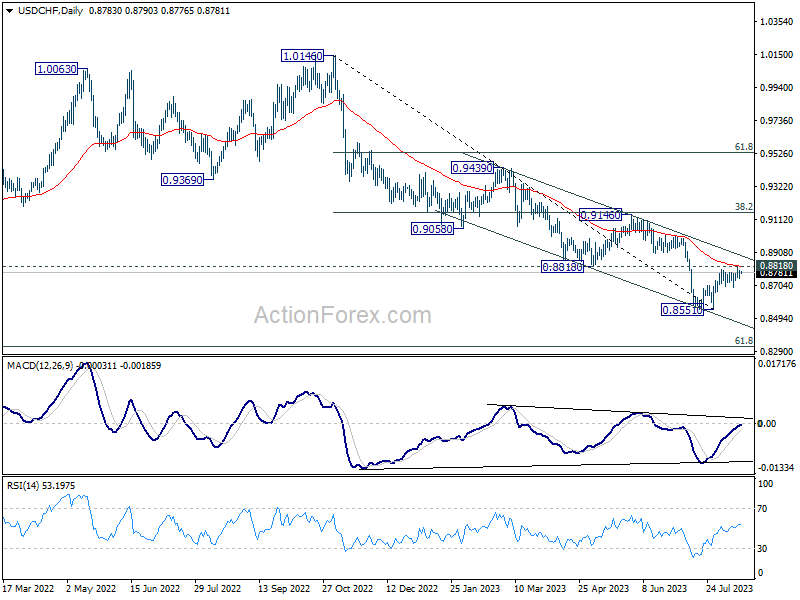
In the bigger picture, a medium term bottom could be in place at 0.8551 already, on bullish convergence condition in D MACD. Sustained trading above 0.8818 will bring further rise to 0.9146 cluster resistance (38.2% retracement of 1.0146 to 0.8551 at 0.9160), even as a correction. Nevertheless, break of 0.8851 will resume the down trend from 1.0146 instead.
USD/JPY Daily Outlook
Daily Pivots: (S1) 145.17; (P) 145.52; (R1) 145.93; More...
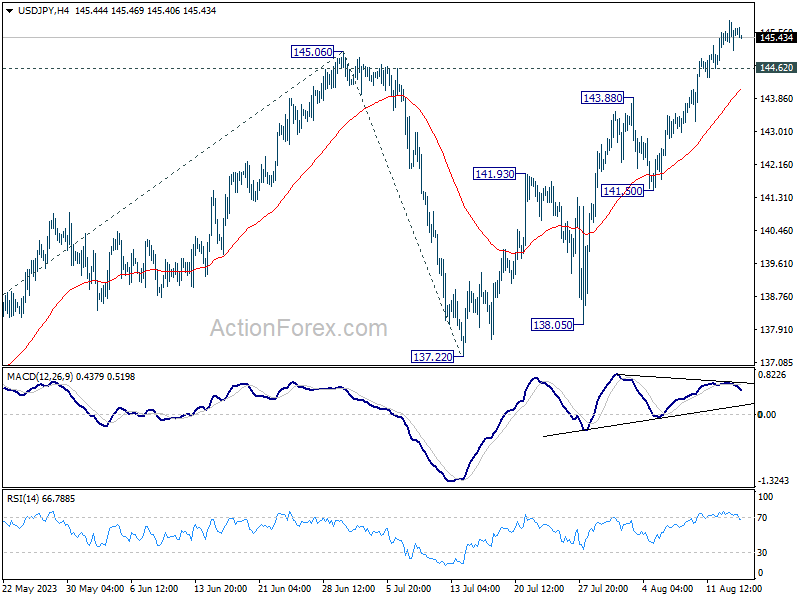
USD/JPY is losing upside momentum as seen in 4H MACD. But with 144.62 minor support intact, intraday bias stays on the upside. . Current rise from 127.20 is in progress for 61.8% projection of 129.62 to 145.06 from 137.22 at 146.76. On the downside, below 144.62 minor support will turn intraday bias neutral and bring consolidations first, before staging another rally.
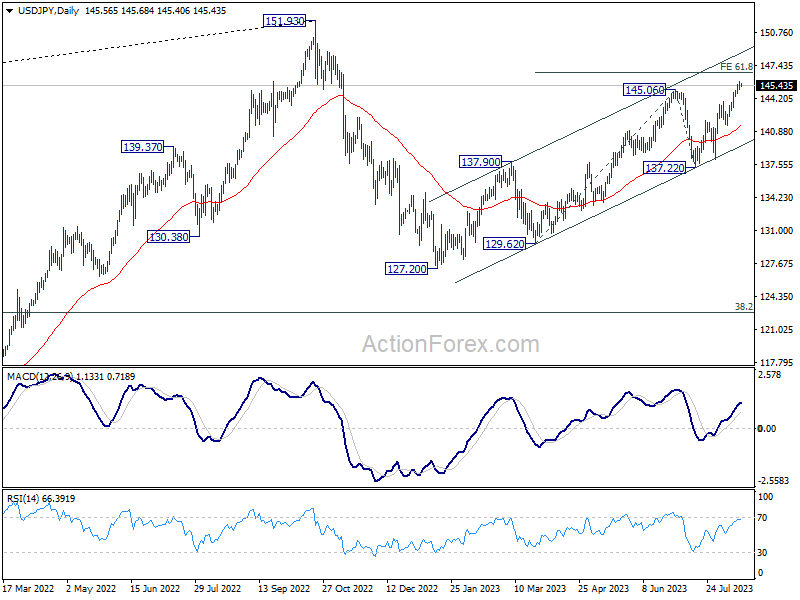
In the bigger picture, overall price actions from 151.93 (2022 high) are views as a corrective pattern. Rise from 127.20 is seen as the second leg of the pattern and could still be in progress. But even in case of extended rise, strong resistance should be seen from 151.93 to limit upside. Meanwhile, break of 137.22 support should confirm the start of the third leg to 127.20 (2023 low) and below.
AUD/USD Daily Report
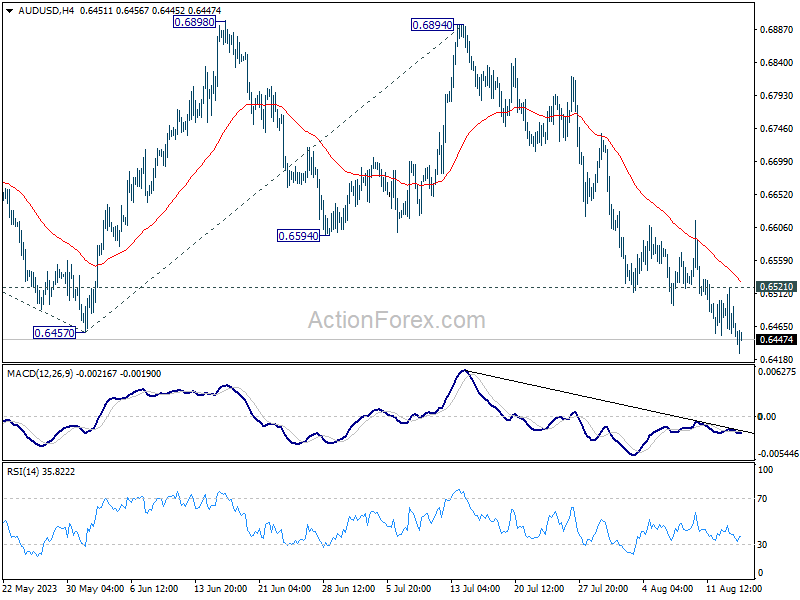
Daily Pivots: (S1) 0.6431; (P) 0.6476; (R1) 0.6501; More...
AUD/USD's break of 0.6457 support confirms resumption of whole decline from 0.7156. Intraday bias is back on the downside for 100% projection of 0.7156 to 0.6457 from 0.6894 at 0.6195. On the upside, above 0.6521 minor resistance will turn intraday bias neutral and bring consolidations first, before staging another fall.
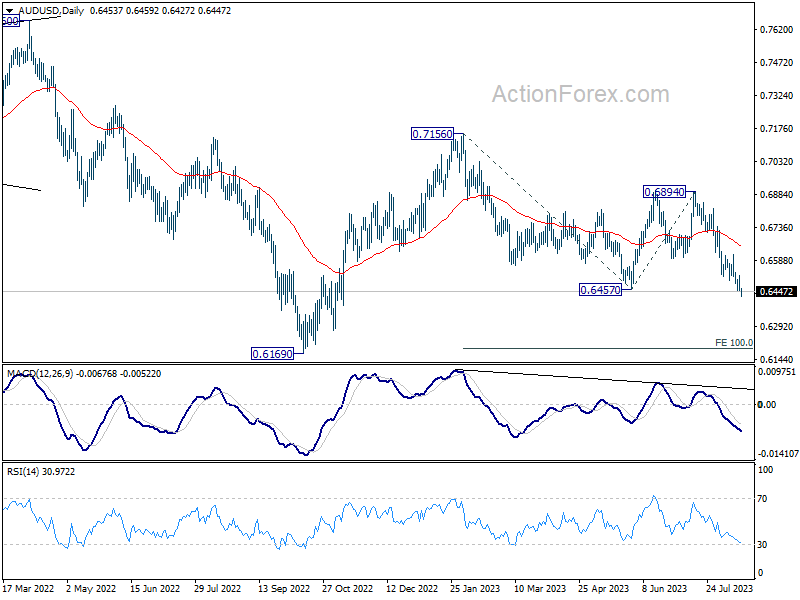
In the bigger picture, the down trend from 0.8006 (2021 high) could still be in progress. Break of 0.6457 will affirm this bearish case. Further break of 0.6169 will target 61.8% projection of 0.8006 to 0.6169 to 0.7156 at 0.6021. This will now remain the favored case as long as 0.6894, in case of strong rebound.
USD/CAD Daily Outlook
Daily Pivots: (S1) 1.3459; (P) 1.3480; (R1) 1.3521; More....
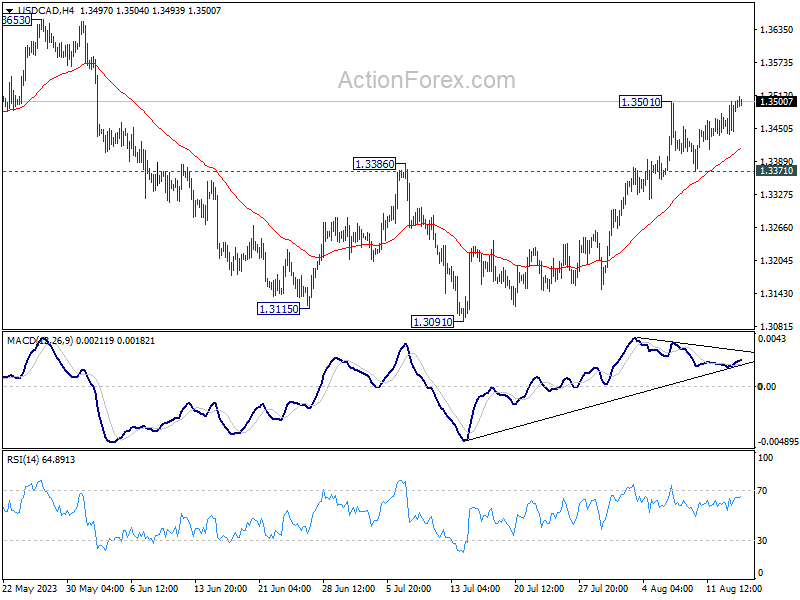
Intraday bias in USD/CAD is back on the upside with break of 1.3501 resistance. Intraday bias is back on the upside. As noted before, corrective fall from 1.3976 should have completed with three waves down to 1.3091. Further rally would be seen to retest 1.3653 resistance next. Break there will further confirm this case and target 1.3976 high. For now, further rally is expected as long as 1.3371 support holds, in case of retreat.
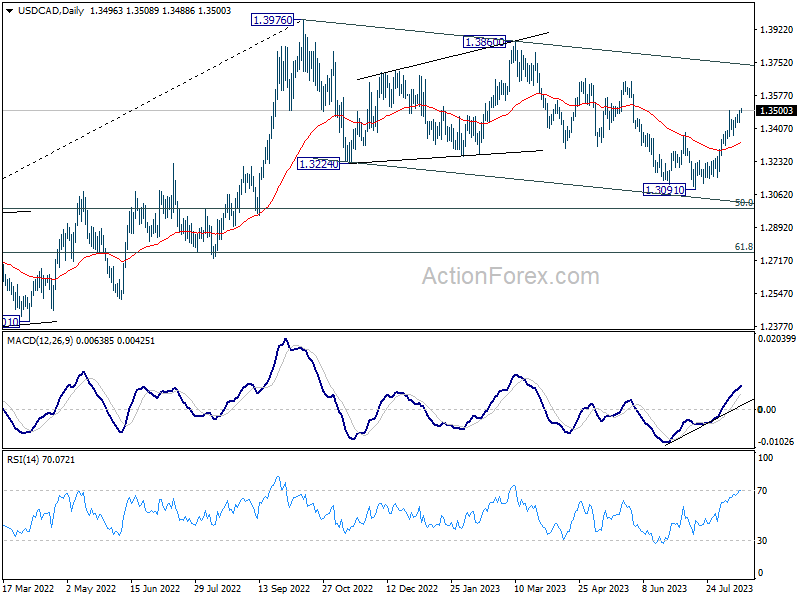
In the bigger picture, price actions from 1.3976 are viewed as a corrective fall only. Upon completion, rise from 1.2005 (2021 low) would resume through 1.3976 towards 1.4667/89 long term resistance zone. In case of another fall, downside should be contained by 61.8% retracement of 1.2005 to 1.3976 at 1.2758.
EUR/JPY Daily Outlook
Daily Pivots: (S1) 158.41; (P) 158.88; (R1) 159.21; More....
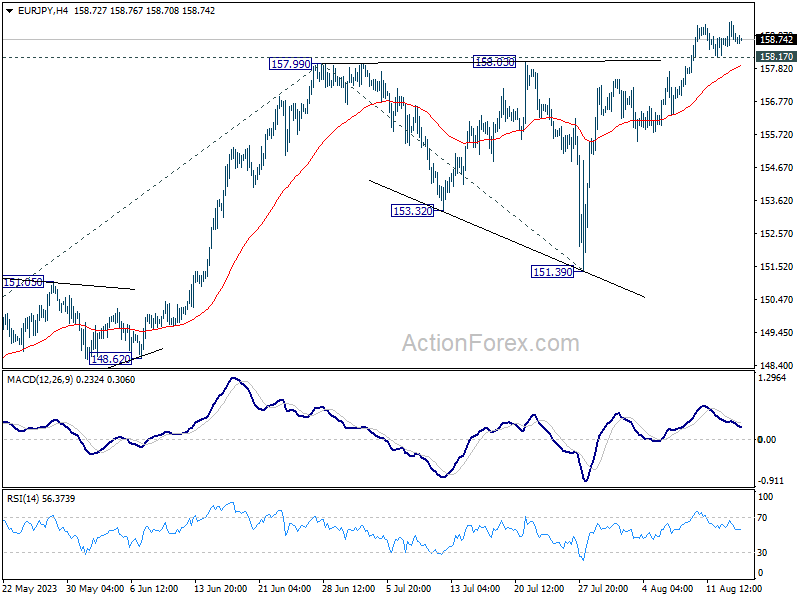
EUR/JPY continues to lose upside momentum as seen in 4H MACD. But with 158.17 minor support intact, intraday bias stays on the upside. Current up trend should target 61.8% projection of 139.05 to 157.99 from 151.39 at 163.09 next. On the downside, below 158.17 minor support will turn bias neutral again and bring more consolidations.
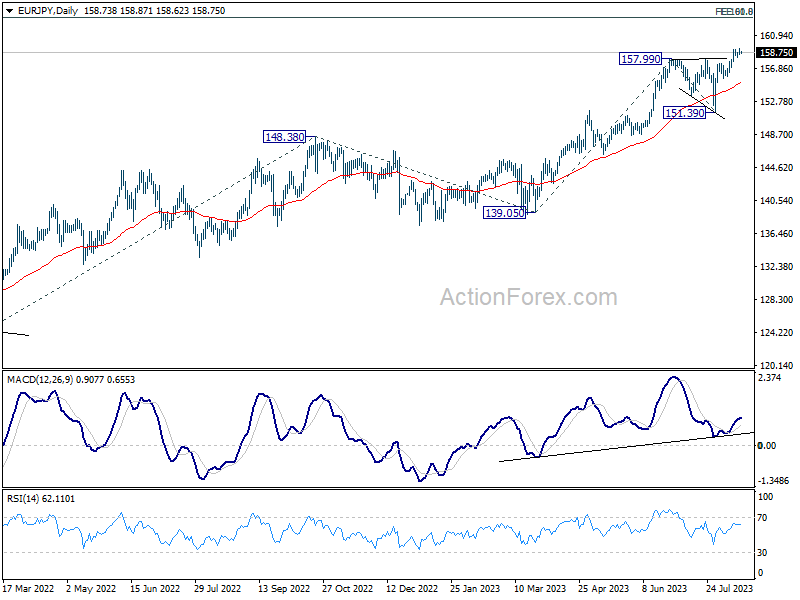
In the bigger picture, rise from 114.42 (2020 low) is in progress. Next target is 100% projection of 124.37 to 148.38 from 139.05 at 163.06. Sustained break there will pave the way to retest long term resistance at 169.96. This will now remain the favored case as long as 151.39 support holds, even in case of deep pull back.
EUR/AUD Daily Outlook
Daily Pivots: (S1) 1.6785; (P) 1.6849; (R1) 1.6956; More...
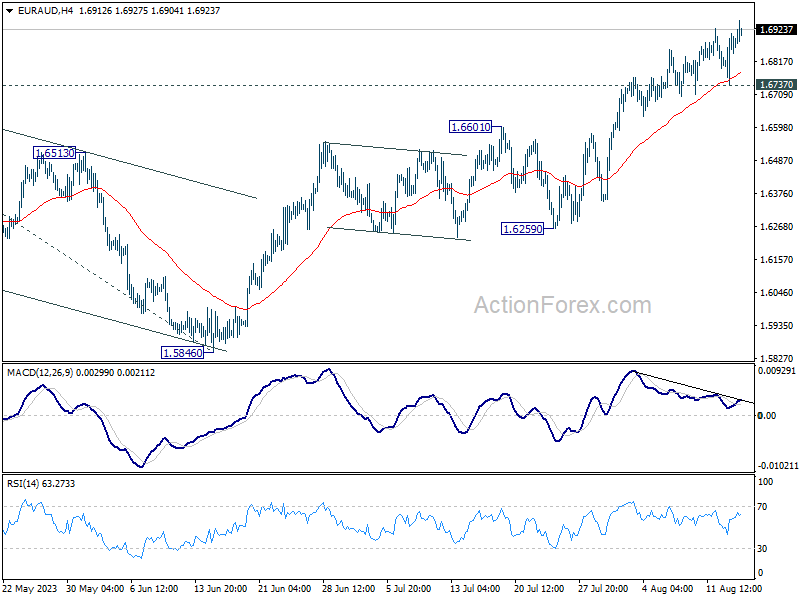
EUR/AUD's rally continues today and intraday bias remains on the upside. Current rally is part of the up trend from 1.4281. Next target is 1.7377 projection level next. On the downside, break 1.6737 minor support will intraday bias neutral and bring consolidations first, before staging another rise.
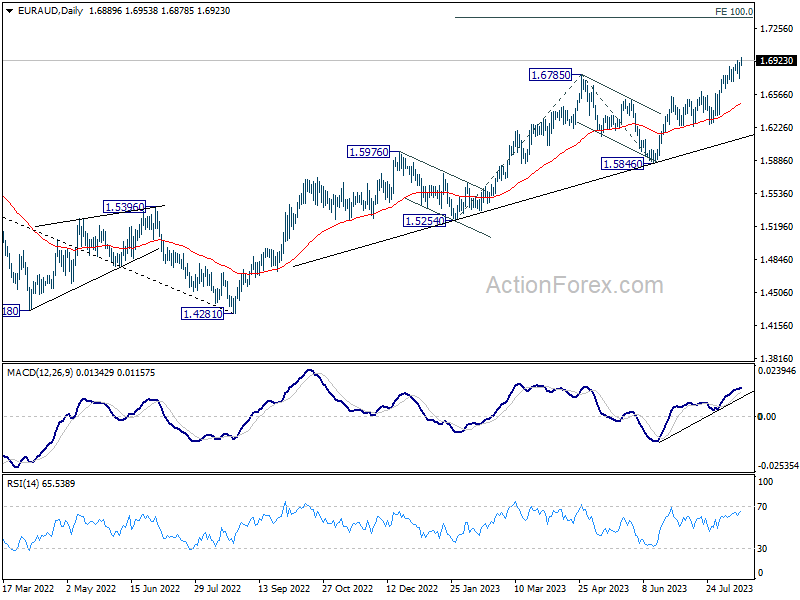
In the bigger picture, the rise from 1.4281 (2022 low) is in progress. Next target is 100% projection of 1.5254 to 1.6785 from 1.5846 at 1.7377. For now, outlook will stay bullish as long as 1.5846 support holds, even in case of another pull back.
EUR/CHF Daily Outlook
Daily Pivots: (S1) 0.9566; (P) 0.9581; (R1) 0.9595; More...
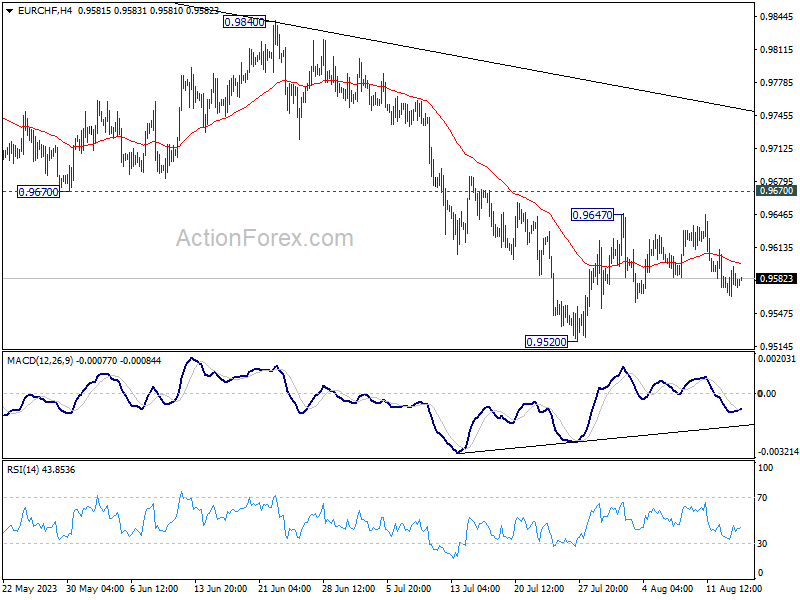
EUR/CHF is staying in established range and intraday bias remains neutral for the moment. On the upside, break of 0.9647 will resume the rebound from 0.9520. Further sustained break of 0.9670 will be the first sign of bullish reversal and target 0.9840 resistance for confirmation. On the downside, break of 0.9520 will resume the whole fall from 1.0095 towards 0.9407 low.
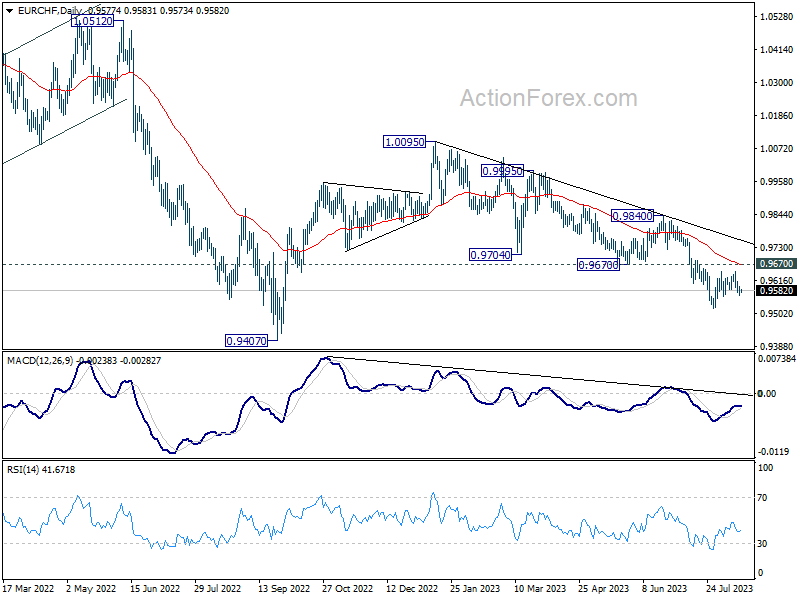
In the bigger picture, medium term outlook is staying bearish as the pair is capped well below falling 55 W EMA (now at 0.9859). Down trend from 1.2004 (2018 high) is in favor to continue. Sustained break of 0.9407 will target 61.8% projection of 1.1149 to 0.9407 from 1.0095 at 0.9018. For now, this will remain the favored case as long as 0.9840 resistance holds, in case of strong rebound.
Silver (XAGUSD) Short Term Bearish Structure
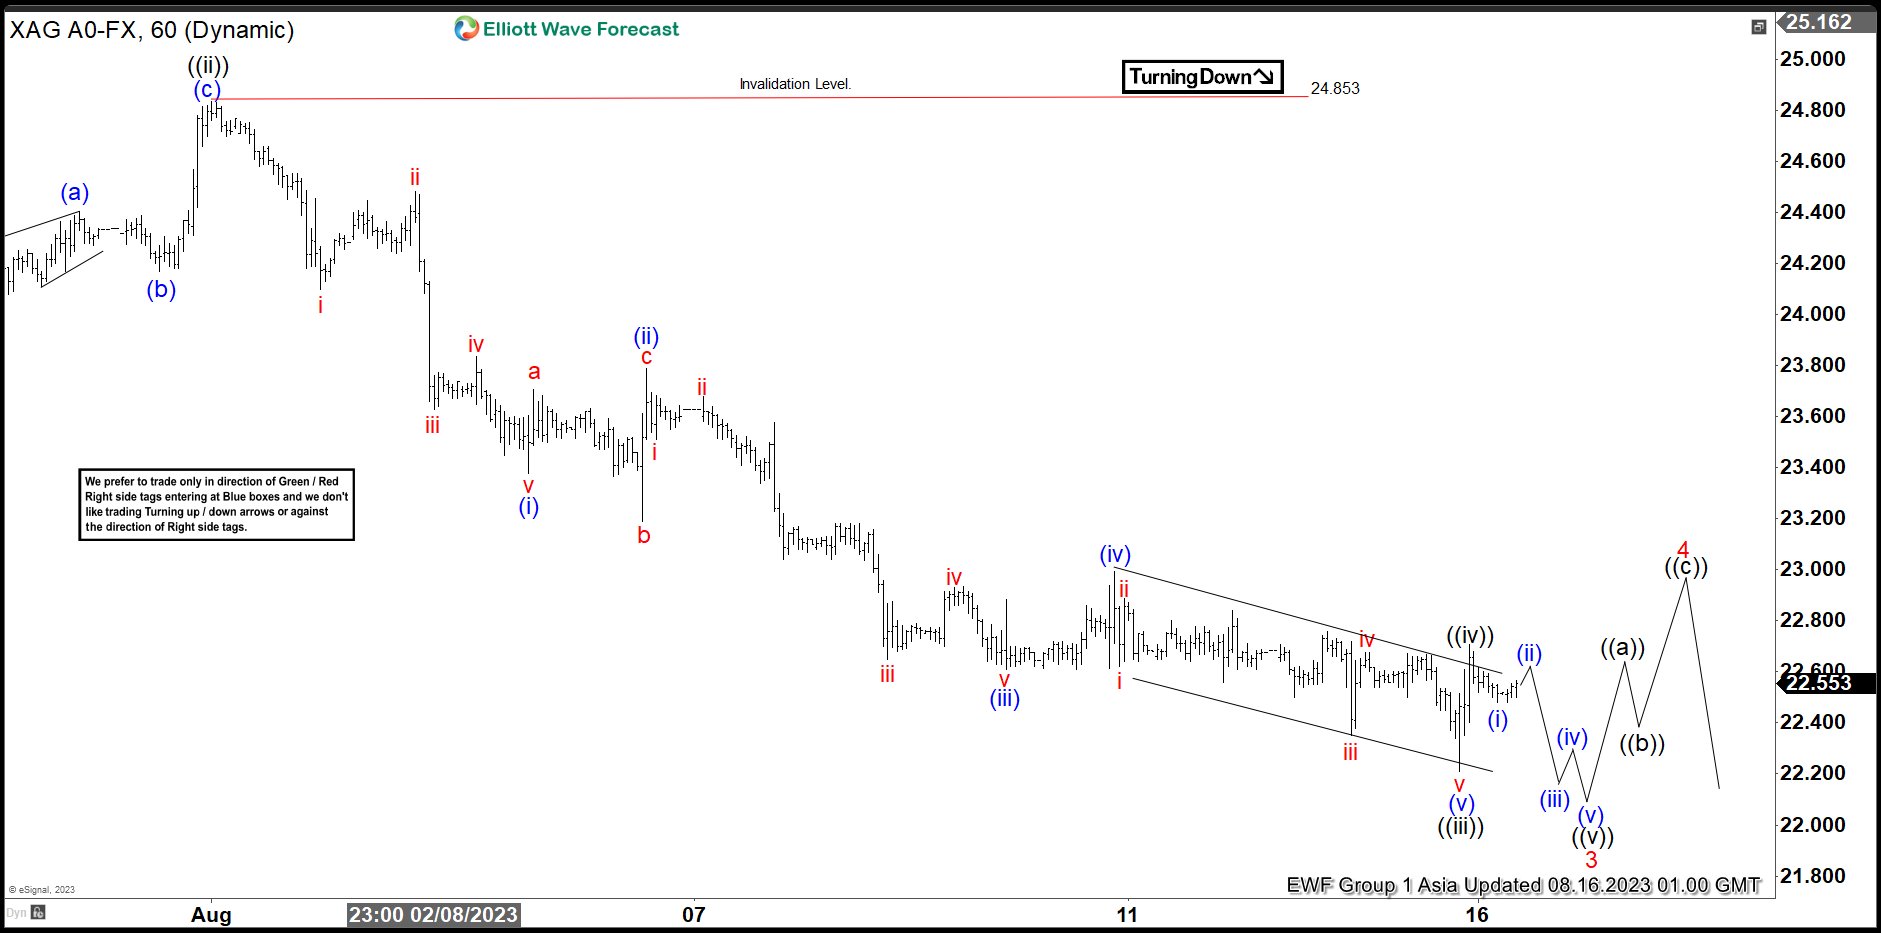
Silver (XAGUSD) cycle from 5.5.2023 high remains in progress with extreme area target of 18.78 – 21.26. Near term, cycle from 7.27.2023 high is in progress as a 5 waves impulse Elliott Wave structure. Down from 7.27.2023 peak, wave ((i)) ended at 24.03 and wave ((ii)) rally ended at 24.85. The 1 hour chart below shows the wave ((ii)) starting point. The metal then extended lower in wave ((iii)). Down from wave ((ii)), wave (i) ended at 23.37 and rally in wave (ii) ended at 23.78. The metal extended lower in wave (iii) towards 22.6 and rally in wave (iv) ended at 23. Final leg wave (v) ended at 22.21 which completed wave ((iii)).
Corrective bounce in wave ((iv)) is proposed complete at 22.70. Expect the metal to extend lower in wave ((v)) to complete wave 3 in higher degree. Afterwards, it should rally in wave 4 to correct cycle from 7.27.2023 high before it resumes lower again. As far as pivot at 24.85 high stays intact, expect wave 4 rally to fail in 3, 7, or 11 swing for further downside in wave 5. Potential target lower is the extreme area from 5.5.2023 peak at 18.78 – 21.26 where buyers should appear.
XAGUSD 60 Minutes Elliott Wave Chart
XAGUSD (Silver) Elliott Wave Video
https://www.youtube.com/watch?v=hCyF-FcsnhQ
Technical Outlook and Review
DXY:
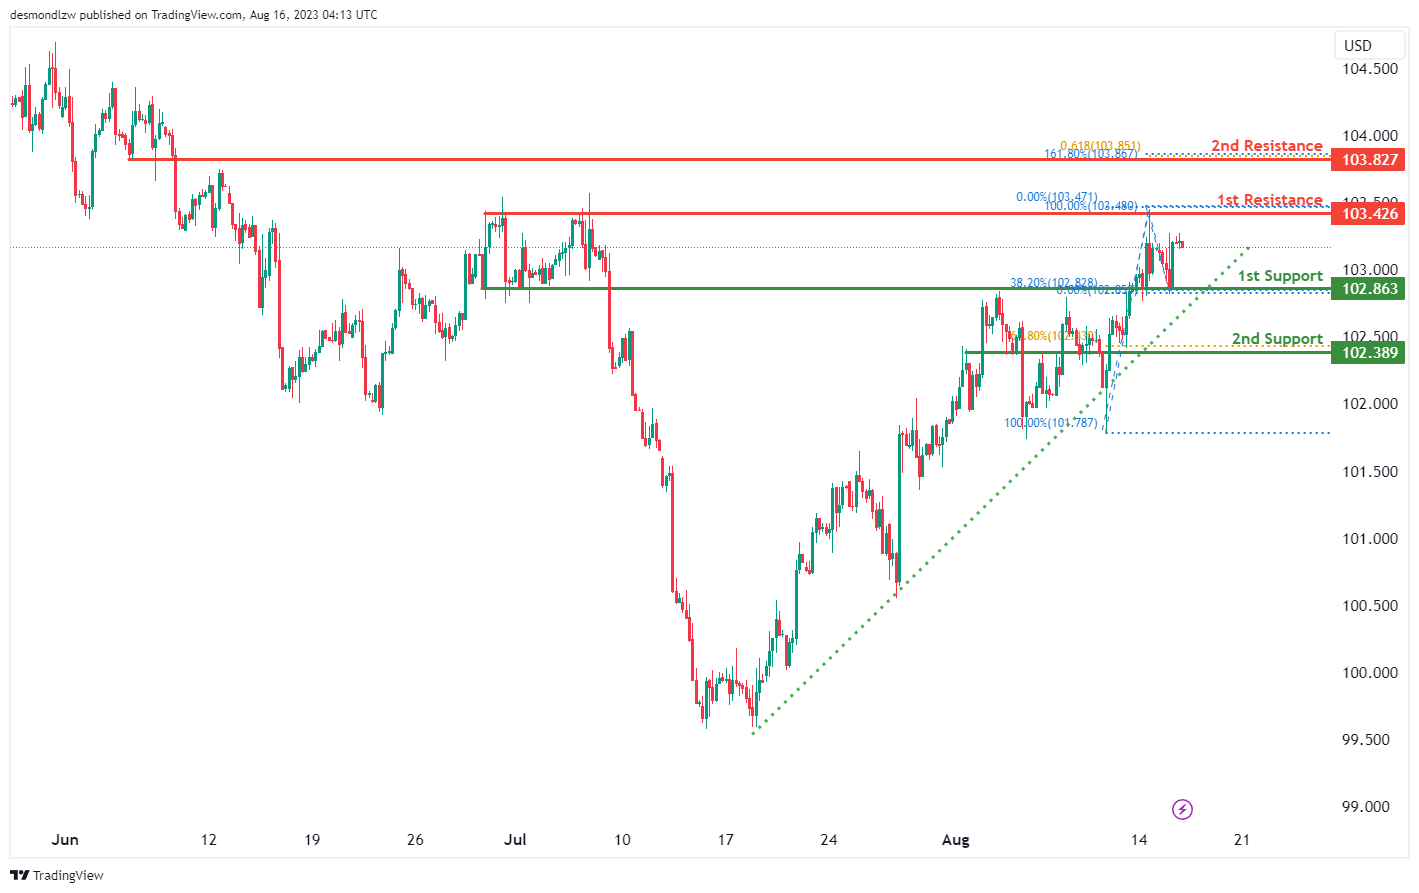
The current trend of the DXY indicates a bullish sentiment, supported by its position above a major ascending trend line. This suggests that there may be further upward momentum in the future.
There is a possibility that the price will initially decline towards the 1st support level at 102.86. This support level is significant as it is an overlap support and also corresponds to the 38.20% Fibonacci retracement level.
In the event of a rebound, the 1st resistance level at 103.42 is notable as it is an overlap resistance. Additionally, the 2nd resistance at 103.82 is also a point of confluence, marked by the presence of both a 161.80% Fibonacci Extension and a 61.80% Fibonacci Projection.
Overall, the chart signals potential for further bullish movement but a downside correction is also a possibility before the upward movement resumes.
EUR/USD:
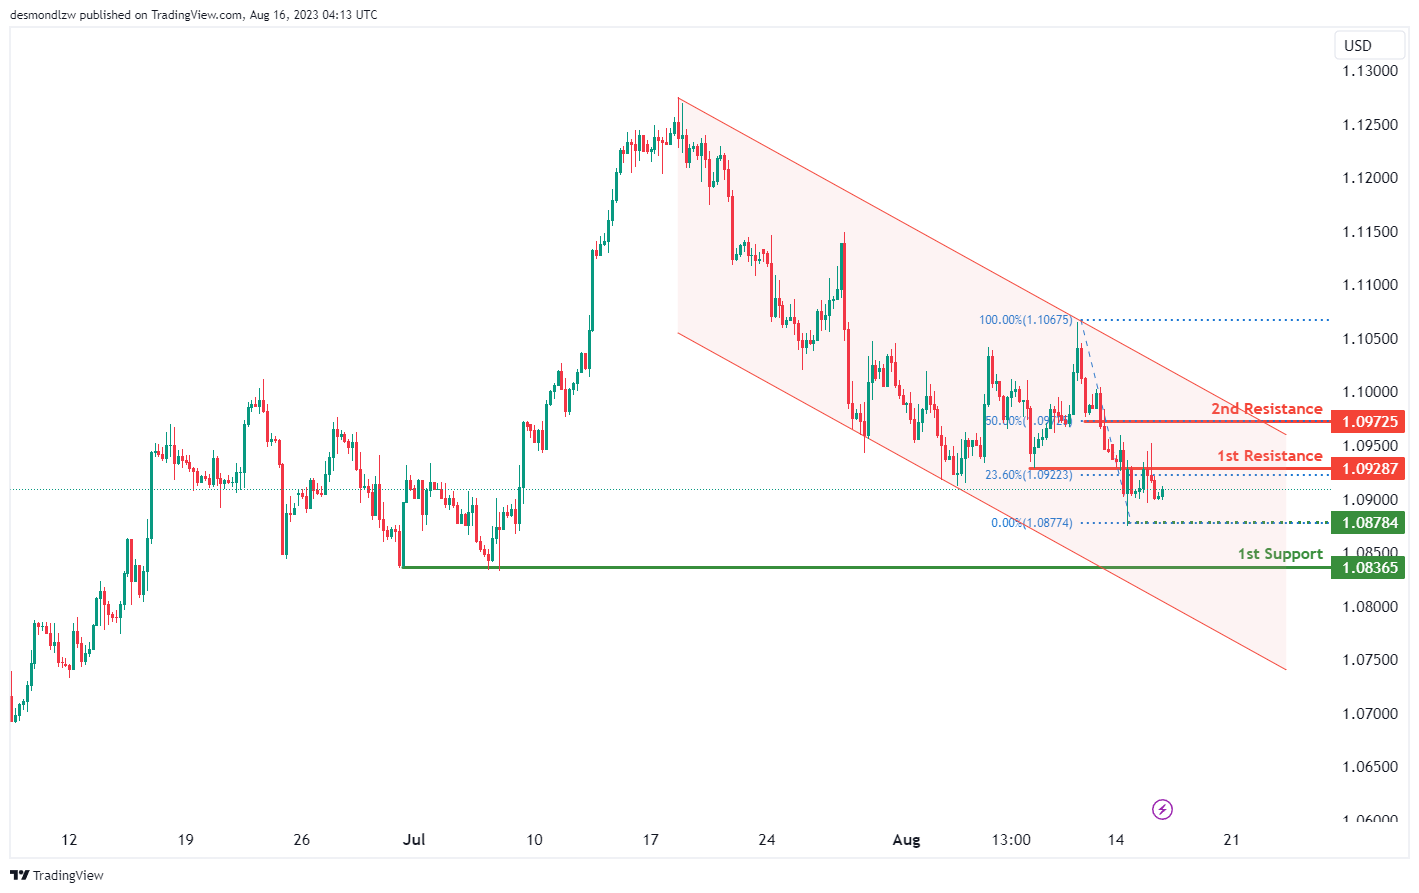
The EUR/USD chart currently exhibits a bearish momentum, evident by its position within a descending channel. This bearish channel pattern implies a potential continuation of the downward movement due to the prevailing bearish trend.
Considering this bearish sentiment, there’s a possibility of a bearish reaction occurring as the price reaches the 1st resistance level at 1.0928, followed by a potential drop towards the 1st support at 1.0836. This support level gains significance as it aligns with a multi-swing low point.
Additionally, an intermediate support level at 1.0878, corresponding to a swing low support, further reinforces the potential for a support zone.
Conversely, the presence of the 1st resistance at 1.0928 is notable due to its classification as an overlap resistance and its alignment with the 23.60% Fibonacci retracement level. Furthermore, a 2nd resistance level at 1.0972 holds significance as it corresponds to the 50% Fibonacci retracement, adding to its potential as a resistance level.
EUR/JPY:
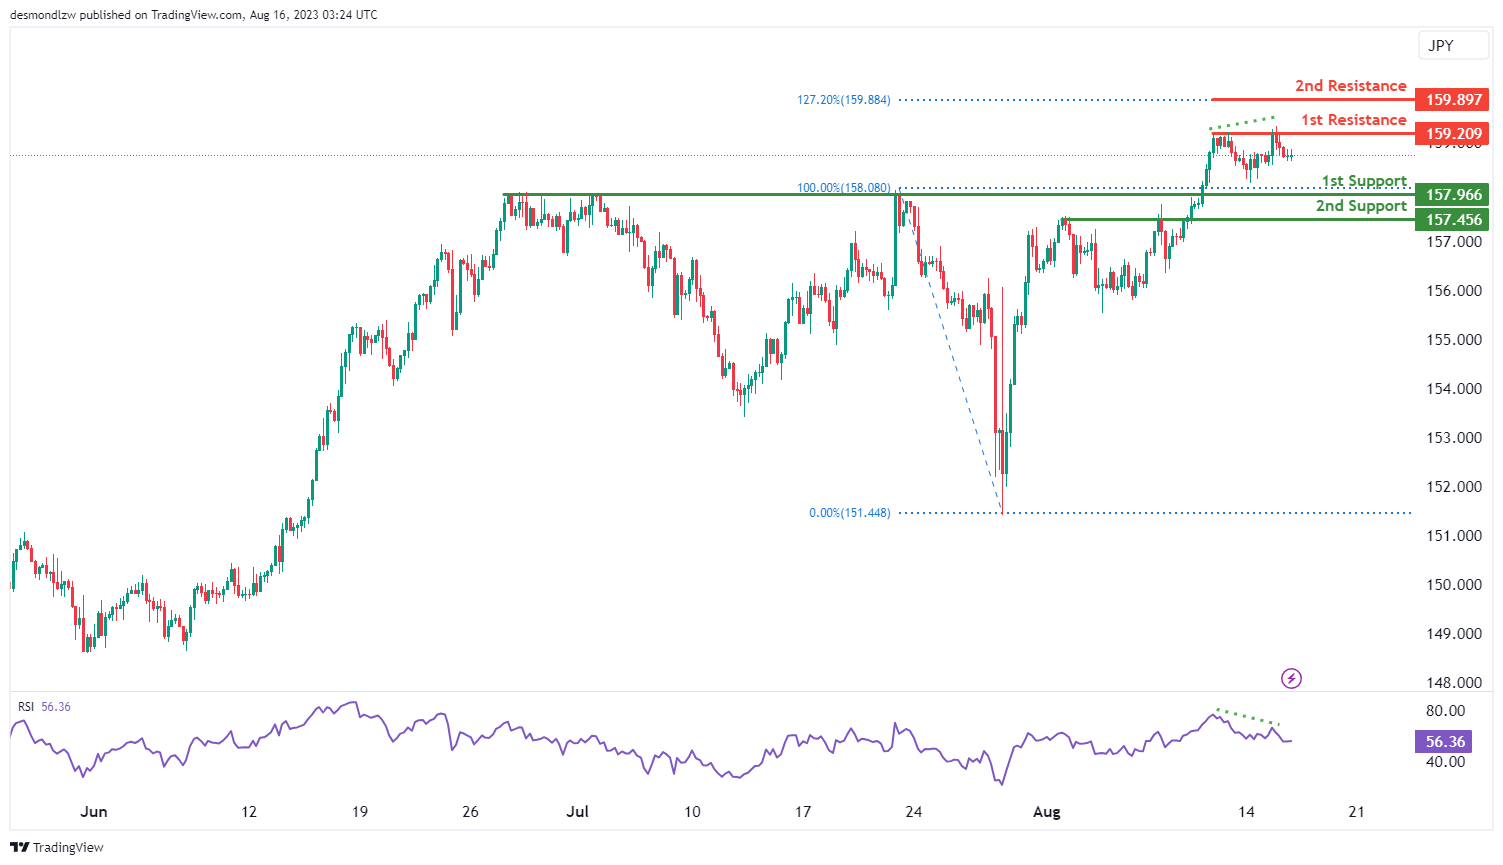
The EUR/JPY chart currently indicates a bearish momentum, implying the potential for further downward movement. It’s conceivable that the price could experience a bearish continuation towards the 1st support level at 157.96. This support level gains significance as a pullback support, potentially influencing price action.
Additionally, the 2nd support at 157.45 further reinforces the potential for a downward move. On the resistance side, the 1st resistance at 159.20 holds importance as a multi-swing high resistance level. The 2nd resistance at 159.89 is notable due to its alignment with a 127.20% Fibonacci extension, adding to its potential impact.
Moreover, the Relative Strength Index (RSI) is exhibiting bearish divergence compared to the price, suggesting a possible upcoming reversal. This could indicate a shift in momentum from the current bearish trend.
EUR/GBP:
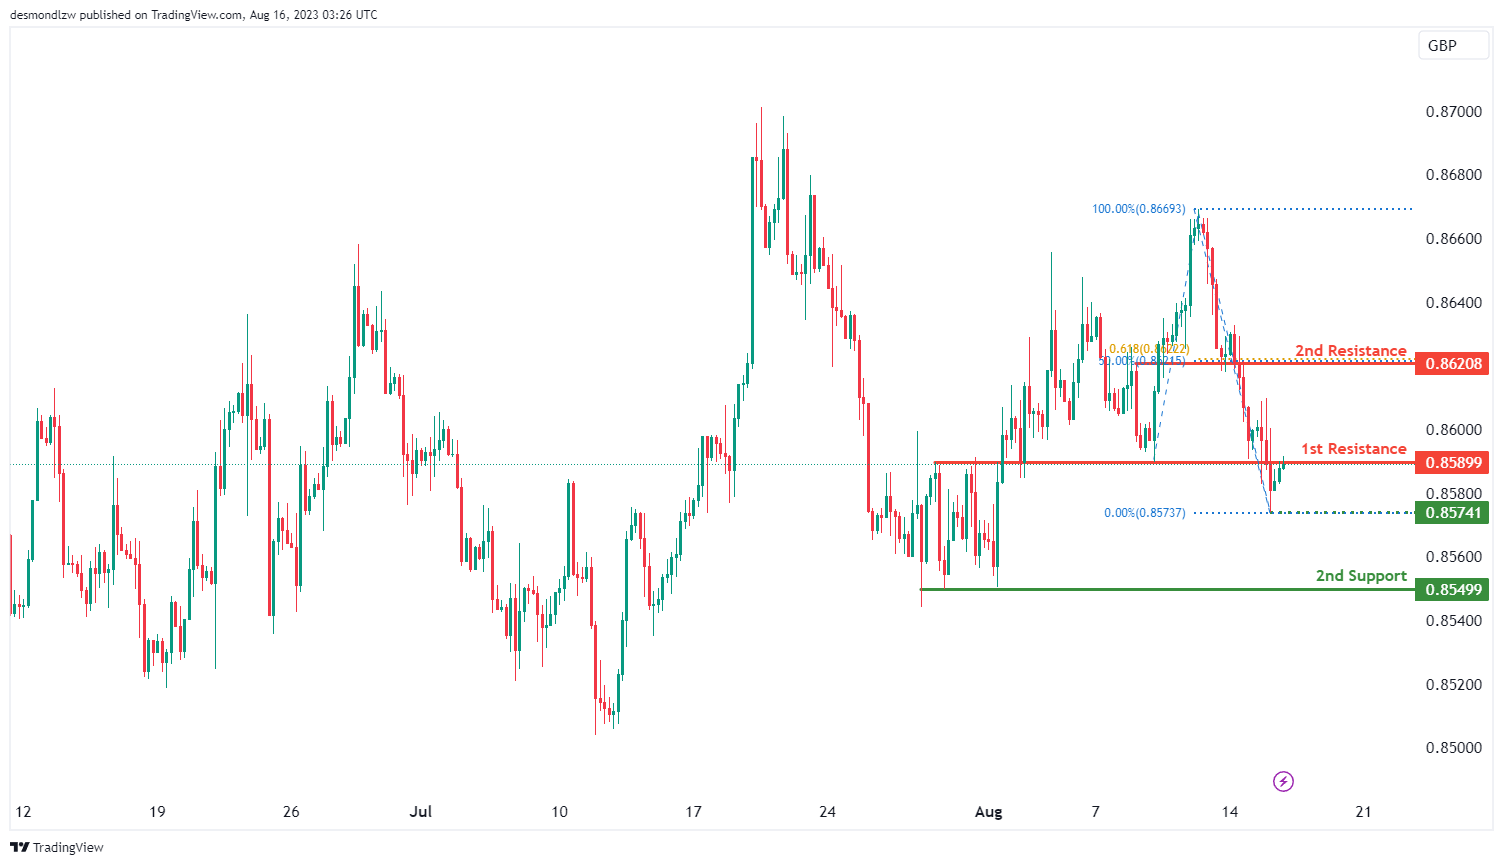
The EUR/GBP chart currently reflects a bearish momentum, indicating a potential downward trend. Given this momentum, there is a possibility of a bearish reaction occurring upon reaching the 1st resistance level, followed by a potential drop towards the 1st support.
The 1st support level at 0.8549 is significant due to its alignment with a multi-swing low support, adding to its potential influence.
Conversely, the 1st resistance level at 0.8589 holds importance as an overlap resistance. The 2nd resistance at 0.8620 gains significance from its alignment with a 50% Fibonacci retracement and a 61.80% Fibonacci projection, suggesting a potential Fibonacci confluence.
Furthermore, an intermediate support at 0.8549 reinforces the overall support structure by aligning with a multi-swing low support.
GBP/USD:
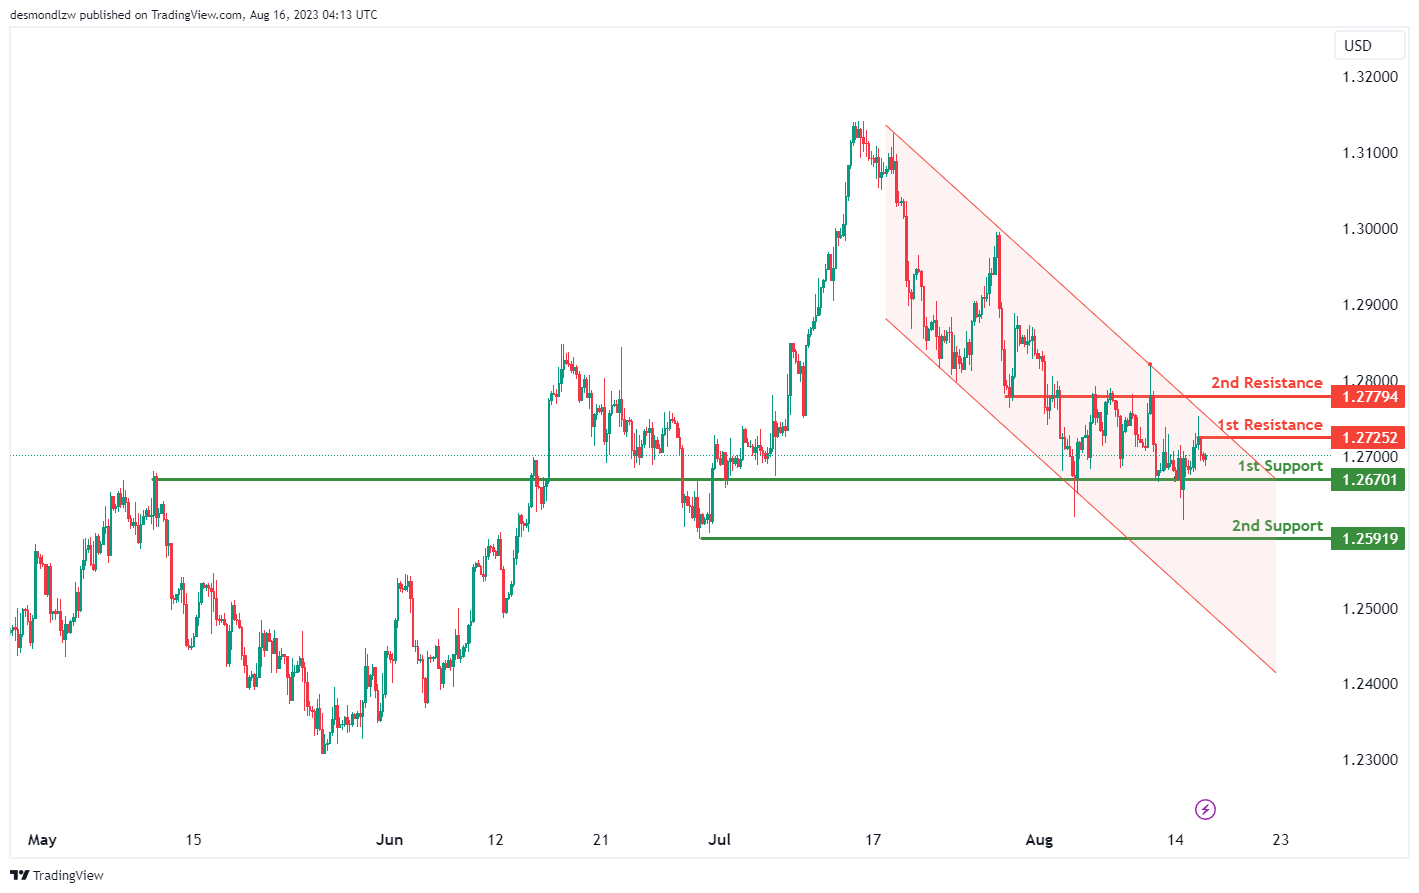
The USD/GBP chart currently demonstrates a bearish momentum, evident by its position within a descending channel. This bearish channel pattern suggests a potential continuation of the downward movement due to the existing bearish trend.
Given this bearish sentiment, there’s a likelihood of a bearish continuation as the price moves towards the 1st support level at 1.2670, potentially encountering an overlap support.
Additionally, the 2nd support level at 1.2591 adds to the support structure and gains significance as it aligns with a swing low point.
On the resistance side, the 1st resistance at 1.2725 and the 2nd resistance at 1.2779 are noteworthy. While the specific reasons for the 1st resistance are not mentioned, the 2nd resistance is categorized as an overlap resistance.
GBP/JPY:
The GBP/JPY chart currently exhibits a bearish momentum, indicating a potential downward trend. In light of this momentum, there is a scenario where the price might continue its bearish movement towards the 1st support level.
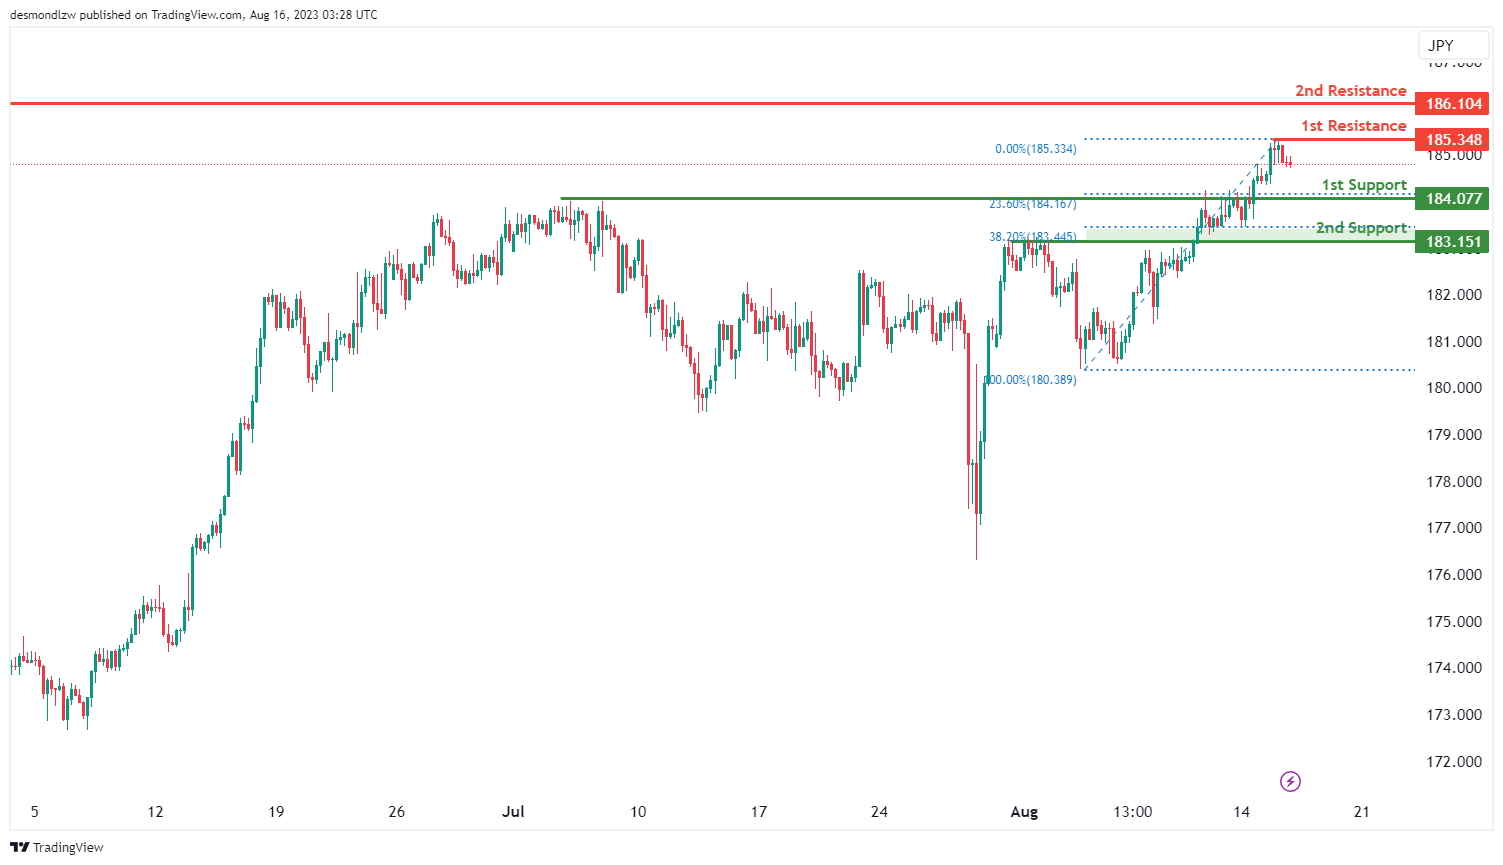
The 1st support at 184.07 gains significance as a pullback support, further reinforced by its alignment with a 23.60% Fibonacci retracement. The 2nd support at 183.15 also holds importance due to its role as a pullback support, along with its alignment with a 38.20% Fibonacci retracement.
Conversely, the 1st resistance level at 185.34 is notable as a swing high resistance, and its significance is enhanced by its alignment with a 161.80% Fibonacci extension. The 2nd resistance at 186.10 carries strength as a swing high resistance, potentially influencing price movements.
USD/CHF:
The USD/CHF chart currently showcases a bearish momentum, suggesting a prevailing downward trend.
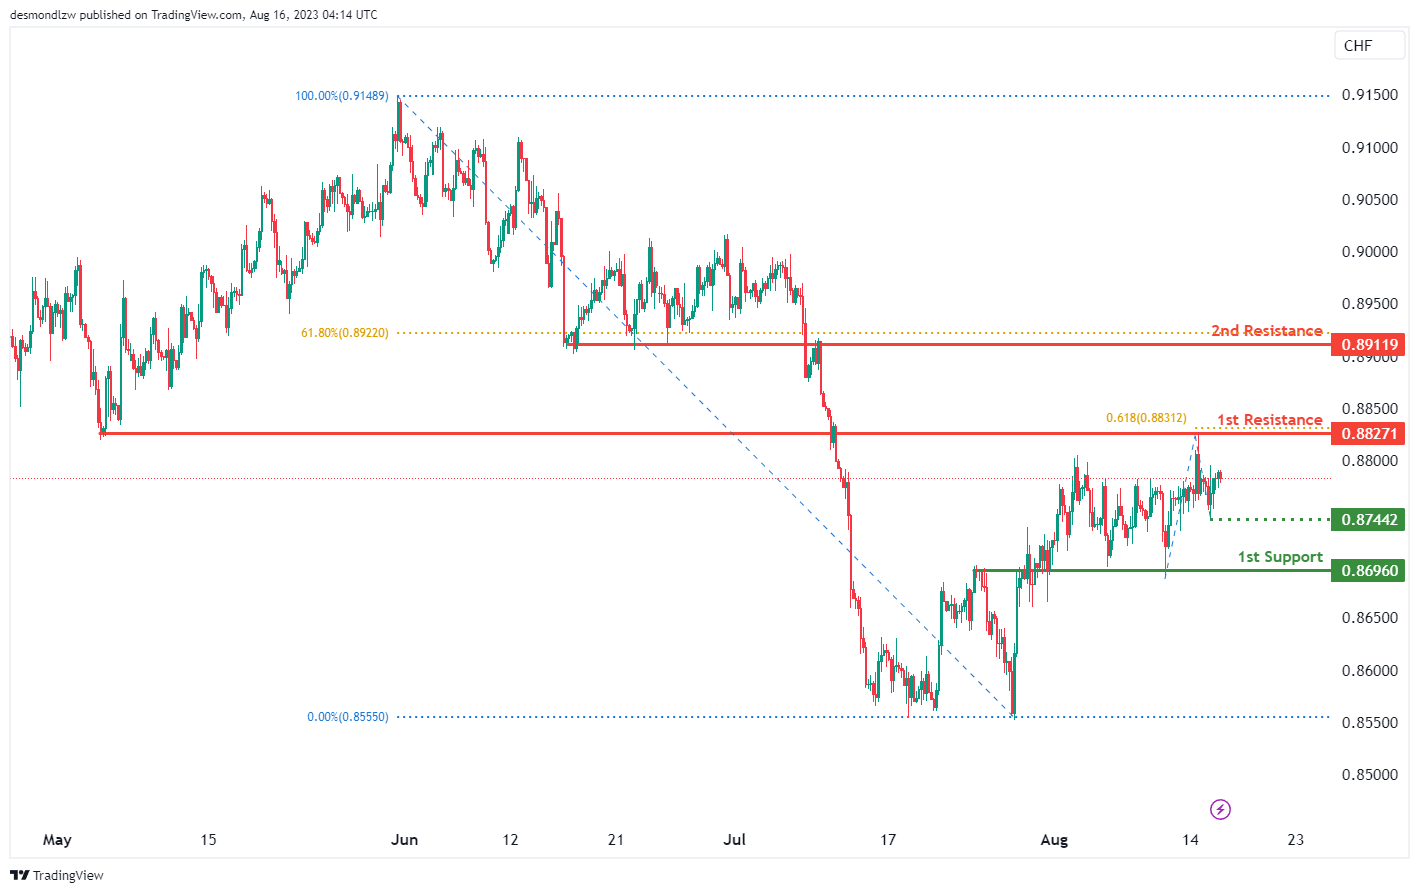
Within this bearish context, there is a possibility of a bearish continuation towards the 1st support level at 0.8696, which is identified as an overlap support. Moreover, an intermediate support at 0.8744, acting as a swing low support, adds to the potential support zones.
On the resistance side, the 1st resistance at 0.8827 holds significance due to its categorization as an overlap resistance and alignment with a 61.80% Fibonacci Projection.
Additionally, the 2nd resistance at 0.8911 is notable as a pullback resistance. This resistance level gains importance as it aligns with a 61.80% Fibonacci Retracement.
USD/JPY:
The USD/JPY chart currently reflects a bullish momentum, suggesting a prevailing upward trend.
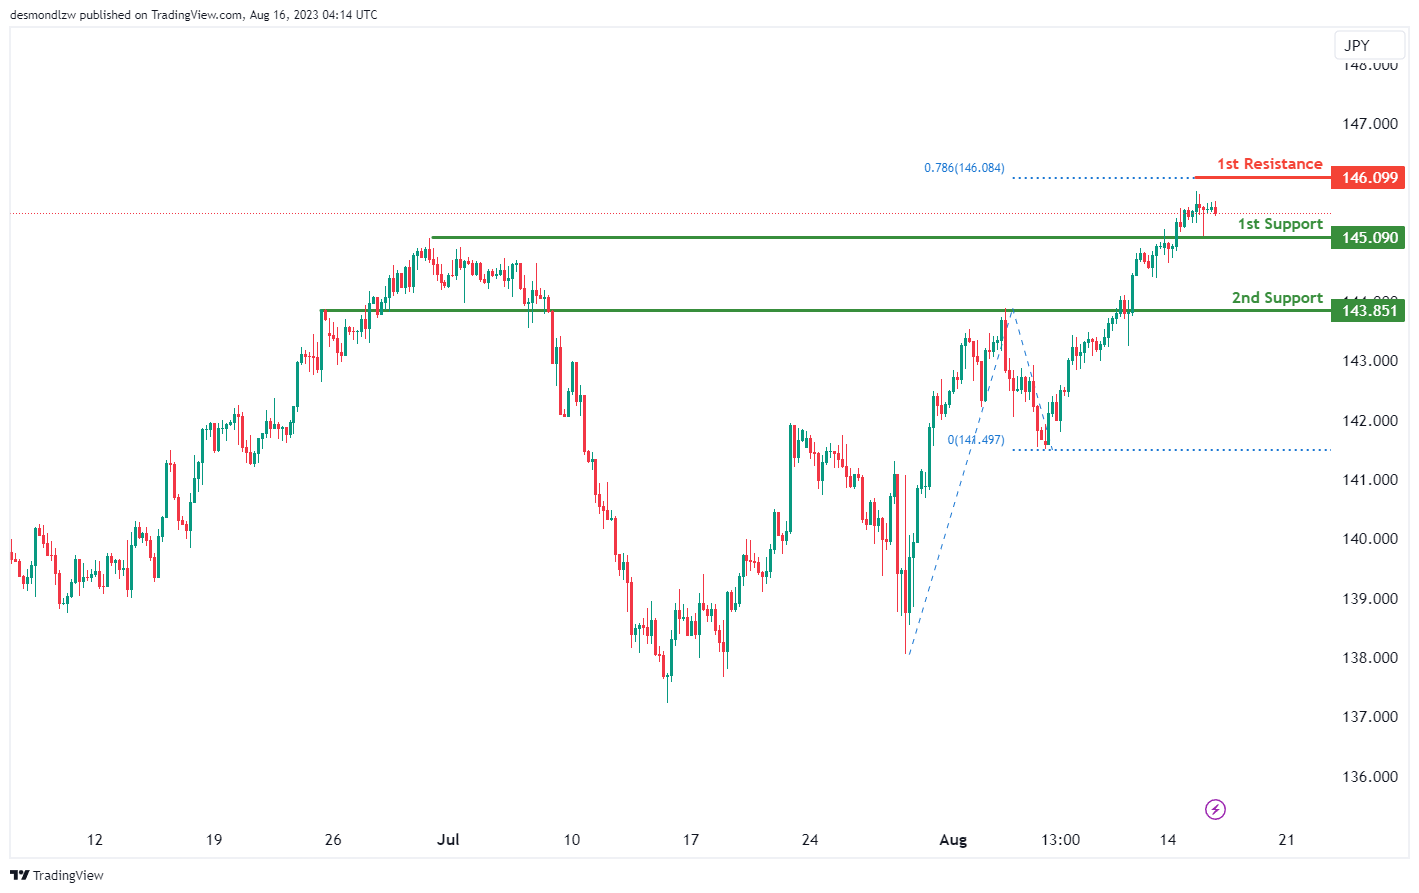
Within this bullish context, a potential scenario could involve a short-term drop in price towards the 1st support level at 145.09, identified as an overlap support. This might be followed by a bounce from this support, leading to a rise towards the 1st resistance at 146.09.
Adding to the support structure, the 2nd support at 143.85 is considered a pullback support, which could provide additional stability during price fluctuations.
On the resistance side, the significance of the 1st resistance at 146.09 is reinforced by its alignment with a 78.60% Fibonacci Projection.
Given the overall bullish momentum, the indicated support and resistance levels suggest the potential for a short-term drop followed by a subsequent upward movement.
USD/CAD:
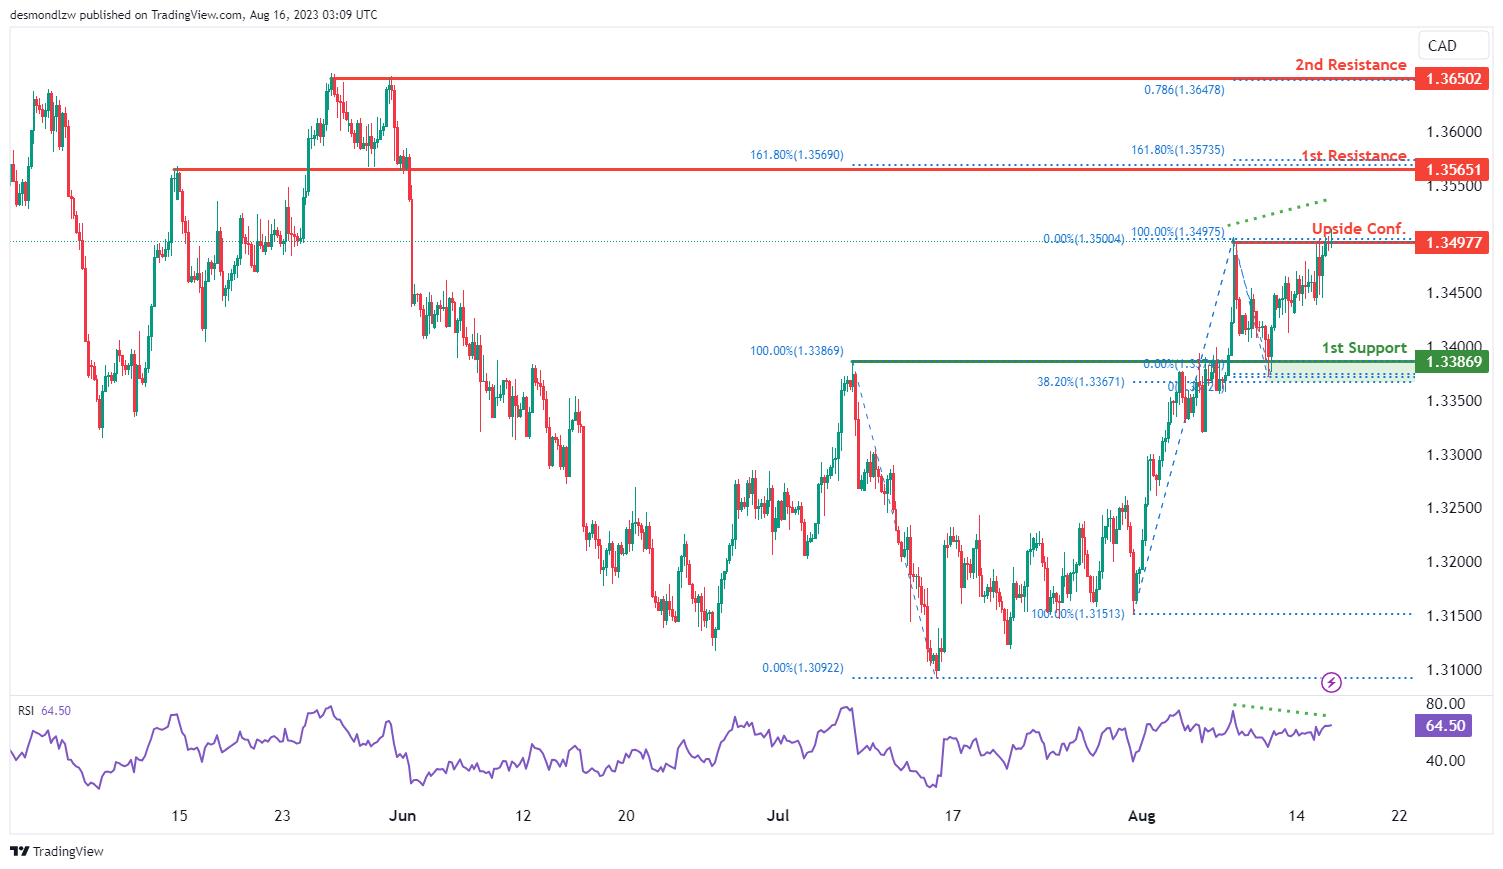
The current momentum of the USD/CAD chart is bullish, indicating a potential continuation of the upward trend should the price break through and stay above the upside confirmation level at 1.3498. Price could potentially climb towards the 1st resistance. However, do take note of the bearish RSI divergence that suggests that price could make a potential bearish reversal.
The 1st resistance at 1.3565 is significant due to its role as an overlap resistance and the presence of multiple Fibonacci confluence levels i.e. the double occurrence of the 161.80% Fibonacci extension levels. Furthermore, there is also a 2nd resistance at 1.3650 that is identified as an overlap resistance that aligns with the 78.60% Fibonacci projection level.
The 1st support level at 1.3387 is an overlap support that is reinforced by the 38.20% Fibonacci retracement level.
AUD/USD:
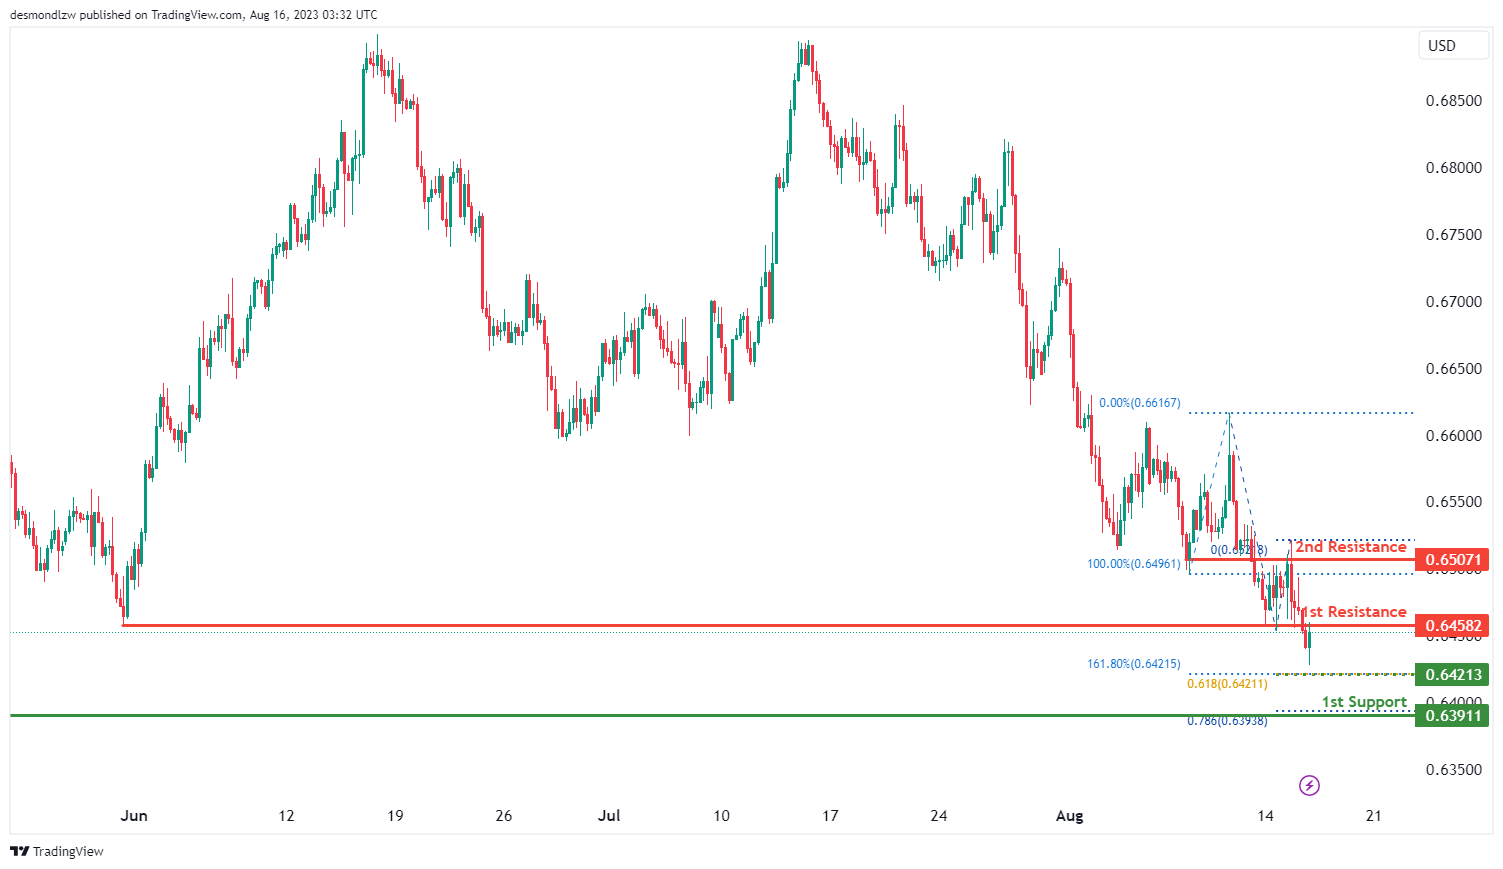
The current momentum of the AUD/USD chart is bearish, indicating a potential continuation of the downward trend.
There is a possibility that the price could experience a bearish reaction off the 1st resistance level at 0.6458 before moving down towards the intermediate support level at 0.6421. This level is supported by a confluence of Fibonacci levels i.e. the 61.80% projection and the 161.80% extension levels. Additionally, the 2nd support at 0.6391 is identified as a swing-low support that aligns with the 78.60% Fibonacci projection level.
To the upside, the 1st resistance at 0.6458 is identified as an overlap resistance. Furthermore, the 2nd resistance at 0.6507 is also identified as an overlap resistance.
NZD/USD
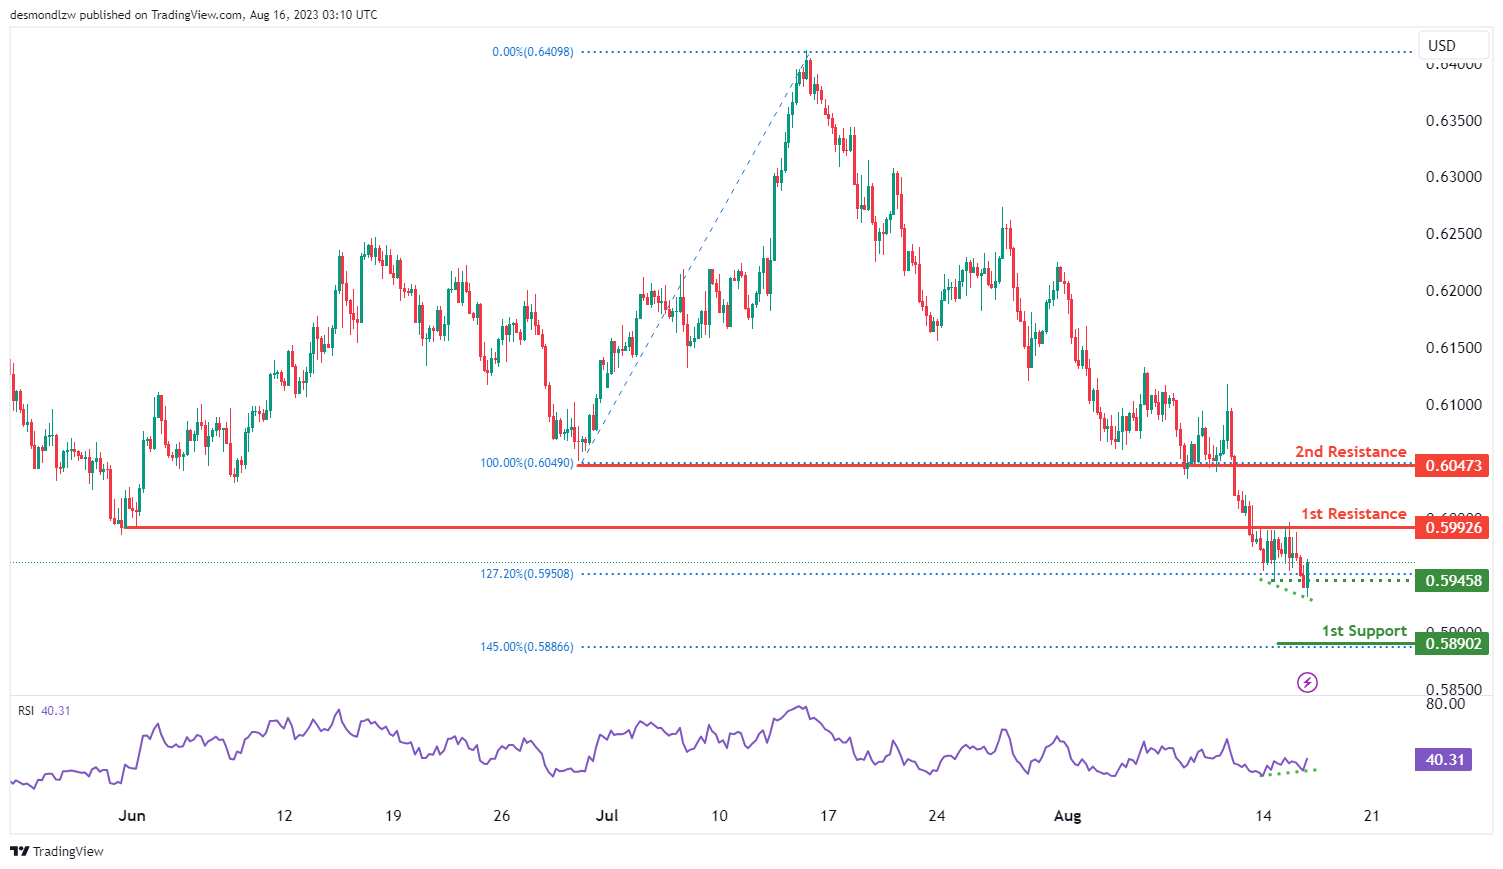
The current chart for NZD/USD indicates a bullish momentum, suggesting a potential continuation of the upward trend. This momentum is supported by the presence of bullish divergence between the price and the RSI indicator.
There is a likelihood that the price could experience a bullish movement towards the 1st resistance level at 0.5993 that is identified as an overlap resistance. Additionally, the 2nd resistance at 0.6047 is also identified as an overlap resistance.
To the downside, the intermediate support level at 0.5946 aligns with the 127.20% Fibonacci extension level. Furthermore, the 1st support level at 0.5890 aligns with the 145.00% Fibonacci extension level.
DJ30:
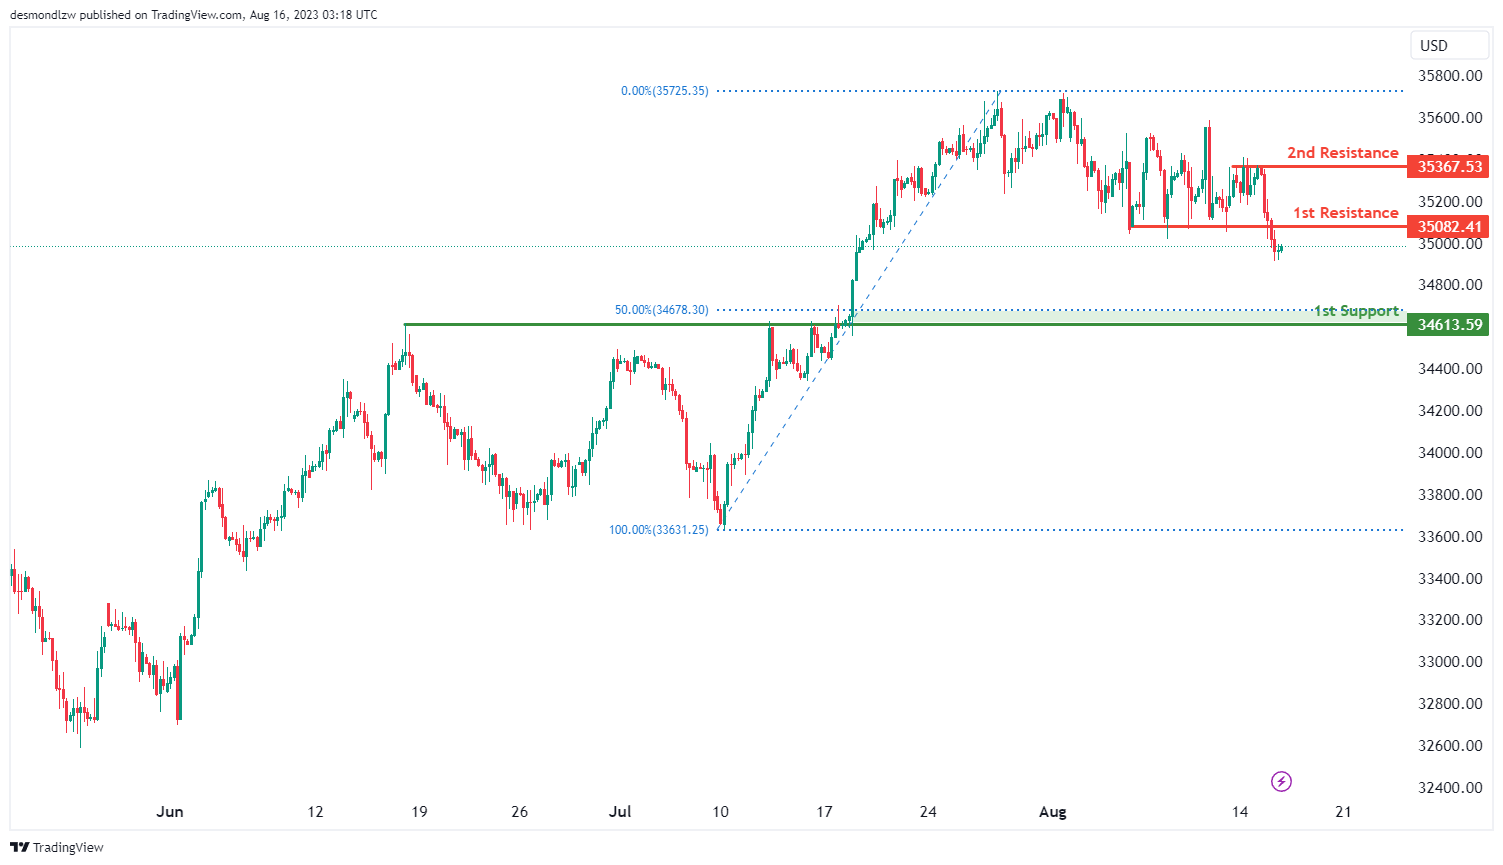
The current analysis of DJ30 indicates a bearish momentum, suggesting a potential continuation of the downward trend. There is a possibility for the price to experience a short-term upward movement towards the 1st resistance level at 35082.41 before reversing and heading towards the 1st support at 34613.59. The 1st support is supported by the presence of a 50% Fibonacci retracement level.
In addition, the 2nd resistance at 35367.53 is notable as a multi-swing high resistance, which could potentially act as a barrier to any further upward movement.
GER30:
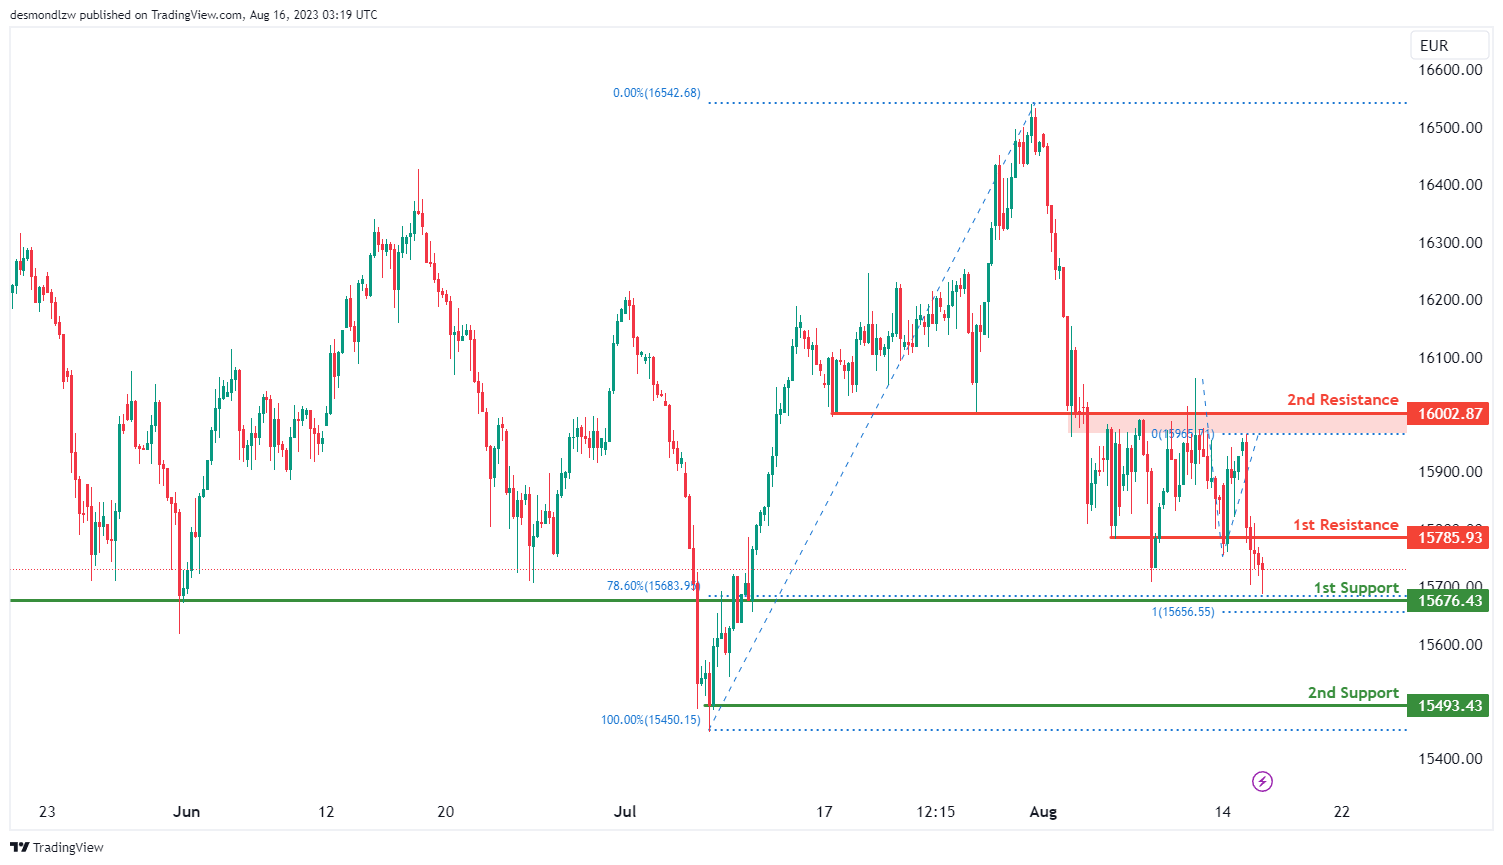
The GER30 chart currently shows a bullish momentum, suggesting a potential continuation of the upward trend. There is a possibility that the price might bounce off the 1st support at 15676.43, which is supported by both a 78.60% Fibonacci retracement level and a 100% Fibonacci projection. Additionally, the 2nd support at 15493.43 serves as a potential level for a reversal.
On the other hand, the 1st resistance at 15785.93 is significant as an overlap resistance, which could pose a challenge for further upward movement. The 2nd resistance at 16002.87 also acts as a pullback resistance, adding to the resistance levels to watch for potential price movement.
US500
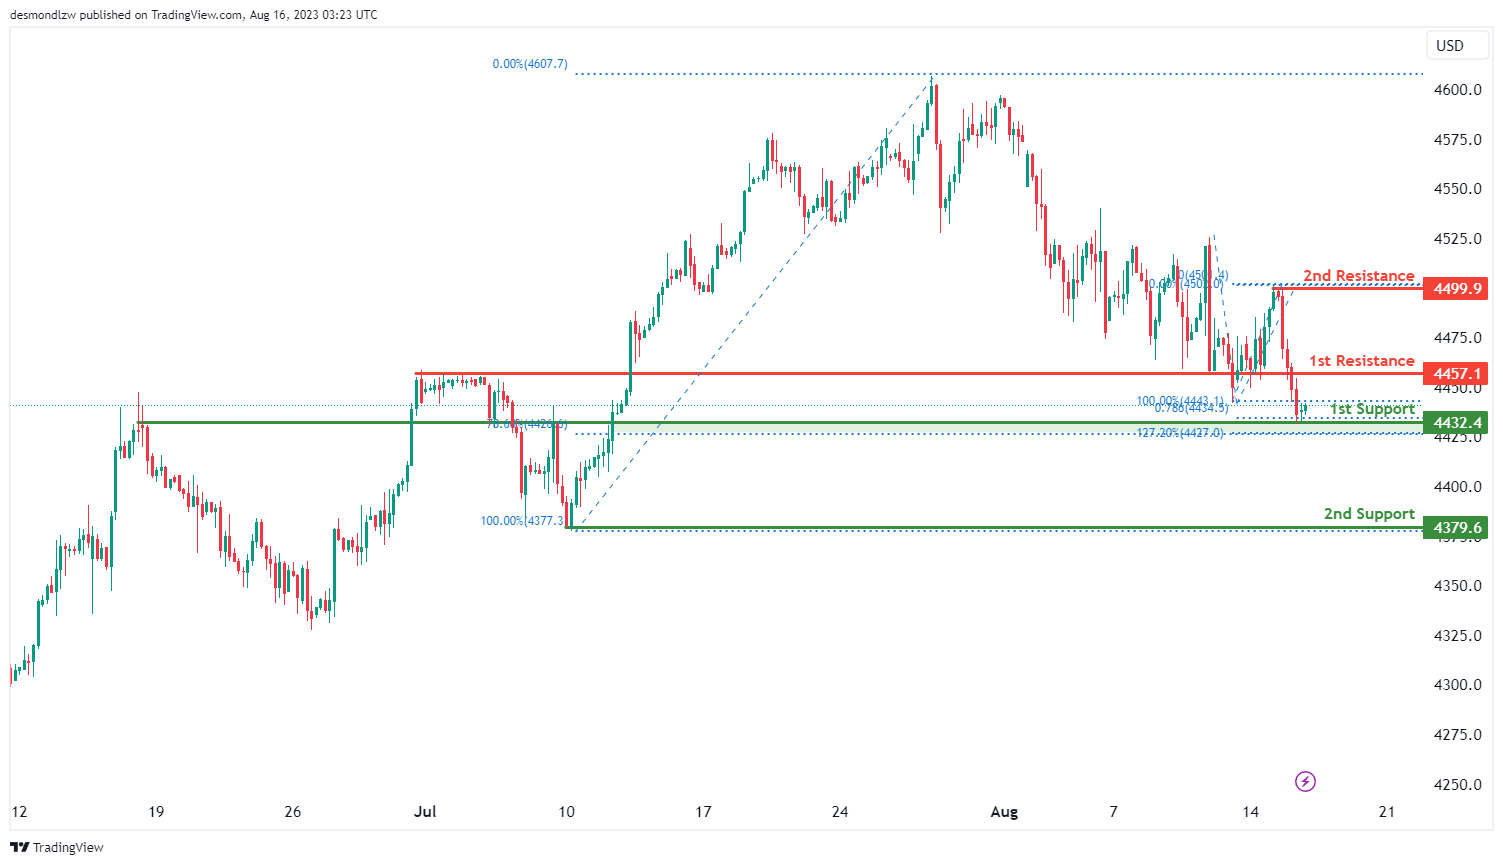
The US500 chart currently reflects a bullish momentum, suggesting the potential for a continuation of the upward trend. It’s plausible that the price might experience a bullish bounce off the 1st support at 4432.4. This support level is significant as it aligns with both a 78.60% Fibonacci retracement and a 127.20% Fibonacci extension, highlighting a Fibonacci confluence and reinforcing its importance.
Furthermore, the 2nd support at 4379.6 adds to the potential for a rebound. On the resistance side, the 1st resistance at 4457.1 holds significance as an overlap resistance, which could impact upward movement. The 2nd resistance at 4499.9 serves as a notable swing high resistance, potentially influencing price behavior.
BTC/USD:
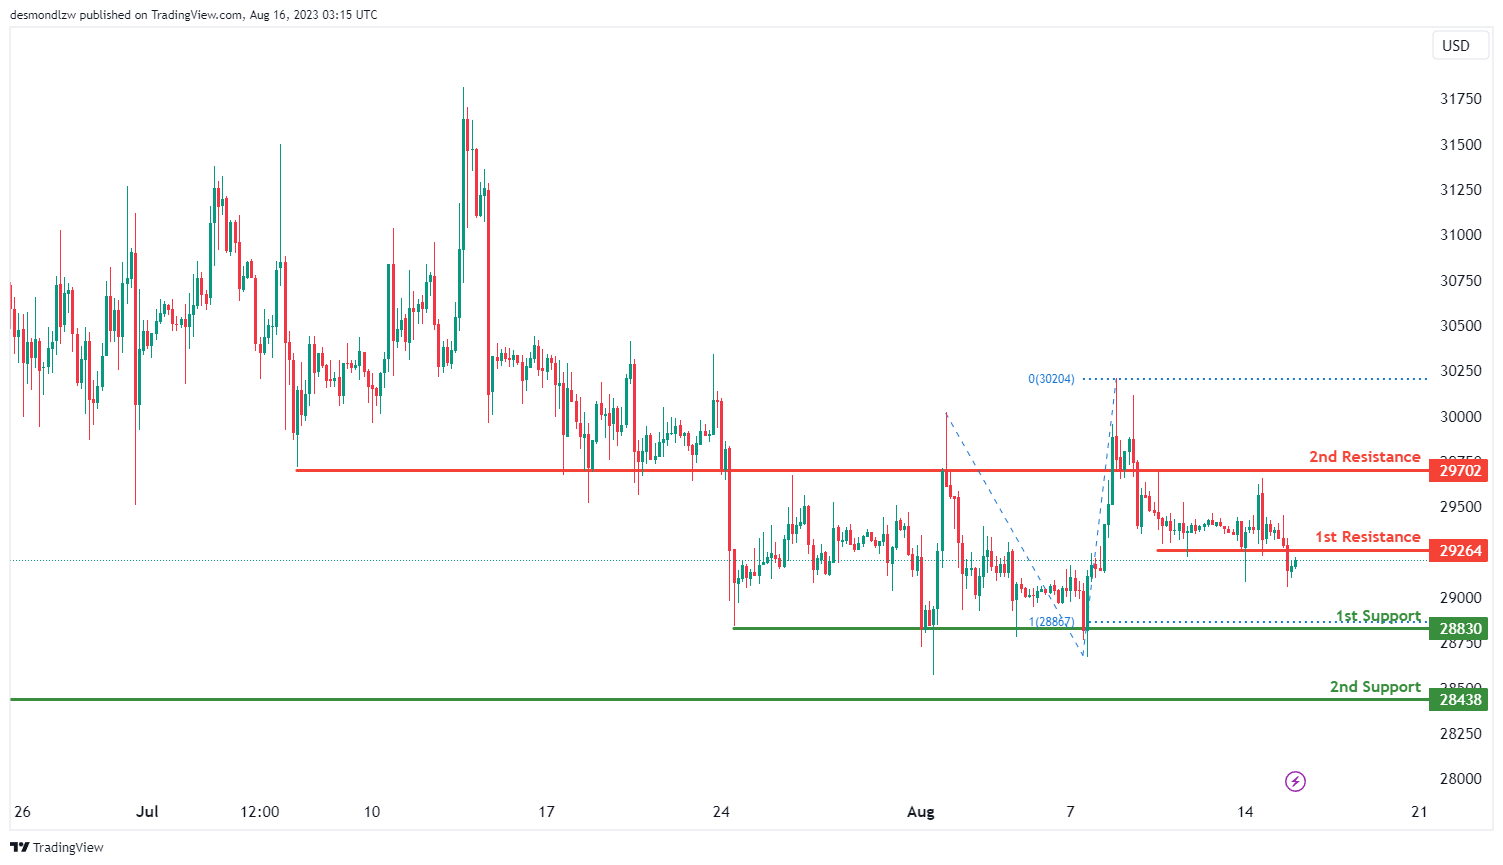
The current chart analysis of BTC/USD indicates a bearish momentum, suggesting a potential continuation of the downward trend. The price is expected to react bearishly upon reaching the 1st resistance level and move towards the 1st support level. The 1st support at 28830 is reinforced by a 100% Fibonacci Projection and can serve as a strong support level. The 2nd support at 28438 is also significant as an overlap support.
On the other hand, the 1st resistance at 29264 is noteworthy as it coincides with pullback resistance. Additionally, the 2nd resistance at 29702 is also important as an overlap resistance.
ETH/USD:
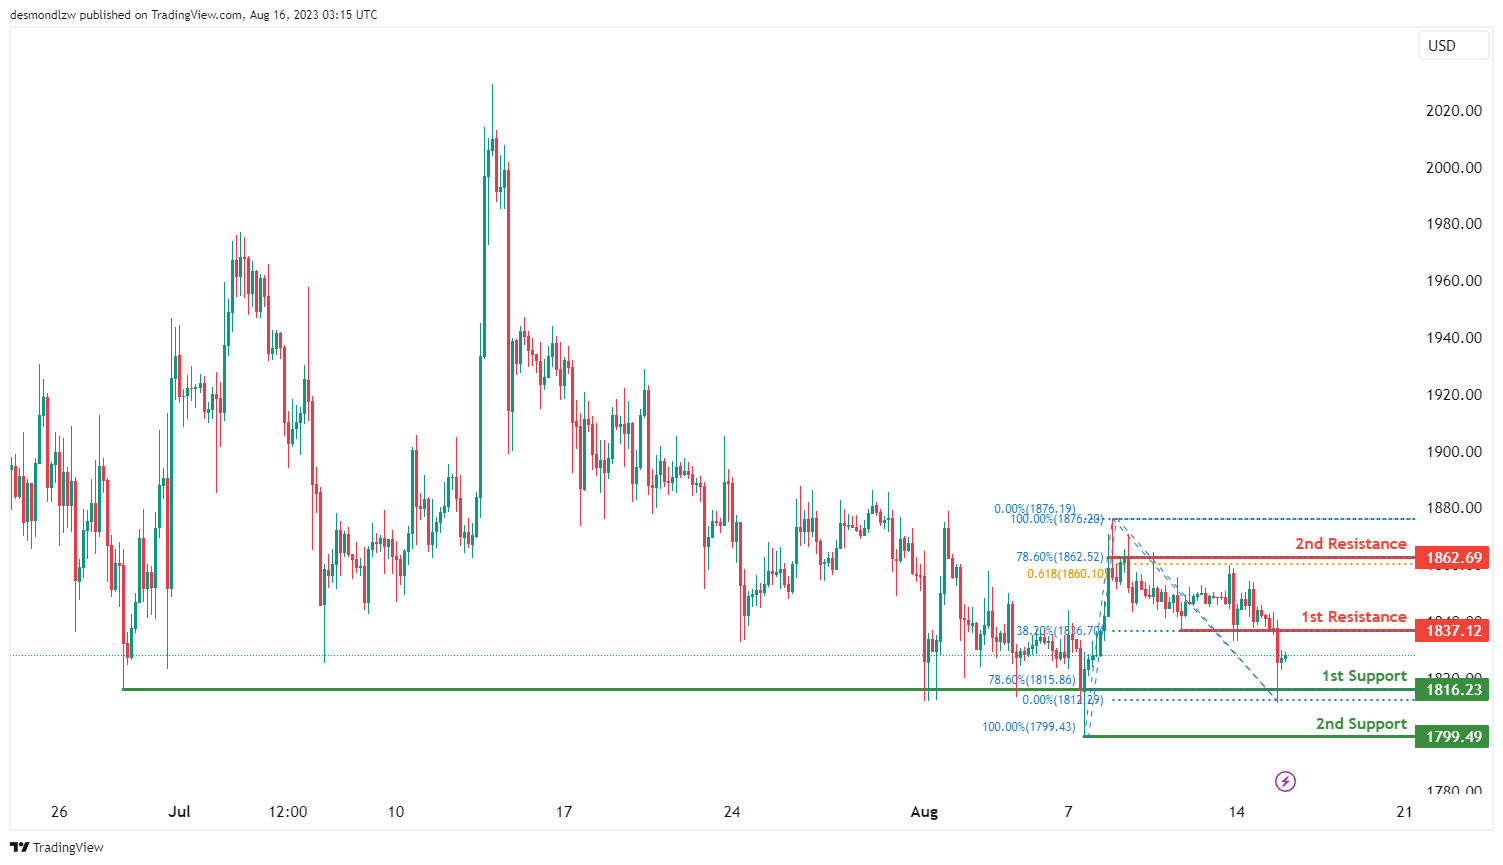
The current chart analysis of ETH/USD suggests a bearish momentum, indicating a potential continuation of the downward trend. The price may see a short-term rise towards the 1st resistance level at 1837.12 before reversing and heading towards the 1st support level at 1816.23. The 1st support is significant as it is a level of overlap and coincides with the 78.60% Fibonacci retracement. The 2nd support at 1799.49 is also important as a swing low support.
On the other hand, the 1st resistance at 1837.12 is significant due to its role as a pullback resistance. Additionally, the 2nd resistance at 1862.69 holds importance as it is a multi-swing high resistance and also coincides with the 78.60% Fibonacci retracement and 61.80% Fibonacci projection, indicating a potential area of resistance.
WTI/USD:
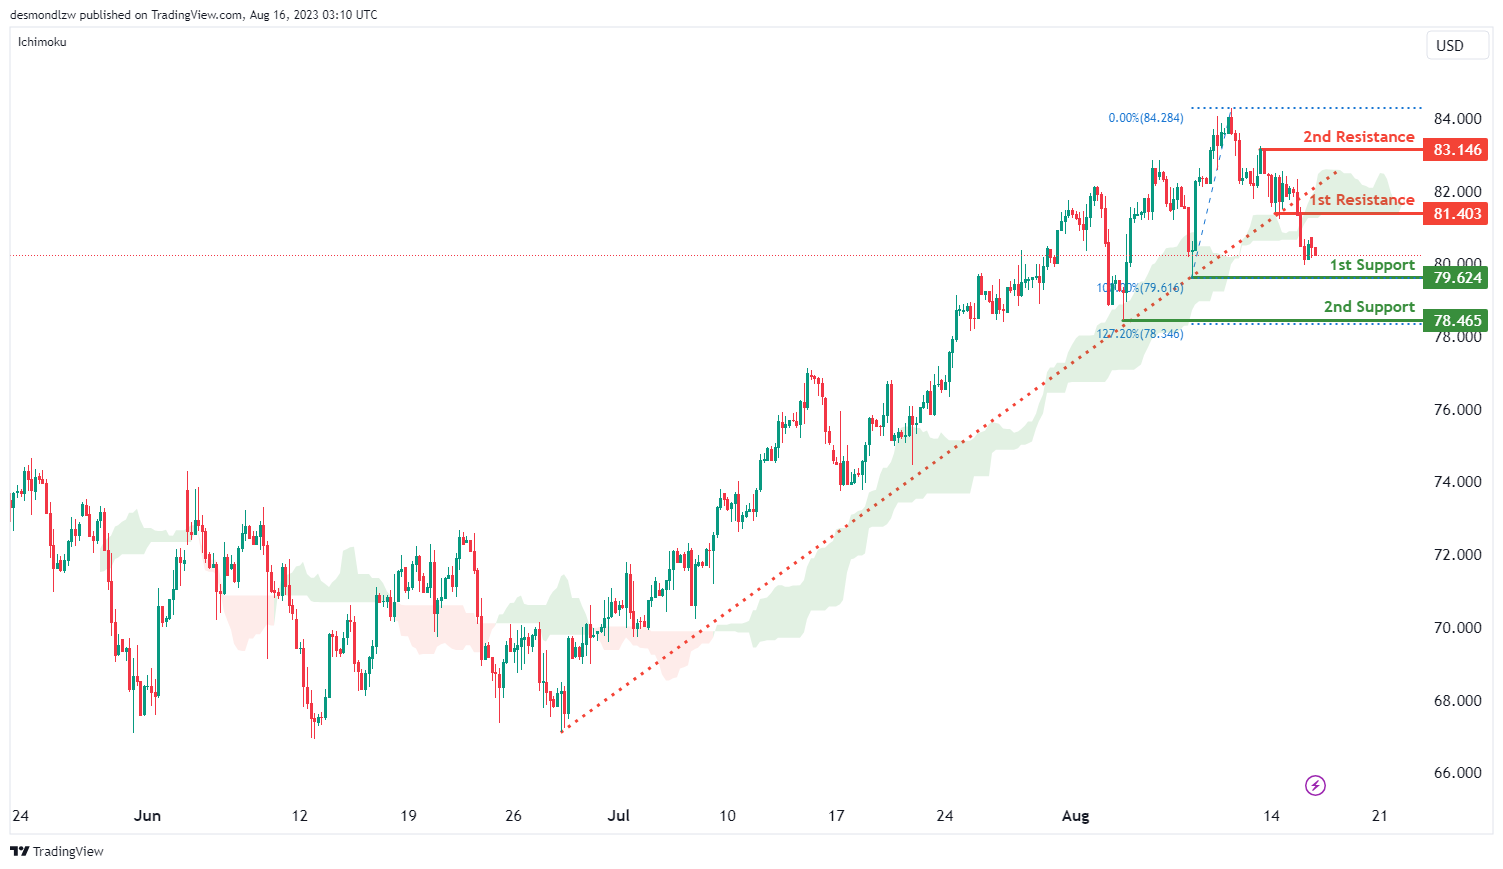
The current momentum of the WTI/USD chart is bearish, supported by the fact that the price has broken below an ascending support line as well as crossing below the Ichimoku cloud. This suggests the potential for a continued downward movement.
There is a possibility for the price to continue its bearish momentum towards the 1st support level at 79.62. The 2nd support at 78.465 is swing-low that aligns with the 127.20% Fibonacci extension level, adding to its significance.
To the upside, the 1st resistance level at 81.40 acts as a pullback resistance. Additionally, the 2nd resistance at 83.15 also functions as a pullback resistance should price reach this level.
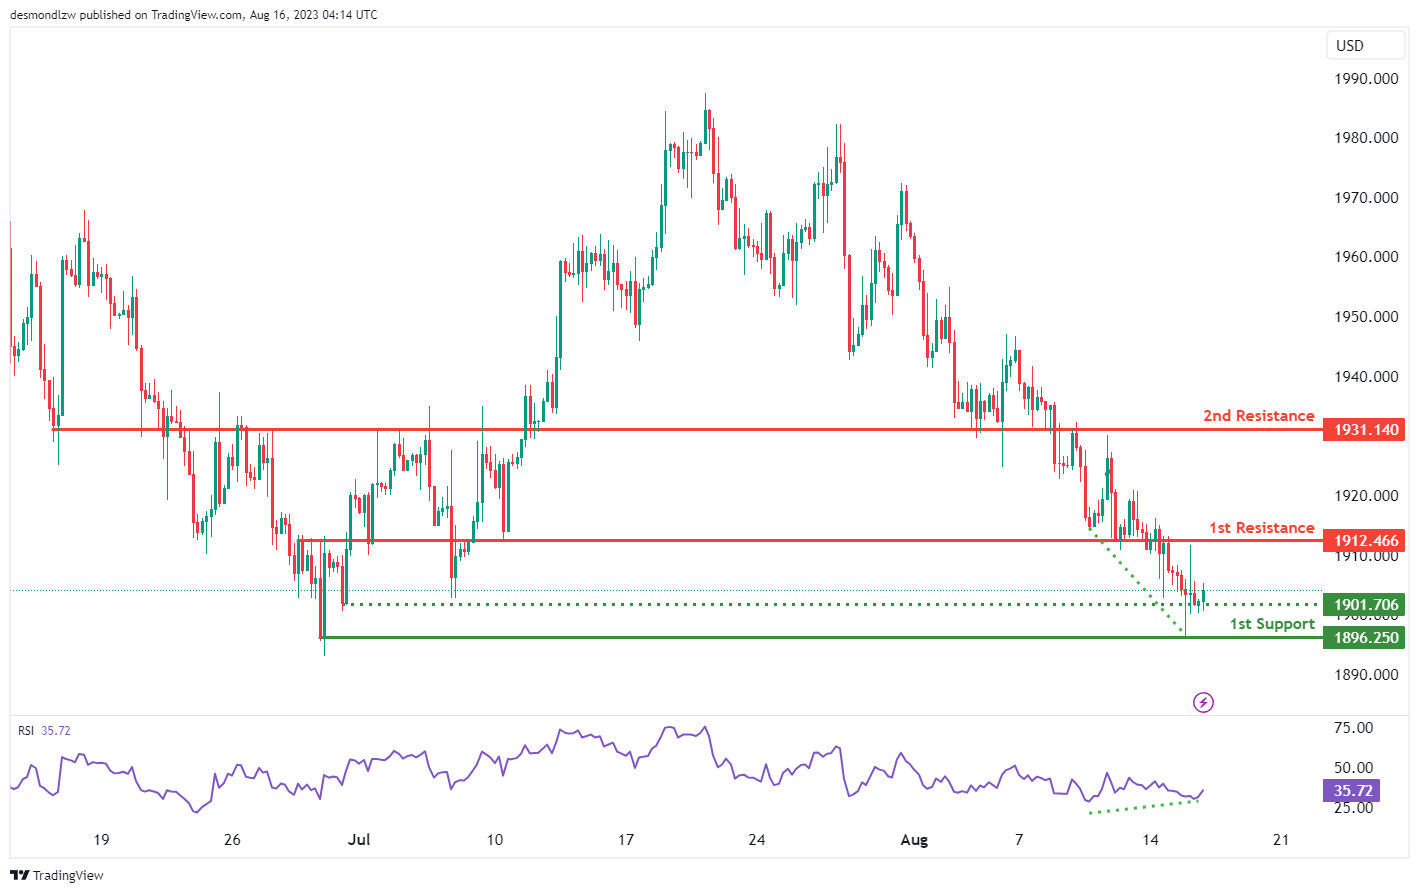
XAU/USD (GOLD):
The XAU/USD chart currently exhibits a bullish momentum, indicating a prevailing upward trend.
Within this bullish context, a potential scenario involves a bullish bounce off the 1st support level at 1896.25, which is considered a pullback support. This bounce could lead the price towards the 1st resistance level at 1912.46, characterized as an overlap resistance.
Providing additional support, the intermediate support at 1901.70 is identified as a multi-swing low support, potentially reinforcing the overall support structure.
On the resistance side, the 2nd resistance at 1931.14 is also an overlap resistance, adding to its significance as a potential barrier to upward movement.
It’s noteworthy that the Relative Strength Index (RSI) is currently situated on a major support level, suggesting the possibility of an upcoming bounce in the price.
NZ First Impression RBNZ August 2023 Policy Decision
RBNZ on hold in August, OCR forecast revised higher.
First Impressions RBNZ August 2023 Monetary Policy Statement
- OCR remains at 5.5% as expected.
- Near term growth outlook revised up, and OCR profile revised higher to 5.6% (March-June 2024)
- Around 40% chance of a further rate hike to 5.75%.
- Assumed neutral OCR revised up 25 basis points to 2.25%, lifting the OCR profile.
- CPI inflation gets back inside the range September 2024.
- Medium term CPI profile unchanged although with higher interest rates.
- Westpac retains its call for a 25-basis point increase in the OCR in November.
Steady as she …. oh wait!
The RBNZ left the OCR unchanged as widely expected at 5.5%. The overall tone of the statement is broadly unchanged although a touch more hawkish for the immediate period given the OCR track has been revised slightly higher (the updated OCR track now shows around a 40% chance of one further rate hike to 5.75% in the first half of 2024. In contrast, the RBNZ’s previous forecasts did rise above 5.50%).
The peak in the OCR has been pushed out to the first half of 2024 and easing is delayed an extra quarter – now in Q4 2024 or Q1 2025 vs Q3 2024 previously.
A reason the RBNZ now sees the risk the OCR will need to rise again is their reassessment of the long-run neutral level of the OCR. The RBNZ’s estimate of the long-run neutral OCR has been revised up 25bps to 2.25%. This means that the RBNZ now believes that the OCR has not been constraining activity to the extent they had thought, and rates therefore need to be higher.
The Bank sees upside risks to growth and inflation in the near-term, with the unemployment rate now forecast to rise more slowly than in May. Looking towards the medium-term, the Bank emphasises downside risks to the growth and inflation outlook from the weaker external outlook, especially as regards China. This is unsurprisingly given recent negative trends in dairy prices. Indeed, following last night’s auction, current dairy prices appear about 10% weaker than the Bank’s assumed cycle low point.
The upside risks centre around the still elevated core inflation measures as shown by the June quarter CPI out-turn. The RBNZ has also revised up their house price projections as we foreshadowed in our Monetary Policy Statement preview. Over 2024 the RBNZ sees house prices rising around 3% compared to the small fall forecast in May. A near term uplift in exports is also lifting activity.
The RBNZ has analysed the inflationary impact of migration and tentatively concluded that the inflationary impacts will be positive but lower than seen historically. More research is underway.
The inflation profile is broadly unchanged over the medium term. The RBNZ still expects the CPI to return to the target range in Q3 2024, though that is now predicated on a slightly higher OCR. The RBNZ has upgraded its near-term profile for non-tradables inflation reflecting the surprise in the June quarter outturn and an expectation of higher non-tradables inflation in the September 2023 quarter.
The RBNZ’s updated policy assessment now more closely matches our own view that there is still more work to be done to ensure inflation returns to the target range sufficiently quickly. The short-term bias in the OCR track implies that the choices for the MPC in future meetings will range between no change and a further OCR increase. Westpac continues to expect a 25-basis point increase in the OCR at the November Monetary Policy Statement.